screen math data with elementary tests -...
TRANSCRIPT

Page 1 of 27
Screen Math data with elementary tests /* readmath.sas Just read the data and do basic transformations */ options linesize=79 noovp formdlim='_'; title 'Gender, Ethnicity and Math performance'; proc format; value ynfmt 0 = 'No' 1 = 'Yes'; value crsfmt 4 = 'No Resp'; value nfmt 1 = 'Asian' 2 = 'Eastern European' 3 = 'European not Eastern' 4 = 'Middle-Eastern and Pakistani' 5 = 'East Indian' 6 = 'Other and DK' ; data math; infile 'exploremath.data'; input id course precalc calc gpa calculus english mark lang $ sex $ nation1 nation2 sample; /* Computed Variables: totscore, passed, grade, hsgpa, hscalc, hsengl, tongue, ethnic */ totscore = precalc+calc; if (50<=mark<=100) then passed=1; else passed=0; /* Some missing final marks were zero, and 998=SDF and 999=WDR */ if mark=0 then grade=.; else if mark > 100 then grade=.; else grade=mark; /* Missing HS marks were zeros */ if 65 le gpa le 100 then hsgpa = gpa; /* Else missing is automatic */ if 0 < calculus < 101 then hscalc = calculus; if 0 < english < 101 then hsengl = english; /* There were just a few French speakers */ if lang='French' then tongue='Other '; else tongue=lang; label tongue = 'Mother Tongue (Eng or Other)'; /* Rater 1 knows Middle Eastern names -- otherwise believe Rater 2 */ if nation1=4 then ethnic=nation1; else ethnic=nation2; label precalc = 'Number precalculus correct' calc = 'Number calculus correct' totscore = 'Total # right on diagnostic test' passed = 'Passed the course' grade = 'Final mark (if any)' hsgpa = 'High School GPA' hscalc = 'HS Calculus' hsengl = 'HS English' lang = 'Mother Tongue' nation1 = 'Nationality of name acc to rater1' nation2 = 'Nationality of name acc to rater2' tongue = 'Mother Tongue (Eng or Other)' ethnic = 'Judged Nationality of name'; format course crsfmt.; format passed ynfmt.; format nation1 nation2 ethnic nfmt.;

Page 2 of 27
/* basicmath.sas */ title2 'Explore math data with elementary tests'; %include 'readmath.sas'; /* It's not the primary question, but are marks better on the precalculus items of the diagnostic test, or the calculus items? There are 9 precalculus and 11 calculus questions; convert to percentages. The data step continues ... */ diff = (100 * precalc/9) - (100 * calc/11); label diff = 'Percentage correct: Precalc minus calc'; /* And a couple more useful variables */ if course=4 then course2=.; else course2=course; /* Eliminate 'No Resp' */ if 0 le grade le 60 then gsplit='60orLess'; else if 60 lt grade le 100 then gsplit='Over60'; /* Got median=60 from proc univariate */ label gsplit = 'Median split on final grade'; proc freq; tables grade*gsplit / norow nocol nopercent missing; proc means n mean std t probt clm; title2 'Are precalculus questions easier?'; var diff; /* Do the following quantitative variables have a significant linear relationship with grade? What percent of the variation does each explain? * High school GPA * High school Calculus mark * High school English mark * Number precalculus correct on diagnostic test * Number calculus correct on diagnostic test * Total number correct on diagnostic test */ proc corr nosimple; title2 'Predict grade from quantitative variables'; var grade hsgpa hscalc hsengl precalc calc totscore; proc corr spearman nosimple; title2 'Should we worry about normality?'; var grade; with hsgpa hscalc hsengl precalc calc totscore; proc plot; title2 'University Calculus Grade by HS GPA'; plot grade * hsgpa; proc reg; title2 'Give an equation for predicting calculus grade from HS GPA'; model grade = hsgpa;

Page 3 of 27
proc glm; title2 'Do average marks differ significantly in the three courses?'; class course2; model grade = course2; means course2; /* Also, what proportion of the variation in grade is explained by course? */ proc glm; title2 'Is there a sex difference in average marks?'; class sex; model grade = sex; means sex; /* Also, what proportion of the variation in grade is explained by sex? */ proc ttest; title2 'Could we conclude NO sex difference?'; class sex; var grade; /* Find confidence interval for difference between means. */ proc glm; title2 'Do average marks depend on mother tongue?'; class tongue; model grade = tongue; means tongue; /* Also, what proportion of the variation in grade is explained by mother tongue? */ proc glm; title2 'Do average marks depend on ethnic background?'; class ethnic; model grade = ethnic; means ethnic; means ethnic / tukey bon scheffe; /* Also, what proportion of the variation in grade is explained by ethnic background? */ proc freq; title2 'A few Chisquare tests to predict passed'; tables (course2 sex ethnic tongue) * passed / nocol nopercent chisq; proc freq; title2 'Median tests'; tables (course2 sex ethnic tongue) * gsplit / nocol nopercent chisq;

Page 4 of 27
Skipping the huge table of grade by gsplit ... _______________________________________________________________________________ Gender, Ethnicity and Math performance 5 Are precalculus questions easier? The MEANS Procedure Analysis Variable : diff Percentage correct: Precalc minus calc Lower 95% Upper 95% N Mean Std Dev t Value Pr > |t| CL for Mean CL for Mean ------------------------------------------------------------------------------ 480 18.7415825 21.2553367 19.32 <.0001 16.8352695 20.6478955 ------------------------------------------------------------------------------ _______________________________________________________________________________ Gender, Ethnicity and Math performance 6 Predict grade from quantitative variables The CORR Procedure 7 Variables: grade hsgpa hscalc hsengl precalc calc totscore Pearson Correlation Coefficients Prob > |r| under H0: Rho=0 Number of Observations grade hsgpa hscalc hsengl grade 1.00000 0.58129 0.53272 0.16441 Final mark <.0001 <.0001 0.0022 393 337 332 345 hsgpa 0.58129 1.00000 0.62249 0.54327 High School GPA <.0001 <.0001 <.0001 337 466 437 464 hscalc 0.53272 0.62249 1.00000 0.08498 HS Calculus <.0001 <.0001 0.0749 332 437 448 440 hsengl 0.16441 0.54327 0.08498 1.00000 HS English 0.0022 <.0001 0.0749 345 464 440 480 Pearson Correlation Coefficients Prob > |r| under H0: Rho=0 Number of Observations precalc calc totscore grade 0.37834 0.36247 0.42847 Final mark <.0001 <.0001 <.0001 346 346 346

Page 5 of 27
hsgpa 0.33965 0.33876 0.39002 High School GPA <.0001 <.0001 <.0001 396 396 396 hscalc 0.36684 0.43774 0.47262 HS Calculus <.0001 <.0001 <.0001 384 384 384 hsengl 0.06543 0.04272 0.05995 HS English 0.1893 0.3917 0.2293 404 404 404 _______________________________________________________________________________ Gender, Ethnicity and Math performance 7 Predict grade from quantitative variables The CORR Procedure Pearson Correlation Coefficients Prob > |r| under H0: Rho=0 Number of Observations grade hsgpa hscalc hsengl precalc 0.37834 0.33965 0.36684 0.06543 Number precalculus correct <.0001 <.0001 <.0001 0.1893 346 396 384 404 calc 0.36247 0.33876 0.43774 0.04272 Number calculus correct <.0001 <.0001 <.0001 0.3917 346 396 384 404 totscore 0.42847 0.39002 0.47262 0.05995 Total # right on diagnostic test <.0001 <.0001 <.0001 0.2293 346 396 384 404 Pearson Correlation Coefficients Prob > |r| under H0: Rho=0 Number of Observations precalc calc totscore precalc 1.00000 0.50135 0.81309 Number precalculus correct <.0001 <.0001 480 480 480 calc 0.50135 1.00000 0.91133 Number calculus correct <.0001 <.0001 480 480 480 totscore 0.81309 0.91133 1.00000 Total # right on diagnostic test <.0001 <.0001 480 480 480 _______________________________________________________________________________

Page 6 of 27
Gender, Ethnicity and Math performance 8 Should we worry about normality? The CORR Procedure 6 With Variables: hsgpa hscalc hsengl precalc calc totscore 1 Variables: grade Spearman Correlation Coefficients Prob > |r| under H0: Rho=0 Number of Observations grade hsgpa 0.55825 High School GPA <.0001 337 hscalc 0.58847 HS Calculus <.0001 332 hsengl 0.17970 HS English 0.0008 345 precalc 0.35195 Number precalculus correct <.0001 346 calc 0.34462 Number calculus correct <.0001 346 totscore 0.39039 Total # right on diagnostic test <.0001 346

Page 7 of 27
_______________________________________________________________________________ Gender, Ethnicity and Math performance 9 University Calculus Grade by HS GPA Plot of grade*hsgpa. Legend: A = 1 obs, B = 2 obs, etc. | | 100 + A | A A | A A A A B A A | A A AA A A | A A A A | AA AB A B | ABA B A A A 80 + A A AA A A A A A A | A BA AAB B AAA BA A A | A A AAA AA AA A A AA A | AA A B B A BAA B AAA CA AA A | A A A A F | AAAA AAA AAA A A B A B A A A i | A BA A AACA BA A A A AA n 60 + ACAAB BCA EA BAE BA A A a | A A A A BACBD BC ACA l | AA AA BB AAA BBA B A A B A | A AAABBBCBABBBB BD ABB A m | a | A C B AA A B A A A r | A A AAA A k 40 + A A A AA C A A | A A A AA | A A AA A A | A A A BA A A A | A A A | A A A A | A 20 + A A A | A A A A | A A A | A | | | A A 0 + A | -+---------+---------+---------+---------+---------+---------+---------+- 65 70 75 80 85 90 95 100 High School GPA NOTE: 242 obs had missing values.

Page 8 of 27
_______________________________________________________________________________ Gender, Ethnicity and Math performance 10 Give an equation for predicting calculus grade from HS GPA The REG Procedure Model: MODEL1 Dependent Variable: grade Final mark Number of Observations Read 579 Number of Observations Used 337 Number of Observations with Missing Values 242 Analysis of Variance Sum of Mean Source DF Squares Square F Value Pr > F Model 1 39116 39116 170.97 <.0001 Error 335 76644 228.78925 Corrected Total 336 115760 Root MSE 15.12578 R-Square 0.3379 Dependent Mean 59.28190 Adj R-Sq 0.3359 Coeff Var 25.51501 Parameter Estimates Parameter Standard Variable Label DF Estimate Error t Value Pr > |t| Intercept Intercept 1 -84.85069 11.05385 -7.68 <.0001 hsgpa High School GPA 1 1.78889 0.13681 13.08 <.0001

Page 9 of 27
_______________________________________________________________________________ Gender, Ethnicity and Math performance 11 Do average marks differ significantly in the three courses? The GLM Procedure Class Level Information Class Levels Values course2 3 1 2 3 Number of Observations Read 579 Number of Observations Used 346 _______________________________________________________________________________ Gender, Ethnicity and Math performance 12 Do average marks differ significantly in the three courses? The GLM Procedure Dependent Variable: grade Final mark Sum of Source DF Squares Mean Square F Value Pr > F Model 2 612.6624 306.3312 0.84 0.4317 Error 343 124775.1873 363.7761 Corrected Total 345 125387.8497 R-Square Coeff Var Root MSE grade Mean 0.004886 32.03198 19.07291 59.54335 Source DF Type I SS Mean Square F Value Pr > F course2 2 612.6623710 306.3311855 0.84 0.4317 Source DF Type III SS Mean Square F Value Pr > F course2 2 612.6623710 306.3311855 0.84 0.4317

Page 10 of 27
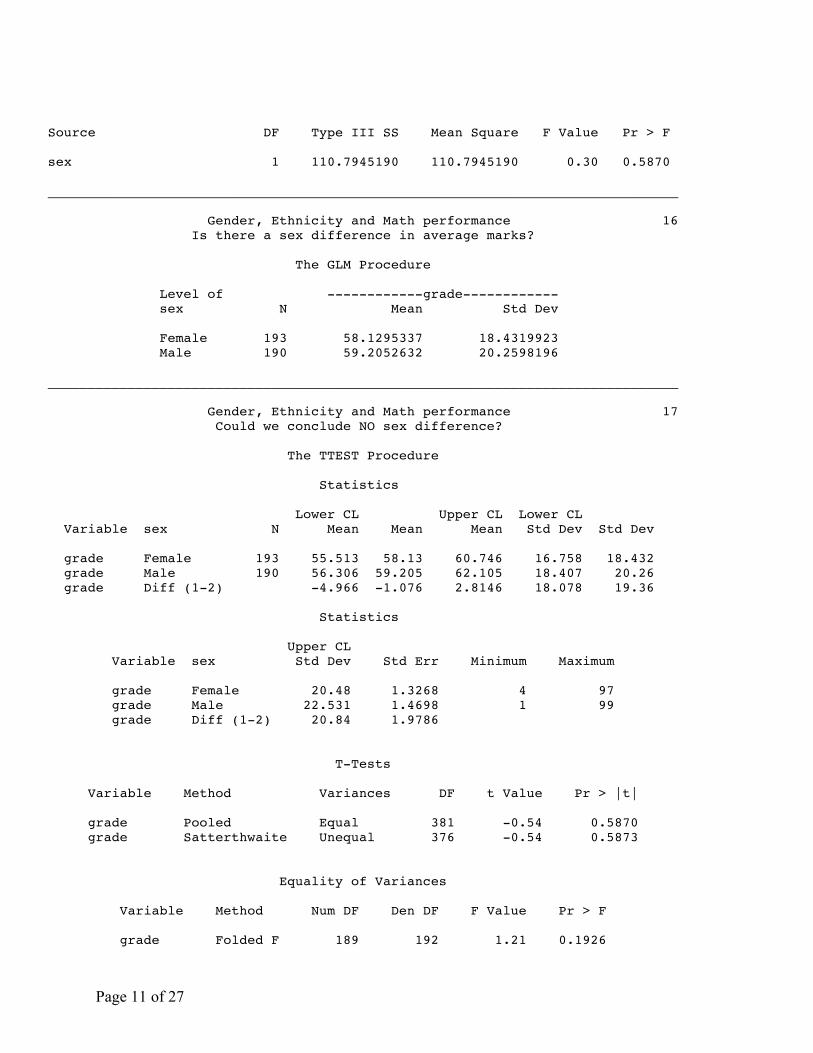
_______________________________________________________________________________ Gender, Ethnicity and Math performance 13 Do average marks differ significantly in the three courses? The GLM Procedure Level of ------------grade------------ course2 N Mean Std Dev 1 24 54.7500000 21.8955028 2 285 59.8105263 18.5206174 3 37 60.5945946 21.3000515 _______________________________________________________________________________ Gender, Ethnicity and Math performance 14 Is there a sex difference in average marks? The GLM Procedure Class Level Information Class Levels Values sex 2 Female Male Number of Observations Read 579 Number of Observations Used 383 _______________________________________________________________________________ Gender, Ethnicity and Math performance 15 Is there a sex difference in average marks? The GLM Procedure Dependent Variable: grade Final mark Sum of Source DF Squares Mean Square F Value Pr > F Model 1 110.7945 110.7945 0.30 0.5870 Error 381 142806.7564 374.8209 Corrected Total 382 142917.5509 R-Square Coeff Var Root MSE grade Mean 0.000775 33.00246 19.36029 58.66319 Source DF Type I SS Mean Square F Value Pr > F sex 1 110.7945190 110.7945190 0.30 0.5870
Page 11 of 27
Source DF Type III SS Mean Square F Value Pr > F sex 1 110.7945190 110.7945190 0.30 0.5870 _______________________________________________________________________________ Gender, Ethnicity and Math performance 16 Is there a sex difference in average marks? The GLM Procedure Level of ------------grade------------ sex N Mean Std Dev Female 193 58.1295337 18.4319923 Male 190 59.2052632 20.2598196 _______________________________________________________________________________ Gender, Ethnicity and Math performance 17 Could we conclude NO sex difference? The TTEST Procedure Statistics Lower CL Upper CL Lower CL Variable sex N Mean Mean Mean Std Dev Std Dev grade Female 193 55.513 58.13 60.746 16.758 18.432 grade Male 190 56.306 59.205 62.105 18.407 20.26 grade Diff (1-2) -4.966 -1.076 2.8146 18.078 19.36 Statistics Upper CL Variable sex Std Dev Std Err Minimum Maximum grade Female 20.48 1.3268 4 97 grade Male 22.531 1.4698 1 99 grade Diff (1-2) 20.84 1.9786 T-Tests Variable Method Variances DF t Value Pr > |t| grade Pooled Equal 381 -0.54 0.5870 grade Satterthwaite Unequal 376 -0.54 0.5873 Equality of Variances Variable Method Num DF Den DF F Value Pr > F grade Folded F 189 192 1.21 0.1926

Page 12 of 27
_______________________________________________________________________________ Gender, Ethnicity and Math performance 18 Do average marks depend on mother tongue? The GLM Procedure Class Level Information Class Levels Values tongue 2 English Other Number of Observations Read 579 Number of Observations Used 383 _______________________________________________________________________________ Gender, Ethnicity and Math performance 19 Do average marks depend on mother tongue? The GLM Procedure Dependent Variable: grade Final mark Sum of Source DF Squares Mean Square F Value Pr > F Model 1 2064.4317 2064.4317 5.58 0.0186 Error 381 140853.1192 369.6932 Corrected Total 382 142917.5509 R-Square Coeff Var Root MSE grade Mean 0.014445 32.77594 19.22741 58.66319 Source DF Type I SS Mean Square F Value Pr > F tongue 1 2064.431684 2064.431684 5.58 0.0186 Source DF Type III SS Mean Square F Value Pr > F tongue 1 2064.431684 2064.431684 5.58 0.0186

Page 13 of 27
_______________________________________________________________________________ Gender, Ethnicity and Math performance 20 Do average marks depend on mother tongue? The GLM Procedure Level of ------------grade------------ tongue N Mean Std Dev English 289 57.3391003 19.2338287 Other 94 62.7340426 19.2075117 _______________________________________________________________________________ Gender, Ethnicity and Math performance 21 Do average marks depend on ethnic background? The GLM Procedure Class Level Information Class Levels Values ethnic 6 Asian East Indian Eastern European European not Eastern Middle-Eastern and Pakistani Other and DK Number of Observations Read 579 Number of Observations Used 393 _______________________________________________________________________________ Gender, Ethnicity and Math performance 22 Do average marks depend on ethnic background? The GLM Procedure Dependent Variable: grade Final mark Sum of Source DF Squares Mean Square F Value Pr > F Model 5 3640.9573 728.1915 2.00 0.0772 Error 387 140613.0478 363.3412 Corrected Total 392 144254.0051 R-Square Coeff Var Root MSE grade Mean 0.025240 32.45180 19.06151 58.73791

Page 14 of 27
Source DF Type I SS Mean Square F Value Pr > F ethnic 5 3640.957278 728.191456 2.00 0.0772 Source DF Type III SS Mean Square F Value Pr > F ethnic 5 3640.957278 728.191456 2.00 0.0772 _______________________________________________________________________________ Gender, Ethnicity and Math performance 23 Do average marks depend on ethnic background? The GLM Procedure Level of ------------grade------------ ethnic N Mean Std Dev Asian 87 60.0574713 20.9314253 East Indian 53 65.1886792 18.5317364 Eastern European 46 55.7608696 20.2771736 European not Eastern 142 56.2816901 17.8581353 Middle-Eastern and Pakistani 50 59.3600000 19.9691190 Other and DK 15 58.6000000 12.1526011 _______________________________________________________________________________ Gender, Ethnicity and Math performance 24 Do average marks depend on ethnic background? The GLM Procedure Tukey's Studentized Range (HSD) Test for grade NOTE: This test controls the Type I experimentwise error rate. Alpha 0.05 Error Degrees of Freedom 387 Error Mean Square 363.3412 Critical Value of Studentized Range 4.05040

Page 15 of 27
Comparisons significant at the 0.05 level are indicated by ***. Difference ethnic Between Comparison Means East Indian - Asian 5.131 East Indian - Middle-Eastern and Pakistani 5.829 East Indian - Other and DK 6.589 East Indian - European not Eastern 8.907 East Indian - Eastern European 9.428 Asian - East Indian -5.131 Asian - Middle-Eastern and Pakistani 0.697 Asian - Other and DK 1.457 Asian - European not Eastern 3.776 Asian - Eastern European 4.297 Middle-Eastern and Pakistani - East Indian -5.829 Middle-Eastern and Pakistani - Asian -0.697 Middle-Eastern and Pakistani - Other and DK 0.760 Middle-Eastern and Pakistani - European not Eastern 3.078 Middle-Eastern and Pakistani - Eastern European 3.599 Other and DK - East Indian -6.589 Other and DK - Asian -1.457 Other and DK - Middle-Eastern and Pakistani -0.760 Other and DK - European not Eastern 2.318 Other and DK - Eastern European 2.839 European not Eastern - East Indian -8.907 European not Eastern - Asian -3.776 European not Eastern - Middle-Eastern and Pakistani -3.078 European not Eastern - Other and DK -2.318 European not Eastern - Eastern European 0.521 Eastern European - East Indian -9.428 Eastern European - Asian -4.297 Eastern European - Middle-Eastern and Pakistani -3.599 Eastern European - Other and DK -2.839 Eastern European - European not Eastern -0.521

Page 16 of 27
_______________________________________________________________________________ Gender, Ethnicity and Math performance 25 Do average marks depend on ethnic background? The GLM Procedure Tukey's Studentized Range (HSD) Test for grade Comparisons significant at the 0.05 level are indicated by ***. ethnic Comparison Simultaneous 95% Confidence Limits East Indian - Asian -4.382 14.644 East Indian - Middle-Eastern and Pakistani -4.934 16.592 East Indian - Other and DK -9.378 22.555 East Indian - European not Eastern 0.119 17.695 East Indian - Eastern European -1.573 20.429 Asian - East Indian -14.644 4.382 Asian - Middle-Eastern and Pakistani -8.991 10.386 Asian - Other and DK -13.805 16.720 Asian - European not Eastern -3.657 11.209 Asian - Eastern European -5.656 14.249 Middle-Eastern and Pakistani - East Indian -16.592 4.934 Middle-Eastern and Pakistani - Asian -10.386 8.991 Middle-Eastern and Pakistani - Other and DK -15.312 16.832 Middle-Eastern and Pakistani - European not Eastern -5.899 12.056 Middle-Eastern and Pakistani - Eastern European -7.554 14.753 Other and DK - East Indian -22.555 9.378 Other and DK - Asian -16.720 13.805 Other and DK - Middle-Eastern and Pakistani -16.832 15.312 Other and DK - European not Eastern -12.503 17.140 Other and DK - Eastern European -13.393 19.071 European not Eastern - East Indian -17.695 -0.119 European not Eastern - Asian -11.209 3.657 European not Eastern - Middle-Eastern and Pakistani -12.056 5.899 European not Eastern - Other and DK -17.140 12.503 European not Eastern - Eastern European -8.741 9.783 Eastern European - East Indian -20.429 1.573 Eastern European - Asian -14.249 5.656 Eastern European - Middle-Eastern and Pakistani -14.753 7.554 Eastern European - Other and DK -19.071 13.393 Eastern European - European not Eastern -9.783 8.741

Page 17 of 27
Comparisons significant at the 0.05 level are indicated by ***. ethnic Comparison East Indian - Asian East Indian - Middle-Eastern and Pakistani East Indian - Other and DK East Indian - European not Eastern *** East Indian - Eastern European Asian - East Indian Asian - Middle-Eastern and Pakistani Asian - Other and DK Asian - European not Eastern Asian - Eastern European Middle-Eastern and Pakistani - East Indian Middle-Eastern and Pakistani - Asian Middle-Eastern and Pakistani - Other and DK Middle-Eastern and Pakistani - European not Eastern Middle-Eastern and Pakistani - Eastern European Other and DK - East Indian Other and DK - Asian Other and DK - Middle-Eastern and Pakistani Other and DK - European not Eastern Other and DK - Eastern European European not Eastern - East Indian *** European not Eastern - Asian European not Eastern - Middle-Eastern and Pakistani European not Eastern - Other and DK European not Eastern - Eastern European Eastern European - East Indian Eastern European - Asian Eastern European - Middle-Eastern and Pakistani Eastern European - Other and DK Eastern European - European not Eastern We get exactly the same kind of output for the Bonferroni and Scheffe comparisons. Just display the pages
corresponding to this one, showing which differences are significant by the follow-up tests.

Page 18 of 27
Gender, Ethnicity and Math performance 29 Do average marks depend on ethnic background? The GLM Procedure Bonferroni (Dunn) t Tests for grade Comparisons significant at the 0.05 level are indicated by ***. ethnic Comparison East Indian - Asian East Indian - Middle-Eastern and Pakistani East Indian - Other and DK East Indian - European not Eastern East Indian - Eastern European Asian - East Indian Asian - Middle-Eastern and Pakistani Asian - Other and DK Asian - European not Eastern Asian - Eastern European Middle-Eastern and Pakistani - East Indian Middle-Eastern and Pakistani - Asian Middle-Eastern and Pakistani - Other and DK Middle-Eastern and Pakistani - European not Eastern Middle-Eastern and Pakistani - Eastern European Other and DK - East Indian Other and DK - Asian Other and DK - Middle-Eastern and Pakistani Other and DK - European not Eastern Other and DK - Eastern European European not Eastern - East Indian European not Eastern - Asian European not Eastern - Middle-Eastern and Pakistani European not Eastern - Other and DK European not Eastern - Eastern European Eastern European - East Indian Eastern European - Asian Eastern European - Middle-Eastern and Pakistani Eastern European - Other and DK Eastern European - European not Eastern

Page 19 of 27
_______________________________________________________________________________ Gender, Ethnicity and Math performance 30 Do average marks depend on ethnic background? The GLM Procedure Scheffe's Test for grade NOTE: This test controls the Type I experimentwise error rate, but it generally has a higher Type II error rate than Tukey's for all pairwise comparisons. Alpha 0.05 Error Degrees of Freedom 387 Error Mean Square 363.3412 Critical Value of F 2.23731 Comparisons significant at the 0.05 level are indicated by ***. ethnic Comparison East Indian - Asian East Indian - Middle-Eastern and Pakistani East Indian - Other and DK East Indian - European not Eastern East Indian - Eastern European Asian - East Indian Asian - Middle-Eastern and Pakistani Asian - Other and DK Asian - European not Eastern Asian - Eastern European Middle-Eastern and Pakistani - East Indian Middle-Eastern and Pakistani - Asian Middle-Eastern and Pakistani - Other and DK Middle-Eastern and Pakistani - European not Eastern Middle-Eastern and Pakistani - Eastern European Other and DK - East Indian Other and DK - Asian Other and DK - Middle-Eastern and Pakistani Other and DK - European not Eastern Other and DK - Eastern European European not Eastern - East Indian European not Eastern - Asian European not Eastern - Middle-Eastern and Pakistani European not Eastern - Other and DK European not Eastern - Eastern European Eastern European - East Indian Eastern European - Asian Eastern European - Middle-Eastern and Pakistani Eastern European - Other and DK Eastern European - European not Eastern _______________________________________________________________________________

Page 20 of 27
Gender, Ethnicity and Math performance 33 A few Chisquare tests to predict passed The FREQ Procedure Table of course2 by passed course2 passed(Passed the course) Frequency| Row Pct |No |Yes | Total ---------+--------+--------+ 1 | 44 | 15 | 59 | 74.58 | 25.42 | ---------+--------+--------+ 2 | 149 | 224 | 373 | 39.95 | 60.05 | ---------+--------+--------+ 3 | 8 | 31 | 39 | 20.51 | 79.49 | ---------+--------+--------+ Total 201 270 471 Frequency Missing = 108 Statistics for Table of course2 by passed Statistic DF Value Prob ------------------------------------------------------ Chi-Square 2 33.5096 <.0001 Likelihood Ratio Chi-Square 2 34.4171 <.0001 Mantel-Haenszel Chi-Square 1 31.6717 <.0001 Phi Coefficient 0.2667 Contingency Coefficient 0.2577 Cramer's V 0.2667 Effective Sample Size = 471 Frequency Missing = 108 WARNING: 19% of the data are missing.

Page 21 of 27
Table of sex by passed sex passed(Passed the course) Frequency| Row Pct |No |Yes | Total ---------+--------+--------+ Female | 118 | 148 | 266 | 44.36 | 55.64 | ---------+--------+--------+ Male | 138 | 147 | 285 | 48.42 | 51.58 | ---------+--------+--------+ Total 256 295 551 Frequency Missing = 28 _______________________________________________________________________________ Gender, Ethnicity and Math performance 34 A few Chisquare tests to predict passed The FREQ Procedure Statistics for Table of sex by passed Statistic DF Value Prob ------------------------------------------------------ Chi-Square 1 0.9118 0.3396 Likelihood Ratio Chi-Square 1 0.9122 0.3395 Continuity Adj. Chi-Square 1 0.7559 0.3846 Mantel-Haenszel Chi-Square 1 0.9101 0.3401 Phi Coefficient -0.0407 Contingency Coefficient 0.0406 Cramer's V -0.0407 Fisher's Exact Test ---------------------------------- Cell (1,1) Frequency (F) 118 Left-sided Pr <= F 0.1923 Right-sided Pr >= F 0.8509 Table Probability (P) 0.0432 Two-sided Pr <= P 0.3484 Effective Sample Size = 551 Frequency Missing = 28

Page 22 of 27
Table of ethnic by passed ethnic(Judged Nationality of name) passed(Passed the course) Frequency | Row Pct |No |Yes | Total -----------------+--------+--------+ Asian | 65 | 66 | 131 | 49.62 | 50.38 | -----------------+--------+--------+ Eastern European | 30 | 33 | 63 | 47.62 | 52.38 | -----------------+--------+--------+ European not Eas | 88 | 107 | 195 tern | 45.13 | 54.87 | -----------------+--------+--------+ Middle-Eastern | 33 | 39 | 72 and Pakistani | 45.83 | 54.17 | -----------------+--------+--------+ East Indian | 31 | 47 | 78 | 39.74 | 60.26 | -----------------+--------+--------+ Other and DK | 27 | 13 | 40 | 67.50 | 32.50 | -----------------+--------+--------+ Total 274 305 579 _______________________________________________________________________________ Gender, Ethnicity and Math performance 35 A few Chisquare tests to predict passed The FREQ Procedure Statistics for Table of ethnic by passed Statistic DF Value Prob ------------------------------------------------------ Chi-Square 5 9.0500 0.1071 Likelihood Ratio Chi-Square 5 9.1556 0.1030 Mantel-Haenszel Chi-Square 1 0.0788 0.7789 Phi Coefficient 0.1250 Contingency Coefficient 0.1241 Cramer's V 0.1250 Sample Size = 579

Page 23 of 27
Table of tongue by passed tongue(Mother Tongue (Eng or Other)) passed(Passed the course) Frequency| Row Pct |No |Yes | Total ---------+--------+--------+ English | 187 | 215 | 402 | 46.52 | 53.48 | ---------+--------+--------+ Other | 69 | 80 | 149 | 46.31 | 53.69 | ---------+--------+--------+ Total 256 295 551 Frequency Missing = 28 _______________________________________________________________________________ Gender, Ethnicity and Math performance 36 A few Chisquare tests to predict passed The FREQ Procedure Statistics for Table of tongue by passed Statistic DF Value Prob ------------------------------------------------------ Chi-Square 1 0.0019 0.9652 Likelihood Ratio Chi-Square 1 0.0019 0.9652 Continuity Adj. Chi-Square 1 0.0000 1.0000 Mantel-Haenszel Chi-Square 1 0.0019 0.9652 Phi Coefficient 0.0019 Contingency Coefficient 0.0019 Cramer's V 0.0019 Fisher's Exact Test ---------------------------------- Cell (1,1) Frequency (F) 187 Left-sided Pr <= F 0.5552 Right-sided Pr >= F 0.5214 Table Probability (P) 0.0765 Two-sided Pr <= P 1.0000 Effective Sample Size = 551 Frequency Missing = 28

Page 24 of 27
_______________________________________________________________________________ Gender, Ethnicity and Math performance 37 Median tests The FREQ Procedure Table of course2 by gsplit course2 gsplit(Median split on final grade) Frequency| Row Pct |60orLess|Over60 | Total ---------+--------+--------+ 1 | 15 | 9 | 24 | 62.50 | 37.50 | ---------+--------+--------+ 2 | 145 | 140 | 285 | 50.88 | 49.12 | ---------+--------+--------+ 3 | 17 | 20 | 37 | 45.95 | 54.05 | ---------+--------+--------+ Total 177 169 346 Frequency Missing = 233 Statistics for Table of course2 by gsplit Statistic DF Value Prob ------------------------------------------------------ Chi-Square 2 1.6469 0.4389 Likelihood Ratio Chi-Square 2 1.6623 0.4356 Mantel-Haenszel Chi-Square 1 1.4261 0.2324 Phi Coefficient 0.0690 Contingency Coefficient 0.0688 Cramer's V 0.0690 Effective Sample Size = 346 Frequency Missing = 233 WARNING: 40% of the data are missing.

Page 25 of 27
Table of sex by gsplit sex gsplit(Median split on final grade) Frequency| Row Pct |60orLess|Over60 | Total ---------+--------+--------+ Female | 106 | 87 | 193 | 54.92 | 45.08 | ---------+--------+--------+ Male | 99 | 91 | 190 | 52.11 | 47.89 | ---------+--------+--------+ Total 205 178 383 Frequency Missing = 196 _______________________________________________________________________________ Gender, Ethnicity and Math performance 38 Median tests The FREQ Procedure Statistics for Table of sex by gsplit Statistic DF Value Prob ------------------------------------------------------ Chi-Square 1 0.3054 0.5805 Likelihood Ratio Chi-Square 1 0.3055 0.5805 Continuity Adj. Chi-Square 1 0.2027 0.6526 Mantel-Haenszel Chi-Square 1 0.3046 0.5810 Phi Coefficient 0.0282 Contingency Coefficient 0.0282 Cramer's V 0.0282 Fisher's Exact Test ---------------------------------- Cell (1,1) Frequency (F) 106 Left-sided Pr <= F 0.7438 Right-sided Pr >= F 0.3263 Table Probability (P) 0.0701 Two-sided Pr <= P 0.6092 Effective Sample Size = 383 Frequency Missing = 196 WARNING: 34% of the data are missing.
Page 26 of 27
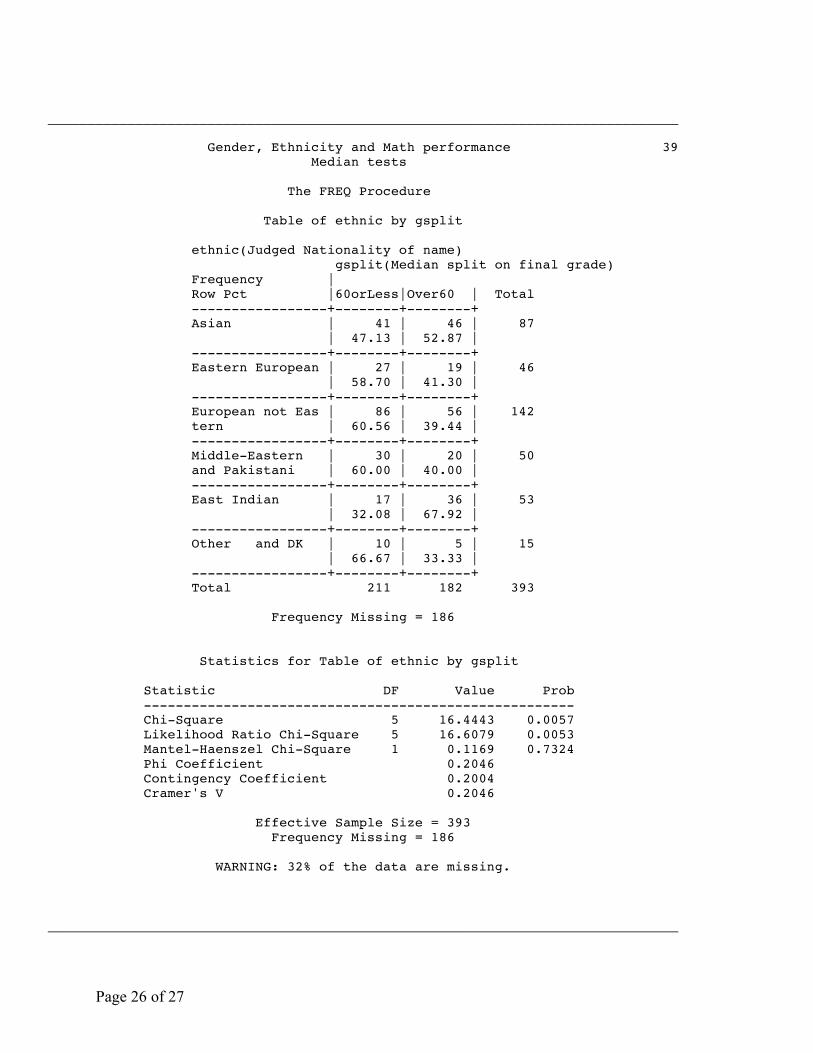
_______________________________________________________________________________ Gender, Ethnicity and Math performance 39 Median tests The FREQ Procedure Table of ethnic by gsplit ethnic(Judged Nationality of name) gsplit(Median split on final grade) Frequency | Row Pct |60orLess|Over60 | Total -----------------+--------+--------+ Asian | 41 | 46 | 87 | 47.13 | 52.87 | -----------------+--------+--------+ Eastern European | 27 | 19 | 46 | 58.70 | 41.30 | -----------------+--------+--------+ European not Eas | 86 | 56 | 142 tern | 60.56 | 39.44 | -----------------+--------+--------+ Middle-Eastern | 30 | 20 | 50 and Pakistani | 60.00 | 40.00 | -----------------+--------+--------+ East Indian | 17 | 36 | 53 | 32.08 | 67.92 | -----------------+--------+--------+ Other and DK | 10 | 5 | 15 | 66.67 | 33.33 | -----------------+--------+--------+ Total 211 182 393 Frequency Missing = 186 Statistics for Table of ethnic by gsplit Statistic DF Value Prob ------------------------------------------------------ Chi-Square 5 16.4443 0.0057 Likelihood Ratio Chi-Square 5 16.6079 0.0053 Mantel-Haenszel Chi-Square 1 0.1169 0.7324 Phi Coefficient 0.2046 Contingency Coefficient 0.2004 Cramer's V 0.2046 Effective Sample Size = 393 Frequency Missing = 186 WARNING: 32% of the data are missing. _______________________________________________________________________________

Page 27 of 27
Gender, Ethnicity and Math performance 40 Median tests The FREQ Procedure Table of tongue by gsplit tongue(Mother Tongue (Eng or Other)) gsplit(Median split on final grade) Frequency| Row Pct |60orLess|Over60 | Total ---------+--------+--------+ English | 165 | 124 | 289 | 57.09 | 42.91 | ---------+--------+--------+ Other | 40 | 54 | 94 | 42.55 | 57.45 | ---------+--------+--------+ Total 205 178 383 Frequency Missing = 196 Statistics for Table of tongue by gsplit Statistic DF Value Prob ------------------------------------------------------ Chi-Square 1 6.0283 0.0141 Likelihood Ratio Chi-Square 1 6.0242 0.0141 Continuity Adj. Chi-Square 1 5.4579 0.0195 Mantel-Haenszel Chi-Square 1 6.0125 0.0142 Phi Coefficient 0.1255 Contingency Coefficient 0.1245 Cramer's V 0.1255 Fisher's Exact Test ---------------------------------- Cell (1,1) Frequency (F) 165 Left-sided Pr <= F 0.9950 Right-sided Pr >= F 0.0098 Table Probability (P) 0.0047 Two-sided Pr <= P 0.0171 Effective Sample Size = 383 Frequency Missing = 196 WARNING: 34% of the data are missing.