scoping study on a cost benefit analysis of bushfire...
TRANSCRIPT

Scoping Study on a Cost Benefit Analysis of Bushfire Mitigation Australian Forest Products Association
May 2014

Scoping Study on a Cost Benefit Analysis of Bushfire Mitigation
Liability limited by a scheme approved under Professional Standards Legislation. Deloitte refers to one or more of Deloitte Touche Tohmatsu Limited, a UK private company limited by guarantee, and its network of member firms, each of which is a legally separate and independent entity. Please see www.deloitte.com/au/about for a detailed description of the legal structure of Deloitte Touche Tohmatsu Limited and its member firms. © 2014 Deloitte Access Economics Pty Ltd
Contents Glossary ..................................................................................................................................... i
Executive Summary ................................................................................................................... 1
1 Introduction .................................................................................................................... 5
1.1 Background ....................................................................................................................... 5
1.2 Purpose of the Scoping Study ............................................................................................ 6
1.3 Structure of this paper ...................................................................................................... 7
2 Bushfire risks in Australia ................................................................................................ 8
2.1 The cost of recent bushfires .............................................................................................. 9
2.2 Total bushfire costs ......................................................................................................... 10
3 The North American experience .................................................................................... 13
3.1 The 2002 and 2003 wildfire seasons ................................................................................ 13
3.2 Policy response ............................................................................................................... 15
4 Two approaches to mitigation ....................................................................................... 18
4.1 Baseline approach ........................................................................................................... 18
4.2 Alternative policy approach............................................................................................. 19
5 CBA Methodology ......................................................................................................... 20
5.1 Overview of CBA ............................................................................................................. 20
5.2 Defining costs ................................................................................................................. 21
5.3 Estimating baseline costs ................................................................................................ 22
5.4 Estimating policy costs .................................................................................................... 26
5.5 Compare costs ................................................................................................................ 29
5.6 Approach to valuing particular costs ................................................................................ 30
6 Potential case study regions .......................................................................................... 34
6.1 Blue Mountains ............................................................................................................... 34
6.1 The Pilliga ....................................................................................................................... 36
6.2 North Coast .................................................................................................................... 36
6.3 Melbourne fringe ............................................................................................................ 37
6.4 Gippsland........................................................................................................................ 38
6.5 South-west Western Australia ......................................................................................... 39
6.1 Other potential case study sites ...................................................................................... 40
7 Applying the methodology ............................................................................................ 42
8 Next steps ..................................................................................................................... 46
References .............................................................................................................................. 47
Appendix A : National forecasting methodology ...................................................................... 52
Appendix B : Non Market Valuations ....................................................................................... 53
Scoping Study on a Cost Benefit Analysis of Bushfire Mitigation
Deloitte Access Economics Commercial-in-confidence ii
Limitation of our work ............................................................................................................ 59
Charts Chart 2.1 : Forecast total economic costs of bushfires ($2011) ................................................ 12
Chart 4.1 : Prescribed burn area by state ................................................................................ 19
Chart 5.1 : Relationship between distance to bushfire and building destruction ...................... 23
Chart 5.2 : Relationship between planned and unplanned fires from Boer et al (2009) ............ 26
Chart 5.3 : Relationship between planned and unplanned fires from Attiwil and Adams (2013)27
Tables Table 2.1 : Forecast total economic costs of bushfires ($2011, million) .................................... 12
Table 5.1 : Economic costs of a natural disaster ...................................................................... 21
Table 5.2 : Relationship between distance and PM10 level ...................................................... 32
Table 5.3 : Prevalence of selected health conditions ............................................................... 32
Table 5.4 : Estimated annual health costs from 10ug/m3 of PM10 in Sydney............................. 33
Table 6.1 : Summary of proposed case study areas ................................................................. 34
Table 7.1 : Estimating baseline costs ....................................................................................... 43
Table 7.2 : Total policy cost ..................................................................................................... 44
Table 7.3 : Net Benefits ........................................................................................................... 44
Table 7.4 : Cost benefit ratio ................................................................................................... 44
Table B.1 : Estimates for Social Cost of Carbon ........................................................................ 53
Table B.2 : Annual health costs of air pollution across selected regions, per tonne of PM10 - with 7.5 µg/m3 threshold ($ 2003)........................................................................................ 55
Table B.3 : Annual health costs of air pollution across selected regions, per tonne of PM10 – no threshold ($ 2003) ........................................................................................................... 55
Table B.4 : Annual health costs of air pollution across selected regions, per 10 µg/m3 increase in PM10 annual average concentrations – with 7.5 µg/m3 threshold ($m 2003) ...................... 55

Scoping Study on a Cost Benefit Analysis of Bushfire Mitigation
Deloitte Access Economics Commercial-in-confidence iii
Figures Figure 2.1 : Insured costs of recent major bushfires in Australia ................................................ 9
Figure 5.1 : Overall CBA process .............................................................................................. 20
Figure 5.2 : Using GIS to measure the number of houses within a given distance of bushland . 24
Figure 5.3 : Comparing costs in a CBA ...................................................................................... 29
Errata
Deloitte Access Economics would like to acknowledge an error contained in the final report sent to AFPA dated February 2014. The error is contained in Chapter 7 and is in relation to the calculation of net benefits. This version of the report acknowledges and updates these figures accordingly.
In Chapter 7 of the previous report (pg. 44), the calculated incremental benefit was $31,505,166 with a corresponding CBR of 4.9. The correct figures should be $40,591,770, with the corresponding CBR as 6.0. The revised benefits and costs figures ($40,591,770-$6,808,443) are now consistent with the reported net benefit figure of $33,783,328.
The discrepancy is due to the erroneous treatment of the output generated from mechanical treatment. Previously, this was treated as a cost rather than a benefit in the calculation of the cost benefit ratio.

Scoping Study on a Cost Benefit Analysis of Bushfire Mitigation
Deloitte Access Economics Commercial-in-confidence
Glossary
ABS Australian Bureau of Statistics
ACT Australian Capital Territory
AFPA Australian Forest Products Association
BTE Bureau of Transport Economics
CBA Cost Benefit Analysis
CFA Country Fire Authority
CFLRP Collaborative Forest Landscape Restoration Programme
CRC Cooperative Research Centre
CSIRO Commonwealth Scientific and Industrial Research Organisation
DAE Deloitte Access Economics
DCCEE Department of Climate Change and Energy Efficiency
DEPI Department of Environment and Primary Industries
DPAW Department of Parks and Wildlife
EMA Emergency Management Australia
FFDI Forest Fire Danger Index
GIS Geospatial Information System
HFI Healthy Forests Initiative
ICA Insurance Council of Australia
IPCC Intergovernmental Panel on Climate Change
NSW New South Wales
OBPR Office of Best Practice Regulation
PM Particulate Matter
SA South Australia
US United States
USA United States of America
USD US Dollars
USDA United States Department of Agriculture
VSL Value of Statistical Life
WA Western Australia
Scoping Study on a Cost Benefit Analysis of Bushfire Mitigation
1
Executive Summary Bushfire and fuel reduction policies
The 2013 NSW bushfires, and more recently the Western Australian and Victorian bushfires in early 2014, highlighted the potential for widespread burning of significant forest areas. These fires, which can be of varying scale and intensity, can cause significant economic and environmental costs, including changes in vegetation structure, soil erosion and loss of local fauna and flora.
The current policy approach is to focus on suppression activities during the bushfire season and fuel reduction burning in the cooler months of the year. Fuel reduction burning is often conducted at relatively low levels and has risks as well as environmental and social costs associated with it.
In contrast to the Australian situation, policy in both the United States and Canada has recently shifted towards an increase in fuel reduction activities through the use of both fuel reduction burning and the mechanical removal of fuel. Importantly, the recent shift in policy responses, and the associated data and research, provides a basis for understanding how policies pioneered in North America may be applied in an Australian context.
Despite the ever present risk of bushfire in Australia, there is a paucity of research and data analysis around the relative costs and benefits of alternative approaches to bushfire management in Australia.
Purpose of this study
As a result, the aim of this report is to begin the process of establishing a robust set of information to inform the debate on the most appropriate bushfire management policy in Australia. The scoping study provides the background for undertaking a full Cost-Benefit Analysis (CBA) of a policy of greater use of fuel burning in combination with the mechanical removal of trees and understorey biomass.
The current work is being undertaken in the context of increasing attempts to quantify the relative costs and benefits of different policy initiatives prior to a natural disaster taking place. Most notably, in 2013 Deloitte Access Economics undertook research for the Australian Business Roundtable for Disaster Resilience and Safer Communities that surveyed the costs and benefits of a range of approaches to building resilience to natural disasters.

Deloitte Access Economics Commercial-in-confidence 2
Research findings
As part of the scoping study we have undertaken a range of research that would inform a full CBA. For example, we have:
Identified that the base case would involve continued use of fuel reduction burning at current activity levels and that the policy case would involve an increase in treatment up to around 5% of the landscape a year. Treatment would also involve a mix of fuel reduction burning and mechanical removal.
Outlined the range of costs associated with bushfires and identified sources for valuing those costs. It does not appear that there are any costs without a reasonable source of information available. In general the costs related to a bushfire can be categorised as follows:
Table i: Economic costs of a natural disaster
Direct Indirect
Tangible Damage to buildings Emergency response costs
Damage to infrastructure Household costs
Damage to crops and livestock Commercial costs
Damage to natural resources (e.g. timber)
Loss of production
Intangible Death Psychological
Injury Inconvenience and stress
Personal items and memorabilia
Source: BTE (2001)
• These costs would most likely be modelled using a combination of historical data, bushfire spread modelling, or custom modelling depending on the budget and timelines of a full CBA and on the cooperation of other parties (such as CSIRO or insurers).
• Costs associated with fuel reduction would also be estimated, this would be based on information gathered from industry, land managers and other experts or, alternatively, could rely on general per hectare costs reported in the literature.
Undertaken specific research on some cost items that are particularly important for a CBA relating to bushfires. These are:
• Death and injury: which can be readily valued using the value of statistical life.
• Carbon emissions: which can be valued using data on emissions from bushfires and the costs of carbon, although more detailed work is required to appropriately measure the cost of carbon emissions.
• Particulate matter: which can be valued using data on the value of emissions, although more detailed work is required to appropriately measure the cost of particulate emissions.
• Ecological benefits: are generally not valued quantitatively in a CBA although, in some cases, it may be possible to value the loss of certain ecological areas if they align with areas that are used as part of BioBanking schemes.

Deloitte Access Economics Commercial-in-confidence 3
Potential case study regions
We have also reviewed the data that could be used to support a number of case study regions. Overall, potential case studies should be judged according to their attributes against a set of criteria. This will help ensure that the CBA is relevant and informative. Criteria for selection include:
it is an area where there is a current and ongoing threat from bushfire;
the area is important, for social or economic reasons, that is home to a number of people, or where there is a significant amount of infrastructure;
there is access to data sources and other literature; and
there is the potential to implement different bushfire management policy options.
We considered a range of areas within Australia against these criteria and came to the following conclusions on their areas of particular strength. In summary, case studies based on the Blue Mountains, Melbourne fringe or South-west WA appear to be most prospective. While other regions may be relevant, such as the North-Coast and South-Coast of New South Wales and the drier forest areas of Tasmania, further scoping analysis would be needed.
Table ii: Summary of proposed case study areas
Region Threat High socio-economic impact Data Policy incentive
Blue Mountains
The Pilliga
North Coast
Melbourne Fringe
South-west WA
Gippsland
The final task of the scoping study involved the development of an indicative example for the Blue Mountains region. It should be noted that this is an indicative example to demonstrate that, with the available data and research, it is possible to make some estimates of the relative costs and benefits of different bushfire policy approaches. While this is not a full CBA it is designed to illustrate the public policy merits of undertaking a detailed CBA. The indicative analysis provides evidence which suggests there is a sound case to invest in a full CBA.
Indicative example
The chosen example indicated that current costs of bushfires in the Blue Mountains average around $72 million a year while, if fuel reduction was undertaken on about 5% of the landscape, this could reduce total costs to around $39 million a year. These results indicate that increased fuel reduction activity in the Blue Mountains could generate net benefits of up to $34m a year (equivalent to around $483m in perpetuity).
These results include the additional costs of treatment, potential revenue from the sale of mechanically recovered matter and costs related to particulate matter and carbon emissions. It should be noted that there are a number of areas of uncertainty in these
Deloitte Access Economics Commercial-in-confidence 4
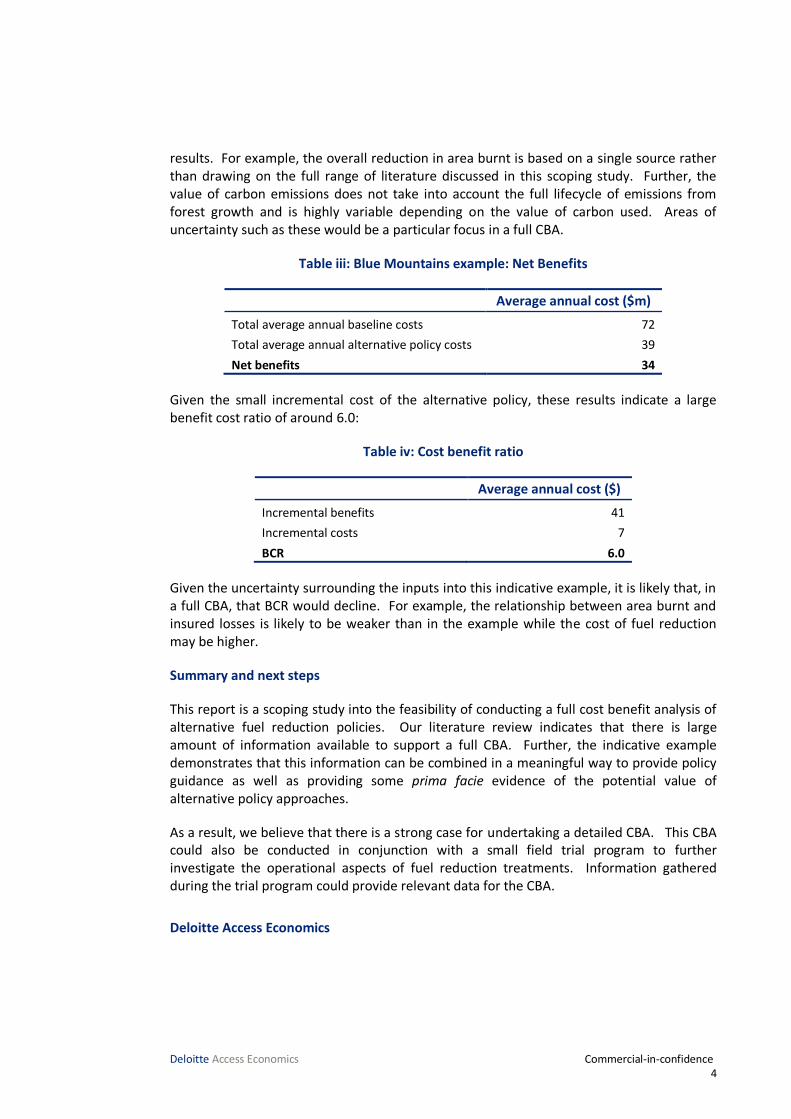
results. For example, the overall reduction in area burnt is based on a single source rather than drawing on the full range of literature discussed in this scoping study. Further, the value of carbon emissions does not take into account the full lifecycle of emissions from forest growth and is highly variable depending on the value of carbon used. Areas of uncertainty such as these would be a particular focus in a full CBA.
Table iii: Blue Mountains example: Net Benefits
Average annual cost ($m)
Total average annual baseline costs 72
Total average annual alternative policy costs 39
Net benefits 34
Given the small incremental cost of the alternative policy, these results indicate a large benefit cost ratio of around 6.0:
Table iv: Cost benefit ratio
Average annual cost ($)
Incremental benefits 41
Incremental costs 7
BCR 6.0
Given the uncertainty surrounding the inputs into this indicative example, it is likely that, in a full CBA, that BCR would decline. For example, the relationship between area burnt and insured losses is likely to be weaker than in the example while the cost of fuel reduction may be higher.
Summary and next steps
This report is a scoping study into the feasibility of conducting a full cost benefit analysis of alternative fuel reduction policies. Our literature review indicates that there is large amount of information available to support a full CBA. Further, the indicative example demonstrates that this information can be combined in a meaningful way to provide policy guidance as well as providing some prima facie evidence of the potential value of alternative policy approaches.
As a result, we believe that there is a strong case for undertaking a detailed CBA. This CBA could also be conducted in conjunction with a small field trial program to further investigate the operational aspects of fuel reduction treatments. Information gathered during the trial program could provide relevant data for the CBA.
Deloitte Access Economics

Deloitte Access Economics Commercial-in-confidence 5
1 Introduction The Australian Forest Products Association (AFPA) has commissioned Deloitte Access Economics (DAE) to undertake a scoping study to explore the costs and benefits of a policy of increased fuel reduction, using a combination of the mechanical removal of trees and biomass, and fuel reduction burning. This has the potential to reduce the extent and severity of future fires.
1.1 Background
The 2013 NSW bushfires, and more recently the Western Australian and Victorian bushfires in early 2014, highlighted the potential for widespread burning of large forest areas and destruction of economic infrastructure (e.g. roads, bridges, homes). The effect of such intense, widespread fires can include: large insured losses; killing trees, wildlife and other vegetation; air and water quality issues; and significant, non-quantifiable personal and emotional costs. It can take many years before the forest regenerates and the environment, community and economy fully recover.
In addition to the direct bushfire reduction benefits, a policy of mechanical removal of trees and other combustible biomass (e.g. understory, fallen branches etc.) would provide some material for use in the forest products and other relevant industries. This would allow for a valuable resource to be generated out of bushfire fuel that would otherwise be burnt during fuel reduction burning or during a bushfire.
Recently, there has been increased interest in establishing a robust basis for decision making around the current and future impacts of natural disasters in Australia. Most notably, in 2013 DAE undertook research for the Australian Business Roundtable for Disaster Resilience and Safer Communities which enlivened this debate. DAE found that while different resilience measures showed a wide range of benefit-cost ratios (BCRs), investments that target high-risk locations using appropriate combinations of infrastructure, policy and procedure carry the highest BCRs. A detailed assessment of how bushfire management policy impacts outcomes would build on this existing knowledge.
Deloitte Access Economics Commercial-in-confidence 6
1.2 Purpose of the Scoping Study
There is a paucity of research and data analysis around the relative costs and benefits of alternative approaches to bushfire management. The current policy approach is to focus on fuel reduction burning in the cooler months of the year and suppression to protect high value assets during the bushfire season. This is described qualitatively in the National Bushfire Management Policy Statement for Forests and Rangelands:
It is clear that in forest and rangeland ecosystems, reducing the fuel reduces bushfire risk. Many techniques are available to reduce fuel (such as slashing, grazing, physical removal) and overall bushfire risk (such as reducing ignitions, rapid response, community preparedness), but this statement focuses on the role of planned fire which is the only technique available for the wider reduction of fuels in fire prone and fire adapted communities (i.e. those suitable for treatment). (Forest Fire Management Group 2012).
As a result, the aim of this report is to begin the process of establishing a robust set of information to inform the debate on the most appropriate, evidence based bushfire management policy. In particular, it provides the background to undertaking a full CBA of a policy of increased fuel reduction using a combination of mechanical removal of fuels and fuel reduction burning. An investigation of this issue is warranted as there are likely to be a number of operational and economic advantages in adopting a policy that incorporates the mechanical removal of fuels, including:
community concerns over smoke and air quality;
the narrow window of weather days for undertaking fuel reduction burning; and
managing fuel loads from a risk management perspective, particularly in bushland areas that are in close proximity to population centres or other important assets.
This report aims to undertake an initial review of the available data and other literature which is currently available in Australia and globally. In particular this scoping study will focus primarily on understanding the availability of data and research for the proposed case study areas of the proposed larger CBA.
This scoping study will assess the possible approaches to undertaking a full CBA of this nature. As part of this, the scoping study will identify the quantitative analysis that would be undertaken in the full CBA, and will describe how this analysis could be applied in one of the case study areas. The policy case would be heavily reliant on establishing the scale of potential mitigation expenditure that could take place in Australia, over what time period it could be completed and how it would reduce the severity of bushfire events.
Finally, this report will outline the next steps required to progress from this Scoping Study to completing a full CBA. We would work with industry and related stakeholders to develop a detailed “next steps” in order to undertake the requirements of a full study.

Deloitte Access Economics Commercial-in-confidence 7
1.3 Structure of this paper
The remainder of this paper is structured as follows:
Chapter 2 provides a high level summary of bushfire risk in Australia;
Chapter 3 details the North American experience with mechanical removal of fuels as bushfire mitigation;
Chapter 3 describes the two approaches to bushfire policy, business as usual and the alternative policy case;
Chapter 4 outlines the potential CBA methodology;
Chapter 5 outlines the regions which could be modelled in the CBA; and
Chapter 6 demonstrates, in more detail, how the CBA approach could be applied to a particular region – the Blue Mountains.

Deloitte Access Economics Commercial-in-confidence 8
2 Bushfire risks in Australia Living with the threat and consequences of bushfires is not a new phenomenon for Australians. In recent decades, extended periods of drought and the complex effects of climate change have heightened the threat of bushfires in Australia; Australia’s bushfire season has been longer and bushfires have been observed more frequently and with greater costs than before. This trend is expected to continue, the Intergovernmental Panel on Climate Change believes that climate change will increase the frequency and severity of very hot days in Australia (IPCC, 2012; 2013) increasing the chance of very high fire danger weather and associated bushfires.
Bushfires in Australia today impact on, and have significant costs for a range of aspects of the Australian community (Climate Council 2013):
Human health: fires pose significant risk to human health, including the threat of death and respiratory impacts, since 1850 more than 800 people have died as a result of bushfires.
Built environment and infrastructure: the Climate Council estimates that between 1925 and 2009 around 300 houses were lost each year as a result of bushfires.
Agriculture: bushfires cause significant damage to livestock and farming areas in Australia, Keating and Handmer (2013) estimate that bushfires directly cost the Victorian agriculture industry around $42 million each year. If the costs to business interruptions are included the cost of bushfires increases to around $92 million annually.
Forestry: bushfires cause significant damage to forestry and wood processing. For example, Keating and Handmer (2013) estimate that the direct cost to the Victorian timber industry from bushfires is $74 million per year.
Water: bushfires have long lasting impacts on the quality and quantity of water in catchments, Melbourne Water estimates that the Black Saturday bushfires in 2009 affected 30% of the catchments, with recovery and ongoing water monitoring costs exceeding $2 billion.
There are additional financial costs directly associated with bushfires including, the opportunity costs for volunteer fire firefighters, and the fixed cost of fighting the bushfires and government contributions for rebuilding efforts and compensation.
Beyond the economic and financial costs of bushfires outlined above, bushfires have other costs that are far more difficult to quantify. Costs such as social disruption, trauma for people living in bushfire affected areas, the ongoing impacts on health and effects on ecosystems, while more difficult to measure are no less real.

Deloitte Access Economics Commercial-in-confidence 9
2.1 The cost of recent bushfires
The increased frequency and severity of bushfires in Australia over the last decade has meant that the number of bushfires categorised as major events has risen dramatically. This is arguably reflective of climate change increasing the number of very hot days in Australia and increasing the chance of very high fire danger weather.
The recent fires in New South Wales in October 2013, for example, were preceded by the warmest September on record for the state, and the warmest 12 months on record for Australia. In addition, below average rainfall in forested areas increased the quantity of dry fuels, further contributing to the size and severity of the bushfire event. More than 200 properties were destroyed, and the bushfires indirectly caused the deaths of two people in the Blue Mountains. Early estimates from the Insurance Council of Australia (ICA), have estimated that total insured costs will exceed $180 million. The bushfires in the Wurrumbungles (Wambelong) earlier in 2013 destroyed around 55 homes and the Siding Spring Observatory and burnt a large area of the National Park and surrounding areas.
Looking elsewhere in the country, the bushfires in Tasmania in late 2012 and early 2013 resulted in the loss of more than 200 homes, and around 10,000 livestock. The bushfires caused the evacuation of around 1,000 residents. The ICA estimates that the total costs from these bushfires were around $87 million. The fire season in the state over 2012/13 summer was particularly bad, with some bushfires starting as early as November 2012 and continuing through until April of the following year.
Figure 2.1: Insured costs of recent major bushfires in Australia

Deloitte Access Economics Commercial-in-confidence 10
The Bushfire Front, an independent bushfire research centre in Western Australia (WA), highlighted the vulnerability of South Western WA to fire prior to the fires in 2011. The report highlighted population density in the region; availability of fire fighters; location of residences within unburnt bushland; and weather conditions as areas of concern. The bushfires destroyed around 32 homes and 13 buildings and impacted many business operations in the South Western tourism region of WA. The total cost of the bushfire has been estimated to be around $53 million (Emergency Management Australia 2013).
Black Saturday in Victoria during February 2009 is among the worst bushfires (in terms of total number of deaths) in Australia’s, and indeed the world’s, recent history. The weather conditions directly before the bushfire were among some of the hottest days on record in Australia; the Forest Fire Danger Index (FFDI) ranged from 120 to 190 (the highest values ever recorded) on Black Saturday (Climate Council 2013). The costs of Black Saturday are well documented, but worth re-emphasising. More than 2,000 properties were destroyed and between 8,000 and 11,800 livestock were lost. Overall, ICA estimates that the bushfires resulted in insured losses of $1.07 billion. Most significantly, 173 lives were lost directly as a result of the fires with a further 414 people injured.
The bushfires that affected the Canberra and Alpine regions during January 2003 directly caused the deaths of five people, with a further 490 people injured. The bushfires destroyed more than 500 homes, more than 17,000 livestock, and impacted on around 70% of the Australian Capital Territories (ACT) pastures, forests and reserves. ICA estimates that insured losses from the bushfires were $660 million.
2.2 Total bushfire costs
The insured losses discussed above represent only a proportion of the total economic costs of natural disasters for society. Total economic costs include broader social costs which would not otherwise have been incurred had a disaster not taken place. As these costs are borne by many parties, from individuals, communities and businesses, to all levels of government and insurers, the magnitude of total economic costs can be hard to measure.
Research conducted by the Bureau of Transport Economics (BTE) in 2001 attempted to estimate the total economic costs borne by Australians due to natural disasters. Using data from disaster events which occurred between 1967 and 1999, and restricting the analysis to cases where the total estimated cost exceeded $10 million, it was found that the average annual economic cost was $1.1 billion, in 1999 prices. In general, it was found that total economic costs were around 2-3 times greater than insured costs for most natural disasters.

Deloitte Access Economics Commercial-in-confidence 11
There has been a strong trend of increases in natural disaster costs over time; this is attributable to both demographic and environmental factors. In particular, the size and density of Australia’s major cities has increased, due to a combination of population growth, domestic migration and international migration. As population density has increased, settlements and industrialisation have reached previously uninhabited areas of greater exposure to natural disaster risks. Given that these areas are at higher risk of fire, flood, storm and cyclone events, the magnitude of damage caused by such disasters has been further compounded. Strong economic growth leading to the concentration of high value assets has also contributed to the rising damage bills.
Using data on the incidence of past Australian natural disasters, we have developed an estimate of the current average cost of bushfires in Australia as well as forecasts of their likely future costs. The process undertaken to generate these forecasts is described in Appendix A.
The forecasts presented attempt to capture the total economic cost of the natural disasters, not just the insured losses. As described earlier, insured costs represent the payouts made by companies in response to eligible policy claims. Total economic costs are inclusive of these insured losses, along with broader social costs which would not otherwise have been incurred had a disaster not taken place.
At present, the total economic cost of bushfires in Australia is estimated to average around $337 million per year. In real terms, this total is forecast to grow by 2.2% annually. This is primarily due to the likely impact of further population growth and concentrated infrastructure density. With this growth rate, the annual total economic cost of bushfires in Australia is expected to reach $800 million by 2050, these forecasts are shown in the chart below.
Looking on a state by state basis, Victoria accounts for the largest component of total costs (accounting for almost half of all bushfire related natural disaster costs). NSW, SA, ACT and Tasmania all account for roughly similar shares of the total cost (between 11-15%). WA has a much lower share of the cost (only around 2%). The Northern Territory and Queensland do not have any significant bushfires recorded in the Insurance Council of Australia’s database of natural disasters and so do not contribute to the forecasts.

Deloitte Access Economics Commercial-in-confidence 12
Chart 2.1: Forecast total economic costs of bushfires ($2011)
Table 2.1: Forecast total economic costs of bushfires ($2011, million)
2014 2020 2030 2040 2050
NSW 43 50 64 81 103
Vic 172 196 244 304 378
WA 8 9 11 13 16
SA 44 48 57 67 79
ACT 53 62 79 101 129
Tas 40 45 57 73 92
Total 360 411 512 639 797
Source: DAE
-
100,000,000
200,000,000
300,000,000
400,000,000
500,000,000
600,000,000
700,000,000
800,000,000
900,000,000
2011 2016 2021 2026 2031 2036 2041 2046
Tas
ACT
SA
WA
Vic
NSW
$m

Deloitte Access Economics Commercial-in-confidence 13
3 The North American experience The many similarities between the North American and Australian experience with bushfires, means that discussion of the policy responses to bushfires in North America are relevant to the policy response in Australia.1
The significant increase in the number of properties and homes which are located in an urban-bush setting in the east coast of Australia and south-west Western Australia is similar to what has occurred in many parts of North America.
A similar history of bushfire management including a previous focus on fire suppression has resulted in similar issues with high forest fuel loads.
There has been a similar trend in the increase in the frequency and severity of bushfires in North America, particularly in the western United States and many climate predictions suggest this is likely to continue.
Importantly, the recent shift in policy responses, and the associated data and research provides a basis for understanding how policies pioneered in North America may be applied in an Australian context. The outcomes of the policy response in North America may provide Australia with the impetus to move towards adopting a contemporary approach to bushfire management.
3.1 The 2002 and 2003 wildfire seasons
Prior to the beginning of this decade the policy response to the threat from bushfire in North America emphasised fire suppression as the predominant bushfire management tool. A series of particularly bad fire seasons beginning in 2000 resulted in a shift in governments’ and policy makers’ approach to addressing the challenge of bushfire management.
The 2002 bushfires were particularly damaging, in terms of area burnt and the severity of a number of fires. Bushfires burnt 485,000 hectares along the Pacific North West and Western United States including in Arizona, Colorado, Oregon and New Mexico. Indeed it was immediately after this that the term ‘mega-fire’ was used to describe the emerging trend of large bushfires (Williams 2012).
Similar to the recent bushfires in Australia, the 2002 bushfires in the Western United States were largely the result of an extended period of drought and hot conditions in Western and Mid-Western USA. A further compounding factor was the build-up of fuel loads – the result of past policy responses to bushfires which focussed primarily on fire suppression activities (Stephens 2014).
While bushfires in California during the hot and dry months of September and October are relatively common, a series of particularly bad fires took place in 2003. The largest single fire burning in California during October 2003 was the Cedar Fire in San Diego County. This
1 In North America, bushfires are known as wildfires.

Deloitte Access Economics Commercial-in-confidence 14
single fire is among the largest bushfires to have taken place in California and it was only one of 15 other fires burning in Southern California during one week in October 2003. Overall these fires resulted in the deaths of 26 people and destroyed a significant amount of property (including 3,361 homes). The fires burnt more than 742,000 hectares across Southern California, cost more than $250 million to contain and caused around $2.04 billion worth of damage (Keely et al 2004). Review of the policy in the lead up to and immediately following the fires indicated that fire management policy was ineffective at preventing these mega-fires.
Fires in western Canada, the Yukon, Quebec and Ontario in the early 2000s caused a shift in the policy response to bushfire management in Canada. As in the Western United States, and southern Australia, bushfires in Canada over the last decade have increased in frequency and severity. At the same time, the policy approach to bushfire management focussed largely on fire suppression contributing to the rising trend in bushfires in the region over the early part of this decade.
Bushfires in 2003 in British Columbia were among the most catastrophic in recent times. As in Southern California, the climate conditions in the lead up to the bushfire season, in particular the extended drought across the Pacific North West resulted in severe fire weather conditions. At the same time, the bushfires were taking place in an environment of changing population densities with bushfires increasingly affecting homes located close to forests and National Parks. Generally each year there is one instance of “interface” bushfires, this year alone there were eight, highlighting the impact of increased frequency of bushfires in the changing urban-bush setting.
Across Western Canada, bushfires during the summer months of 2003 cost around $1 billion to contain, destroying hundreds of homes and leading to the evacuation of thousands of people. The cost of containing bushfires in British Columbia alone was around $500 million. In addition, the Insurance Bureau of Canada estimates that the cost of insured property damage was around $250 million, this was estimated to be the largest insurance loss from bushfire in Canada.

Deloitte Access Economics Commercial-in-confidence 15
3.2 Policy response
3.2.1 United States
Following particularly bad bushfire seasons in the early 2000s there was a shift in the policy response to bushfire management in the United States. This shift took place within a context of a broader shift in the policy of forest management. This policy response is based around cooperation, collaboration and planning involving multiple groups to achieve a landscape-scale response to bushfire management.
The United States Department of Agriculture Forest Service is responsible for restoring, enhancing and maintaining the national forests. The Department administers a number of programs to achieve this objective; those relevant to bushfire management are outlined below.
The Healthy Forests Initiative (HFI) was enacted in 2003. The Initiative aimed to restore forest landscapes to historical fire-resilient ecological conditions. The HFI allowed the USDA Forest Service to plan and conduct fuel reduction treatments across the breadth of the national forest system. This was to be achieved through combined use of prescribed burning and mechanical harvesting.
The HFI was followed by the Collaborative Forest Landscape Restoration Programme (CFLRP). The CFLRP was created in 2009 to, amongst other aims, reduce emergency wildfire costs and risks. This program is reflective of the broader policy shift which emphasises landscape-scale planning, collaboration, monitoring and restoration. The holistic approach of the program objectives included demonstrating that costs could be lowered through re-establishing natural fire regimes and showing that the commercial value of restoration by-products could support local economies (Schultz et al; 2011). Projects included in the CFLRP were conducted at scales which could influence fire behaviour and were able to address larger scales than had been achievable previously. Fuel treatments included mechanical thinning, prescribed fire, harvesting woody biomass and managing lightning-caused fire for restorative purposes. For example, in the Selway-Middle Fork Clearwater Project, 90-100% of the treatments will take place within the wildland-urban interface. Other projects such as the Four Forests Restoration Initiative (4FRI) in Arizona aim to restore forests to more fire-resistant ecological conditions and strategically place treatments in areas adjacent to and farther from communities to reduce the risk of uncharacteristic wildland fire in the future.

Deloitte Access Economics Commercial-in-confidence 16
Analysis of outcomes has focused on modelling the impacts of alternative fuel reduction policy initiatives.
Hartsough et al (2008) analysed seven sites in the western United States, to determine the costs of different fuel reduction treatments (prescribed fire, mechanical treatment, mechanical plus fire) against the impact of these treatments on fuel and other factors. The authors found that the net costs of mechanical treatment (after considering the value of harvested products) were less than those of fire alone (with the exception of one site), and that the mechanical plus fire treatment was the most effective in reducing the severity of fires under extreme weather conditions.
Thompson et al (2013) quantified the impact of fuel reduction practices on bushfire size and suppression costs. The modelling analysed bushfire simulation outputs against suppression costs and fuel treatment cost impacts to compare expected suppression costs with and without fuel treatments. The authors found that with fuel reduction treatments the distribution of wildfire size and suppression costs decreased both in the treated areas and in the broader landscape study area.
3.2.2 Canada
The Canadian response to bushfire management since the early 2000s has been broadly similar to that taking place within the United States, with an emphasis on managing bushfires as part of a more comprehensive approach to forest management.
The approach to bushfire management is a direct response to the perceived changing climate conditions facing Canada (including the hotter and drier weather conditions) and public concern for the rising trend of ‘mega fires’ and the impact of these fires on people and property (Canadian Council of Forest Ministers 2005). There are also expectations that developments in climate conditions apparent in Western Canada will result in a longer fire season and more frequent and increased severity of bushfires in Canada. In response to these concerns and the apparent declining effectiveness of fire suppression policy, policy makers have focussed on addressing the risks of large scale fires with a more active approach to bushfire management which incorporates both fuel reduction and biomass utilisation (Stephens 2012).
The change in the policy response has been the most apparent in the development of the Canadian Wildland Fire Strategy, which focusses on developing a national risk management framework. The policy response is based around a framework of mitigation, preparation and response. The increased use of fuels management and other mitigation activities are intended to reduce the severity of fire behaviour in forest lands.
The policy response in British Columbia has focussed on responding to the increased severity of bushfires apparent in the region. The Wildfire Management Brach is responsible for bushfire policy in the region. Recent strategies have emphasised proactive planning as an appropriate response to the increased threat of bushfires.
Fuel management to reduce loss and damage from bushfires through community wildfire protection and fuel hazard reduction.

Deloitte Access Economics Commercial-in-confidence 17
Landscape level management planning, to lead to landscape fire management planning that results in fire-adapted communities and fire-resilient ecosystems.
Wildfire management practices to develop and promote innovative wildfire management science, practices, technology and decision support models.
Further, the Ministry of Forests, Lands and Natural Resource Operations in British Columbia has identified a range of treatments to promote reduced fire risks (Stephens 2014). These include:
Harvesting and commercial thinning
Line corridor fuel breaks
Increased prescribed fire
Large scale fuel breaks
Alternative silviculture regimes
Energy / biomass use; and
Better initial attack (access, response and resources).

Deloitte Access Economics Commercial-in-confidence 18
4 Two approaches to mitigation With the emergence of more active forest management internationally and the increased reliance on mechanical removal of combustible biomass, a cost benefit analysis of its application in Australia is warranted. To undertake a cost benefit analysis we would need to define a baseline scenario and an alternative policy approach. This chapter outlines the likely information that would be used to inform both scenarios.
4.1 Baseline approach
The baseline scenario would be a business as usual scenario. This is described qualitatively in the National Bushfire Management Policy Statement for Forests and Rangelands:
It is clear that in forest and rangeland ecosystems, reducing the fuel reduces bushfire risk. Many techniques are available to reduce fuel (such as slashing, grazing, physical removal) and overall bushfire risk (such as reducing ignitions, rapid response, community preparedness), but this statement focuses on the role of planned fire which is the only technique available for the wider reduction of fuels in fire prone and fire adapted communities (i.e. those suitable for treatment). (Forest Fire Management Group 2012).
That is, the baseline would involve continued reliance on planned fire as the only fuel reduction treatment conducted at current levels.
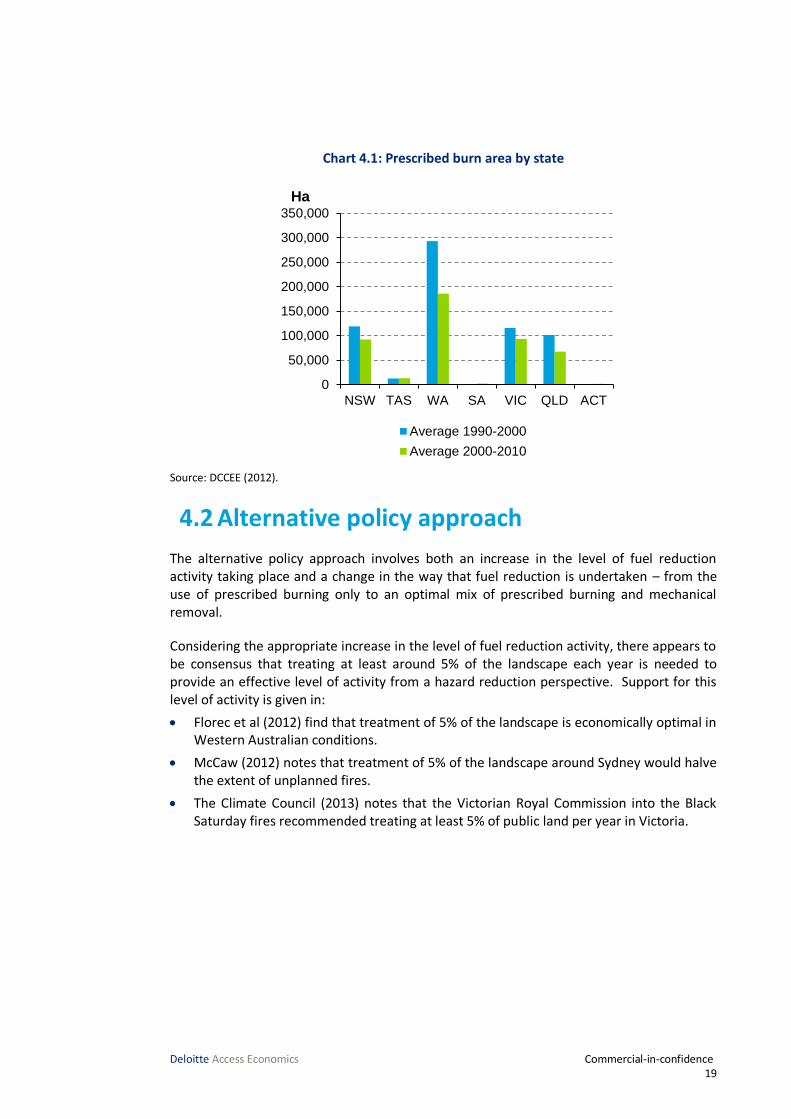
From a quantitative point of view, data is available on the prescribed burn area in Australia. As is shown in the chart below, there has been a strong decline in the average prescribed burn area in most Australian states when comparing 2000-2010 to 1990-2000. It is this lower level of prescribed burning that has been the norm over recent decades that would be used as the baseline approach to fuel reduction.
In a full CBA this prescribed burn area would be converted to a percentage and the percentage would be used as the baseline from which fuel reduction is increased in the policy scenario. Recent analysis indicates that NSW is likely burning around 0.5% of bushland in any given year (McCaw 2012; Price and Bradstock 2011).
Deloitte Access Economics Commercial-in-confidence 19
Chart 4.1: Prescribed burn area by state
Source: DCCEE (2012).
4.2 Alternative policy approach
The alternative policy approach involves both an increase in the level of fuel reduction activity taking place and a change in the way that fuel reduction is undertaken – from the use of prescribed burning only to an optimal mix of prescribed burning and mechanical removal.
Considering the appropriate increase in the level of fuel reduction activity, there appears to be consensus that treating at least around 5% of the landscape each year is needed to provide an effective level of activity from a hazard reduction perspective. Support for this level of activity is given in:
Florec et al (2012) find that treatment of 5% of the landscape is economically optimal in Western Australian conditions.
McCaw (2012) notes that treatment of 5% of the landscape around Sydney would halve the extent of unplanned fires.
The Climate Council (2013) notes that the Victorian Royal Commission into the Black Saturday fires recommended treating at least 5% of public land per year in Victoria.
0
50,000
100,000
150,000
200,000
250,000
300,000
350,000
NSW TAS WA SA VIC QLD ACT
Average 1990-2000
Average 2000-2010
Ha

Deloitte Access Economics Commercial-in-confidence 20
5 CBA Methodology This chapter provides an outline and potential data sources for conducting a full benefit-cost analysis of increased fuel reduction activity and mechanical removal of fuel in Australia. In practice, the overall methodology would be applied to specific case studies; the likely areas that could be used for case studies are outlined in Chapter 6.
5.1 Overview of CBA
In the context of a policy intervention such as fuel reduction, the purpose of a CBA is to provide a structured approach to assessing whether or not the policy is likely to result in overall benefits to the economy. A CBA considers the economy in a broad way and should take into account non-monetary factors such as the environment, health and leisure time.
Conducting a CBA that relates to natural disasters is somewhat different to a standard CBA as it focuses almost entirely on costs and associated risks. A natural disaster related CBA considers the expected costs of natural disasters in a baseline case and the costs of natural disasters in a policy case. The difference between the two cases is created by expenditure on a resilience measure – another cost. The CBA is therefore weighing up the costs of investment in resilience compared to the reduction in natural disaster costs (see Figure 5.1).
Figure 5.1: Overall CBA process
In a more stylised sense, the overall process of a natural disaster resilience CBA is to:
1. Estimate baseline natural disaster costs
2. Identify and cost resilience measures
3. Re-estimate natural disaster costs
4. Compare costs of resilience to reduction in natural disaster costs
An outline of each of these steps will be provided below but, first, a clear definition of the range of costs and benefits considered will be given.
Deloitte Access Economics Commercial-in-confidence 21
5.2 Defining costs
When conducting a CBA for a resilience measure the total economic costs are used, rather than insured costs. Insured costs of natural disasters only capture the losses accruing to insured assets – they do not pick up uninsured assets or broader economic costs (such as emergency response costs and loss of life).
The main source for how to estimate total economic costs of natural disasters is a report from the Bureau of Transport Economics (2001) “Economic Costs of Natural Disasters in Australia” (BTE is now known as the Bureau of Infrastructure, Transport and Regional Economics). This source provides an overall framework which allows an item by item quantification of costs and benefits where possible or their qualitative consideration where quantification is not possible.
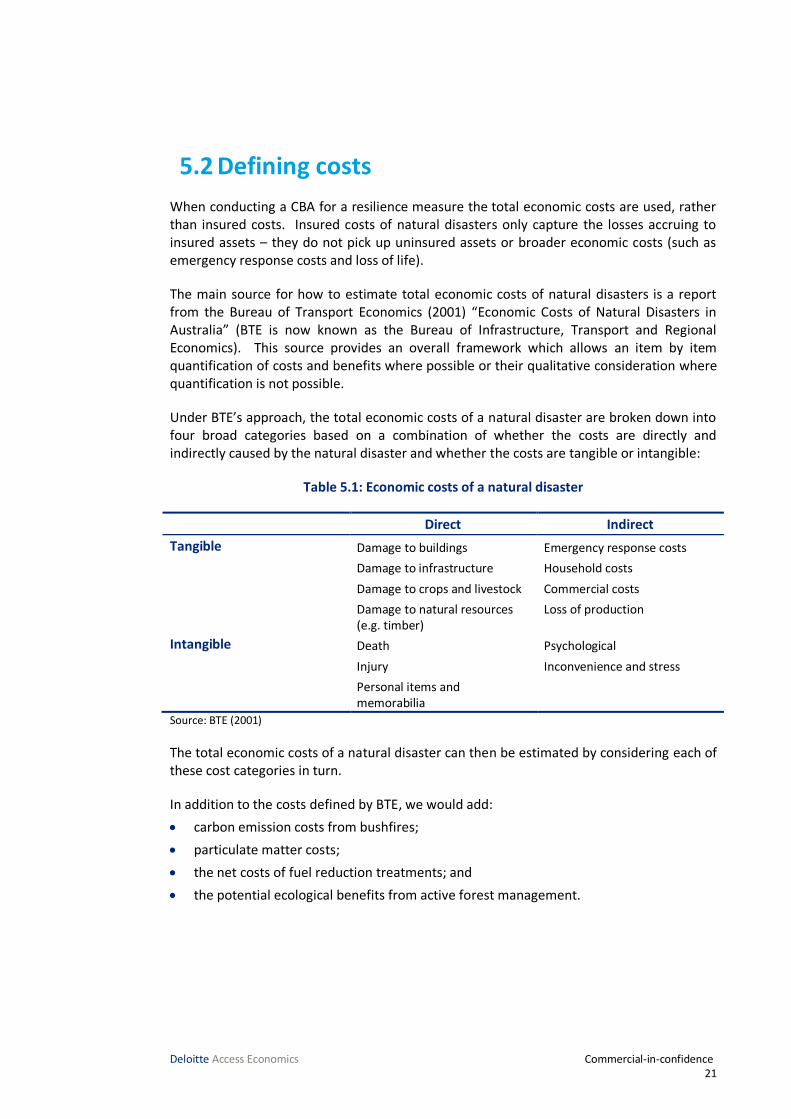
Under BTE’s approach, the total economic costs of a natural disaster are broken down into four broad categories based on a combination of whether the costs are directly and indirectly caused by the natural disaster and whether the costs are tangible or intangible:
Table 5.1: Economic costs of a natural disaster
Direct Indirect
Tangible Damage to buildings Emergency response costs
Damage to infrastructure Household costs
Damage to crops and livestock Commercial costs
Damage to natural resources (e.g. timber)
Loss of production
Intangible Death Psychological
Injury Inconvenience and stress
Personal items and memorabilia
Source: BTE (2001)
The total economic costs of a natural disaster can then be estimated by considering each of these cost categories in turn.
In addition to the costs defined by BTE, we would add:
carbon emission costs from bushfires;
particulate matter costs;
the net costs of fuel reduction treatments; and
the potential ecological benefits from active forest management.

Deloitte Access Economics Commercial-in-confidence 22
5.3 Estimating baseline costs
The first step in undertaking the CBA is to estimate the expected costs of bushfire under the base case with current levels of fuel reduction activity using burning only.
5.3.1 Bushfire costs
There are a number of ways in which estimating the bushfire costs could be achieved. Each method listed below has a different mix of positives and negatives and the appropriate method would need to be selected in the context of a full CBA:
Estimate based on historical data
This is the most basic approach to estimating bushfire costs. This approach would use the historical data from the Insurance Council of Australia database (ICA 2014) to provide an estimate of average annual insured bushfire costs in any given region of Australia.
This insured cost could then be turned into a total economic cost by use of the multipliers reported in BTE (2001). A more detailed approach would merge the ICA database with the EMA database (2014). The EMA database contains information on factors such as the number of buildings damaged, number of fatalities and the number of people evacuated that can be added on to the insured costs to determine a total economic cost.
Estimate based on an existing bushfire model
This approach relies on the use of modelling by an outside agency and so may have a higher cost but could significantly improve the detail of the analysis that can be undertaken. If results from a model can be readily sourced then this is our preferred method for estimating the costs of a bushfire.
There are a number of bushfire models currently in use around Australia. For example:
• the Australis model is maintained by George Milne at the University of Western Australia.
• CSIRO has a Bushfire Dynamics and Applications group which develops models of bushfire spread. Some of their models (such as SiroFire) are freely available.
• The Bushfire CRC has developed a fire simulation model.
• AIR Worldwide, a private risk modelling consultancy, maintain a model of bushfire spread for Australia.
These bushfire models focus on the spread of fire within a landscape, not the economic damage caused by the fire. The results of the model would need to be combined with analysis of how fire affects households. The best research in this area has been undertaken by RiskFrontiers (2010) which provides a detailed analysis of how proximity to a bushfire relates to the probability of damage. This relationship is shown in the figure below.

Deloitte Access Economics Commercial-in-confidence 23
Chart 5.1: Relationship between distance to bushfire and building destruction
Source: RiskFrontiers (2010)
Various RiskFrontiers publications provide estimates of the number of houses within various distances for locations within Australia, for example Chen (n.d.) covers Sydney.
Alternatively, estimates for the number of houses by distance could be generated from GIS information on vegetation coverage and Mesh Block housing data from the 2011 census. An example of this for Sydney is shown in the figure below.

Deloitte Access Economics Commercial-in-confidence 24
Figure 5.2: Using GIS to measure the number of houses within a given distance of bushland
The estimate of the number of houses damaged or destroyed could then be merged with data from the EMA database (2014) to give an estimate of how other factors (such as deaths and evacuation) vary with house destruction. This would provide enough information to estimate the total economic costs of the bushfire.
Estimate based on an existing insurance model
Another possibility is that an insurance business may grant access to their internal modelling. At this point we have not investigated the practicality or cost of adopting this approach.
Insurance modelling is very similar to bushfire spread modelling but involves an extra element that estimates the insured losses associated with a particular bushfire. This extra step takes the place of the role that the RiskFrontiers research plays above.

Deloitte Access Economics Commercial-in-confidence 25
Insurance modelling is based on the insured losses to a particular insurer and would have to be scaled up to a whole of market view by use of meshblock data from the ABS.
As with the bushfire spread modelling the results would also have to be aligned with data from the EMA database (2014) to give an estimate of the total economic costs of the bushfire.
Develop a basic bushfire spread model
The final alternative for establishing baseline bushfire costs would be to develop a basic bushfire spread model. This model would be similar to those described above but would not likely incorporate as much detail in some areas. The model would rely on data such as:
• probability of ignition;
• direction of spread;
• speed of spread;
• landscape; and
• fuel.
These factors would be used to determine the likely spread of fire within a given geography. The modelling would rely on relationships identified in previous literature (such as Gould et al 2008) to determine how a fire is likely to spread.
This would be an extensive modelling exercise and so would only be used as a last resort if other approaches turned out to be not workable.
5.3.2 Fuel reduction costs
The level of fuel reduction activity was outlined in 4.1. Information on the area burnt will need to be accompanied by information on the costs of this burning. There are a number of options for sourcing this information:
Average values could be sourced from publicly available research.
• For example, Florec et al (2012) estimate costs at around $80/ha based on a time series of data gathered from WA (Florec et al n.d).
• Information provided by Forestry Tasmania indicates that fuel reduction burning costs in Tasmania can range from around $60-300 per ha but average around $115 per ha.
In addition, data on actual management expenditure could be sourced from land management agencies in each jurisdiction.
• For example, in a recent project we were able to source data from the Office of Environment and Heritage in NSW on expenditure on prescribed burns in each of their management regions.

Deloitte Access Economics Commercial-in-confidence 26
5.4 Estimating policy costs
The baseline bushfire costs and fuel reduction costs would then need to be re-estimated under the policy scenario, where there is greater fuel reduction activity taking place.
5.4.1 Bushfire costs
There are two broad approaches to re-estimating the bushfire costs:
The first option is that, in the case where the modelling that underlies the initial bushfire cost estimate is highly detailed, it may be possible to re-run the model with a scenario of reduced fuel availability and directly measure the estimated effect on bushfire spread. We anticipate that it is unlikely that the modelling undertaken in the previous step will be detailed enough to allow for this approach.
The second, more likely option, is to make a direct adjustment to the area of land burnt in the initial round of modelling. This direct adjustment can be made as there have been a number of studies that have identified a strong relationship between the percentage of land treated with fuel reduction and the resulting reduction in bushfires. For example:
Boer et al (2009) contains data that relates the share of area burnt by planned fire to the share of area burnt by unplanned fire. This is shown in the chart below.
Chart 5.2: Relationship between planned and unplanned fires from Boer et al (2009)

Deloitte Access Economics Commercial-in-confidence 27
A similar relationship is identified in Attiwill and Adams (2013), drawing on the analysis contained in Sneeuwjagt (2008) for south-west WA.
Chart 5.3: Relationship between planned and unplanned fires from Attiwil and Adams (2013)
Similarly, McCaw (2013) notes that increasing fuel reduction activity in the Sydney region of NSW from 0.5% a year to 5% a year would result in a halving of the area burnt, based on the earlier analysis of Price and Bradstock (2011).
The policy scenario also incorporates mechanical removal of fuel. As a result, information is required on how mechanical removal compares to planned fire in terms of reducing bushfire risk. There is no data available from Australia on this as mechanical removal has not yet been undertaken in Australia at any relevant scale (i.e. only one small case study has been reported on Raymond Island in Victoria). However, there is good data available from the United States on the use of mechanical removal for fuel reduction and forest restoration purposes.
Hartsough et al (2008) found that a mechanical-plus-fire treatment was the most effective treatment in reducing wildfire risk under extreme weather conditions. The Hartsough et al (2008) study measures outcomes in terms of fuel load, tree density and basal area. These are not directly useful in estimating the bushfire risks for Australian conditions but could be used in conjunction with estimates such as Gould et al (2008) to translate fuel load and fire behaviour into fire risks. However, it is also possible that articles in the literature following Hartsough et al (2008) may be useful. Stephens et al (2009) and Stephens et al (2012) provide additional data on mechanical and prescribed fire treatments on fire severity, vegetation structure and carbon emissions in the western United States.
McCaw (2013) provides a useful summary of the contribution of fuel reduction practices to mitigating the effects of extensive, high intensity fires in southern Australia, which can be quantified using basic combustion science, well-documented case studies, analysis of fire statistics and simulation.
The reduction in area burnt could be directly related to a reduction in the expected damage to property and total economic cost. This is a simplifying assumption but, without detailed

Deloitte Access Economics Commercial-in-confidence 28
modelling of fuel and fire spread, it is not possible to make a more detailed assessment of how reduction in area burnt translates to a reduction in damage.
5.4.2 Fuel reduction costs
In addition to the change in area burnt, information would be required on the cost of treatment. The cost of treatment by fire will be the same as in the baseline. Costs of treatment by mechanical removal could be obtained from a number of sources:
General average costs could be sourced from information gathered in the United States or elsewhere. In particular, average net treatment costs are available from Hartsough et al (2008), although these reflect North American conditions and markets.
Estimates could be sourced from industry and public land managers in Australia on the costs of treating an average hectare, net of the commercial value of any biomass removed.
Another component of this cost is the potential value from the sale of combustible biomass and trees removed. Hartsough et al (2008) determined the costs of different fuel reduction treatments (prescribed fire, mechanical treatment, mechanical plus fire) for seven forest sites in the western United States. The authors found that the costs of mechanical treatment (after considering the value of harvested products) were less than those of prescribed fire alone with the exception of one site. In summary, the costs (in $US 2004-05) of mechanical treatment ranged from a net cost of $950 per hectare to a net return of over $2900 per hectare, with an average net return across the seven sites of $920 per hectare. These returns compared with the average cost of prescribed burning of $316 per hectare. While acknowledging the particular forest conditions and market circumstances in North America, it provides a guide to the potential benefits from the mechanical treatment of fuels compared to fuel reduction burning only.
In Australia, estimating the costs of mechanical fuel reduction treatments are more uncertain, given the current policy reliance on fuel reduction burning. Key factors in determining mechanical treatment costs include the forest structure (e.g. tree stocking, species), the types of fuel to be targeted (e.g. overstorey, intermediate, elevated, surface), harvesting technique, extraction and processing (e.g. in-field chipping), haulage distance and availability of markets.
The use of woody biomass for bioenergy (i.e. renewable energy) has been identified as a potentially important market (see, for example, CSIRO 2011, Bioenergy Australia 2012), as smaller diameter material can be used as a feedstock, although it is still an emerging industry in Australia. Other potential uses may include local landscaping and compost material from the available biomass and the domestic firewood market, which can retail for around $150-250 per tonne depending on species and location.
In estimating the costs of mechanical fuel reduction, a useful comparison can be made with the costs of sourcing woody biomass for renewable energy from conventional wood production forest areas. The main cost components include harvesting, chipping and loading, and haulage. If located within 50 kilometres from a bioenergy facility, the delivered cost of biomass can range between $30 to $60 per green tonne for bark and other residues (i.e. large branches, post-harvest material) in native forests to around $55 for biomass residues from softwood plantations (see CSIRO 2011; RIRDC 2012) and up to $85 for

Deloitte Access Economics Commercial-in-confidence 29
thinned trees (CRC for Forestry, unpublished data). Industry sources indicate that an upper limit of prices paid for delivered biomass for energy may be around $60 per green tonne. As an example of variability, prices in the Macquarie region of New South Wales are estimated at around $35 per tonne for forest residues. In terms of the amount and type of fuel removed through mechanical treatment, this would also vary by site.
The optimal mix of burning and mechanical removal can be calculated within the cost benefit model and would not need to be an input, although a number of scenarios could be evaluated.
5.5 Compare costs
The final stage of the analysis is purely mechanical. The difference in natural disaster costs under the baseline and in the case where resilience measures are put into place are compared to the costs of building resilience. This process is outlined in the diagram below.
Figure 5.3: Comparing costs in a CBA
Output Measures
Net Present Economic Value: Incremental Benefits – Incremental Costs
BCR: Incremental Benefits / Incremental Costs
Benefits
Direct
• Tangible
• Intangible
Indirect
• Tangible
• Intangible
Total Benefits
$ NPV of tangible benefits
Intangible benefits assessment
Incremental Benefits
$ NPV (tangible)
Qualitative assessment (intangible)
Base Case ‘Policy Scenario’ Case
Costs
Direct
• Tangible
• Intangible
Indirect
• Tangible
• Intangible
Total Costs
$ NPV of tangible costs
Intangible costs assessment
Benefits
Direct
• Tangible
• Intangible
Indirect
• Tangible
• Intangible
Total Benefits
$ NPV of tangible benefits
Intangible benefits assessment
Costs
Direct
• Tangible
• Intangible
Indirect
• Tangible
• Intangible
Total Costs
$ NPV of tangible costs
Intangible costs assessment
Incremental Costs
$ NPV (tangible)
Qualitative assessment (intangible)

Deloitte Access Economics Commercial-in-confidence 30
5.6 Approach to valuing particular costs
While many of the costs related to natural disasters are financial (such as the loss of buildings) some of the costs (such as death and emissions) are not valued in markets. These costs require some particular thought about how they will be valued. The following sections provide approaches to valuation for the major non-market cost categories in the CBA.
5.6.1 Death and injury
Estimating the costs of death and injury relies on two pieces of information. First, the number of people killed and injured is required. Second a dollar value for the cost of death and injury is needed.
The first piece of information, the number of people killed and injured, should be sourced from the natural disaster modelling undertaken as part of the assessment of damage to buildings.
The second piece of information, the value of death and injury, relies on an economic concept called the value of statistical life. According to the OBPR (2008): “the value of statistical life is an estimate of the financial value society places on reducing the average number of deaths by one” and “the value of statistical life is most appropriately measured by estimating how much society is willing to pay to reduce the risk of death”. The VSL is a well-established economic concept but there is a great deal of variability in estimates. For example:
Updating the VSL used by BTE (2001) to today’s dollars provides an estimate of $1.9m per death avoided.
Guidelines from OBPR based on a literature review recommend a value of $3.5m (OBPR 2008).
Recent academic research identified a VSL in Australia of around $6m (Hensher et al 2009).
In general we recommend using a VSL of $3.5m in line with recommendations from OBPR. However, some jurisdictions may have their own recommendations for VSL and, if this exists, it should be used in preference to the OBPR recommendation.
Values for serious injury and minor injury can be inferred from the VSL. Recommendations from OBPR do not contain any VSL estimates and so we recommend using figures drawn from BTE (2001):
Serious injury: $850,000
Minor injury: $28,500
BTE (2001) also recommends assuming a ratio between serious and minor injury of 1:2.

Deloitte Access Economics Commercial-in-confidence 31
5.6.2 Carbon emissions from fire
DCCEE (2012) contains annual data on both the land area burnt by bushfires in each Australian state and their associated CO2 emissions from 1990 to 2010. The data indicates that each hectare burnt by bushfires releases around 48.3 tonnes of carbon equivalent emissions into the atmosphere. At a current value of $24.15 per tonne (Clean Energy Regulator 2014) this translates to a value of $1,166.45 of carbon emissions per ha. It should be noted that there are other alternatives for valuing carbon. Some of these are outlined in Appendix B. Similar data from DCCEE (2012) for prescribed burning indicates an emissions intensity of 13.3 tonnes of carbon equivalent emissions per hectare (translating to $321.20 per hectare). The level of carbon emissions in these figures aligns well with the volume of fuel estimated Environment Australia (1999).
It should be noted that estimated costs of carbon emissions from fire are large. For example, the value of carbon emissions from bushfires in 2010 would be estimated at around $1.1 billion while insured losses in that year were relatively minor (ICA 2014).
The scale of this result suggests that further research is required to ensure it is reliable. In particular, the relationship between hectares burnt and emissions is simplified as it does not take into account specific factors that affect CO2 emissions (such as temperature, forest type and duration of burn). Further, there may be more details, such as forest regrowth patterns and landscape dynamics, which could change the scale of the result. Therefore, more detailed work would be required as part of a full CBA to more accurately measure the cost of carbon emissions.
Bradstock et al (2012), for example, provide initial modelling on the effectiveness of prescribed burning in reducing bushfire carbon emissions in southern Australia, noting that a more detailed understanding of the efficacy of prescribed burning and the dynamics of combustible biomass pools is required.
5.6.3 Particulate matter from fires
The air pollution produced by bushfires and the subsequent health effects in the surrounding area, is a key issue in valuing the costs and benefits of bushfire management policies. Given that the health impacts of reduced air quality are generally considered to be most significant, the quantification of health costs is the focus of this analysis.
Particulate matter (PM) is often classified into one of the following three size ranges:
TSP – total suspended particulate matter, which refers to all suspended air particles, with an aerodynamic diameter typically up to 30-50 micrometers;
PM10 – coarse particulate matter, which includes all particles with an equivalent aerodynamic diameter of less than 10 micrometers; and
PM2.5 – all particles with an equivalent aerodynamic diameter of less than 2.5 micrometers, often referred to as fine particles.
As described in Appendix B, these pollutants are strongly correlated. To bypass the difficulties associated with attributing health costs to the emissions of each pollutant, and avoid the risk of double-counting, it is common to focus on the health externalities

Deloitte Access Economics Commercial-in-confidence 32
associated with PM10 emissions. This approach indirectly encompasses part of the costs associated with other correlated pollutants, such as PM2.5.
The most common valuation approach is to focus on the total quantity of PM10 emitted. For example, research by Department of Environment and Conservation NSW (2005) indicates that a tonne of PM10 is valued at around $236,000 when released in a heavily populated area. This figure is in 2003 dollars, inflating at the Total Health Price Index as calculated by the Australian Institute of Health and Welfare (2014) gives a current value of around $291,000 per tonne.
This valuation of PM10, combined with information on the levels of PM10 following a bushfire can be used to arrive at an estimate of the costs of PM10 related to bushfires. An approach to doing so is set out in the example below. This example is based on bushfires near Sydney but the approach could be extended to other cities.
First, research by the EPA in Victoria provides the following relationship between the distance from a bushfire and the expected level of PM10.
Table 5.2: Relationship between distance and PM10 level
Distance 24hr PM10
ug/m3
24hr PM10
ug/m3
>20km <50 <80
10-20km 51-65 81-175
5-10km 66-155 176-300
1-5km 156-310 301-500
0-1km >310 >500
Source: EPA (2013)
It should be noted that, for use, these values must be netted off against regular background PM10 levels.
Next, the ABS provides data on the proportion of the population at risk from high levels of PM10 (ABS 2012).
Table 5.3: Prevalence of selected health conditions
Condition Prevalence
Cardiovascular disease 5%
Lung conditions 2.7%
Asthma 9.6%
Source: ABS (2012)
This information can then be combined with population data to arrive at an estimate of the population in each distance class that has each health condition.
The Department of Environment and Conservation NSW (2005) report provides a set of annual health costs from 10ug/m3 of PM10 (above a 7.5ug/m3 threshold). These annual costs can be combined with the fact that, according to Morgan et al (2010), there is an average of 17 bushfire days a year in Sydney to give the following annual health costs of PM10 in different regions:

Deloitte Access Economics Commercial-in-confidence 33
Table 5.4: Estimated annual health costs from 10ug/m3 of PM10 in Sydney
Distance Estimated Population Cost ($m)
>20km 4,013,863 2.94
10-20km 466,728 0.34
5-10km 233,364 0.17
1-5km 46,673 0.03
0-1km 0 0 Source: DAE estimates
These figures can be combined with those in Table 5.2 to arrive at a total annual estimated cost of bushfire smoke in Sydney of $8.2m.
5.6.4 Ecological benefits
There is the potential for active management of forests to result in net ecological benefits. For example, Australian Cypress in the Brigalow-Nandewar region has a tendency to grow in thick stands that limit the growth potential of the cypress as well as preventing a diversity of trees to develop. Active management by thinning cypress trees in this case could have ecological benefits by allowing the development of large cypress trees and a more diverse ecological basis.
There will not be a general approach to valuing ecological benefits as there can be for the other costs identified above. Instead, consideration will have to be given to the current ecological environment in the case study area and the likely ecological environment in the long run under the policy case.
In a situation where the ecological environment is expected to change it may be possible to value this change. For example, the NSW Office of Environment and Heritage’s BioBanking scheme aims to create a market in ecological areas and record data on market prices. The valuations within that scheme rely on a fixed formula, as detailed in the BioBanking Assessment Methodology. (Department of Environment and Climate Change NSW 2008). A review of the BioBanking scheme found that credits were sold at a value between $2500 and $9500 per credit (Office of Environment and Heritage 2012). Assuming that the Office of Environment and Heritage has represented the preferences of the community in the Assessment Methodology, the value of different ecological areas can be assessed using values contained in the BioBanking register.
For example, the ecological area under the baseline may correspond to a BioBanking trade that values a similar ecological environment at $5000 per credit. The value of the ecological area under the policy case may be equivalent to $7500 per credit. This would give a net value of the policy of $2500 per credit. This per credit value can then be turned into a per hectare value by investigating the relationship between credits and hectares in the relevant BioBanking transactions. This valuation approach could be used to test and quantify findings similar to those in Jurskis and Underwood (2013), who argue on the basis of historical records that there could be ecological benefits from more active fuel reduction burning in the Sydney Sandstones area
However, in many cases it may be that ecological benefits are treated qualitatively.

Deloitte Access Economics Commercial-in-confidence 34
6 Potential case study regions Chapter 5 presented the methodology for undertaking a full CBA of a change in policy of bushfire management in Australia. The full CBA would require analysing how a change in policy would impact on specific case studies in Australia. Potential Case studies should be judged according to their attributes against a set of criteria. This will help ensure that the CBA is relevant and informative. Criteria for selection include:
it is an area where there is a current and ongoing threat from bushfire;
the area is important, for social or economic reasons, that is home to a number of people, or where there is a significant amount of infrastructure;
there is access to data sources and other literature; and
there is the potential to implement different bushfire management policy options.
Table 6.1: Summary of proposed case study areas
Region Threat High socio-economic
impact
Data Policy incentive
Blue Mountains
The Pilliga
North Coast
Melbourne Fringe
South-west WA
Gippsland
6.1 Blue Mountains
The recent bushfires in the Blue Mountains in NSW at the end of 2013 have once again highlighted the region’s vulnerability to extreme bushfire events. Indeed, over the last two decades there have been a number of instances of mega-bushfires in the Blue Mountains.
A bushfire during the 1993-94 fire season in the Sydney, Blue Mountains and North Coast of NSW burnt more than 800,000 hectares of land.
During 1997-98 a bushfire in the Hunter, Blue Mountains and Shoalhaven region of NSW burnt more than half a million hectares of land.
Almost 750,000 hectares of land was burnt in Greater Sydney during the 2001 – 2002 bushfire season.
During the 2002-03 bushfire season, 1.46 million hectares of land was burnt along the east coast of NSW and in the Greater Sydney region.
The Blue Mountains have become home to a growing number of residents. This combined with a rising prevalence of peri-urban properties places residents and homes at risk of bushfire. There are around 38,000 homes which are within 200 metres of bushland in the Blue Mountains, and around 30,000 of these are within 100 metres (Climate Council 2013).
Deloitte Access Economics Commercial-in-confidence 35
Further, the impact of bushfires in the Blue Mountains area also affects Sydney’s 4.5 million residents. Smoke from the bushfires in the Blue Mountain affects the air quality.
There is significant availability of data and literature examining the costs of bushfire and analysing the impact of bushfire management policies in the Blue Mountains.
Australian Emergency Management maintains disaster information data in New South Wales going back to 1926. Data includes the number of buildings destroyed, the number of people killed, estimate of the cost of the damage to property and the amount of land that was burnt.
The NSW Department of Environment and Heritage outlines NSW State Government strategic planning for coping with bushfires in NSW and holds a database of bushfire research as it affects NSW, including costs and health impacts.
The Insurance Council of Australia details the original and 2011 Normalised Cost of bushfires in the Blue Mountains.
The Australian Bureau of Meteorology holds data on current and past climate conditions in the Blue Mountains area, including maximum and minimum daily temperatures, rainfall and climate extremes.
The NSW Rural Fire Service details a current fire danger map, and publishes annual reports which details historical incidents by region including the Blue Mountains, and outlines hazard mitigation works which have been undertaken in NSW.
The Bushfire CRC has a database of research into the bushfires, including lessons from recent bushfire events in the Blue Mountains and predictions of bushfire threat in the Blue Mountains region.
Finally, there are a number of examples where previous bushfire management practices have been successful in preventing the spread and extent of damage from bushfires in the Blue Mountains. This suggests the Blue Mountains is an area which is well suited to further analysis of potential bushfire management policies. Price and Bradstock (2010) found that the probability of fire is significantly reduced for up to 5 years following prescribed burning in open eucalypt forest in the Blue Mountains. Given existing policies there is significant potential for new bushfire policies to have a great impact on the area. Price and Bradstock (2011) found that an annual prescribed burning program of around 5% of the landscape would be required to bring the amount of fuel reduction burning to a similar level to that which is undertaken in south-west WA.
The above analysis indicates that a change in bushfire management could potentially make a significant difference in the Blue Mountains. Hence, further research into the potential costs and benefits would be beneficial. The Parliamentary Library of NSW, for example, reviewed the available literature and found evidence that prescribed burning in the Blue Mountains was ineffective in some cases, because large areas of the Blue Mountains were not conducive to achieving successful results. Prescribed burning may have ‘cured’ the understory in the Blue Mountains and made it more vulnerable to bushfire. In this instance, also utilising mechanical removal of trees may help to limit the extent of this vulnerability.

Deloitte Access Economics Commercial-in-confidence 36
6.1 The Pilliga
The Pilliga, located in north-central NSW has a long and ongoing experience with severe bushfires. The January 2013 bushfires were among the worst in the area’s history, destroying around 12,000 livestock and more than 50 homes (EMA 2014). The Insurance Council of Australia estimates that total insured losses of the bushfire were around $35 million. The climatic and fuel conditions apparent in the area mean that there is an on-going risk of future bushfire activity in the area.
The Pilliga is located within the Warrumbungle Shire, which has a population of almost 10,000. Fires in the Warrumbungles in 2013 came within 30km of the town of Coonabarabran. Employment and economic activity in the area has traditionally been used for agricultural and forestry purposes but is also an important wildlife conservation area. The area is also the site of a number of internationally important optical telescopes, in particular the Siding Spring Observatory. Bushfires in the region have the potential to impact on economic activity in the region. However, the region is somewhat more remote, and therefore home to fewer residents, than other areas of NSW affected by bushfire.
Available data relevant to an assessment of bushfire management policies in the Pilliga is broadly similar to what is available in the Blue Mountains above.
Mechanical removal of the Australian Cypress contained within the Pilliga combined with the fuel reduction burning of the hardwood areas could improve bushfire management in the region. The mechanical treatment of the cypress would have two primary impacts on the area; firstly it would improve access to the thick regrowth and, secondly, would help to reduce overall fuel loads. This could be complemented by fuel reduction burning within the hardwood areas where feasible to achieve a landscape scale reduction in overall fire risk which has obvious advantages to the surrounding community as well as the environment.
6.2 North Coast
The North Coast of New South Wales has experienced some bushfire activity over the last decade. The 2002 Black Christmas bushfires which took place across NSW and the ACT included the Coffs Harbour and surrounding regions. However, while the region experiences smaller bushfires, unlike other areas of NSW the region has not experienced a significant number of severe fires.
Bushfires pose a threat to regional economic and social activity in the area as native eucalypt forests may occur in close proximity to rural residential, village or town areas. The Nambucca State Forest, for example, which forms the northern and western boundaries of the township of Nambucca, and Boambee, Orara East and Wedding Bells State Forests are adjacent to the residential areas of the Coffs Harbour region, which is home to almost 70,000 residents. Further, the forests themselves provide a source of employment and economic activity as the timber industry is an important industry in the Mid North Coast region. Indeed, together with agriculture, timber harvesting has been an important source of economic activity in the region since European Settlement first took place in the area (NSW Department of Planning 2010). Hence, bushfires in this area may have a significant impact on the economic and social outcomes of the region.

Deloitte Access Economics Commercial-in-confidence 37
Available data relevant to an assessment of bushfire management policies on the North Coast is broadly similar to what is available in the Blue Mountains above.
Climate conditions in the region mean that fuel reduction burning can safely take place only within a narrowly defined period. Further, as there is presently not a viable market for residues in the area all logging slash, including heads and butts, remain on site after harvesting. As a result, this area poses particular challenges for fuel management. A more flexible approach that can incorporate fuel reduction burning and mechanical removal in an optimal way may, therefore, have benefits.
6.3 Melbourne fringe
The area surrounding the Melbourne fringe has experienced a series of particularly severe bushfires culminating in the Black Saturday fires in February 2009 which were amongst the worst bushfires to affect Australia in recent history. The bushfires directly caused the death of 173 people and caused injuries to 414 more. The bushfires resulted in insured losses of around $1.07 billion and destroyed more than 2,000 homes and more than 60 businesses.
The Black Friday bushfires in 1939 on the Melbourne Fringe (including in Dromana, Arthurs Seat, Frankston, the Dandenong Ranges, and Mt Macedon) were large enough to impact on the city of Melbourne causing the deaths of 36 people in Victoria.
Bushfires in the Dandenong Ranges in 1969 came within 20 kilometres of the city of Melbourne; the bushfires destroyed almost 450 homes and left 2,500 people homeless.
Bushfires in 1969 in Lara and the Melbourne Fringe caused the death of 23 people and injured 100 more. Around 230 fires were burning, with 21 of these classified as highly destructive. The bushfires caused the destruction of 230 homes and 21 buildings.
Ash Wednesday in 1983 caused the death of 75 people and destroyed 2,300 homes.
Bushfires in the Dandenong Ranges and Morning Peninsula in 1997 followed on from high temperatures and dangerous winds. The fires caused the deaths of 3 people, and destroyed 43 homes. The total insured cost was estimated to be $29 million.
There are significant economic and social impacts from bushfires around the Melbourne Fringe which have the capacity to cause widespread destruction, including posing a threat to lives and property and the potential to cause significant damage to the environment and key infrastructure.
There are immediate and ongoing social costs for individuals who have experienced trauma as a result of bushfires. Communities affected by the 2009 Black Saturday bushfires continue to feel the impact of these fires including on mental health and the practical capacity to rebuild the area.
Key infrastructure in the area, water supply in particular, is heavily impacted by bushfire. The strong growth in Melbourne’s population over recent years caused an increase demand for water storage capacity in the area and more public forested land was made available for this purpose. The 2003, 2006-2007 and 2009 bushfires had an immediate and ongoing impact on Victoria’s catchment inflows. The 2009 fires in particular affected Victoria’s Central Highlands and the Wallaby Creek and other catchment areas (Ryan 2013).
Other consequences of the bushfire are on the environment and wildlife. The Royal Commission into the 2009 Black Saturday bushfires highlighted that bushfires also

Deloitte Access Economics Commercial-in-confidence 38
result in the death of flora and fauna; damage to soil, plants, seeds and fungi; damage to waterways and aquatic species and habitat loss.
There is some availability of data and literature examining the costs of bushfires and analysing the impact of bushfire management policies in the Melbourne Fringe.
Australian Emergency Management maintains disaster information data in Victoria. Data includes the number of buildings destroyed, the number of people killed, estimate of the cost of the damage to property and the amount of land that was burnt.
The Insurance Council of Australia details the original and 2011 Normalised Cost of bushfires in and around the Melbourne Fringe.
The Department of Sustainability and Environment in Victoria is responsible for managing 7.7 million hectares of public land in Victoria.
Parks Victoria together with the Department of Environment and Primary Industries (DEPI) is responsible for prescribed burning in the state. DEPI maintains a database of annual programs of fuel management and treated areas including around the Melbourne Fringe.
The Country Fire Authority (CFA) in Victoria maintains information on warnings and incidents by town/suburb.
Local Councils administer permits for bushfire burning undertaken by individuals on their properties.
The Royal Commission into the 2009 Black Saturday bushfires highlighted that the level of prescribed burning taking place within Victoria was insufficient to reduce the risk from bushfire and recommended that 5 per cent of public land be treated annually. The Commission outlined that prescribed burning formed part of a broader bushfire management policy which also included: building design, defendable space, community education and fire suppression.
However, while the Commission did not identify the relative benefits of a bushfire policy which also included mechanical removal of trees and combustible biomass, it did note that there is a lack of knowledge around the impacts of bushfire management policies on biodiversity. Similarly, Ryan (2013) outlined the benefits of gaining a more comprehensive understanding of a wide range of bushfire management policies on local fauna. In particular this would be useful to gain a better understanding on the impact of different policies on particular species (Ryan 2013).
6.4 Gippsland
The Gippsland region of Victoria has experienced frequent bushfires since European settlement in the area. More recently, bushfires in early 2014 near the Snowy River National Park and fires in the region in 2013, which destroyed around 85,000 hectares of land over a 6 week period, highlight the impact that bushfires are continuing to have on the area.
Bushfires in February 1851 known as Black Thursday caused the deaths of 12 people and burned more than 5 million hectares of Victoria, this is around one quarter of the State.
Deloitte Access Economics Commercial-in-confidence 39
In February 1932 bushfires in the Gippsland region caused the death of around 9 people and caused significant losses to the timber industry.
Bushfires in Gippsland in March 1965 caused the death of 3 people and destroyed 4,000 livestock.
The January 2006 bushfires which caused the death of 4 people and resulted in $22 million in insured loses took place across Victoria, including in the Gippsland area.
Available data relative to an assessment of bushfire management policies in the Gippsland region is broadly similar to what is available for the Melbourne Fringe.
There is the potential for future analysis of the impact of a change in bushfire management policy in the Gippsland region to build on existing research which has already begun to address the relative benefits of mechanical removal of trees. Proctor and McCarthy (2013) have demonstrated that a policy change could achieve a positive impact on addressing bushfire management in the area. The authors studied changes in the fuel-fire hazard period after thinning relative to un-thinned sites, finding that the fuel-fire hazard was reduced in thinned sites with potential impacts being lower fire risk. However, the authors also found that an increase in burn-out times which extended extinguishment were also apparent. CBA analysis could be helpful in determining the most appropriate mix of hazard reduction burning and mechanical removal in the Gippsland region.
6.5 South-west Western Australia
The frequency, size and impact of unplanned fires in south-west Western Australia have risen significantly since 2000. The bushfires around the outer Perth area during early 2014 demonstrate that the south-west of WA faces significant immediate and on-going threat from bushfires.
The proposed areas to undertake the full CBA are adjacent to a number of population centres. The land in the proposed areas is also important for its agriculture and forestry purposes. Further, the sites outlined below have been chosen because of the potential for effective implementation of mechanical removal of fuel. These areas have been identified by the Forest Products Commission of WA within the current (2014) harvesting plan and within the Department of Parks and Wildlife Indicative Burn Plans for the South West Region (Spring 2013-Autumn 2017).
Hadfield is around 14 km from the town of Harvey which has a population of more than 2,500. Land in the area is used for production forestry and agriculture. The Forest Products Commission is currently undertaking biomass removal for a chip trial.
Nanga is situated around 16km from Waroona which has a population of 2,500 and Dwellingup with a population of 344. Land in the area is used for production forestry, high-conservation value (old growth) forest, agriculture and as a National Park. The Forest Products Commission is currently undertaking commercial biomass removal for a chip trial.
Hunt is located around 32km south-west of Collie with a population of almost 7,500 and Boyup Brook with a population greater than 1,000. Land use in the area is primarily for production forestry, conservation and agriculture. The Forest Products Commission is currently undertaking commercial biomass removal for green firewood.
Deloitte Access Economics Commercial-in-confidence 40
The areas under consideration are proximate to Perth which has a population of around 2 million residents.
The Department of Parks and Wildlife (DPAW) in Western Australia is responsible for maintaining 2.3 million of Western Australia’s 18 million hectares of forests and woodlands and for undertaking prescribed burning in the state. Of this, more than one million hectares of south-west forest is in National Parks, conservation parks and nature reserves.
The Department maintains a database of: burns planned for lighting today; active burns from previous lighting; and indicative burn plans.
The Department maintains a Forest Management Plan which includes area of land covered by the Department and maps detailing the same.
Local Government and Bush Fire Brigades are also responsible for undertaking fuel reduction burning. For example, the Shire of Collie undertakes fuel reduction burning on public land. These practices are regulated by the Office of Bushfire Risk Management as part of the Department of Fire and Emergency Services. As in the Blue Mountains in NSW, and the Melbourne Fringe in Victoria, there have been numerous studies to understand the impact of bushfire management policies in the south-west of WA.
Attiwill and Adams (2012) reviewed the historical experience and bushfire management practices in south-western WA, including analysis by Sneeuwjagt (2008) of a long-term data set over 46 years that found a significant inverse relationship between average area burnt and previous fuel-reduction treated areas.
Analysing the Warren District Estate of south-western WA, Boer et al (2009) found that the number and severity of unplanned fires decreased with an increase in the extent of planned reduction burning.
Investigation of other potential bushfire management activities, including combined mechanical removal of trees and burning, could strengthen the existing analysis and provide a basis for comparing a broader range of policy options. Further, the Department of Parks and Wildlife in WA have given in principle support for future trials.
6.1 Other potential case study sites
In summary, case studies based on the Blue Mountains, Melbourne fringe or South-west WA appears to be most prospective. While other regions may be relevant such as the North-Coast (discussed above) and South-Coast of New South Wales and the drier forest areas of Tasmania, further scoping analysis would be needed. Some regions that could be investigated further in a full CBA are discussed below.
6.1.1 South-Coast of NSW
A number of small communities are situated along or adjacent to the South-Coast of NSW native eucalypt forests. The region has a mix of production forestry, agriculture and tourism sectors as well as a number of National Parks. There is community interest in bushfire management practices in the area due to public safety concerns. The number of wood processing and bioenergy facilities in the area may also provide a market for the biomass removed, the sale of which is an important aspect of the fuel reduction treatment.

Deloitte Access Economics Commercial-in-confidence 41
6.1.2 Tasmania
A large number of bushfires in Tasmania over recent years have significantly increased the cost of bushfire management in the area, in particular the suppression of bushfires. For example, Forestry Tasmania spent $132,000 in 2010-11 on 36 bushfires events, $304,000 in 2011-12 on 51 bushfire events and $5.1 million in 2012-13 on 55 bushfire events.
Currently fuel reduction burning is restricted to the northern and eastern regions of the state and in the drier forest types, and is not undertaken in the wet eucalypt forests of the state. A recent study by Rothe (2013) assessed the current and potential use in Tasmania of forest biomass for energy, this includes biomass harvesting across a range of forest types. This research suggests that including the mechanical removal of trees as part of existing bushfire management practices, could potentially have an impact in the State.

Deloitte Access Economics Commercial-in-confidence 42
7 Applying the methodology The preceding two chapters outlined, firstly, a theoretical approach to modelling the cost and benefits of different bushfire management policies and, secondly, presented a number of case study options. This chapter focusses on one chosen case study region as an example, The Blue Mountains, and applies the methodology outlined in Chapter 5.
It should be noted that this is an indicative example to demonstrate that, with the available data and research, it is possible to make some estimates of the relative costs and benefits of different bushfire policy approaches. While this is not a full CBA it is designed to identify the public policy merits of undertaking a further detailed CBA. In this case it does provide evidence that there is a sound case to invest in a full CBA.
Baseline natural disaster costs
An indicative estimate of the baseline disaster costs considers the average annual costs of bushfires in the Blue Mountains. This is estimated by combining the information contained with the ICA Historical Disaster statistics with the EMA database. These databases only contain information on insured losses for two bushfires in the Blue Mountains:
The Black Christmas bushfires in 2001 took place in NSW and ACT. The bushfire caused $131 million in 2011 normalised insured costs and burned 753,314 hectares.
The bushfires in late 2013 in NSW had an estimated insured cost of $183 million and burned a total of 118,000 hectares across the state.
The average insured loss in these two events was around $157.2m. Longer run historical data is available which indicates that there have been five major fires in the Blue Mountains region since 1939 – indicating an average frequency of around 15 years. An insured loss of $157.2m every 15 years suggests average annual loses of around $10.5m a year. It should be noted that this is not an actuarially accurate estimate, but rather an approximation taken from readily available information. The same approach indicates an average area burnt each year of around 29,000 hectares.
Using this information we can then estimate the total economic cost of the bushfires. The BTE (2001) total economic cost multiplier for bushfire of 2.86 is used to estimate the total economic cost of these bushfires. This gives an average annual total economic cost in the baseline of almost $30m.
Fuel reduction costs are estimated for the baseline case, prescribed burning in NSW between 1977 and 2007 was estimated to be around 0.5% of the total area. The local government area of the Blue Mountains District covers 143,000 ha of land of which around 70% of land is included in the Blue Mountains National Park, and 11% of total land area is in private ownership. This suggests that around 500.5 hectares of public land was subject to fuel reduction. At a cost of $115 per hectare (based on indicative average treatment costs in Tasmania), this gives a total treatment cost of around $58,000 a year. This could be compared to Florec et al (2012) which indicates costs of around $80 per hectare.

Deloitte Access Economics Commercial-in-confidence 43
The carbon emission costs from bushfire are estimated at around $34m a year (a total of around 29,500 ha a year valued at a little over $1000 per ha). The health costs from PM emitted during bushfires in NSW are valued at $8.2m a year (as described in section 5.6.3).
The table below gives a rough indication of the baseline cost of bushfires using data that is readily available.
Table 7.1: Estimating baseline costs
Average annual cost ($)
Total economic cost 29,972,800
PM10 8,246,141
Carbon costs 34,038,753
Fuel reduction costs 57,558
Total average annual baseline costs 72,315,252
Estimating alternative policy costs
Bushfire costs are estimated by adjusting the total area burnt according to estimates of land treated with fuel reduction and the associated reduction in area burnt in bushfires. McCaw (2013) notes that fuel reduction burning of 5% of the landscape around Sydney could result in the halving the area burnt. The reduction in area burnt is then related to a reduction in the total economic cost and the associated emissions and health costs.
In this indicative CBA we have simply reduced the total economic costs without attempting to calculate each component of these costs. In a full CBA we would attempt to value each component of the total economic costs in both the baseline and policy cases. For example, one benefit of increased fuel reduction is a likely reduction in annual suppression costs (i.e. costs of fighting fires as they occur), based on reducing the intensity of future fires and their rate of spread and spotting behaviour. This is a component of the total economic costs and would be investigated in detail as part of a full CBA. In the United Sates, Thompson et al (2013) found that suppression costs could be reduced by 30% within treated areas and by at least 10-12% across a landscape due to less severe future fires.
Hectares treated with fuel reduction burning would increase to 5% of the total area of the Blue Mountains, and the hectares treated with combined mechanical fuel removal (e.g. to remove excess trees on overstocked stands and other biomass material) and fuel reduction burning would increase to 1% of the total area. This would likely cause the total cost of bushfires to fall by half. Note that this assumes a one to one relationship between area burnt and losses, this is unlikely to hold in practice but is used here as an indicative relationship.
Given the variability in revenue generated from mechanical fuel removal (discussed in Section 5.4.2), it is assumed in this example for the Blue Mountains that mechanical treatment costs would average $300 per hectare, based on the mechanical removal of 10 tonnes per hectare at a net cost of $20 per tonne plus an allowance for some post-harvest burning and further distances from market.
Carbon emission costs are estimated at around $18.5m. There is both an increase in costs due to higher fuel reduction burning and a decrease in costs from reduced bushfires. On net this results in a decrease in overall carbon emissions.

Deloitte Access Economics Commercial-in-confidence 44
PM10 costs are assumed to be half those under the baseline (this implies a direct relationship between area burnt and release of PM10).
Table 7.2: Total policy cost
Average annual cost ($)
Total economic cost 14,986,400
PM10 4,123,071
Carbon costs 18,546,579
Fuel reduction costs 875,875
Total average annual policy costs 38,531,924
Comparing costs
These results indicate that increased fuel reduction activity in the Blue Mountains could generate net benefits of around $34m a year (equivalent to around $483m in perpetuity).
Table 7.3: Net Benefits
Average annual cost ($)
Total average annual baseline costs 72,315,252
Total average annual policy costs 38,531,924
Net benefits 33,783,328
These results include the additional costs of treatment, potential revenue from the sale of mechanically recovered matter and costs related to particulate matter and carbon emissions. It should be noted that there are a number of areas of uncertainty in these results. For example, the overall reduction in area burnt is based on a single source rather than drawing on the full range of literature discussed in this scoping study. This is important as the response of fire to fuel reduction is uncertain, site specific and can vary depending on specific weather conditions. Further, the cost of carbon emissions does not take into detailed account the carbon dynamics at a landscape scale (e.g. forest growth stage, fire intervals) and is highly variable depending on the price of carbon emissions used. Areas of uncertainty such as these would be a particular focus in a full CBA.
Given the small incremental cost in the alternative policy, these results indicate a large benefit cost ratio of around 6.0:
Table 7.4: Cost benefit ratio
Average annual cost ($)
Incremental benefits 40,591,770
Incremental costs 6,808,443
BCR 6.0
These results should be interpreted as supporting a detailed cost benefit analysis of increased fuel reduction rather than providing evidence. Given the uncertainty surrounding the inputs into this indicative example, it is likely that, in a full CBA, that BCR would decline.

Deloitte Access Economics Commercial-in-confidence 45
For example, the relationship between area burnt and insured losses is likely to be weaker than in the example while the cost of fuel reduction may be higher.
That is, the aim of this chapter is to demonstrate how a CBA could work. This example may not exactly apply in the context of the Blue Mountains and will depend on a number of other factors including the actual amount of fuel reduction burning and mechanical reduction undertaken and the price that the output of the mechanical removal could be sold for.

Deloitte Access Economics Commercial-in-confidence 46
8 Next steps This report was intended to be a scoping study into the feasibility of conducting a full cost benefit analysis of alternative fuel reduction policies (including the combined use of fire and mechanical removal of trees). A critical part of the scoping study was to identify whether the level of information to support a CBA was available.
Overall, there is a large amount of information available on the costs and benefits of different approaches to managing fuel in Australia’s bushland. There are also a range of approaches available to modelling the economic costs associated with bushfire.
As a result, we believe that there is a strong case for undertaking a detailed CBA. This CBA could be conducted in conjunction with a small field trial program to further investigate the operational aspects of fuel reduction treatments and information gathered during the trial program could provide even more relevant data for the CBA.
More broadly, we believe that this scoping study has identified that there is prima facie evidence of the potential public policy benefits of alternative approaches to fuel management.

Deloitte Access Economics Commercial-in-confidence 47
References ABS (2012), “Australian Health Survey: First Results, 2011-12”,
http://www.abs.gov.au/AUSSTATS/[email protected]/DetailsPage/4364.0.55.0012011-12?OpenDocument
Australian Institute of Health and Welfare (2014), “Expenditure data”, http://www.aihw.gov.au/expenditure-data/”,
Attiwill P.M and Adams. M.A (2013), “Mega-Fires, inquiries and politics in the eucalypt forests of Victoria, south-eastern Australia.” Forest Ecology and Management 294:45-53.
Bioenergy Australia (2012), “Bioenergy in Australia: status and opportunities”, http://www.bioenergyaustralia.org/data/reports/BIOENERGY%20IN%20AUSTRALIA%20Rev%201.pdf
Boer, M. M., Sadler, R. J., Wittkuhn, R. S., McCaw, L., Grierson, P. F. (2009), “Long-term impacts of prescribed burning on regional extent and incidence of wildfires – Evidence from 50 years of active fire management in SW Australian forests”, Forest Ecology and Management 259:132-142.
Bradstock R.A., Boer, M.M., Cary, G.J., Price, O.F., Williams, R.J., Barrett, D., Cook, G., Gill, A.M., Hutley, L.B.W., Keith, H., Maier, S.W., Meyer, M., Roxburgh, S.H. and Russell-Smith, J. (2012) “Modelling the potential for prescribed burning to mitigate carbon emissions from wildfires in fire-prone forests of Australia”, International Journal of Wildland Fire 21:629-639.
Bureau of Transport Economics (2001), “Economic Costs of Natural Disasters in Australia, Report 103”, <http://www.bitre.gov.au/publications/2001/files/report_103.pdf>
Canadian Council of Forest Ministers (2005), “Canadian Wildland Fire Strategy: A vision for an innovative and integrated approach to managing the risks. A report prepared by the Canadian Wildland Fire Strategy Assistant Deputy Ministers Task Group”. <http://cfs.nrcan.gc.ca/bookstore_pdfs/26218.pdf>
CSIRO (2011), “Opportunities for Bioenergy: An assessment of the environmental and economic opportunities and constraints associated with bioenergy production from biomass resources in two prospective regions of Australia”, Report prepared for the Department of Agriculture, Fisheries and Forestry, December.
Chen (n.d.), “Counting Bushfire-Prone Addresses in the Greater Sydney Region”, <http://www.riskfrontiers.com/publications/FireAUS_NSW_paper.pdf>
Chen, L., Verrall, K. and Tong, S. (2006) “Air particulate pollution due to bushfires and respiratory hospital admissions in Brisbane, Australia”, International Journal of Environmental Health Research, 16(3). pp. 181-191.

Deloitte Access Economics Commercial-in-confidence 48
Clean Energy Regulatory (2014), “Fixed price 2012-2015”, <http://www.cleanenergyregulator.gov.au/Carbon-Pricing-Mechanism/About-the-Mechanism/Fixed-Price-2012-15/Pages/default.aspx>
Climate Council (2013), “Be Prepared: Climate Change and the Australian Bushfire Threat”. <http://www.climatecouncil.org.au/bushfirereport/>
DCCEE (2012), “Australian Greenhouse Gas Emissions Information System (AGEIS)”, <http://ageis.climatechange.gov.au/Reports/2012_2010_Australia_LULUCF.pdf>
Department of Environment and Climate Change NSW (2008), “BioBanking Assessment Methodology”, <http://www.environment.nsw.gov.au/resources/biobanking/08385bbassessmethod.pdf>
Department of Environment and Conservation NSW (2005), “Air Pollution Economics: Health Costs of Air Pollution in the Greater Sydney Metropolitan Region”, <http://www.environment.nsw.gov.au/resources/aqms/airpollution05623.pdf>.
Deloitte Access Economics (2013), “Building Our Nation’s Resilience to Natural Disasters” for the Australian Business Roundtable for Disaster Resilience and Safer Communities, http://australianbusinessroundtable.com.au/white-paper
EMA (2014), “DISASTER INFORMATION”, <http://www.emknowledge.gov.au/disaster-information/>
Environment Australia (1999), “Emissions Estimation Technique Manual for Aggregated Emissions from Prescribed Burning and Wildfires”, http://www.npi.gov.au/system/files/resources/cf3d7ecb-b57f-70d4-e976-03cb241c888e/files/burningff.pdf
EPA Victoria (2013), “Bushfires and air quality”, http://www.epa.vic.gov.au/your-environment/air/bushfires-and-air-quality
Florec, V., Pannell, D., Burton, M., Kelso, J., Mellor, D. and Milne, G. (2012), “Economic Analysis of bushfire management programs: a Western Australian perspective”, http://www.bushfirecrc.com/sites/default/files/managed/resource/final_florec.pdf
Florec, V., Pannell, D., Burton, M., Kelso, J., Mellor, D. and Milne, G. (n.d.), “Economic Analysis of prescribed burning for wildfire management in Western Australia”, http://www.bushfirecrc.com/sites/default/files/managed/resource/20130515_florec_presentation-raf_2.pdf
Forest Fire Management Group (2012), “National Bushfire Management Policy Statement for Forests and Rangelands”, <http://www.dpac.tas.gov.au/divisions/osem/2013_tasmanian_bushfires_inquiry_report/tasmanianbushfiresinquiry_documents/submissions/State_Fire_Management_Council_-_SFMC_3_attachment_2.pdf>
Gould, J. S., McCaw, W. L., Cheney, N. P., Ellis, P. F., Knight, I. K. and Sullivan, A. L. (2008), “Project Vesta: Fire in Dry Eucalypt Forest Fuel Structure, Fuel Dynamics and Fire

Deloitte Access Economics Commercial-in-confidence 49
Behaviour”, <http://www.csiro.au/Outcomes/Safeguarding-Australia/VestaTechReport.aspx>
Hartsough, B. R., Abrams, S., Barbour, R. J., Drews, E. S., McIver, J. D., Moghaddas, J. J., Schwilk, D. W., Stephens, S. L. (2008), “The economics of alternative fuel reduction treatments in western United States dry forests: Financial and policy implications from the National Fire and Fire Surrogate Study”, Forest Policy and Economics 10:344-354.
Hensher, D. A., Rose, J. M., Ortúzar, J. D. and Rizzi, L. I. (2009) "Estimating the willingness to pay and value of risk reduction for car occupants in the road environment" Transportation research part A: policy and practice 43 (7), 692-707
Insurance Council of Australia (2014), “Historical Disaster Statistics”, <http://www.insurancecouncil.com.au/industry-statistics-data/disaster-statistics/historical-disaster-statistics>
IPCC (Intergovernmental Panel on Climate Change) (2012) “Managing the Risks of Extreme Events and Disasters to Advance Climate Change Adaptation. A Special Report of Working Groups I and II of the Intergovernmental Panel on Climate Change”, Cambridge University Press, Cambridge and New York, 582pp.
IPCC (2013) “Climate Change 2013: The Physical Science Basis: Working Group I Contribution to the IPCC 5th Assessment Report – Changes to the Underlying Scientific Technical Assessment”, <https://www.ipcc.ch/report/ar5/wg1/>
Jurskis, V. and Underwood, R. (2013) “Human Fires and Wildfires on Sydney Sandstones: History Informs Management”, Fire Ecology Volume 9, Issue 3, 2013.
Keating A and Handmer J (2013) “Future potential losses from extremes under climate change: the case of Victoria, Australia”. Victorian Centre for Climate Change Adaptation Research, Melbourne.
Keeley, J.E., Fotheringham, C.J., Mortiz, M.A., (2004) “Lessons from the October 2003 Wildfires in Southern California”. Journal of Forestry, <http://nature.berkeley.edu/moritzlab/docs/Keeley_etal_2004.pdf>
McCaw, W. L. (2013), “Managing forest fuels using prescribed fire – A perspective from southern Australia”, Forest Ecology and Management 294:217-224.
Morgan, G., Sheppeard, V., Khalaj, B., Ayyar, A., Lincoln, D., Jalaludin, B., Beard, J., Corbett, S., Lumley, T. (2010), “Effects of Bushfire Smoke on Daily Mortality and Hospital Admissions in Sydney, Australia”, Epidemiology 21:1, pp. 47-55.
OBPR (2008), “Best Practice Regulation Guidance Note Value of statistical life”, http://www.royalcommission.vic.gov.au/getdoc/98620bd9-5a71-4e1f-8922-7231790fee90/RSCH.040.001.0188.pdf
Office of Environment and Heritage (2012) “BioBanking review: Discussion paper”, <http://www.environment.nsw.gov.au/resources/biobanking/20120062bbrevdp.pdf>

Deloitte Access Economics Commercial-in-confidence 50
Proctor E. and McCarthy, G. (2014) “Thinning operations and fuel hazard in mixed-species forests in East Gippsland”. The Institute of Foresters of Australian, National Conference.
Price, O.F. and Bradstock, R.A. (2010) “The effect of fuel age on the spread of fire in sclerophyll forest in the Sydney region of Australia.” International Journal of Wildland Fire 19:35-45.
Price, O and Bradstock, R. (2011), “Quantifying the influence of fuel age and weather on the annual extent of unplanned fires in the Sydney Region of Australia”, International Journal of Wildland Fire 20:142-151.
Rothe A., (2013), “Forest biomass for energy: Current and potential use in Tasmania and a comparison with European experience”. Report on the sabbatical project, Weihenstephan-Triesdorf University of Applied Sciences, July < http://www.forestrytas.com.au/uploads/File/pdf/pdf2013/biomass_report_rothe_170713.pdf>.
Rural Industries Research and Development Council (2012), “Determining biomass in residues following harvest in Pinus radiata forests in New South Wales”, RIRDC Publication No. 11/177 <https://rirdc.infoservices.com.au/downloads/11-177>.
Ryan, M., (2013) “Adaptive silviculture in regrowth eucalypt forests in Victoria and the implications for water, wood, wildlife and wildfire”. Australian Forestry 76:173-182.
Schultz, C.A., Jedd, T., Beam, R.D., (2012) “The Collaborative Forest Landscape Restoration Program: A History and Overview of the First Projects”. Journal of Forestry 110:381-391.
Smith. S., (2002), “Bushfires”, New South Wales Parliamentary Library Research Service, Briefing Paper No 5/02.
Sneeuwjagt, R.J., (2008). “Prescribed burning: how effective is it in the control of large bushfires?,” In: Fire, Environment and Society: From Research to Practice, Bushfire Co-operative Research Centre and The Australian Fire and Emergency Service Authorities Council, Adelaide, South Australia, pp. 419-35.
Stephens, M., (2014) “Active forest management for multiple landscape benefits in the United States and Canada”, 2012 Gottstein Fellowship Report, Gottstein Trust.
Stephens, S.L., Boerner, R.E.J., Moghaddas, J.J., Moghaddas, E.E.Y., Collins, B.M., Dow, C.B., Edminster, C., Fiedler, C.E., Fry, D.L., Hartsough, B.R., Keeley, J.E., Knapp, E.E., McIver, J.D., Skinner, C.N. and Youngblood, A. (2012), “Fuel treatment impacts on estimated wildfire carbon loss from forests in Montana, Oregon, California, and Arizona”. Ecosphere 3(5): 1-17.
Stephens, S. L., Moghaddas, J. J., Edminster, C., Fiedler, C. E., Haase, S., Harrington, M., Keeley, J. E., Knapp, E. E., McIver, J. D., Metlen, K., Skinner, C. N. and Youngblood, A. (2009) “Fire treatment effects on vegetation structure, fuels, and potential fire severity in western U.S. forests”. Ecological Applications 19:305–320.

Deloitte Access Economics Commercial-in-confidence 51
Thompson, M.P., Valliant, N.M., Haas, J.R., Gebert, K.M., Stockmann, K.D., (2013) “Quantifying the Potential Impacts of Fuel Treatments on Wildfire Suppression Costs.” Journal of Forestry 111:49-58.
Williams J., (2012) “Exploring the onset of high-impact mega-fires through a forest land management prism”. Forest Ecology and Management 294:4-10.
Deloitte Access Economics Commercial-in-confidence 52
Appendix A: National forecasting methodology The forecasts provided in Section 2 are based on the historical frequency and severity of natural disasters in Australia. The process applied to generate the forecasts of insured losses can be summarised into the following steps;
5. Data on natural disaster events was gathered from the Insurance Council of Australia’s database of natural disasters (ICA, 2013)
6. For each state, the historical data was first used to identify the distribution of number of natural disaster events each year.
7. For the forecast period the number of natural disaster events per year was then simulated from this historical distribution. This gave a total number of events to be simulated for each state for each year of the forecast period.
8. Each natural disaster event was then simulated using a bootstrapping procedure. This involved randomly selecting a historical event from the ICA database and incorporating some additional random variation in severity of the event to represent tail risk not captured in historical data.
9. The bootstrapping procedure was carried out 1000 times to provide a reliable estimate of both the distribution of natural disaster costs that could be expected as well as the average annual natural disaster cost in each state.
10. The resulting simulated costs were then indexed to account for growth in the number of households and increases in the value of housing stock. This index was constructed from Australian Bureau of Statistics (ABS) population growth forecasts (ABS catalogue number 3236.0) as well as extrapolating trends in ABS data on housing value (ABS catalogue number 4102.0). It was assumed that growth rates for the value of housing in each state converged in the long run towards the national average.
To obtain predictions of total economic costs, the multipliers for different natural disaster types reported by the Bureau of Transport Economics (2001) were applied to the insured loss data.

Deloitte Access Economics Commercial-in-confidence 53
Appendix B: Non Market Valuations Carbon pollution
The cost of carbon emissions can be estimated in a variety of ways. It is important to note that the cost of carbon is usually measured as the marginal social cost of emitting one metric ton of carbon (or one metric ton of carbon dioxide). The main methods of pricing carbon emissions are based on modelling, observed market prices and defensive expenditure.
The predominant method of valuation relies on the use of Integrated Assessment Models (IAMs). These model the climate, the global economy and feedbacks between those two so as to determine the damage associated with carbon emissions.
The US Environmental Protection Agency estimated the social cost of carbon in 2010 as US$21 (20.90 AUD) per tonne of carbon dioxide, rising over time to US$26 per tonne in 2020 and US$33 per tonne in 2030 (prices are measured in 2007 dollars) (US EPA 2010). There is quite a large variation in the estimated cost of carbon emissions, with estimates depending heavily on the discount rate used (Tol 2008)
Table B.1: Estimates for Social Cost of Carbon
Study Year Cost of 1 ton of carbon dioxide (local currency)
Cost of 1 ton of carbon dioxide
(AUD)
US EPA 2010 US$21 $20.90
UK Department of Energy and Climate Change
2011 £15.30 $22.83
Nordhaus 2011 $12 (2005 Prices) $15.95
Wahba et al. 2006 $5-$49 (2006 Prices) $5.45 - $53.39
7Source: Nordhaus (2011), US EPA (2010), UK DECC (2011), Wahba et al. (2006)
The cost of carbon pollution in the environment can also be valued at market prices as a result of the Australian carbon pricing mechanism. It should be noted that the current carbon trading scheme reflects the marginal cost of abatement associated with the emission of one tonne of carbon. Therefore the market price of a carbon permit accurately reflects the cost of carbon pollution when the optimal quantity of carbon permits has been issued.
The current Australian carbon pricing mechanism has set the carbon price at $24.15 in 2013/14 and $25.40 in 2014/15 (Clean Energy Regulator 2013). From 2015/16, the price will be determined by the market, with current estimates suggesting a price around $12, due to the ongoing economic weakness in Europe (Commonwealth of Australia 2013). While these carbon prices are subject to change under the newly elected government, they

Deloitte Access Economics Commercial-in-confidence 54
are considered the best available estimates of the social cost of carbon in Australia, given available information.
It should be noted that valuing the social cost of carbon at a value higher than the market price for a carbon permit may open a cost-benefit analysis to manipulation. As the act of purchasing a carbon permit generates a net social benefit equal to the difference between the model price and market price for carbon, it is possible for a proposal that would otherwise fail a cost-benefit analysis to purchase carbon permits until it passes this analysis.
Particulate matter
The main methods of valuing the costs of air pollution are hedonic pricing, stated preference techniques or through use of a direct costing approach.
Hedonic pricing is usually measured by examining the price differential associated with distance to a project, in order to determine the cost associated with the externalities generated. It is particularly useful, as it is a form of revealed preference, and is very difficult to manipulate. However, hedonic pricing, if undertaken without a direct measure of air pollution (e.g. measures of particulate matter in the air), cannot disaggregate the price difference caused by a project into its components such as air pollution, noise pollution, loss of visual amenity and convenience. Furthermore, hedonic pricing relies on the fact that individuals are aware of and can appropriately value the cost of air pollution to their utility (Abelson 2007). Therefore, hedonic pricing serves as a way to measure the aggregate impact of a variety of measures, a point that should be noted to avoid double counting costs or benefits.
Contingent valuation studies involve asking individuals regarding their willingness to pay to reduce the impact of air pollution. Similarly to hedonic pricing, this valuation methodology assumes that individuals are sufficiently aware of and can appropriately value the impact of air pollution to their utility. The life-satisfaction approach was used by Ambrey et al (2012) to estimate the cost of air pollution from particulate matter in South East Queensland. This study yields an implicit willingness to pay of $6,000 per household for a one day decrease in the number of days pollution exceeds health guidelines in their local area.
An alternative method of measuring the impact of air pollution is to measure its medical impact on health and life expectancy of the population exposed to it. One method of valuing health and life is use of Quality Adjusted Life Years (QALY). The effects of air pollution can thus be measured in the number of QALYs lost as a result of the pollution (Coyle et al. 2003). This value can then be combined with an appropriate monetary value placed on life as determined elsewhere. A current estimate that is useful to apply is $151,000 as the value of a statistical life year (OBPR 2008). Thus the number of QALYs lost can be multiplied by a per life year value to produce a total cost associated with additional air pollution. The difficulty with this approach is that it is not straightforward to ascertain the number of QALYs likely to be lost as a result of a specific project, relative to the baseline scenario.
Using a two stage approach, combining exposure-response estimates relating Coarse Particulate Matter and health endpoints from epidemiological studies, and estimates of the costs of those health endpoints, the Department of Environment and Conservation NSW (2005) calculated the health costs of air pollution in the Greater Sydney Metropolitan

Deloitte Access Economics Commercial-in-confidence 55
Region. The health endpoints considered in the study include mortality, chronic bronchitis in adults, respiratory hospital admissions, cardiovascular hospital admissions, acute bronchitis in children, asthma attacks for both adults and children, and the cost of lost productivity due to restricted activity days for adults.
The values reported by the Department allow for the health costs of air pollution of a project to be calculated in terms of total emissions levels (costs per tonne of PM10 emitted) or in terms of changes in annual average concentration levels (costs per 10 µg/m3 increase in the PM10 concentrations).
The benefit of this study is that it produces estimates for three different subregions of the Greater Sydney Metropolitan Region, as listed in the tables below. The costs allow for comparisons between a macro, ‘regional level’ approach (using the values in Table B.2 and Table B.3) and a micro, ‘property level’ approach (using the values in Table B.4).
Table B.2: Annual health costs of air pollution across selected regions, per tonne of PM10 - with 7.5 µg/m3 threshold ($ 2003)
Lower bound Midpoint Upper bound
Sydney $28,000 $132,000 $235,000
Hunter $8,000 $35,000 $63,000
Illawarra $6,000 $26,000 $46,000
Source: Department of Environment and Heritage NSW (2005) – Table 6.3.1
Table B.3: Annual health costs of air pollution across selected regions, per tonne of PM10 – no threshold ($ 2003)
Lower bound Midpoint Upper bound
Sydney $45,000 $236,000 $427,000
Hunter $13,000 $63,000 $112,000
Illawarra $10,000 $47,000 $85,000
Source: Department of Environment and Heritage NSW (2005) – Table 6.4.1
Table B.4: Annual health costs of air pollution across selected regions, per 10 µg/m3 increase in PM10 annual average concentrations – with 7.5 µg/m3 threshold ($m 2003)
Lower bound Average Upper bound
Sydney $547.0 $2,598.5 $4,650.0
Hunter $174.0 $767.0 $1,360.0
Illawarra $69.9 $310.0 $550.0
Total $791.0 $3670.5 $6,550.0
Source: Department of Environment and Heritage NSW (2005) – Table A.1
An important issue related to the valuation of health impacts of air pollution is whether or not to assume a threshold. The use of a threshold (as in Table B.2 and Table B.4) assumes that there are no health impacts below the threshold concentration. This has the effect of producing lower total cost estimates.

Deloitte Access Economics Commercial-in-confidence 56
Given that the World Health Organisation has determined that there is no safe level of exposure to PM10, it is considered that the use of ‘no threshold’ cost estimates, such as those in Table B.3 is most appropriate, and sufficiently conservative for a CBA.
Ecosystems (Water, Biodiversity, Conservation)
The non-use valuation of ecological systems requires the use of stated-preference valuations, the most common of which would be contingent valuation studies. It should be noted that while such studies may not produce consistent measures of values (Dutton et al. 2010), they are a useful way to measure non-use values of an ecological site. It should be noted that non-use valuations of ecological systems often do not disaggregate value into the components of an ecosystem. Thus the valuation of a water system, ecological habitat and the biodiversity supported by it will usually be lumped together in such a valuation.
Furthermore, to ensure that the items being valued can be understood by the general population, abstract properties of ecosystems such as clean water or an absence of pollutants are usually translated into more meaningful indicators such as number of species saved (MacDonald et al. 2011).
By virtue of the contingent valuation methodology, it may not always be possible to separate non-use values from the declared valuations in a survey. People may implicitly value an ecological site due to a future use (e.g. visiting it in the future). Although surveys may attempt to disaggregate a declared value based on motivation (Subade 2005), not all of them do so. This is important to note to avoid double counting when summing values.
It is also important to note that the per person valuation of an ecological system is heavily dependent on the community being surveyed. Communities geographically closer to an ecosystem tend to value that ecosystem more highly (Kumar 2010). It is therefore important to discount per person values from surveys taken of communities close to a particular ecosystem when attempting to generalise the value of an ecosystem (Bennett et al 2007).
Lastly, an alternative means of valuing biodiversity is through the NSW Office of Environment and Heritage’s BioBanking scheme. The valuations within that scheme rely on a fixed formula, as detailed in the BioBanking Assessment Methodology. (Department of Environment and Climate Change NSW 2008). A review of the BioBanking scheme found that credits were sold at a value between $2500 and $9500 per credit (Office of Environment and Heritage 2012). Assuming that the Office of Environment and Heritage has represented the preferences of the community in the Assessment Methodology, any damage to species or ecosystems can be offset through the program.

Deloitte Access Economics Commercial-in-confidence 57
References for Appendix B
Abelson, P (2007) “Establishing a Monetary Value for Lives Saved: Issues and Controversies”, <http://www.dpmc.gov.au/deregulation/obpr/docs/Working-paper-2-Peter-Abelson.pdf>
Ambrey, C, Fleming, C, Chan, A (2012) “Estimating the cost of air pollution in South East Queensland: An application of the life satisfaction nonmarket valuation approach”, <http://equella.rcs.griffith.edu.au/research/file/6cce9401-4c6e-4180-b98a-303066d3e47c/1/2013-02-estimating-the-cost-of-air-pollution-in-south-east-queensland.pdf>
Clean Energy Regulator (2013), “About the carbon pricing mechanism”, <http://www.cleanenergyregulator.gov.au/Carbon-Pricing-Mechanism/About-the-Mechanism/Pages/default.aspx>
Commonwealth of Australia (2013) “Budget Overview”, <http://budget.gov.au/2013-14/content/overview/download/Overview_update.pdf>
Coyle, D, Stieb, D, Burnett, R, DeCivita, P, Krewski, D, Chen, Y, Thun, M, (2003), “Impact of Particulate Air Pollution on Quality-Adjusted Life Expectancy in Canada”, Journal of Toxicology and Environmental Health Vol 66, Issue 16-19, <http://www.tandfonline.com/doi/abs/10.1080/15287390306447#.UwaQDfmSzzg>
Department of Environment and Climate Change NSW (2008) “BioBanking Assessment Methodology”, <http://www.environment.nsw.gov.au/resources/biobanking/08385bbassessmethod.pdf>
Department of Environment and Conservation NSW (2005) “Air Pollution Economics: Health Costs of Air Pollution in the Greater Sydney Metropolitan Region”, <http://www.environment.nsw.gov.au/resources/aqms/airpollution05623.pdf>
Dutton, A, Edwards-Jones, G, Macdonald, D (2010) “Estimating the Value of Non-Use Benefits from Small Changes in the Provision of Ecosystem Services”, Conserv Biol. 2010 Dec;24(6):1479-87.
MacDonald, D, Morrison, M, Rose, J, Boyle, K (2011) “Valuing a multistate river: the case of the River Murray”, Australian Journal of Agricultural and Resource Economics, Volume 55, Issue 3.
Nordhaus, W (2011) “Estimates of the Social Cost of Carbon: Background and results from the RICE-2011 Model”, NBER Working Paper No 17540, <http://www.nber.org/papers/w17540>
OBPR, Department of Finance and Deregulation (2008) “Best Practice Regulation Guidance Note – Value of Statistical Life”, <http://www.royalcommission.vic.gov.au/getdoc/98620bd9-5a71-4e1f-8922-7231790fee90/RSCH.040.001.0188.pdf>

Deloitte Access Economics Commercial-in-confidence 58
Office of Environment and Heritage (2012) “BioBanking review: Discussion paper” < http://www.environment.nsw.gov.au/resources/biobanking/20120062bbrevdp.pdf>
Subade, R (2005) “Valuing Biodiversity Conservation in a World Heritage Site: Citizens’ Non-use Values for Tubbataha Reefs National Marine Park, Philippines”, <http://www.eepsea.net/pub/rr/11201034921RodelRR4.pdf>
Tol (2008) “The Social Cost of Carbon: Trends, Outliers and Catastrophes”, <http://www.economics-ejournal.org/economics/journalarticles/2008-25>
UK DECC (2011) “A brief guide to the carbon valuation methodology for UK policy appraisal”, <https://www.gov.uk/government/uploads/system/uploads/attachment_data/file/48184/3136-guide-carbon-valuation-methodology.pdf>
US EPA (Interagency Working Group on Social Cost of Carbon, United States Government) (2010) “Technical Support Document: Social Cost of Carbon for Regulatory Impact Analysis Under Executive Order 12866”, <http://www.epa.gov/oms/climate/regulations/scc-tsd.pdf>
Wahba, M, Hope, C (2006) “The marginal impact of carbon dioxide under two scenarios of future emissions”, Energy Policy, Volume 34, Issue 17, November 2006, Pages 3305–3316

59
Limitation of our work General use restriction
This report is prepared solely for the internal use of Australian Forest Products Association.
This report is not intended to and should not be used or relied upon by anyone else and we
accept no duty of care to any other person or entity. The report has been prepared for the
purpose of assessing the feasibility of undertaking a complete cost benefit analysis of
bushfire mitigation approaches for the surrounding wider Sydney metropolitan area. You should not refer to or use our name or the advice for any other purpose.

Contact us
Deloitte Access Economics ACN: 149 633 116 Level 7 225 George Street Sydney NSW 2000 Tel: +61 2 9322 7110 Fax: +61 2 9322 7001 www.deloitteaccesseconomics.com.au
Deloitte Access Economics is Australia’s pre-eminent economics advisory practice and a member of Deloitte's global economics group. The Directors and staff of Access Economics joined Deloitte in early 2011.
About Deloitte
Deloitte refers to one or more of Deloitte Touche Tohmatsu Limited, a UK private company limited by guarantee, and its network of member firms, each of which is a legally separate and independent entity. Please see www.deloitte.com/au/about for a detailed description of the legal structure of Deloitte Touche Tohmatsu Limited and its member firms.
Deloitte provides audit, tax, consulting, and financial advisory services to public and private clients spanning multiple industries. With a globally connected network of member firms in more than 150 countries, Deloitte brings world-class capabilities and deep local expertise to help clients succeed wherever they operate. Deloitte's approximately 200,000 professionals are committed to becoming the standard of excellence.
About Deloitte Australia
In Australia, the member firm is the Australian partnership of Deloitte Touche Tohmatsu. As one of Australia’s leading professional services firms. Deloitte Touche Tohmatsu and its affiliates provide audit, tax, consulting, and financial advisory services through approximately 6,000 people across the country. Focused on the creation of value and growth, and known as an employer of choice for innovative human resources programs, we are dedicated to helping our clients and our people excel. For more information, please visit our web site at www.deloitte.com.au.
Liability limited by a scheme approved under Professional Standards Legislation.
Member of Deloitte Touche Tohmatsu Limited
© 2014 Deloitte Access Economics Pty Ltd