scope work package 4 adr collection - scopejointaction · scope work package 4 adr collection tools...
TRANSCRIPT

SCOPE Work Package 4 ADR Collection
Tools for Measuring and Improving the Quality of Reports
in National Adverse Drug Reactions
Databases

SCOPE Work Package 4 ADR Collection: Tools for Measuring and Improving the Quality of Reports in National ADR Databases
2
Contents
Acknowledgments 3
1. Introduction 4 1.1 Purpose of the document 4 1.2 Background 5 1.3 Definitions and abbreviations 5
2. SCOPE survey results 7
3. Procedure for monitoring and improving the quality of reports in National ADR databases 11 3.1. Case study: MHRA procedure for monitoring and reporting on
ADR data quality in the PV database 12 3.2. Checklist for defining internal procedure for quality review of
ADR data in a PV database 16
4. Supplementary tools 17 4.1 EudraVigilance feedback report 18 4.2. vigiGrade completeness score 23 4.3. Clinical documentation tool 28
5. Conclusions 29

SCOPE Work Package 4 ADR Collection: Tools for Measuring and Improving the Quality of Reports in National ADR Databases
3
Acknowledgments
Authors
This document was prepared by the members of SCOPE team of the Agency for Medicinal
Products and Medical Devices of Croatia (HALMED).
Acknowledgements
The authors gratefully acknowledge the Consumers, Health and Food Executive Agency
(CHAFEA) of the European Commission for funding the SCOPE Joint Action and the MS partners
for their contribution. We would like to kindly thank our colleagues across EU MSs for completing
the questionnaire within the topic of Audit of National Reporting Systems of the SCOPE Joint
Action WP4 ADR Collection. We are especially grateful to our colleagues from the Medicines and
Healthcare Products Regulatory Agency, the European Medicines Agency, Uppsala Monitoring
Centre and the Netherlands Pharmacovigilance Centre Lareb (who made their contribution both
on their behalf and also on behalf of the WEB-RADR project) for their active contribution in
development of this document. It has been our privilege to collaborate with our colleagues from
the Italian Medicines Agency (AIFA, Italy), the National Authority of Medicines and Health
Products, (INFARMED, Portugal), the National Institute of Pharmacy and Nutrition (OGYÉI,
Hungary), the Norwegian Medicines Agency (NOMA, Norway), the State Institute for Drug Control
(SUKL, Czech Republic), and the State Medicines Control Agency (SMCA, Lithuania), who were
actively involved in WP4 as our partners.

SCOPE Work Package 4 ADR Collection: Tools for Measuring and Improving the Quality of Reports in National ADR Databases
4
1. Introduction
1.1 Purpose of the document
The purpose of this document is to provide an overview of tools for measuring and improving the
quality of reports in national adverse drug reactions (ADR) databases and to encourage European
Union (EU) Member States (MSs) to use these tools in their databases. Continuously monitoring
and improving the quality of reports ensures that better quality data enters the next step of the
pharmacovigilance (PV) process, i.e. signal detection.
MSs may wish to develop their own procedure for the quality assurance of data in their database
to be able to have a comprehensive tool adapted to the specificities of both their own procedure
of processing ADR reports and their own ADR database. In this document, a case study on the
Medicines and Healthcare products Regulatory Agency (MHRA) procedure for monitoring and
reporting on ADR data quality in their PV database is presented as an example of a quality as-
surance procedure. In addition, as a tool to support defining an internal procedure for quality
review of ADR data in a PV database, a checklist was developed and is also presented in this
document. MSs can use this checklist along with the MHRA case study to guide the development
of the procedure that best fits their national needs.
Other tools presented in this document include the EudraVigilance (EV) Feedback Report, the
vigiGrade completeness score and the Clinical Documentation tool (ClinDoc). These tools can be
used to complement internal procedures for quality assurance. The EudraVigilance (EV) Feed-
back Report, developed by the European Medicines Agency (EMA), is used by EU MSs, while the
vigiGrade completeness score, developed by Uppsala Monitoring Centre (UMC), is used by
countries participating in the World Health Organisation (WHO) Programme for International Drug
Monitoring. A brief overview of the former UMC tool, called Documentation grading – complete-
ness score, is also included within this document for information purposes. Finally, the ClinDoc
is a novel tool focused on the quality of clinical data within an ADR report and was developed by
the Netherlands Pharmacovigilance Centre Lareb as part of the Web-Recognising Adverse Drug
Reactions (WEB-RADR) Project. The ClinDoc is presented in this document as a case study.

SCOPE Work Package 4 ADR Collection: Tools for Measuring and Improving the Quality of Reports in National ADR Databases
5
1.2 Background
The Strengthening Collaboration for Operating Pharmacovigilance in Europe (SCOPE) Joint Ac-
tion has been created to support operations of pharmacovigilance (PV) in the EU following the
requirements introduced by the 2010 European PV legislation1,2,3, which came into force in June
2012. Information and expertise on how regulators in MSs run their national PV systems was
gained in order to develop and deliver guidance and training in key aspects of PV, with tools,
templates and recommendations. The aim of the SCOPE Joint Action was to support consistent
approach across the EU network for all PV operations, in order to benefit medicines safety mon-
itoring and communications to safeguard public health.
SCOPE was divided into eight separate Work Packages (WP), with five WPs focusing on PV
topics to deliver specific and measureable objectives, ranging from improvements in adverse
drug reaction (ADR) reporting to assessment of quality management systems.
WP4 ADR Collection focused on national schemes for the spontaneous reporting of ADRs and
was aimed to provide National Competent Authorities (NCAs) with a full understanding of and
good practices within national systems for collecting ADRs. Information was gathered from Eu-
ropean MS institutions to understand their national ADR system, PV IT system capabilities, as
well as implementation of patient reporting, types of reporting forms developed, and electronic
reporting developments, including those from clinical healthcare systems4. This information was
used to create best practice guidelines, performance indicators and a media toolkit for raising
awareness of ADR reporting systems which will be supported through delivery of a training
course for institutions.
1.3 Definitions and abbreviations
Terminology Description
ADR Adverse Drug Reaction
ClinDoc Clinical Documentation Tool
CHAFEA Consumers, Health and Food Executive Agency
CIOMS Council for International Organisations of Medical Sciences
DKMA Danish Medicines Agency
EEA European Economic Area
EMA European Medicines Agency
1 Directive 2010/84/EU of the European Parliament and of the Council 2 Regulation (EU) No 1235/2010 of the European Parliament and of the Council 3 Commission Implementing Regulation (EU) No 520/2012 4 SCOPE WP4 – ADR Collection Topic 1, 1a, 2, 5 Survey Report. Available from URL: http://www.scopejointaction.eu/_assets/files/SCOPE-WP4-Topic-1,2,5-survey-report.pdf [Accessed 24 March 2016]

SCOPE Work Package 4 ADR Collection: Tools for Measuring and Improving the Quality of Reports in National ADR Databases
6
Terminology Description
EU European Union
EV EudraVigilance
EVDAS EudraVigilance Data Analysis System
FDA Food and Drug Administration
GP General Practitioner
GVP Guideline on Good Pharmacovigilance Practices
ICD International Classification of Diseases
ICH International Conference on Harmonisation
ICSR Individual Case Safety Report
MAH Marketing Authorisation Holder
MedDRA Medical Dictionary for Regulatory Activities
MHRA Medicines and Healthcare products Regulatory Agency
MS Member State(s)
MTS:PTC MedDRA Term Selection: Points To Consider
NCA National Competent Authority
PV Pharmacovigilance
PT Preferred Term
SAS Statistical Analysis Software
SCOPE Strengthening Collaboration for Operating Pharmacovigilance in Europe
SOP Standard Operating Procedure
SUSAR Suspected Unexpected Serious Adverse Reactions
UMC Uppsala Monitoring Centre
QA Quality Assurance
WEB-RADR Recognising Adverse Drug Reactions
WI Work Instructions
WHO World Health Organisation
WP Work Package
YCC Yellow Card Centre
YCS Yellow Card Scheme

SCOPE Work Package 4 ADR Collection: Tools for Measuring and Improving the Quality of Reports in National ADR Databases
7
2. SCOPE survey results
Spontaneous ADR reporting is an important source of safety information about medicines,
especially for signal detection and identification of rare and very rare ADRs. At the level of the
EU, legal requirements regarding the collection, data management and reporting of suspected
ADRs are in place5,6, 7 . Guideline on Good Pharmacovigilance Practices (GVP) Module VI –
Management and reporting of adverse reactions to medicinal products, addresses these legal
requirements applicable to NCAs in MSs, Marketing Authorisation Holders (MAHs) and the
European Medicines Agency (EMA)8. Complementary to GVP Module VI, several other guidelines
and guidance documents relating to the quality of ADR data are currently being used, including
the International Conference on Harmonisation (ICH) E2B Guideline9, the Medical Dictionary for
Regulatory Activities (MedDRA) Term Selection: Points To Consider (MTS: PTC) 10 , the
EudraVigilance (EV) guidance documents and VigiFlow User Guide11. In addition to these, to
support MAHs, some NCAs, such as the Medicines and Healthcare products Regulatory Agency
(MHRA) and Danish Health and Medicines Authority (DKMA) have developed national guidance
documents for industry on best practices in reporting Individual Case Safety Reports (ICSRs)12,13.
Continuously monitoring and improving the quality of data in national ADR databases is a neces-
sity, since only reports of good quality can produce reliable signals. In Audit of National Reporting
Systems of the SCOPE Joint Action WP4, the information about EU MS practices with regard to
the use of indicators and metrics for assessing the quality of reports was collected through a
questionnaire completed by EU MSs. The MSs were asked if they use any indicators or metrics
for assessing the quality of the reports and, if so, to specify what indicators or metrics they use.
5 Directive 2010/84/EU of the European Parliament and of the Council 6 Regulation (EU) No 1235/2010 of the European Parliament and of the Council 7 Commission Implementing Regulation (EU) No 520/2012 8 Guideline on good pharmacovigilance practices (GVP) Module VI – Management and reporting of adverse reactions to medicinal products (Rev 1), EMA, 8 September 2014. Available from URL: http://www.ema.europa.eu/docs/en_GB/document_library/Scientific_guideline/2014/09/WC500172402.pdf [Accessed 24 March 2016] 9 ICH E2B Guideline: Clinical Safety Data Management: Data Elements for Transmission of Individual Case Safety Reports Available from URL: http://www.ich.org/products/guidelines/efficacy/article/efficacy-guidelines.html [Accessed 24 March 2016] 10 MedDRA Term Selection: Points to Consider. Available from URL: http://www.meddra.org/how-to-use/support-documentation [Accessed 24 March 2016] 11 VigiFlow User Guide for version 5.2. Available only to countries participating in WHO Programme for International Drug Monitoring from https://adr.who-umc.org/login.asp [Accessed 24 March 2016] 12 Best Practice In Reporting Of Individual Case Safety Reports (ICSRs), Version 1.0, MHRA, February 2011. 13 Guide To Individual Case Safety Reporting: Guide to industry, Version 1.0, DKMA, June 2015. Available from URL: https://sundhedsstyrelsen.dk/en/Feeds/~/media/B95846036A24403695DD5C30DD105D91.ashx [Accessed 24 March 2016]

SCOPE Work Package 4 ADR Collection: Tools for Measuring and Improving the Quality of Reports in National ADR Databases
8
Twenty-seven MSs provided answers to the question about their usage of indicators and metrics
for assessing the quality of the reports: 13 MSs reported that they do use indicators or metrics
for assessing the quality of reports, while 14 MSs reported not using them. All 13 MSs that re-
ported using indicators or metrics provided further information on what indicators or metrics they
use. All 13 MSs provided information about using the Uppsala Monitoring Centre (UMC) com-
pleteness score: 8 MSs did use the UMC completeness score, while 5 MSs did not use this
indicator. 12 MSs provided information about using the EV feedback report: 10 MSs did use the
EV feedback report, while 2 MSs did not use this indicator. In total, 6 MSs used both the UMC
completeness score and the EV feedback report as tools for assessing the quality of reports.
Additionally, 5 MSs reported that they use other indicators or metrics, while 7 MSs did not use
additional tools. Additional tools used by the MSs who provided an answer to this question in-
cluded internally developed indicators that are included in Standard Operating Procedures
(SOPs) and regular compliance checks or quality audits. Figure 1 shows what indicators or met-
rics are used for assessing the quality of reports by EU MSs.
Figure 1 Indicators or metrics used by EU MSs for assessing the quality of reports in national ADR databases

SCOPE Work Package 4 ADR Collection: Tools for Measuring and Improving the Quality of Reports in National ADR Databases
9
In addition, for the purpose of complementing the results of the SCOPE WP4 survey, a
supplementary search of VigiBase was performed by UMC on the request of SCOPE WP4 for
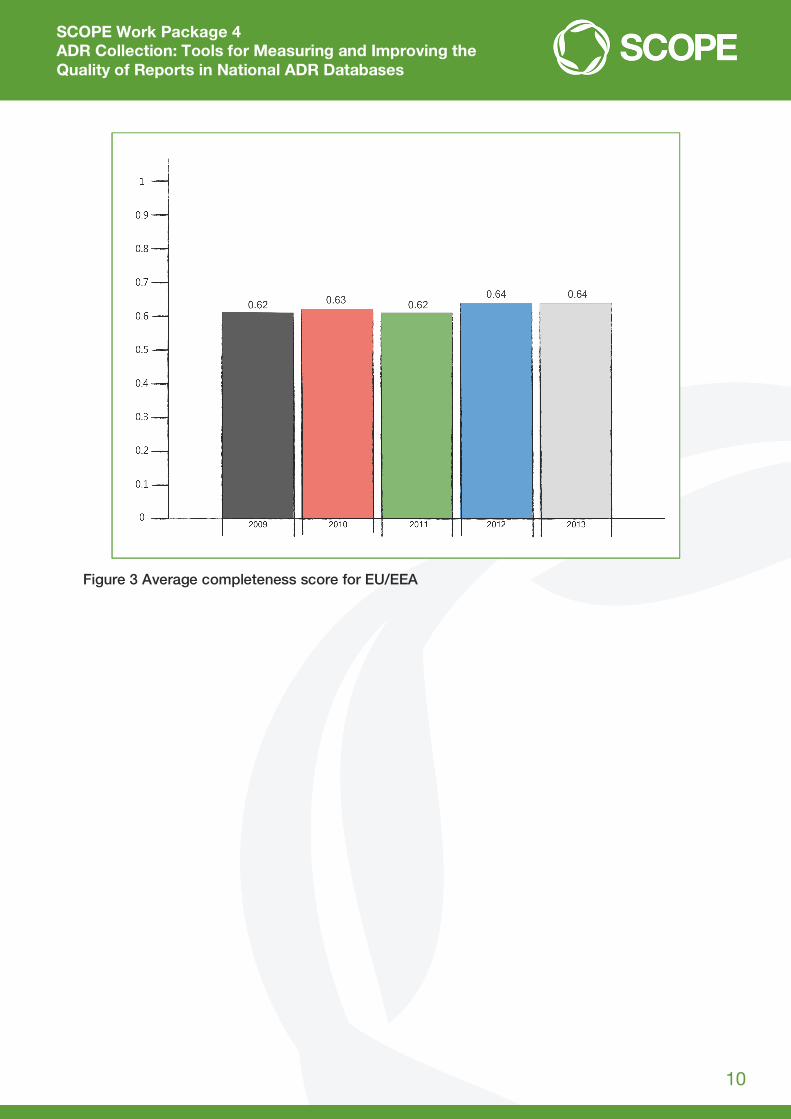
EU/ European Economic Area (EEA) countries for the period 2009-2013. In general, the results of
this tailored UMC search of VigiBase showed that, although the completeness score varies
between countries and also varies over time within countries, the average completeness score
for the EU/EEA is stable over time and can be considered satisfactory. It should be noted that
completeness scores are not a direct indicator of the quality of data processing, because the
score also depends on the amount of data contained in the ADR reports submitted to the NCA.
Therefore, MSs cannot be directly compared without taking into account the complexity of
factors relating to their national reporting systems and also to national ADR databases, since
these have an impact on the completeness score. For example, some MSs do not submit
complete ICSRs to VigiBase, which means that completeness score for their reports in VigiBase
is lower than it would be if complete reports were submitted. It should also be taken into account
that completeness scores are calculated based on the dates when the reports were last updated
in VigiBase, which means that the frequency of submitting the reports to VigiBase may also
influence the score. The results of UMC search of VigiBase tailored for SCOPE WP4 are
presented in Figure 2 and Figure 3.
Figure 2 Yearly completeness scores for EU/EEA countries
SCOPE Work Package 4 ADR Collection: Tools for Measuring and Improving the Quality of Reports in National ADR Databases
10
Figure 3 Average completeness score for EU/EEA

SCOPE Work Package 4 ADR Collection: Tools for Measuring and Improving the Quality of Reports in National ADR Databases
11
3. Procedure for monitoring and improving the quality of reports in National ADR databases
A comprehensive tool, such as an internal procedure for quality assurance of ADR data, is es-
sential for MSs to ensure a good quality of ADR reports in their PV databases. In this section, the
case study of the MHRA procedure for monitoring and reporting on ADR data quality in their PV
database is presented. A checklist for defining the internal procedure for quality review of ADR
data in a PV database is also presented. MSs who wish to develop or improve their own proce-
dure for quality assurance of ADR data in their database can consider this case study and check-
list and use any aspects of these examples that fit the specificities of their ADR processing and
of their ADR database.

SCOPE Work Package 4 ADR Collection: Tools for Measuring and Improving the Quality of Reports in National ADR Databases
12
3.1. Case study: MHRA procedure for monitoring and reporting on ADR data quality in the PV database
In the United Kingdom, ADR data is collected from healthcare professionals, patients
and the pharmaceutical industry via the Yellow Card Scheme (YCS). ADR reports are received
on a daily basis and the information provided is entered into the PV database by associate signal
assessors and signal assessors in the Pharmacovigilance Information Unit of the Medicines and
Healthcare Products Regulatory Agency (MHRA).
The MHRA has had an internally developed procedure for monitoring, documenting and reporting
on ADR data quality in place since 2007. The quality audit of ADR data is carried out on a monthly
basis with a summary report produced for the management team and the reports requiring re-
classification being sent back to the assessors for reclassification. The audit only includes cases
received directly from healthcare professionals or members of the public that are coded into the
MHRA’s ADR database by the Pharmacovigilance Information Unit. MAH reports were previously
covered by a separate MHRA audit process. However, this is no longer performed, as the EMA
conducts data quality activities for EV, including provision of feedback on the quality of ICSRs to
MAHs and NCAs.
3.1.1.Report selection and allocation
On the first working day of a new month, a query is run to obtain a list of all initial reports of fatal
and serious UK spontaneous ADR that occurred over the course of the previous month. A pre-
defined number of ADR reports (usually 100 reports) are audited each month. These include a
combination of all fatal reports for that month and a selection of serious ADR reports for that
month, received from healthcare professionals and patients. The selection of serious reports for
audit is prepared in line with an internally developed guidance sheet for details on the selection
of ADR reports to audit. Only accredited signal assessors are eligible to perform the audit, having
successfully passed a Vigilance Competency Framework, which includes assessment of their
own data processing quality. As part of the audit, a signal assessor must not review a report they
themselves have previously worked on. The signal assessors must agree with their team manager
a date to conduct their audit and will subsequently be allowed to work on this in place of their
usual case processing work.
3.1.2 Error classification and recording errors
Errors are categorised according to the potential impact on MHRA PV activities. There are three
types of error classification, as presented in Table 1.

SCOPE Work Package 4 ADR Collection: Tools for Measuring and Improving the Quality of Reports in National ADR Databases
13
Table 1. MHRA ADR data quality audit – error categories
Type A Type B Type C
‘Major errors’ affecting ability to identify potential signals / publication of list of suspected ADRs on MHRA’s website / breach of patient or reporter confidentiality
Errors affecting anonymised ICSRs sent to MAHs or provision of ADR data / the ability to accurately assess reports using signal detection software for analysis
Administrative errors – where standard procedure has not been followed and ‘poor workmanship’
Examples: Wrong report type (study
instead of spontaneous) Suspect drug name(s)
omitted or wrong Suspect reaction name(s)
omitted or wrong MedDRA Preferred Term (PT) used
Fatal outcome omitted or recorded against wrong ADR
Confidentiality – patient/reporter details (excl. age and sex) in text boxes
Report seriousness status incorrect
Examples: Suspect drug details
incorrect – errors in treatment dates / dose / indication / action taken with drug
Concomitant drugs: omitted, ADR treatment entered as concomitant drug
Suspect reaction – outcome / dates / treatment
Patient details omitted/incorrect
Medical history omitted Test results omitted Yellow Card type –
incorrectly selected (patient MHRA, industry ADR, etc.)
Council for International Organisations of Medical Sciences (CIOMS) seriousness flags omitted or incorrectly set, although not affecting report seriousness
Reporter type – incorrect (Patient / General Practitioner (GP), etc.)
Test results incorrect Medical history incorrect Patient permission flags
set incorrectly
Examples: Missing or incomplete
reaction text. Spelling mistakes /
typographical errors / abbreviations in free text / reaction text in CAPS
Information not classified in appropriate area (treatment / medical history in reaction text rather than treatment box / patient medical history fields)
Reporter title omitted / address details not entered correctly
Medically confirmed flag not set to ‘N’ for patient reports
Post-mortem flag set incorrectly
Medical history flags not set
Yellow Card Centre (YCC) flag not set to ‘yes’ on reports from YCC regions

SCOPE Work Package 4 ADR Collection: Tools for Measuring and Improving the Quality of Reports in National ADR Databases
14
The signal assessor must perform quality assurance (QA) of the reports allocated to them and
check that the information has been entered from the original report into the PV ADR database
according to the internally developed PV Classification Guidance Manual. The details of all errors
detected during the ADR data quality audit must be recorded on the internally developed QA
audit spreadsheet. In addition, the details of each ADR report audited must be recorded on the
QA audit spreadsheet, even if there were no errors detected in the report.
Once all reports have been audited, the signal assessors, team managers, Pharmacovigilance
Information Unit Manager and/or Quality Standards Manager meet to discuss and agree on the
results and resolve any questions that arose during auditing.
3.1.3 Calculating QA audit results and the Quality Audit Monthly Report
Once all the ADR reports in the monthly sample have been audited, and the details have been
recorded on the QA audit sheet, the statistics for the reports are calculated from the results. The
total number of errors for each category and the percentage of reports with Type A, B and C
errors is then calculated.
After each audit of ADR data, the calculated results are displayed and analysed in a report for
discussion. There is an internally developed template for this report. This Monthly Quality Audit
Report contains sections on results of the audit, discussion on the errors (with a focus on Type A
errors) and recommendations for improvement.
Specifically, the results section contains the following information:
Sample size
Cumulative error frequency
Distribution of errors
Causes of errors
Distribution of type of errors between electronic and paper reports.
Information on sample size includes the number of fatal reports, the number of serious healthcare
professional reports and the number of serious patient reports. Information on error frequency
contains data on the percentage of reports according to the error type, for the past six months,
presented as a figure. Distribution of errors is presented, with number of reports according to
error combinations, as a table, a narrative and as a figure. The causes of errors are categorised
as difficulty in interpreting the information in an ambiguous report, omission of information pre-
sent in the original report and procedural errors; these are presented as a narrative and as a
figure, as per error type categories. Distribution of type of errors between electronic and paper
reports is presented as a narrative and a figure.
Once the report has been agreed amongst all signal assessors and team managers, it is sent to
the senior management team for review.

SCOPE Work Package 4 ADR Collection: Tools for Measuring and Improving the Quality of Reports in National ADR Databases
15
3.1.4 Feedback, reclassification and review
All reports containing type A and type B errors are reclassified to rectify these errors. Team man-
agers cascade the reclassification emails to the relevant assessors who were involved in the data
capture, QA and Commit steps of the reports. These emails contain information about which
reports need to be reclassified and what information needs to be changed. Assessors must then
reclassify reports within a week of receipt of the reclassification email.
The monthly QA audit report is discussed in management meetings and team meetings to review
quality trends over the past 12 months and to identify opportunities for improvement in error
rates. The report is also cascaded to all assessors via email along with a short summary of key
errors identified and recommendations for best practice in coding these errors. Issues identified
from the QA audit, which would benefit from clearer guidance on these topics, are updated in the
Classification Guidance Manual on a regular basis. Other initiatives undertaken in response to
QA audit results include quality workshops with signal assessors and training sessions for indi-
viduals based on their specific performance results. Results are also fed into the Vigilance Com-
petency Framework for associate signal assessors who are working towards their accreditation
and are reviewed with all assessors as part of their six-monthly performance appraisal cycle.
SCOPE Work Package 4 ADR Collection: Tools for Measuring and Improving the Quality of Reports in National ADR Databases
16
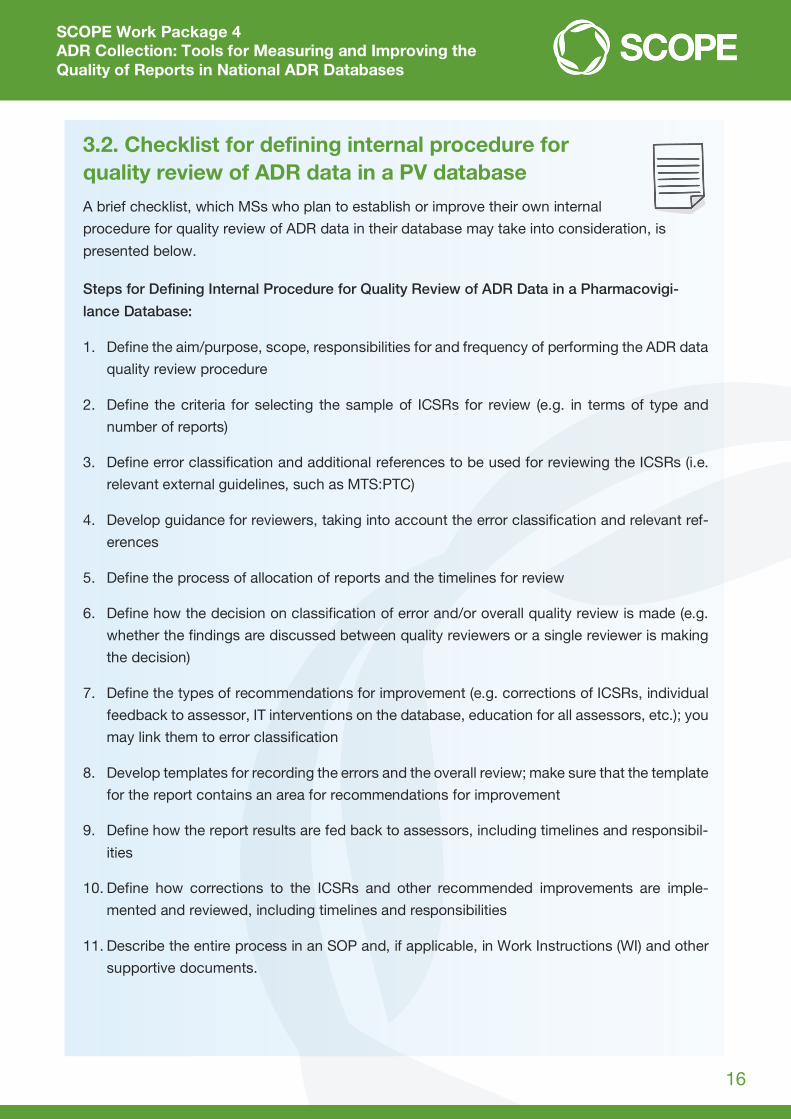
3.2. Checklist for defining internal procedure for quality review of ADR data in a PV database
A brief checklist, which MSs who plan to establish or improve their own internal
procedure for quality review of ADR data in their database may take into consideration, is
presented below.
Steps for Defining Internal Procedure for Quality Review of ADR Data in a Pharmacovigi-
lance Database:
1. Define the aim/purpose, scope, responsibilities for and frequency of performing the ADR data
quality review procedure
2. Define the criteria for selecting the sample of ICSRs for review (e.g. in terms of type and
number of reports)
3. Define error classification and additional references to be used for reviewing the ICSRs (i.e.
relevant external guidelines, such as MTS:PTC)
4. Develop guidance for reviewers, taking into account the error classification and relevant ref-
erences
5. Define the process of allocation of reports and the timelines for review
6. Define how the decision on classification of error and/or overall quality review is made (e.g.
whether the findings are discussed between quality reviewers or a single reviewer is making
the decision)
7. Define the types of recommendations for improvement (e.g. corrections of ICSRs, individual
feedback to assessor, IT interventions on the database, education for all assessors, etc.); you
may link them to error classification
8. Develop templates for recording the errors and the overall review; make sure that the template
for the report contains an area for recommendations for improvement
9. Define how the report results are fed back to assessors, including timelines and responsibil-
ities
10. Define how corrections to the ICSRs and other recommended improvements are imple-
mented and reviewed, including timelines and responsibilities
11. Describe the entire process in an SOP and, if applicable, in Work Instructions (WI) and other
supportive documents.

SCOPE Work Package 4 ADR Collection: Tools for Measuring and Improving the Quality of Reports in National ADR Databases
17
4. Supplementary tools
MSs can use other tools to supplement the insights gained from the internal procedure for quality
review of ADR data in their database. These tools differ in their aims and scope, so this should
be taken into consideration. Supplementary tools presented in this document are:
EudraVigilance (EV) Feedback Report
vigiGrade completeness score
The Clinical Documentation tool (ClinDoc).

SCOPE Work Package 4 ADR Collection: Tools for Measuring and Improving the Quality of Reports in National ADR Databases
18
4.1 EudraVigilance feedback report
4.1.1 Overview
The EMA routinely monitors the quality of data transmitted electronically to EV by MAHs and
NCAs. The main emphasis of this quality review is put on aspects that cannot be checked auto-
matically based on the EV business rules. The business rules check for most inconsistencies in
the structured data, which means the quality review process is only needed for unstructured data.
Since the EMA rarely has any source documents to check the ICSRs against, the ICSR data
quality checking relies on accurate population of the fields. The literature cases are an exception
in that the published literature articles can be used as the source for data quality checks.
The review consists of three important aspects:
Data quality review of the content of ICSRs
Recoding of medicinal product information provided in ICSRs
Identification of potential duplicate cases.
The data quality review process is carried out by selecting a set of ICSRs sent in by the organi-
sation being reviewed. The review focuses on case documentation, the application of coding
principles in accordance with current ICH guidelines and points to consider documents and ad-
herence to expedited reporting timelines. A report is provided summarising the review, its out-
come and potential findings, including a list of suggested actions for improvement, where appli-
cable. The organisation under review is requested to review the report and is invited to send their
comments back to the EMA. If the findings on an ICSR require corrections that would lead to
significant changes that will impact the medical interpretation of the case, a corrected follow-up
version should be submitted to EV as soon as possible. Medical judgement should be used for
assessing this. In addition, corrected follow-ups should be submitted if additional information or
changes to administrative information have been identified that could impact case management,
e.g. other case identifiers have been identified but not provided in the correct data fields.
The process of ICSR data quality checking is described in an SOP and accompanying Work
Instructions (WI). The SOP defines the purpose, scope, responsibilities, changes since last revi-
sion, documents needed for this SOP, related documents, definitions, process map/flow chart,
procedure and records. The WI provide details on how to perform the data quality review. An
additional WI provides details on organising EV reporting review meetings with organisations that
are to subject review. Figure 4 shows a flow chart of the EV ICSR data quality checking and is
followed by a description of the process.

SCOPE Work Package 4 ADR Collection: Tools for Measuring and Improving the Quality of Reports in National ADR Databases
19
Figure 4. Flowchart of the EV ICSR data quality checking
SCOPE Work Package 4 ADR Collection: Tools for Measuring and Improving the Quality of Reports in National ADR Databases
20
4.1.2 Prioritisation for review
Every six months, a standard ICSR quality check in the EudraVigilance Data Analysis System
(EVDAS) and a Statistical Analysis Software (SAS) query are run on the entire EudraVigilance
database for the period since the last run and the outputs are stored in the EMA’s electronic
document management system. The output ranks the organisations, taking into account num-
bers of errors and numbers of ICSRs, and this ranking is used to inform the prioritisation for
checking each organisation. If applicable, the outcomes of previous quality review meetings with
an organisation and whether or not there have been any specific concerns raised about an or-
ganisation are taken into account. These concerns can include, but are not limited to, issues
raised by NCAs, issues detected during routine PV at the EMA, an organisation implementing a
new PV system or organisations merging. Based on the described prioritisation procedure, 10
reports are being produced each month for organisations that send reports to EV (i.e. MAHs and
NCAs). There are no specific timeframes for producing the reports for any given sender.
4.1.3 Quality review of ICSRs
After the organisation to be reviewed is selected, standard ICSR quality checks in EVDAS and
SAS, containing a number of pre-defined queries designed for the purpose of checking the qual-
ity of ICSRs, are run. In addition, there are pre-defined queries available for tracking other issues,
such as expedited reporting compliance and the nullification of individual cases.
When analysing the results of the EVDAS and SAS queries, it is taken into account if the quality
check was initiated by a request or because of a potential issue and if previous issues were
identified at last review. If an answer is yes to either of these questions, a detailed analysis of
ICSRs transmitted to EV is performed; if answer is no to both questions, a standard analysis of
ICSRs is performed. If a major issue is found with the organisation being reviewed in a standard
analysis, a detailed analysis is performed. A request for an ICSR data quality review can be sub-
mitted by the organisation concerned, any sector or unit of the EMA dealing with medicinal prod-
ucts for human use or the PV/clinical trial department of any NCA in the European Economic Area
(EEA). A potential issue refers to quality aspects that are identified during routine PV activities,
PV inspections, as part of the internal quality review process of the organisation concerned, the
EMA or an NCA in the EEA.
Selection of the cases for review is performed as per internal document Selecting Cases for Re-
view. 10-15 recent cases are selected for review, usually from the last 2-3 months, to reflect the
current situation with the ICSRs from an organisation. The focus of the selection is on specific,
potentially problematic cases, including parent-child cases, Suspected Unexpected Serious Ad-
verse Reactions (SUSARs), cases from observational studies and fatal cases. Both cases from
clinical trials and post-marketing cases are represented in the review. Review of the fields com-
pleted by the organisation is guided by an internally developed ICH E2B(R2) field guide titled
Detailed instructions on checking each field of the ICSRs.

SCOPE Work Package 4 ADR Collection: Tools for Measuring and Improving the Quality of Reports in National ADR Databases
21
Specifically, the case narratives and free text fields are checked for any information that should
be provided in the structured fields. Thus, the cases are checked to see if they are internally
consistent and correctly coded. In particular, the following information is checked:
Structured tests
Structured medical and drug history
Dosage structuring
Drug substance and medicinal product names
Indications
Reaction outcomes
Seriousness flags
Reactions.
The structuring is compared against GVP Module VI and particularly against the MTS: PTC to
ensure correct coding of the reactions and other medical terms. Due attention is also given to
correct coding of the medicinal product and active substance names, because these are some
of the most important fields for signal detection and are at high risk of being populated incor-
rectly. For this aspect of review, an internal document titled Examples of incorrect population of
drug substance and medicinal product information is used as guidance.
The errors identified in the review of the quality of ICSRs are classified as major or minor, as
presented in Table 2.
Table 2. Classification of errors identified in the EV ICSR data quality checking
Major error Minor error
A major error is a systematic issue that would have a detrimental impact on the pharmacovigilance assessment of a medicinal product’s safety profile.
A minor error is a non-systematic issue (i.e. one found in only one or two cases) or a systematic issue that does not significantly impact upon the pharmacovigilance assessment of a case or the reporting compliance monitoring.
Major issues include, but are not limited to: Late reporting – if an organisation has a
significant percentage of reports transmitted to EudraVigilance later than 7 or 15 days, as applicable
Incorrect coding of reaction terms Failure to set the correct seriousness flags
Minor issues include, but are not limited to: Incorrect patient weight Incorrect patient height Incorrect population of B.4.k.2.1 with the
INN

SCOPE Work Package 4 ADR Collection: Tools for Measuring and Improving the Quality of Reports in National ADR Databases
22
4.1.4 Results, quality review meetings, corrective actions and records
The results of the analysis are recorded in the report titled Detailed ICSR Data Quality Review
Summary Report. Electronic copies of the reports are saved in the general Quality Assurance
(QA) checks folder, with a copy being linked to the appropriate organisation folder, both in the
EMA’s electronic document management system. A summary of the overall findings is also en-
tered into the EudraVigilance ICSR Quality Checking Spreadsheet in the EMA’s electronic docu-
ment management system.
If no major issues are found in a standard analysis of ICSRs, the results of the quality check are
recorded as described above and the findings are reported to the organisation. If any major is-
sues were identified in a standard analysis or if a detailed analysis was performed, the results are
recorded as described above and an organisation being reviewed can be invited to an ICSR
quality review meeting at the EMA. The meeting is organised as per respective WI.
The organisation under review is responsible for drafting the official minutes of the meeting. The
minutes should include the proposal of corrective actions and timeframes and should be pre-
pared and submitted to the EMA for approval within two weeks following the meeting. The
minutes are reviewed by the staff member(s) who attended the meeting for accuracy and accept-
ability and are then passed upwards for review and approval. The EMA should confirm within two
weeks if the draft minutes are accurate and the proposed corrective actions and timelines ac-
ceptable. If they are not, then the comments are sent to the organisation for incorporation in the
minutes.
The minutes containing the agreed corrective actions and timeframes are stored in the EMA’s
electronic document management system. A summary of the overall findings is also entered into
the EudraVigilance ICSR Quality Checking Spreadsheet. The spreadsheet serves the EMA to
monitor the agreed actions and timelines.

SCOPE Work Package 4 ADR Collection: Tools for Measuring and Improving the Quality of Reports in National ADR Databases
23
4.2. vigiGrade completeness score
The vigiGrade completeness score is a tool developed by UMC in order to measure the amount
of clinically relevant information in an ICSR from VigiBase14,15,16. This tool identifies well-docu-
mented ICSRs and is able to highlight systematic data quality issues. A completeness score is
calculated for each ICSR, but is usually given as an average number for all ICSRs submitted from
one country over time. vigiGrade is measuring structured data without reflecting whether the
information establishes causality between the drug and the ADR. The score can range from 0.07
to 1 and is calculated from several field scores by a multiplicative model. Completeness is first
computed for every reported drug-reaction pair. In cases of more than one drug-reaction pair
inside the ICSR, values are aggregated to an average to yield a score for the ICSR.
The vigiGrade completeness score reflects the ten dimensions of an ICSR, as presented in
Table 3. In case of missing information, a corresponding penalty factor is applied.
Table 3. Dimensions of vigiGrade completeness score
Dimension Description Considerations Penalty
Time to onset
Time from treatment start to the suspected ADR
Imprecise information penalised if there is ambiguity as to whether the drug preceded the adverse event, with 30% if the uncertainty exceeds 1 month, 10% otherwise
50%
30%
10%
Indication Indication for treatment with the drug
Penalty imposed if information is missing or cannot be mapped to standard terminologies, such as the International Classification of Diseases (ICD) or MedDRA
30%
Outcome Outcome of suspected ADR in the patient
‘Unknown’ treated as missing 30%
Sex Patient sex ‘Unknown’ treated as missing 30%
Age Patient’s age at onset of the suspected ADR
Age ‘unknown’ treated as missing. 10% penalty imposed if only age group is specified
30%
10%
Dose Dose of the drug(s)
Penalty imposed if the total daily dose cannot be calculated from the included fields
10%
14 Bergvall T, Norén GN, Lindquist M. vigiGrade: A tool to identify well-documented individual case reports and highlight systematic data quality issues. Drug Safety, 2014, 37(1):65-77. 15 Technical description of vigiGrade completeness score 16 vigiGrade Product Leaflet

SCOPE Work Package 4 ADR Collection: Tools for Measuring and Improving the Quality of Reports in National ADR Databases
24
Dimension Description Considerations Penalty
Country Country of origin Supportive in causality assessment since medical practice and adverse reaction reporting vary between countries
10%
Primary reporter
Occupation of the person who reported the case (e.g. physician, pharmacist)
Supportive in causality assessment, since the interpretation of reported information may differ depending on the reporter’s qualifications. ‘Unknown’ penalised as missing information, whereas ‘Other’ is not penalised
10%
Report type Type of report (e.g. spontaneous report, report from study, other)
‘Not available to sender (unknown)’ treated as missing
10%
Comments Free text information
Uninformative text snippets excluded 10%
The dimensions and their associated penalty factors were determined by three UMC PV experts
with medical training, through consensus, to match the relative importance of each dimension to
causality assessment. Three levels of importance were distinguished:
Essential (information without which reliable causality assessment is impossible)
Important (information without which reliable causality assessment is very difficult)
Supportive (information that is valuable, but without which causality assessment can still typ-
ically be performed).
The penalties for missing information are the same across each level of importance. An example
of how the vigiGrade completeness score is calculated for an ICSR is shown below in Figure 5.
SCOPE Work Package 4 ADR Collection: Tools for Measuring and Improving the Quality of Reports in National ADR Databases
25
Figure 5. Example of how the vigiGrade completeness score is calculated for an ICSR

SCOPE Work Package 4 ADR Collection: Tools for Measuring and Improving the Quality of Reports in National ADR Databases
26
A completeness score is calculated for each ICSR, but is usually given as an average number for
all ICSRs submitted from one country over time. This average number can then be further ana-
lysed and compared amongst countries and time intervals. A sudden unexpected drop in the
score can be indicative of possible systematic errors when submitting reports to VigiBase and
should be further addressed.
A study was performed in order to analyse reports in VigiBase from 2007 to January 201217. For
the purpose of this study, all reports with scores >0.8 were considered as well-documented. For
VigiBase as a whole, the median completeness was 0.41, with an interquartile range of 0.26–
0.63. Two out of three well-documented reports came from Europe, and two out of three from
physicians. The results showed that among the countries with more than 1,000 reports in total,
the highest rate of well-documented reports is 65% in Italy. Tunisia, Spain, Portugal, Croatia and
Denmark each have rates above 50%, and another 20 countries have rates above 30%.
The two examples below show how vigiGrade can be used to discover certain systematic errors:
1. A lower than expected completeness for reports from Italy was observed in 2011. This was
traced to a consistent lack of information on outcome. The issue was communicated by UMC
to the Italian authorities who resubmitted all their reports with the outcome information in-
cluded. As a result, Italian reports as represented in VigiBase at the time this article was pre-
pared, were the most complete for any country with at least 1,000 reports.
2. An unexpected drop in completeness for reports from the US Food and Drug Administration
(FDA) was also observed in 2011. From 2010 to 2011, the average completeness decreased
from 0.45 to 0.30. Subsequent analyses revealed that from 2011 onwards, the age unit format
on reports from the USA did not conform to the E2B guidelines. As a result, all American
reports from 2011 lacked age information in VigiBase, and none of them were classified as
well documented (since missing age is penalised by 30%). This issue was communicated by
UMC to the FDA and has been addressed in subsequent versions of VigiBase.
It is important to note that sometimes original reports at each national centre may contain more
information than it is available in VigiBase; however, if that data is not adequately structured, or
if not all data is submitted to UMC, the completeness score will be lower than expected. In the
future, it can be expected that vigiGrade will improve with the development of natural language
processing techniques that can extract meaning from the text.
The vigiGrade completeness score reports prepared for individual countries contain the com-
pleteness scores for ICSRs from the respective country over the past five years. A detailed de-
scription of the calculation of scores is presented for reference in the supporting document titled
Technical description to vigiGrade completeness score. The report consists of six sections:
17 Bergvall T, Norén GN, Lindquist M. vigiGrade: A tool to identify well-documented individual case reports and highlight systematic data quality issues. Drug Safety, 2014, 37(1):65-77.

SCOPE Work Package 4 ADR Collection: Tools for Measuring and Improving the Quality of Reports in National ADR Databases
27
Completeness score by country – overview for all countries
Average completeness score – for country
Completeness score by field – for country
Time to onset – completeness and consistency – for country
Age at onset – completeness – for country
Dosage completeness – for country.
Since the beginning of 2016, vigiGrade graphs can be provided for different subgroups of ICSRs,
based on the E2b format. This allows comparisons of, e.g., ICSRs with company IDs and ICSRs
with authority numbers. These graphs can be requested from UMC ([email protected]) on
an ad hoc basis.
4.2.1 Documentation grading – completeness score
Documentation grading – completeness score was the predecessor of vigiGrade, also developed
by UMC. Documentation grading was developed on the same principles as vigiGrade, but with
some key differences:
Documentation grading had eight dimensions: type of report, primary source, gender, time to
onset, age at onset, outcome, indication and free text. vigiGrade has two additional dimen-
sions – dosage and country.
The names of three dimensions were changed in order to comply with ICH-E2B. Gender, free
text and primary source were changed to patient sex, comments and primary reporter, re-
spectively.
Documentation grading had eight different levels of penalties instead of three in vigiGrade.
Results between these two tools shouldn’t be compared because of different penalty levels and
newly added dimensions.
SCOPE Work Package 4 ADR Collection: Tools for Measuring and Improving the Quality of Reports in National ADR Databases
28
4.3. Clinical documentation tool
As part of the Web-Recognising Adverse Drug Reactions (WEB-RADR) Project, the Netherlands
Pharmacovigilance Centre Lareb has developed a Clinical Documentation tool (ClinDoc) in order
to assess the clinical documentation of ICSRs in an international PV setting18. A good quality of
clinical information contained in ICSRs is important for signal detection. ClinDoc was developed
by five PV professionals with different professions, skills and working experience. The stages of
development were: formulation of domains and subdomains for clinical documentation, face va-
lidity testing and validity and reliability testing. Eight PV assessors from four different countries
performed the validity and reliability testing.
ClinDoc contains four domains, important for assessing the clinical documentation of ICSRs:
Adverse drug reaction (ADR)
Chronology
Suspected drug
Patient characteristics.
Since ADRs can be very diverse, the information required for a good clinical assessment varies
depending on the type of ADR. This tool is therefore a flexible model that takes this diversity into
account. The unit of analysis is an ICSR and assessment is performed case-by-case; a specific
sample of ICSRs can be chosen for analysis. The assessor indicates which subdomains are rel-
evant for assessing the clinical documentation of the specific ICSR and afterwards indicates if
this information is present in an ICSR or not. The score given to each domain is the proportion of
information present in relation to the information deemed relevant for assessing the report. The
final score for the ICSR consists of the average of the percentages scored per domain and falls
under one of the following categories: poor (≤ 45%), moderate (46% – 74%) and well (≥ 75%).
The final score gives insight in the clinical documentation grade of ICSR and can be used, to-
gether with the causality outcome, in signal detection. It is of note that, for assessing the com-
pleteness of ICSRs, ClinDoc takes the content and the relevance of the information into account,
and not only the presence of information. The tool can be used to compare the clinical quality of
reports, for example, between different reporting groups, such as patients and nurses, or different
means/sources of reporting, such as mobile phone applications and automatic reporting from a
general practitioner or hospital systems. When certain reporting methods or specific groups of
reporters show poor clinical quality, efforts can be made to enhance the quality.
18 Rolfes L, Oosterhuis I, Ekhart C, Muller-Hansma A, Härmark L: Development and testing of a Clinical Documentation tool to assess Individual Case Safety Reports in an international setting. Manuscript submitted for publication.
SCOPE Work Package 4 ADR Collection: Tools for Measuring and Improving the Quality of Reports in National ADR Databases
29
5. Conclusions
Within Audit of national reporting systems of the SCOPE WP4, the information about EU MS
practices with regard to the use of indicators and metrics for monitoring the quality of reports in
their national ADR databases was collected through a questionnaire completed by EU MSs. Re-
sults showed that only 13 out of 27 MSs use indicators or metrics and only five of those MSs use
internally developed indicators that are included in SOPs and regular compliance checks or qual-
ity audits. In addition, the results of a UMC search of VigiBase for EU/EEA countries for the period
2009-2013 showed that, although the average completeness score for the EU/EEA was satisfac-
tory and stable over time, there is room for improvement. This document containing an overview
of tools was therefore prepared with the aim of supporting MSs in their efforts to continuously
monitor and improve the quality of reports in their national databases.
A case study of MHRA procedure for monitoring and reporting on ADR data quality in their PV
database, and a checklist for defining internal procedure for quality review of ADR data in a PV
database, were presented in this document. MSs who wish to develop or improve their own
procedure for quality assurance of ADR data can consider this case study and checklist and use
any aspects of these examples that fit the specificities of their ADR processing and of their ADR
database. MSs can also use other tools to supplement the insights gained from the internal
procedure. These tools include the EudraVigilance (EV) Feedback Report, the vigiGrade
completeness score and the Clinical Documentation tool (ClinDoc), which were also described in
this document.
In conclusion, it needs to be reiterated that, in PV, continuously monitoring and improving the
quality of data in national ADR databases is essential. Only a comprehensive tool, such as internal
procedure for quality assurance of ADR data, can enable MSs to ensure the good quality of ADR
reports. This can be further supplemented by using other tools presented here.