scoliosis analog model for the evaluation of bracing
TRANSCRIPT

University of Tennessee Health Science Center University of Tennessee Health Science Center
UTHSC Digital Commons UTHSC Digital Commons
Theses and Dissertations (ETD) College of Graduate Health Sciences
12-2015
Scoliosis Analog Model for the Evaluation of Bracing Technology Scoliosis Analog Model for the Evaluation of Bracing Technology
Chloe Ly Chung University of Tennessee Health Science Center
Follow this and additional works at: https://dc.uthsc.edu/dissertations
Part of the Other Analytical, Diagnostic and Therapeutic Techniques and Equipment Commons, Other
Rehabilitation and Therapy Commons, and the Therapeutics Commons
Recommended Citation Recommended Citation Chung, Chloe Ly (https://orcid.org/0000-0002-0185-349X), "Scoliosis Analog Model for the Evaluation of Bracing Technology" (2015). Theses and Dissertations (ETD). Paper 445. http://dx.doi.org/10.21007/etd.cghs.2015.0430.
This Thesis is brought to you for free and open access by the College of Graduate Health Sciences at UTHSC Digital Commons. It has been accepted for inclusion in Theses and Dissertations (ETD) by an authorized administrator of UTHSC Digital Commons. For more information, please contact [email protected].

Scoliosis Analog Model for the Evaluation of Bracing Technology Scoliosis Analog Model for the Evaluation of Bracing Technology
Abstract Abstract Thoracolumbar braces are commonly used to treat Adolescent Idiopathic Scoliosis (AIS). Braces serve to reduce and prevent progression of the spinal curve by applying corrective forces. The magnitude and direction of these corrective forces applied by the brace to the spine remain unknown. Additionally the brace fitting process involves making alterations to the brace that affect its corrective force capacity. The objective was to design and validate an analog model of a mid-thoracic single curve scoliotic deformity for quantifying structural properties of the brace and the force response of the brace on the spine. This model was used to investigate the effects of strap-related brace design alterations. Additionally, the model was customized and demonstrated to be representative of a clinical case study.
A novel mechanically-equivalent analog model of the AIS condition was designed and developed to simulate up to 40 degrees of spinal correction. The linkage-based model was used in conjunction with a biorobotic testing platform to test a scoliosis brace. Measurements of the force components applied to the model and angular displacement of the linkage assembly were used to calculate the brace structural stiffness properties. The brace was tested using two types of straps (Velcro and buckle) applied in various configurations and compared to an unconstrained configuration and rigidly constrained configuration to demonstrate the capacity of the model to study brace design alterations.
Calculated stiffness was expressed as a resistive force relative to the angular change of the linkage system. Addition of either strap type significantly increased the stiffness values relative to the unconstrained configuration. An optimal brace radial stiffness was achieved with three Velcro straps, i.e., there was no significant stiffness gained by adding a fourth strap. For the case of the buckle straps, no significant stiffness gain occurred when more buckle straps were added.
Structural properties provide a means to compare bracing technology and better understand design features. The testing of design alterations, i.e. variable strap configurations, show a measureable difference in brace force response and structural properties between each configuration. Also, interpretation of the measured force components revealed that the brace applied inward and upward forces to the spine.
A novel scoliosis analog model and testing assembly were developed to provide first time measures of the forces applied to the spine by a thoracolumbar brace. In addition to quantifying brace structural properties, this test assembly could be used as a design and testing tool for scoliosis brace technology.
Document Type Document Type Thesis
Degree Name Degree Name Master of Science (MS)
Program Program Biomedical Engineering
Research Advisor Research Advisor Denis J. DiAngelo, Ph.D.
Keywords Keywords analog model, biomechanics, brace, orthosis, scoliosis, stiffness
Subject Categories Subject Categories Analytical, Diagnostic and Therapeutic Techniques and Equipment | Medicine and Health Sciences | Other Analytical, Diagnostic and Therapeutic Techniques and Equipment | Other Rehabilitation and Therapy | Therapeutics
Comments Comments Thesis was embargoed for 6 months at the original publication time.
This thesis is available at UTHSC Digital Commons: https://dc.uthsc.edu/dissertations/445

Scoliosis Analog Model for the Evaluation of Bracing Technology
A Thesis Presented for
The Graduate Studies Council The University of Tennessee
Health Science Center
In Partial Fulfillment Of the Requirements for the Degree
Master of Science In the Joint Graduate Program in Biomedical Engineering and Imaging
From The University of Tennessee and
The University of Memphis
By Chloe Ly Chung December 2015

ii
Copyright © 2015 by Chloe Ly Chung. All rights reserved.

iii
DEDICATION
For my beloved family, Nicole M. Arsenault, Hoang M. Chung, Brandon M. Chung, and Kristen N. Philippart

iv
ACKNOWLEDGEMENTS I would like to thank everyone who has sacrificed time to help guide me during my educational career. Especially, I'd like to thank my advisor, Dr. Denis J. DiAngelo, who saw potential in me, made this research opportunity available, and has spent so much time mentoring me in academic and life matters alike, and I'd like to thank my graduate committee members, Dr. Richard Kasser, Dr. Derek Kelly, and Dr. William Mihalko, for their guidance and support during my time at the University of Tennessee Health Science Center. I would also like to acknowledge Alice Moisan, Jolecia Flournory, Jack Steele, Dema Assaf, Michael Parker, Gabriel Rápalo, Clay Hillyard, and Cody Bateman for their help during different phases of this research. Finally, I'd like to thank my family for providing me with constant support and encouragement throughout my life, and without whom I would not have the courage to continue pursuing my dreams.

v
ABSTRACT
Thoracolumbar braces are commonly used to treat Adolescent Idiopathic Scoliosis (AIS). Braces serve to reduce and prevent progression of the spinal curve by applying corrective forces. The magnitude and direction of these corrective forces applied by the brace to the spine remain unknown. Additionally the brace fitting process involves making alterations to the brace that affect its corrective force capacity. The objective was to design and validate an analog model of a mid-thoracic single curve scoliotic deformity for quantifying structural properties of the brace and the force response of the brace on the spine. This model was used to investigate the effects of strap-related brace design alterations. Additionally, the model was customized and demonstrated to be representative of a clinical case study.
A novel mechanically-equivalent analog model of the AIS condition was designed and developed to simulate up to 40 degrees of spinal correction. The linkage-based model was used in conjunction with a biorobotic testing platform to test a scoliosis brace. Measurements of the force components applied to the model and angular displacement of the linkage assembly were used to calculate the brace structural stiffness properties. The brace was tested using two types of straps (Velcro and buckle) applied in various configurations and compared to an unconstrained configuration and rigidly constrained configuration to demonstrate the capacity of the model to study brace design alterations.
Calculated stiffness was expressed as a resistive force relative to the angular change of the linkage system. Addition of either strap type significantly increased the stiffness values relative to the unconstrained configuration. An optimal brace radial stiffness was achieved with three Velcro straps, i.e., there was no significant stiffness gained by adding a fourth strap. For the case of the buckle straps, no significant stiffness gain occurred when more buckle straps were added.
Structural properties provide a means to compare bracing technology and better understand design features. The testing of design alterations, i.e. variable strap configurations, show a measureable difference in brace force response and structural properties between each configuration. Also, interpretation of the measured force components revealed that the brace applied inward and upward forces to the spine.
A novel scoliosis analog model and testing assembly were developed to provide first time measures of the forces applied to the spine by a thoracolumbar brace. In addition to quantifying brace structural properties, this test assembly could be used as a design and testing tool for scoliosis brace technology.

vi
TABLE OF CONTENTS
CHAPTER 1. INTRODUCTION .....................................................................................1
CHAPTER 2. BACKGROUND ........................................................................................4
Anatomy of the Spine ......................................................................................................4 Assessment of AIS ...........................................................................................................4 Measures of AIS ..............................................................................................................7 AIS Treatment Options ....................................................................................................9 Types of Scoliosis Braces ..............................................................................................13 Bracing Mechanics: Three-Point Pressure Principle .....................................................15 Brace Fabrication ...........................................................................................................15 Brace Efficacy ................................................................................................................17 Existing Models .............................................................................................................18 Biomechanical Testing Platform ...................................................................................22
CHAPTER 3. SCOLIOSIS ANALOG MODEL FOR THE EVALUATION OF BRACING TECHNOLOGY...........................................................................................24
Introduction ....................................................................................................................24 Methods .........................................................................................................................27
Test Assembly ............................................................................................................27 Model .........................................................................................................................27 Platform ......................................................................................................................27 Validation of SAM .....................................................................................................32 Brace Alterations .......................................................................................................34 Design Protocol Parameters .......................................................................................34 Protocol ......................................................................................................................36 Data Management ......................................................................................................36
Results ............................................................................................................................38 Discussion ......................................................................................................................45
Findings ......................................................................................................................45 Limitations .................................................................................................................47
CHAPTER 4. PRELIMINARY FINDINGS OF SAM CASE STUDY APPLICATION................................................................................................................49
Introduction ....................................................................................................................49 Methods .........................................................................................................................51
Materials ....................................................................................................................51 Protocol ......................................................................................................................57 Data Management ......................................................................................................60
Results ............................................................................................................................60 Discussion ......................................................................................................................60
vii
CHAPTER 5. DISCUSSION ..........................................................................................66
Comparison of Pilot Study Brace and Case Study Brace ..............................................66 Other Scoliosis Research ...............................................................................................66
CHAPTER 6. CONCLUSION AND RECOMMENDATIONS ..................................69
Pilot Study ......................................................................................................................69 Case Study .....................................................................................................................69 Overall Conclusion ........................................................................................................69 Future Work / Recommendations ..................................................................................70
LIST OF REFERENCES ................................................................................................71
APPENDIX A. ADEPT CODE .......................................................................................79
APPENDIX B. 2D VALIDATION DATA .....................................................................83
APPENDIX C. VARIABLE STRAP DATA .................................................................85
APPENDIX D. IRB APPROVAL LETTER .................................................................89
APPENDIX E. CASE STUDY RADIOGRAPHS .........................................................90
APPENDIX F. BOSTON BRACE ORDER FORM .....................................................91
APPENDIX G. SPSS LINEAR CURVE FIT OUTPUT...............................................92
APPENDIX H. EQUIPMENT SPECIFICATIONS .....................................................93
VITA..................................................................................................................................94

viii
LIST OF TABLES
Table 2-1. Indications for Scoliosis Treatment. .............................................................12
Table 3-1. Brace Configurations. ...................................................................................35
Table 4-1. Stiffness Values from SPSS Curve Fit Analysis [N/Deg]. ...........................64
Table B-1. Percent Error of Each Input Force Orientation Using Definite Integral of Experimental and Computational Curves. ...................................................84
Table C-1. Radial and Axial Stiffness Values [N/deg]. ..................................................86
Table C-2. Radial and Axial Peak Force Values [N]. .....................................................86
Table C-3. Radial and Axial Calculated Work Values [N-deg]. ....................................87

ix
LIST OF FIGURES
Figure 2-1. Anatomy of the Spine. ....................................................................................5
Figure 2-2. Anatomy of the Vertebra. ...............................................................................6
Figure 2-3. Scoliosis Cobb Angle Measurement Showing Critical Vertebral Anatomy. ........................................................................................................8
Figure 2-4. Radiograph of Mid-Thoracic Three-Point Single Scoliosis Curve. ..............10
Figure 2-5. SterEOS 3D Model Reconstruction of Mid-Thoracic Three-Point Single Scoliosis Curve. ............................................................................................11
Figure 2-6. Boston Brace from Front and Rear. ..............................................................14
Figure 2-7. Boston Brace Pad Placement in Brace Design. ............................................16
Figure 2-8. BrAIST Results. ............................................................................................19
Figure 2-9. Mac-Thiong Study Results. ..........................................................................21
Figure 2-10. Sevrain FEM and Schematic of Load Path. ..................................................23
Figure 3-1. Scoliosis Cobb Angle Measurement Showing Critical Vertebral Anatomy. ......................................................................................................25
Figure 3-2. Radiograph of Mid-Thoracic Three-Point Single Scoliosis Curve and SterEOS 3D Model Reconstruction Showing Color-Coded Critical Vertebrae. .....................................................................................................25
Figure 3-3. EOS Data Used in Designing the Scoliosis Analog Model. .........................28
Figure 3-4. Critical Anatomy Corresponding to SAM Components Used in Designing the Scoliosis Analog Model. .......................................................29
Figure 3-5. SAM Components. ........................................................................................30
Figure 3-6. Test Assembly Consisting of the SAM Mounted in the Programmable Robotic Testing Platform. ............................................................................31
Figure 3-7. Two Dimensional Validation of SAM Setup. ...............................................33
Figure 3-8. The Single Curve Thoracolumbar Boston Brace Used in This Study. .........35
Figure 3-9. Methodology for Simulating a Changing Spinal Curve Using Linkage Components. .................................................................................................37

x
Figure 3-10. Brace Force Response with Configuration “C. Three Velcro Straps.” .........39
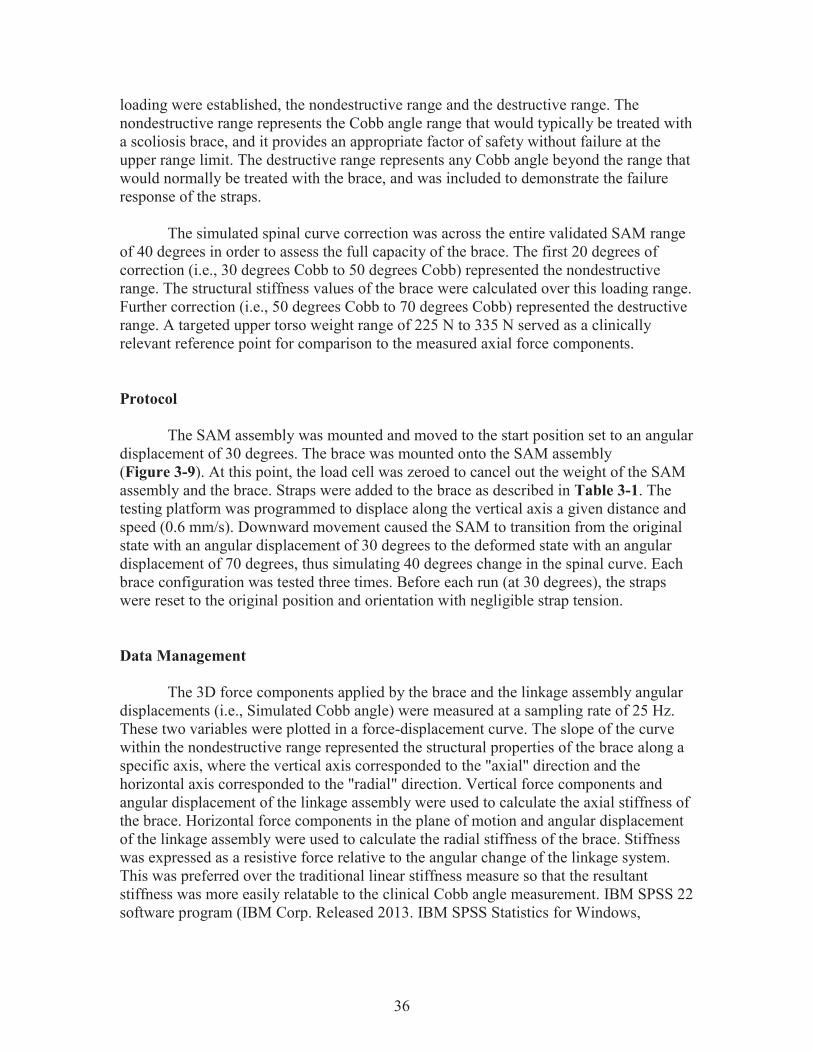
Figure 3-11. Radial Force-Displacement Curves of the Brace Configurations. ................40
Figure 3-12. Axial Force-Displacement Curves of the Brace Configurations. .................41
Figure 3-13. Comparative Study: Within Velcro Group. ..................................................42
Figure 3-14. Comparative Study: Within Buckle Group. ..................................................43
Figure 3-15. Comparative Study: Between All Groups.....................................................44
Figure 3-16. Free Body Diagram Showing Measured Force Response at 50 Degree Cobb Angle. .................................................................................................46
Figure 3-17. Free Body Diagram Showing Inward Only Force Response Scenario at 50 Degree Cobb Angle. ................................................................................46
Figure 3-18. Translational Responses of the Spine. ..........................................................48
Figure 4-1. SAM Case Study Design with Collaboration Between LCH and UTHSC BioRobotics Laboratory. ..............................................................................50
Figure 4-2. Annotated Pre-Brace EOS Image. ................................................................52
Figure 4-3. Annotated In-Brace EOS Image. ..................................................................53
Figure 4-4. Radiographic Design Parameters for Custom SAM. ....................................54
Figure 4-5. Design Parameters Corresponding to SAM Components. ............................55
Figure 4-6. SAM from Front and Rear. ...........................................................................56
Figure 4-7. Boston Brace from Front and Rear. ..............................................................58
Figure 4-8. SAM Without and with Case Study Brace. ..................................................59
Figure 4-9. X-Axis Force-Displacement Curve...............................................................61
Figure 4-10. Y-Axis Force-Displacement Curve...............................................................62
Figure 4-11. Z-Axis Force-Displacement Curve. ..............................................................63
Figure 5-1. Interpretation of the Force Distribution During Traction. ............................68
Figure A-1. Testing Log Screenshot.................................................................................82
Figure B-1. Sample Calculation of Definite Integral and Percent Error. .........................84

xi
Figure C-1. Sample Calculation of Work Using Definite Integral...................................88

xii
LIST OF ABBREVIATIONS AIS Adolescent Idiopathic Scoliosis BrAIST Bracing in Adolescent Idiopathic Scoliosis Trial CAD Computer Aided Design CAD-CAM Computer Aided Design-Computer Aided Manufacturing COPI Center for Orthotics and Prosthetics, Inc. Fi Input Force Fy Force Component in the Y Direction Fz Force Component in the Z Direction FEA Finite Element Analysis FEM Finite Element Model LCH Le Bonheur Children's Hospital RTP Robotic Testing Platform SAM Scoliosis Analog Model TLSO Thoracic-Lumbar-Sacral Orthosis 2D Two Dimensional 3D Three Dimensional
1
CHAPTER 1. INTRODUCTION Etymology of the word “Scoliosis” suggests that it originated from the Greek terms skoliosis, meaning “crookedness” and skolios, meaning “bent or curved.” Today, Scoliosis is a three dimensional (3D) skeletal deformity of the spine consisting of a combination of axial rotation and lateral curvature that measures 10 degrees or greater in the coronal plane. [1] According to the National Scoliosis Foundation, Scoliosis affects an estimated 6 million people in the United States alone, approximately 2-3% of the population. [2] Scoliosis has a wide range of impact affecting infants, adolescents, and adults. Scoliosis has three major etiological types: congenital (caused by malformed vertebrae), syndromic (associated with another disorder), and idiopathic (no known cause). A related type of the deformity, known as Secondary Scoliosis, is an associated byproduct of neuromuscular pathologies. [3] Scoliosis curve types can vary widely, including single, double, and triple curve patterns and can be present in any one or multiple areas of the spine. Idiopathic Scoliosis with an onset after 10 years of age, called Adolescent Idiopathic Scoliosis (AIS), is the most common spinal deformity treated by primary care physicians, pediatricians, and spinal surgeons (representing 85% of cases or 0.5% - 3.0% pediatric population). [2] The various types of AIS curves are categorized by the Lenke classification system. [4] Risk factors involved with AIS include age, gender, skeletal maturity, and curve progression. Frequent daily back pain is common in the Scoliosis population (80% to 86%). The degree of the pain depends on the type and location of the curve. However, ability to perform everyday activities remains normal and cardiopulmonary risk is low for mild and moderate AIS curves. [3] There is currently no cure that exists for this condition. The current understanding of the affected population is that both genders are susceptible to develop a mild case of Scoliosis with onset between 10 and 16 years, though premenarchal females are twice as likely as males to develop AIS curves greater than 10 degrees, five times for 20 degrees, and ten times for 30 degrees, respectively. [3] In AIS, the most common curve type is right thoracic with right curves occurring eight times more frequently than left. [3] Progression of the spinal deformity occurs in response to asymmetric loading of the spinal axis, which produces biomechanical forces. [5] Progression occurs in 23% of cases, more often in females than males, in patients with lower skeletal maturity, and in complex deformities. [3] The normal progression of AIS was outlined in one study as follows: thoracic curves greater than 50 degrees progressed at 1 degree/year, thoracolumbar curves progressed at 0.5 degree/year, lumbar curves progressed at 0.24 degree/year, and thoracic curves of less than 30 degrees showed no progression. [1] Rapid curve progression is defined as an increase in magnitude of the deformity by more than 5 degrees within four to six months. [6] Patients with rapid progression AIS are more likely to develop physical deformities such as an abnormal chest wall and truncal shift and require cosmesis. Similarly, these patients are at greater risk to either develop or have pre-existing associated pathologies such as spondylolysis, spondylolisthesis, cerebral palsy, and neuromuscular Scoliosis. [1]

2
Annually, it is estimated that out of the 600,000 patient visits, only 30,000 are considered moderate and treated with an orthosis, and 38,000 are considered severe or rapidly progressive treated with spinal fusion surgery. [2] These surgical treatments are very costly and usually increase health risks. As of 2011, the mean AIS spinal fusion hospital charges were $155,278 [7], while bracing treatment averaged $4,000 per patient [8]. Scoliosis is considered an important risk factor for psychological discomfort and poor quality of life. However, brace treatment does not severely impact quality of life. [9] A spine surgeon decides whether to prescribe a brace depending on the degree of spinal deformity measured on a radiographic image. An orthotist then works with a manufacturer to fabricate the brace with custom contouring layers and padding. The role of the brace is to prevent progression of the complex curve by applying corrective forces at the spine apex. Imaging is used to measure the degree of spinal correction and determine brace efficacy. In the end, how well the brace works largely depends on the artisan experience-based methods of the orthotist. Up until recently, the outcome of bracing treatment has been highly debated. Various research groups, namely Katz et al. (2010) [10] and Weinstein et al. (2013) [11], performed clinical studies that have offered valuable insight into the efficacy of Scoliosis braces. Findings from Weinstein's 5-year follow-up study were reported in the Fall of 2013. This study provided evidence that braces were effective (72% success rate) at treating Scoliosis, where a success is defined as skeletal maturity without curve progression past the 50 degree threshold. With this confirmation that braces work, researchers have begun to investigate how braces work. In general, the capacity of rehabilitative devices, such as braces, to restore lost mechanical function of the human body due to injury or disease represents a niche of scientific understanding.
The design and testing of implants, orthotics, and other orthopedic medical devices are traditionally based on mechanical models that are not representative of anatomical or physiological conditions. Conventional biomechanical testing with animal or human cadavers is expensive, so most testing is done using approximated methods such as ASTM mechanical tests or computer aided design (CAD) analyses. These methods provide a feasible way to determine the fatigue or failure strength of a medical device, but do not simulate the physiological mechanics. More recently, multi-directional robotic testing platforms have been used to study wear properties of joint implants, but are based on single joint systems and are void of the anatomical environment. [12-16] A multi-level anatomically and mechanically correct synthetic physical model of the lumbar spine was developed for more sophisticated experimental testing of spinal implants. [17-18]
The study of the Scoliosis braces has benefitted from the use of these research practices. A thorough review of literature has revealed that efforts to understand Scoliosis bracing technology are primarily limited to in vivo clinical testing using imaging techniques [19-28] and computational modeling. [29-46] Imaging methods provide a measure of the angular deformity but no information of the brace mechanics or structural properties, such as axial and radial stiffness values. The functional capacity of computational models is limited by the lack of validating in vivo and in vitro mechanics

3
data. However, there is no biomechanical model of a scoliotic spine or testing assembly available to study Scoliosis bracing mechanics. The objective of this research was to design and validate an analog model of a mid-thoracic single curve scoliotic deformity for quantifying the structural properties of the brace and the force response of the brace on the spine. Additionally, the model was used to investigate the effects of strap-related brace design alterations. More specifically nine different strap configurations were compared, which provided scientific insight into common clinical decisions of how many straps to use, where to place the straps, and the type of strap material to ensure proper fitting of the brace on the patient's torso. Finally, the model was demonstrated to be representative of a patient during a case study through collaboration with Le Bonheur Children's Hospital (LCH) (Memphis, TN) and orthotist Jack Steele of the Center for Orthotics and Prosthetics, Inc. (COPI) (Memphis, TN).
4
CHAPTER 2. BACKGROUND
Anatomy of the Spine The supporting vertebral column, or “spine,” spans the length of the torso from the base of the skull to the coccyx (Figure 2-1). This column serves to support the weight of the upper body while maintaining posture and providing movement and flexibility. The spine is divided into three major regions, the cervical spine, the thoracic spine, and the lumbar spine. Twenty-six individual bones make up the vertebral column, including seven cervical vertebrae, twelve thoracic vertebrae, five lumbar vertebrae, one sacrum, and one coccyx or “tailbone.” Each of the joining vertebrae is separated by a fibrocartilaginous intervertebral disc, which reduces the stress of movement, and is connected by ligaments and bony interlocking processes. The specific geometry of each vertebra (Figure 2-2) varies depending on the region within the spine, with size increasing from superior to inferior. However, each vertebra has an anterior vertebral body and various posterior bony structures. The four types of bony extensions are called the "spinous process," the "transverse processes," the "superior articular processes," and the "inferior articular processes." The spinous processes and transverse processes serve as points for muscle attachment. The superior and inferior articular processes make up the facet joint, and serve to limit the motion of the spine. The articular processes are oriented superior and inferior in the cervical region. Gradually, this orientation transitions in the thoracic region to become medial and lateral in the lumbar region. The orientation of the facet joint constrains the motion of the spine in that region, allowing optimal axial rotation in the cervical region and forward bending in the lumbar region. Bony tissue connecting the spinous process to the transverse processes is called the "lamina," and connecting the transverse processes to the vertebral body is called the "pedicle." The twelve thoracic vertebra have twelve ribs attached to the bodies and transverse processes. The fibrocartilaginous intervertebral discs between each vertebral body are composed of a gelatinous core or “nucleus pulposus” that is surrounded by fibrous fibrocartilage or “annulus fibrosis.” The mature spine has four distinct curves in the sagittal plane. The cervical region and the lumbar region both have "lordosis," or concave curvature. The thoracic region and pelvic region both have "kyphosis," or convex curvature. These curves increase the strength and balance of the spine. In the coronal plane, the spine is straight unless it is laterally displaced by a skeletal deformity such as Scoliosis. [47]
Assessment of AIS According to Altaf [1], between 1% and 3% of children aged 10 to 16 years old will display a mild form of Scoliosis. As previously mentioned, Scoliosis is a 3D skeletal deformity of the spine consisting of a combination of axial rotation and lateral curvature that measures 10 degrees or greater in the coronal plane. Scoliosis with an onset after 10

5
Figure 2-1. Anatomy of the Spine. Source: Reprinted with permission. Carter HV. Anatomy of the Spine. Public domain, via Wikimedia Commons [48]

6
Figure 2-2. Anatomy of the Vertebra. Source: Reprinted with permission. OpenStax College. Anatomy of the Vertebra. CC BY 3.0 (http://creativecommons.org/licenses/by/3.0), via Wikimedia Commons [49]

7
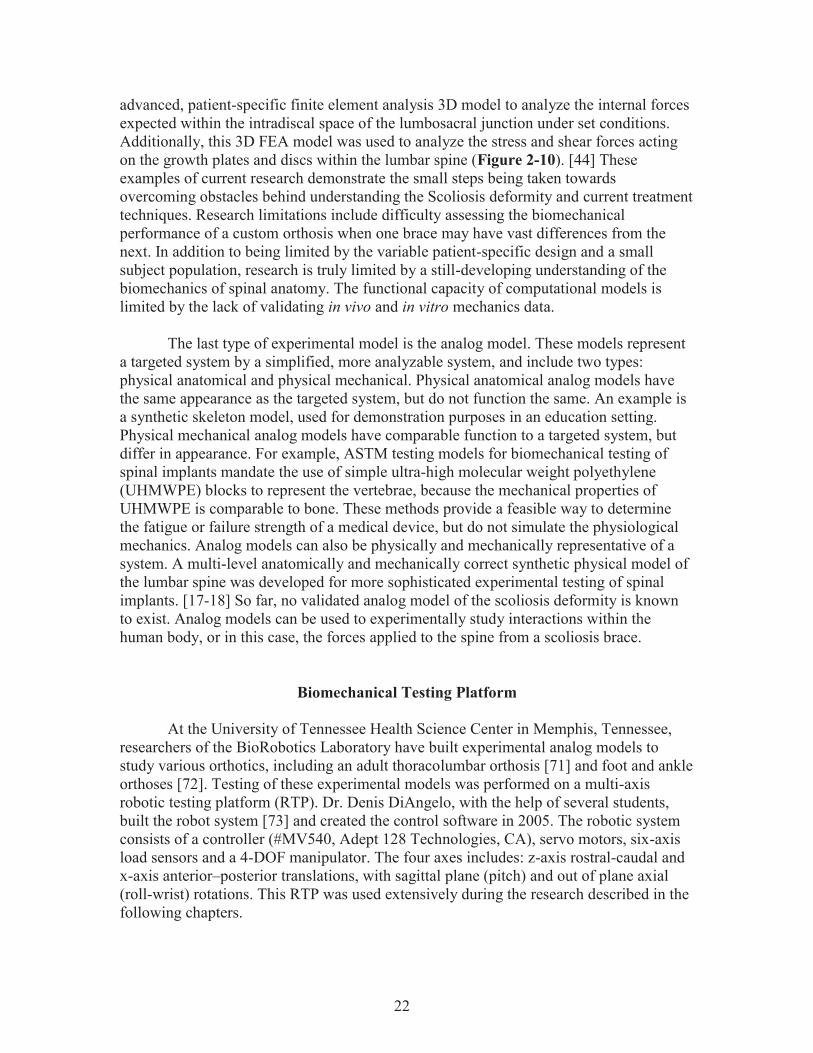
years of age and an unknown etiology is classified as Adolescent Idiopathic Scoliosis. Typically, the clinical diagnosis of AIS follows the exclusion of known causes of Scoliosis such as vertebral malformations, associated neuromuscular disorders, and other diseases. Though the actual causes are unknown, several hypothesized causes of AIS exist, including mechanical, metabolic, hormonal, neuromuscular, growth, and genetic abnormalities. It is commonly considered a multifactorial disease with genetic predisposing factors. [1] Diagnosis is determined by observation of the patient’s body symmetry, gait, and posture combined with a thorough review of the patient’s medical history. There are several tools that physicians use during the initial assessment, including Adam’s forward bend test, a scoliometer, and imaging techniques. Adam’s forward bend test is used to determine the degree of rotation of Scoliosis [1]. In the bent position, the asymmetry of the patient may be obvious in the form of a rib hump. A scoliometer is utilized by the physician to provide an objective measure of curve rotation [6]. In addition to these assessment techniques, physical deformities that are indicative of Scoliosis include waist line asymmetry, prominent ribs, and asymmetrical shoulder heights. It is also not uncommon for patients to report back pain. [1, 6] These assessment tools are supplemented by modern imaging technology. The standard method for assessing the curvature quantitatively is measurement of the Cobb angle (Figure 2-3) [6], which is the angle between two lines, drawn perpendicular to the upper endplate of the uppermost vertebra involved and the lower endplate of the lowest vertebra involved. [50] The Risser Grade [11] is widely used as a measure of skeletal maturity. A posterioanterior radiograph of the pelvis and hips is taken, and the amount of ossification of the iliac crests is rated on a scale between 0 (skeletally immature) and 5 (skeletally mature). [51] An observation period may be prescribed to determine the degree of curve progression if the patient is skeletally immature (Risser 0, 1, or 2) and the degree of curvature is mild. [52] Over a period of about six months, the degree of curvature is watched to see how much it progresses. An increase in the Cobb angle of 5 degrees or more suggests that the curve has a high risk of progression. [1, 27]
Measures of AIS The standard method for assessing the curvature quantitatively is measurement of the Cobb angle (Figure 2-3), which is the angle between two lines, drawn perpendicular to the upper endplate of the uppermost vertebra involved and the lower endplate of the lowest vertebra involved. [50] Cobb angles are typically classified as follows: mild (10° 20°, no risk of progression), moderate (21° - 49°, low risk of progression), and severe ( > 50°, high risk of progression). [3] Lateral curvature is often coupled with axial rotation of the spine. However, this secondary measure is often overlooked or ignored. Current manual approaches of quantifying axial rotation of a vertebra or of a section of the spine are challenging and time consuming. One method for approximating the axial rotation is the Nash and Moe

8
Figure 2-3. Scoliosis Cobb Angle Measurement Showing Critical Vertebral Anatomy.
9
method. [3] Based on the distance between the pedicles and the sides of the vertebral body, this method rates the vertebral rotation from grade 0 (pedicles equidistant from vertebral body, no rotation) to grade IV (pedicle past the center of the vertebral body, high rotation).
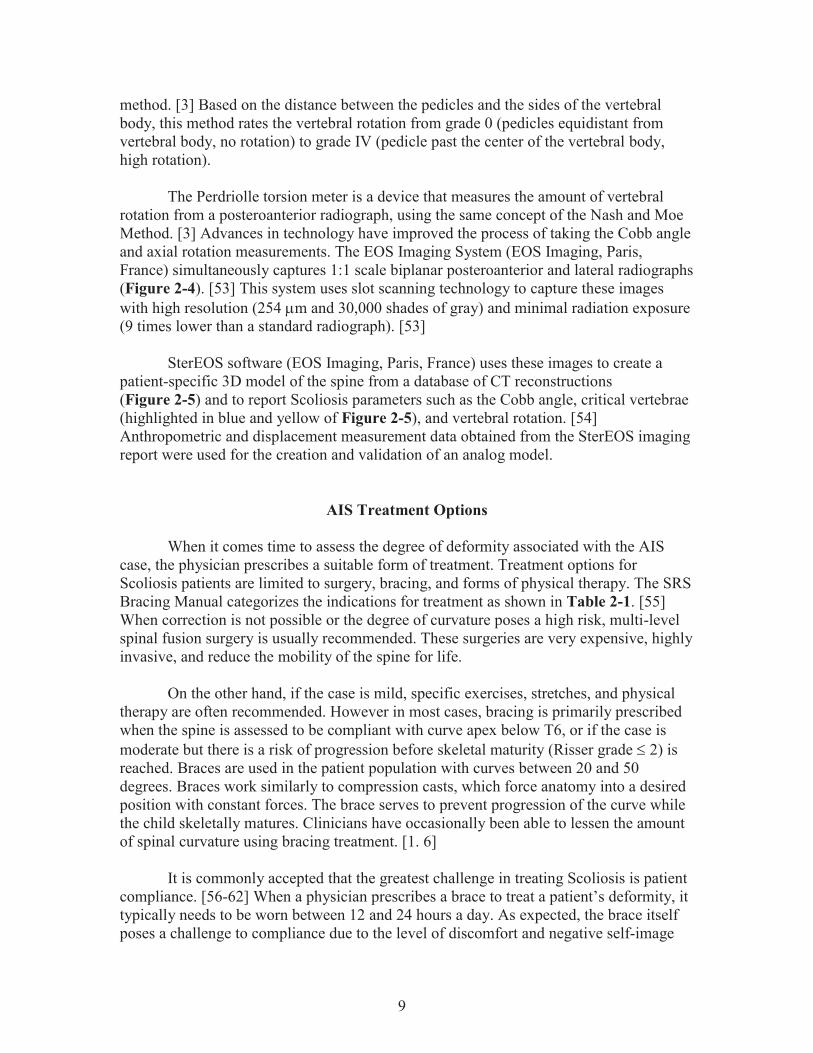
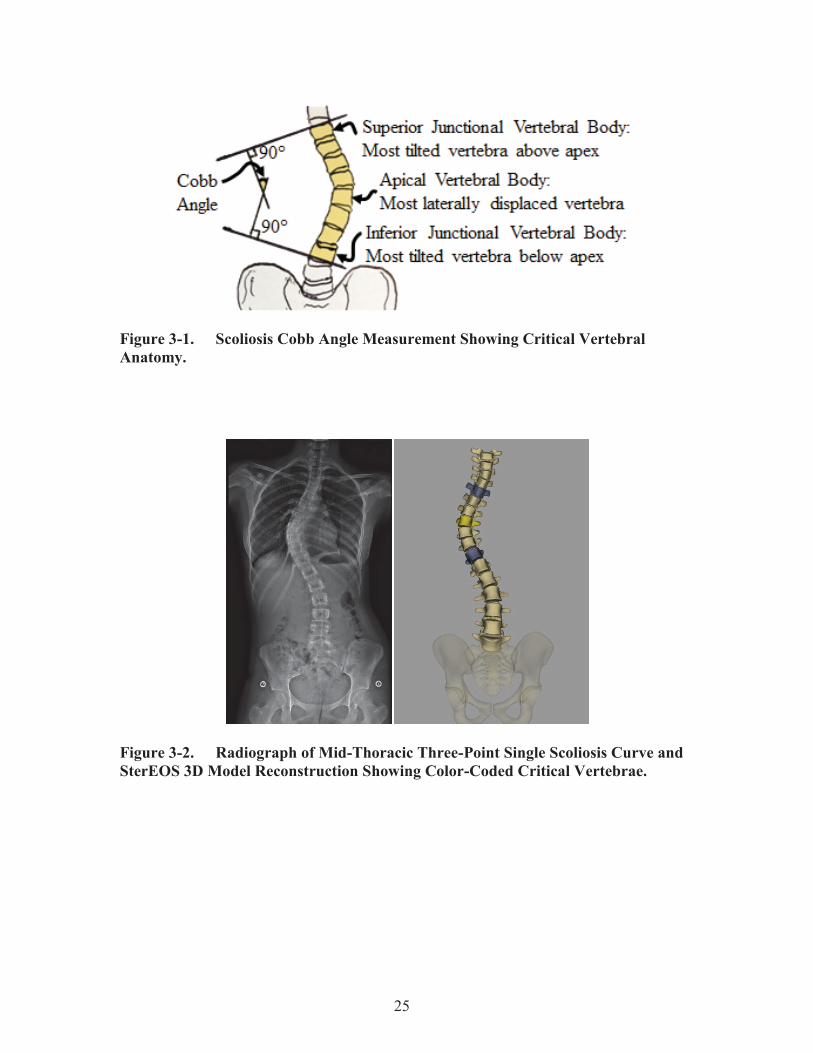
The Perdriolle torsion meter is a device that measures the amount of vertebral rotation from a posteroanterior radiograph, using the same concept of the Nash and Moe Method. [3] Advances in technology have improved the process of taking the Cobb angle and axial rotation measurements. The EOS Imaging System (EOS Imaging, Paris, France) simultaneously captures 1:1 scale biplanar posteroanterior and lateral radiographs (Figure 2-4). [53] This system uses slot scanning technology to capture these images with high resolution (254 m and 30,000 shades of gray) and minimal radiation exposure (9 times lower than a standard radiograph). [53]
SterEOS software (EOS Imaging, Paris, France) uses these images to create a
patient-specific 3D model of the spine from a database of CT reconstructions (Figure 2-5) and to report Scoliosis parameters such as the Cobb angle, critical vertebrae (highlighted in blue and yellow of Figure 2-5), and vertebral rotation. [54] Anthropometric and displacement measurement data obtained from the SterEOS imaging report were used for the creation and validation of an analog model.
AIS Treatment Options When it comes time to assess the degree of deformity associated with the AIS case, the physician prescribes a suitable form of treatment. Treatment options for Scoliosis patients are limited to surgery, bracing, and forms of physical therapy. The SRS Bracing Manual categorizes the indications for treatment as shown in Table 2-1. [55] When correction is not possible or the degree of curvature poses a high risk, multi-level spinal fusion surgery is usually recommended. These surgeries are very expensive, highly invasive, and reduce the mobility of the spine for life.
On the other hand, if the case is mild, specific exercises, stretches, and physical therapy are often recommended. However in most cases, bracing is primarily prescribed when the spine is assessed to be compliant with curve apex below T6, or if the case is moderate but there is a risk of progression before skeletal maturity (Risser grade 2) is reached. Braces are used in the patient population with curves between 20 and 50 degrees. Braces work similarly to compression casts, which force anatomy into a desired position with constant forces. The brace serves to prevent progression of the curve while the child skeletally matures. Clinicians have occasionally been able to lessen the amount of spinal curvature using bracing treatment. [1. 6]
It is commonly accepted that the greatest challenge in treating Scoliosis is patient
compliance. [56-62] When a physician prescribes a brace to treat a patient’s deformity, it typically needs to be worn between 12 and 24 hours a day. As expected, the brace itself poses a challenge to compliance due to the level of discomfort and negative self-image

10
Figure 2-4. Radiograph of Mid-Thoracic Three-Point Single Scoliosis Curve.

11
Figure 2-5. SterEOS 3D Model Reconstruction of Mid-Thoracic Three-Point Single Scoliosis Curve.

12
Table 2-1. Indications for Scoliosis Treatment.
Risser Curve Action 0 - 1 0 - 20
20 - 40 Observe Brace
2 - 3 0 - 30 30 - 40
Observe Brace
0 - 3 0 - 4
40 - 50 > 50
Brace or Surgery Surgery
13
associated with wearing it. Bracing is not benign in terms of the physiosocial and body image concerns. Acknowledging that the population is made up of young children and teenagers, it is easy to understand why patient compliance is so low. It will be a great engineering challenge to create a functional and comfortable device for these patients in order to increase patient compliance and outcomes.
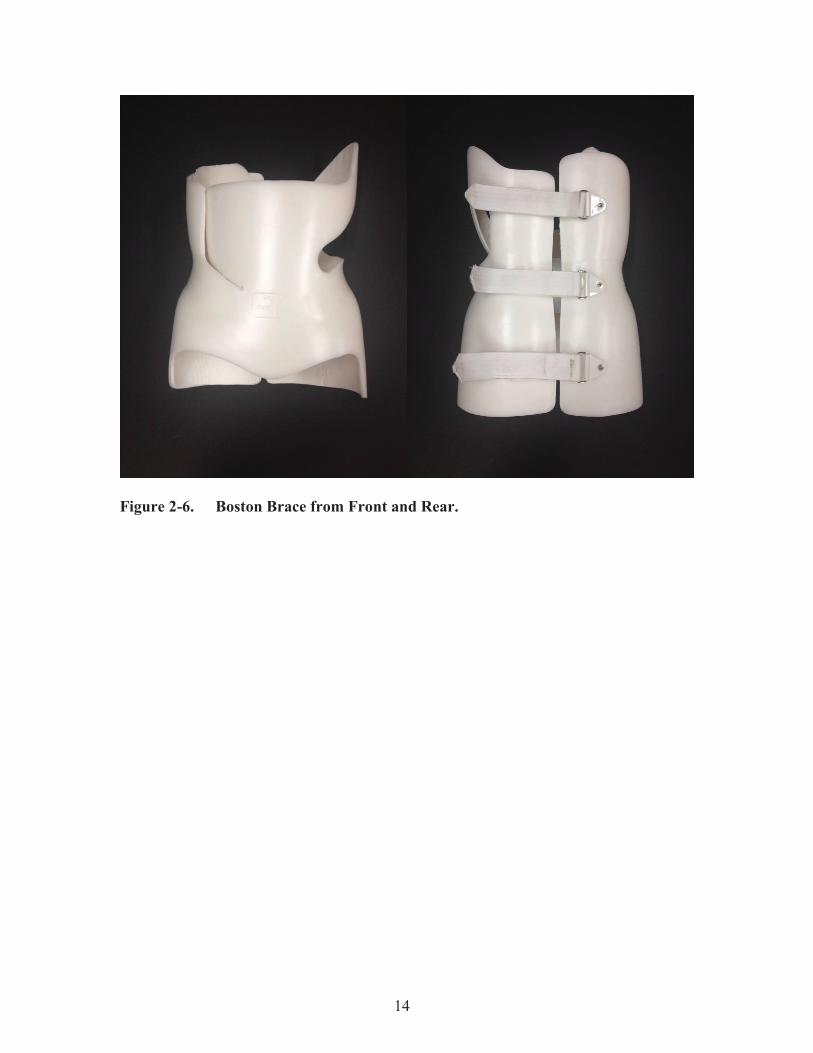
Types of Scoliosis Braces Scoliosis braces are typically known as thoracic-lumbar-sacral orthoses (TLSO). They can be rigid, flexible, or composite and can utilize passive or active correction mechanisms. There exists a variety of brace designs available. Prescription of a brace depends on severity of the deformity, flexibility of the spine, and clinician professional opinion and preference. Popular rigid braces in the United States include the Milwaukee and Boston braces for full-time wear, and the Charleston and Providence braces for nocturnal wear. The Milwaukee brace originated in 1945 as an immobilization brace for use post-surgery, and the first removable brace for the treatment of Scoliosis. Poor cosmesis due to the bulky design results in non-compliance and limited prescription of the Milwaukee brace. The brace is symmetric with a posterior opening, and it consists of multiple parts. The pelvic girdle, made of leather or thermoplastic materials, wraps around the waist. The superstructure is a combination of an aluminum anterior bar, stainless steel posterior bars, and a neck ring with a non-contact throat mold. Passive and active mechanisms can be utilized for curve correction, depending on the addition of different design features. [63] The most popular TLSO Scoliosis brace in North America is the Boston Brace. The brace originated in 1972 at Boston Children’s Hospital as a modified Milwaukee brace. The design included a pelvic girdle modified with thoracolumbar and thoracic extensions and overall superstructure replaced with low profile, plastic axillary extensions. Compared to the custom-molded predecessors, the fabrication time and cost was greatly reduced through computer aided design-computer aided manufacturing (CAD-CAM) construction methods. The final device is symmetrical with a posterior opening. Within the brace, apical pads are placed to passively load the Scoliosis curve. To allow for improved truncal shift and ventilation, a section of material can be removed from the brace opposite the apex of the curve, creating a window of relief. [63] Both active and passive correction mechanisms are part of the Boston brace treatment. Active correction increases the in-brace correction though coordinated physical therapy exercises such as voluntary muscle contractions within the brace away from the internal pads and into the area of relief. [52] A Boston brace is pictured in Figure 2-6. The Charleston Bending Brace was developed in 1979 as a nocturnal alternative to a full-time brace. The design is based on the Heuter-Volkmaan principle which suggests that asymmetric vertebral loading can alter bone growth. The brace utilizes an asymmetric design with selective contact points to hold the patient in an aggressively overcorrected side-bending, supine position. [63] The Providence Brace was created in 1992 as an alternative nocturnal brace. Unlike the aggressive side-bending posture of the
14
Figure 2-6. Boston Brace from Front and Rear.
15
Charleston Brace, the Providence brace applies derotational and lateral forces directly to the body with an asymmetrical, selective contact point design. The manual fabrication process of the predecessor was also improved by CAD-CAM tools. [63] Not all braces are rigid in design. Recent advancements in bracing technology, including the use of compliant, flexible materials and active correction mechanisms, have resulted in semi-rigid and non-rigid Scoliosis braces. The SpineCor Brace, developed in Canada in 1993, consists of a unique strap design. Correction of the deformity is activated by the patient’s movement. The brace is made of a combination of thigh and crotch bands, corrective elastic bands, a thermoplastic pelvic girdle, and a cotton bolero. [63] The TriaC brace is a low-rigidity brace that was created in the Netherlands in 2002. [64] A flexible coupling connects thoracic and lumbar sections and creates a transverse, three-point force correction mechanism, where an anterior progression force counteracts a posterior force and torque. The brace allows for flexibility by localizing sagittal plane correction to the thoracic region, meaning there is no pelvic tilt mechanism. [63] Prescription of these dynamic and flexible braces tends to be low due to lack of evidence proving brace efficacy.
Bracing Mechanics: Three-Point Pressure Principle Braces serve to maintain, and, in some cases, reduce [65] the spinal curve in order to prevent progression of the deformity by applying corrective forces while being worn. [21] Many braces use a three-point pressure principle as the method of correction, which involves fixation above, below, and at the apex of the curve. [52] In Boston braces, foam pads are placed at specific locations (Figure 2-7) within the brace to achieve correction of the lateral curve and malrotation. [52] These pads, including trochanter pads, lumbar pads, thoracic pads, and derotation pads, apply corrective forces to the spine. The magnitude and direction of these corrective forces applied by the brace to the spine remain unknown, and are a common concern for clinicians and orthotists.
Brace Fabrication An orthotist oversees the steps involved in making a Scoliosis brace, including capturing the shape of the patient, design and manufacture of the brace, and fitting of a brace. [63] Methods of capturing the shape of the patient have improved with technology. In the past, casting of the patient’s torso using plaster or fiberglass allowed for a custom brace to be fabricated. This approach has been widely replaced by prefabricated symmetrical models, which are selected based on tracked hand measurements such as circumference, width, and depth at specific landmarks. Another method for capturing the shape of the patient is by using a laser or white light scanner, either handheld or stationary. These scanners capture the surface geometry of the patient in the form of a point cloud or image collection, which can then be imported by CAD software to create a 3D model of the torso. This model can be modified to include specific design features, such as asymmetrical shifts or pushes, to address the unique Scoliosis deformity. A

16
Figure 2-7. Boston Brace Pad Placement in Brace Design. Source: Reprinted with permission. Boston Brace International I. Reference Manual for the Boston Scoliosis Brace. 2015; https://www.srs.org/professionals/education_materials/. [52]

17
positive mold of the torso is carved, and plastic is vacuum formed over the model to create the brace module or shell. This process is expensive, ranging from $15,000 to $40,000, including software, scanners, and other fees. [63] An orthotist can fabricate a brace in-house or work with a manufacturer to fabricate a brace. Typically an orthotist makes design alterations to a brace such as trimming the brace module, the addition of support straps, extra pads, and section cutouts to improve the fit and comfort of a brace. There is no standard of application or common understanding of how changes to these design alterations (strap size, placement, number, pad variables) can affect the corrective capacity of a brace. The process is largely subjective and follows best judgment and practice, yet these steps are critical and will likely affect the patient decision to wear a brace. In the end, how well a brace works largely depends on the artisan experience-based fabrication methods of the orthotist. In-brace imaging is commonly used to measure the degree of spinal correction and determine brace efficacy. No force analysis is used during the brace design phase or evaluation process. Alterations made to a brace can directly affect the structural properties and force response of a brace.
Brace Efficacy Despite emerging data that supports the effectiveness of braces, there is still controversy around the use of braces. Most published studies show low methodological quality. For as long as braces have been on the market, people have questioned their effectiveness. This is true for most kinds of orthoses; from ankle braces to neck braces, there is a significant lack of evidence to prove the effectiveness of what is currently on the market. The underlying reason for this lack of data is that the FDA classifies certain orthotics as a "Class I 510(K) exempt and Good Manufacturing Practices (GMP) exempt" product. This means that a truncal orthosis such as a Scoliosis brace can be designed, fabricated, and marketed in the US without any sort of premarket notification and FDA clearance. As a result, many of the off-the-shelf braces lack any supporting performance data. [66] According to 21 CFR 890.3490, a "truncal orthosis is a device intended for medical purposes to support or to immobilize fractures, strains, or sprains of the neck or trunk of the body." [66] In the case of Scoliosis treatment, a brace can be designed to be either rigid or flexible. The more common option uses rigid materials to create a stiff, custom shell that manipulates the torso anatomy into the desired state. In the most common application, the rigid brace will be designed with special pads inserted within the brace that assist in targeting the desired area. In this type of static, rigid brace, the body is simply forced into a position and held in that position for several hours a day. Over time, the clinical expectation is that the spine's curvature lessens or maintains magnitude. The fabrication of these braces is surprisingly subjective. An orthotist is trained to be able to recognize what features a patient will require in her brace based on what the physician provides. In the end, the effectiveness of the resultant brace depends heavily on the way it was designed.

18
A thorough review of literature has revealed mixed reviews on the effectiveness of Scoliosis braces with some researchers supporting bracing and others opposing bracing treatment. With such a wide spread of evidence, most people prefer to trust personal experience and successes. It is not uncommon for a physician to adamantly believe that Scoliosis braces provide no benefit to patients simply because they "know" that their preferred treatment works. This controversial mindset has caused a rift in the Scoliosis treatment community. Acknowledging the questionable role of braces, researchers have begun investigating brace efficacy in more structured studies. Katz et al. [10] showed that bracing can be effective in preventing progression of curvature by tracking user compliance with an in-brace heat sensor. The researchers concluded that bracing effectiveness depends on the length of time the patient wears the brace. [10] Weinstein et al. [11] designed and conducted a 5-year follow-up study, the Bracing in Adolescent Idiopathic Scoliosis Trial (BrAIST). The BrAIST study was originally designed to assess the question: Do braces work or not? The success of the study is debatable due to issues with enrollment and finding subjects willing to randomize treatment. Despite the limitations, the study was able to capture an interesting set of data regarding patient outcomes. Physiological outcomes include the curve progression to 50 degrees or more (treatment failure) and skeletal maturity without this degree of curve progression (treatment success). Other interesting measures that were recorded in the BrAIST study include scores of Pediatric Quality of Life, health and functioning, self-image, and perception of spinal appearance, which all play a part in the patient compliance. To measure patient compliance, a major clinical concern, temperature-sensing loggers such as the StowAway and TidbiT were embedded within the device to collect data outside of the clinic. To measure curve progression, modern radiographs and biplanar radiographs were used. The BrAIST study concluded that "bracing significantly decreased the progression of high-risk curves to the threshold for surgery in patients with AIS. Longer hours of brace wear were associated with greater benefit." Findings from this study were reported in the Fall of 2013 and provided evidence that braces were effective (72% success rate) at treating Scoliosis, where a success is defined as skeletal maturity without curve progression past the 50 degree threshold (Figure 2-8). [11] BrAIST Co-author Lori Dolan discussed the outcomes of the study during a course [67] hosted by the American Academy of Orthotists & Prosthetists. She identified the need to determine what forces are applied to the spine, for a scientific method to determine whether these forces are unidirectional or 3D, and to understand the effects of brace alterations on curve correction and spinal loading.
Existing Models Clinical studies [19-28] have used imaging techniques to show that braces can work when patient compliance is high. Other questions that remain include: How well do braces work and how do braces work? Kuroki of the University of Miyazaki, Japan,

19
Figure 2-8. BrAIST Results. Source: Reprinted with permission from Weinstein SL, Dolan LA, Wright JG, Dobbs MB. Effects of bracing in adolescents with idiopathic scoliosis. The New England journal of medicine. Oct 17 2013;369(16):1512-1521. [11] Copyright Massachusetts Medical Society.

20
investigated a suspension technique for estimating the amount of curve correction seen in bracing treatment. The patient gripped an overhead bar with an overhand grip. The bar was set to a height so that the patient's feet were just above the ground, and a posterioanterior radiograph was taken. A brace was fit on the patient, and another posterioanterior radiograph was taken. These two corrected state images were compared to a posterioanterior radiograph of the patient in his native, deformed state. Kuroki concluded that hanging is a useful method of estimating the degree of correction seen with the brace used in the study. Another finding was that hanging of less skeletally mature patients resulted in an overestimation of correction, and inversely, hanging of more skeletally mature patients resulted in an underestimation of the amount of correction seen with a brace. Researchers also wish to understand how braces work, and which features and biomechanical properties can be optimized for better biological outcomes. Intuition and a basic understanding of physics allow us to understand the fundamental force-reaction relationship of the function of the Scoliosis brace. A more in-depth engineering analysis of the biomechanical properties of the brace and the pediatric anatomy is required in order to truly understand Scoliosis bracing technology. Aside from in vivo observation such as clinical studies, other ways of studying a general system include: theoretical calculations, biomechanical models, computational models and analog models. Examples of biomechanical models include the use of cadaveric or animal tissue to study biomechanics of a specific joint [68-70]. Computational models include empirical models, dynamic musculoskeletal simulations, and finite element models (FEM) or analyses (FEA). [29-46] Researchers have begun developing computational analysis techniques to quantify parameters such as brace stiffness and the skin-to-brace interface pressures. The recent literature shows utilization of advanced 3D FEA techniques in combination with in vivo techniques such as hi-resolution and low-dose biplanar radiographs, pressure mapping systems, and compliance tracking devices. However, the current technology is still limited to patient-specific applications. A large collection of research on the biomechanics of Scoliosis bracing has been published by the researchers at the University of Montreal. In one study, Mac-Thiong performed an external biomechanical evaluation of the Boston Brace System for the treatment of AIS. In this particular study, the research team related the brace interface pressures with the internal brace strap tension. A custom pressure mapping system made of force-sensing transducers was created for the purpose of this experiment (Figure 2-9). [24] To measure the internal strap tension, an experimental, in-line load cell was added to the brace design. These techniques showed the relationship between strap tension magnitude and brace interface pressures. This study also concluded that placement of the straps and certain design modifications improved the effectiveness for the brace for certain Scoliosis curvature cases. Another University of Montreal group, led by Sevrain, performed an internal biomechanical evaluation of a related pathology, spondylolisthesis. What are interesting about this study are not the results as they pertain to the scope of this thesis, but rather the techniques for quantifying the internal forces of the spine. This research group created an

21
Figure 2-9. Mac-Thiong Study Results. Source: Reprinted with permission. Mac-Thiong JM, Petit Y, Aubin CE, Delorme S, Dansereau J, Labelle H. Biomechanical evaluation of the Boston brace system for the treatment of adolescent idiopathic scoliosis: relationship between strap tension and brace interface forces. Spine. Jan 1 2004;29(1):27, 29. [24]
22
advanced, patient-specific finite element analysis 3D model to analyze the internal forces expected within the intradiscal space of the lumbosacral junction under set conditions. Additionally, this 3D FEA model was used to analyze the stress and shear forces acting on the growth plates and discs within the lumbar spine (Figure 2-10). [44] These examples of current research demonstrate the small steps being taken towards overcoming obstacles behind understanding the Scoliosis deformity and current treatment techniques. Research limitations include difficulty assessing the biomechanical performance of a custom orthosis when one brace may have vast differences from the next. In addition to being limited by the variable patient-specific design and a small subject population, research is truly limited by a still-developing understanding of the biomechanics of spinal anatomy. The functional capacity of computational models is limited by the lack of validating in vivo and in vitro mechanics data. The last type of experimental model is the analog model. These models represent a targeted system by a simplified, more analyzable system, and include two types: physical anatomical and physical mechanical. Physical anatomical analog models have the same appearance as the targeted system, but do not function the same. An example is a synthetic skeleton model, used for demonstration purposes in an education setting. Physical mechanical analog models have comparable function to a targeted system, but differ in appearance. For example, ASTM testing models for biomechanical testing of spinal implants mandate the use of simple ultra-high molecular weight polyethylene (UHMWPE) blocks to represent the vertebrae, because the mechanical properties of UHMWPE is comparable to bone. These methods provide a feasible way to determine the fatigue or failure strength of a medical device, but do not simulate the physiological mechanics. Analog models can also be physically and mechanically representative of a system. A multi-level anatomically and mechanically correct synthetic physical model of the lumbar spine was developed for more sophisticated experimental testing of spinal implants. [17-18] So far, no validated analog model of the scoliosis deformity is known to exist. Analog models can be used to experimentally study interactions within the human body, or in this case, the forces applied to the spine from a scoliosis brace.
Biomechanical Testing Platform At the University of Tennessee Health Science Center in Memphis, Tennessee, researchers of the BioRobotics Laboratory have built experimental analog models to study various orthotics, including an adult thoracolumbar orthosis [71] and foot and ankle orthoses [72]. Testing of these experimental models was performed on a multi-axis robotic testing platform (RTP). Dr. Denis DiAngelo, with the help of several students, built the robot system [73] and created the control software in 2005. The robotic system consists of a controller (#MV540, Adept 128 Technologies, CA), servo motors, six-axis load sensors and a 4-DOF manipulator. The four axes includes: z-axis rostral-caudal and x-axis anterior–posterior translations, with sagittal plane (pitch) and out of plane axial (roll-wrist) rotations. This RTP was used extensively during the research described in the following chapters.

23
Figure 2-10. Sevrain FEM and Schematic of Load Path. Source: Reprinted with permission. Sevrain A, Aubin C-E, Gharbi H, Wang X, Labelle H. Biomechanical evaluation of predictive parameters of progression in adolescent isthmic spondylolisthesis: a computer modeling and simulation study. Scoliosis. 2012;7(2). [44]

24
CHAPTER 3. SCOLIOSIS ANALOG MODEL FOR THE EVALUATION OF BRACING TECHNOLOGY
Chapter 3 presents the results of a pilot study application of the Scoliosis Analog Model. The purpose of this study was to develop the model, use it to measure the forces applied to the spine by a Scoliosis brace, and quantify the structural stiffness properties of the brace. This chapter was also formatted as a manuscript for submission to the Journal of Prosthetics and Orthotics.
Introduction Scoliosis is a 3D skeletal deformity of the spine consisting of a combination of axial rotation and lateral curvature that measures 10 degrees or greater in the coronal plane. [1] Scoliosis curve types can vary widely, including single, double, and triple curve patterns and can be present in any one or multiple areas of the spine. According to the National Scoliosis Foundation, scoliosis affects an estimated 6 million people in the United States alone, approximately 2-3% of the population. [2] Idiopathic scoliosis with an onset after 10 years of age, is the most common spinal deformity treated by primary care physicians, pediatricians, and spinal surgeons (representing 85% of cases or 0.5-3.0% pediatric population). [2] It is estimated that out of the 600,000 patient visits, only 30,000 are treated with an orthosis and 38,000 are treated with spinal fusion surgery annually. [2] The standard method for assessing the curvature quantitatively is measurement of the Cobb angle (Figure 3-1), which is the angle between two lines, drawn perpendicular to the upper endplate of the uppermost vertebra involved and the lower endplate of the lowest vertebra involved. [50] The EOS Imaging System (EOS Imaging, Paris, France) simultaneously captures biplanar posteroanterior and lateral radiographs. [53] SterEOS software (EOS Imaging, Paris, France) uses these images to create a patient-specific 3D model of the spine (Figure 3-2) and to report scoliosis parameters such as the Cobb angle, critical vertebrae (highlighted in blue and yellow of Figure 3-2), and vertebral rotation. [53] Anthropometric and displacement measurement data obtained from the SterEOS imaging analysis can also be used for the creation and validation of an analog model. Bracing is typically recommended for treating AIS curves between 20 degrees and 50 degrees [65] with curve apex below T6 in patients with significant growth remaining, Risser grade ≤ 2. [51] Braces serve to maintain, and, in some cases, reduce [65] the spinal curve in order to prevent progression of the deformity by applying corrective forces while being worn. [21] Many braces use a three-point pressure principle as the method of correction, which involves fixation above, below, and at the apex of the curve. [52] The magnitude and direction of these corrective forces applied by the brace to the spine remain unknown, and are a common concern for clinicians and orthotists.
25
Figure 3-1. Scoliosis Cobb Angle Measurement Showing Critical Vertebral Anatomy.
Figure 3-2. Radiograph of Mid-Thoracic Three-Point Single Scoliosis Curve and SterEOS 3D Model Reconstruction Showing Color-Coded Critical Vertebrae.
26
Scoliosis braces can be rigid, flexible, or composite and can utilize passive or active correction mechanisms. An orthotist works with a manufacturer to fabricate a brace with custom contouring layers and padding. Typically an orthotist makes design alterations to a brace such as the addition of Velcro straps, extra pads, and section cutouts to improve the fit and comfort of a brace. However, there is no standard of application or common understanding of how changes to these design alterations (strap size, placement, number, pad variables) can affect the corrective capacity of a brace. The process is largely subjective and follows best judgment and practice, yet these steps are critical and should affect the patient’s decision to wear a brace. In the end, how well a brace works largely depends on the artisan experience-based fabrication methods of the orthotist. In-brace imaging is commonly used to measure the degree of spinal correction and determine brace efficacy. No force analysis is used during the brace design phase or evaluation process. However, alterations made to a brace can directly affect the structural properties and corrective force capacity of a brace. Up until recently, the outcome of bracing treatment has been highly debated. Katz et al. (2010) showed that bracing can be effective in preventing progression of curvature by tracking user compliance with an in-brace heat sensor. The researchers concluded that bracing effectiveness depends on the length of time the patient wears the brace. [10] Weinstein et al. (2013) designed and conducted a 5-year follow-up study, the Bracing in Adolescent Idiopathic Scoliosis Trial (BrAIST). [11] Findings from this study were reported in the Fall of 2013 and provided evidence that braces were effective (72% success rate) at treating scoliosis, where a success is defined as skeletal maturity without curve progression past the 50 degree threshold. BrAIST Co-author Lori Dolan discussed the outcomes of the study during a course [67] hosted by the American Academy of Orthotists & Prosthetists. She identified the need to determine what forces are applied to the spine, for a scientific method to determine whether these forces are unidirectional or three dimensional, and to understand the effects of brace alterations on curve correction and spinal loading. Current experimental research of scoliosis bracing mechanics has largely been limited to two dimensional (2D) and 3D imaging techniques [19-28] and computational models [29-46]. Imaging methods provide a measure of the angular deformity but no information of the brace mechanics or structural properties, such as axial and radial stiffness values. There is no biomechanical model of a scoliotic spine or testing assembly available to study scoliosis bracing mechanics. The objective was to design and validate an analog model of a mid-thoracic single curve scoliotic deformity for quantifying the structural properties of the brace and the force response of the brace on the spine. Additionally, the model was used to investigate the effects of strap-related brace design alterations. Nine different strap configurations were compared that represented common clinical decisions of how many straps to use, where to place the straps, and the type of strap material to ensure proper fitting of the brace on the patient's torso.
27
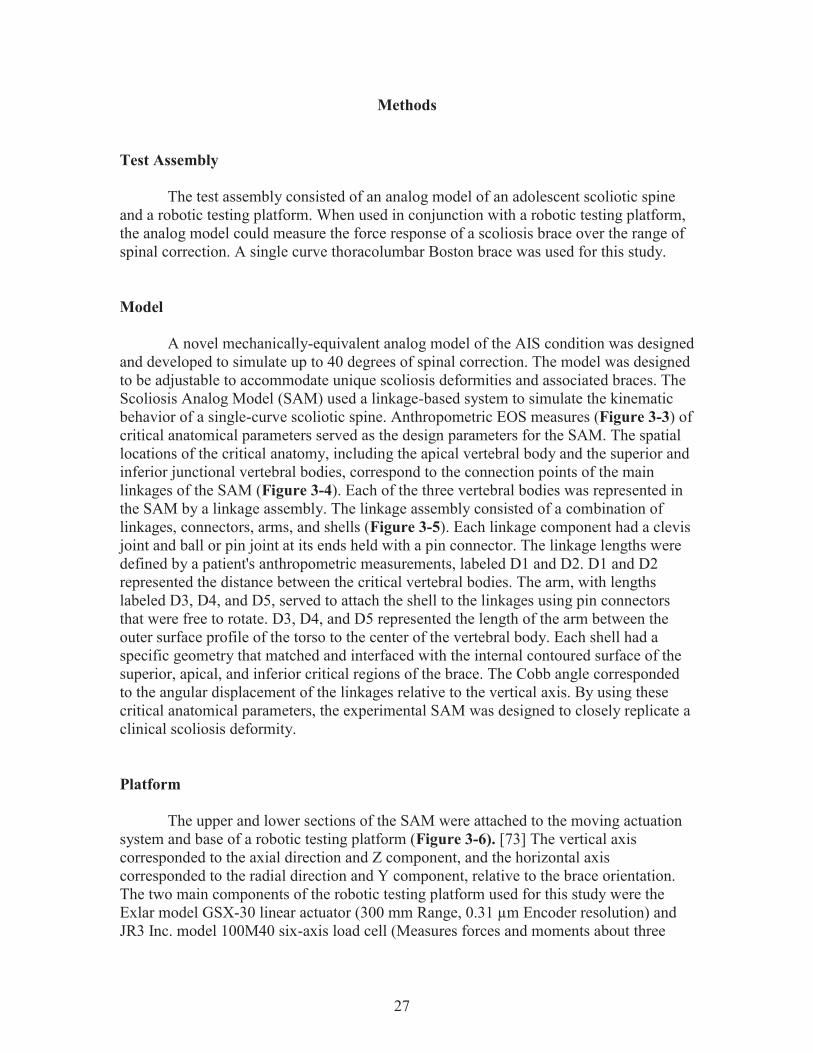
Methods Test Assembly The test assembly consisted of an analog model of an adolescent scoliotic spine and a robotic testing platform. When used in conjunction with a robotic testing platform, the analog model could measure the force response of a scoliosis brace over the range of spinal correction. A single curve thoracolumbar Boston brace was used for this study. Model A novel mechanically-equivalent analog model of the AIS condition was designed and developed to simulate up to 40 degrees of spinal correction. The model was designed to be adjustable to accommodate unique scoliosis deformities and associated braces. The Scoliosis Analog Model (SAM) used a linkage-based system to simulate the kinematic behavior of a single-curve scoliotic spine. Anthropometric EOS measures (Figure 3-3) of critical anatomical parameters served as the design parameters for the SAM. The spatial locations of the critical anatomy, including the apical vertebral body and the superior and inferior junctional vertebral bodies, correspond to the connection points of the main linkages of the SAM (Figure 3-4). Each of the three vertebral bodies was represented in the SAM by a linkage assembly. The linkage assembly consisted of a combination of linkages, connectors, arms, and shells (Figure 3-5). Each linkage component had a clevis joint and ball or pin joint at its ends held with a pin connector. The linkage lengths were defined by a patient's anthropometric measurements, labeled D1 and D2. D1 and D2 represented the distance between the critical vertebral bodies. The arm, with lengths labeled D3, D4, and D5, served to attach the shell to the linkages using pin connectors that were free to rotate. D3, D4, and D5 represented the length of the arm between the outer surface profile of the torso to the center of the vertebral body. Each shell had a specific geometry that matched and interfaced with the internal contoured surface of the superior, apical, and inferior critical regions of the brace. The Cobb angle corresponded to the angular displacement of the linkages relative to the vertical axis. By using these critical anatomical parameters, the experimental SAM was designed to closely replicate a clinical scoliosis deformity. Platform The upper and lower sections of the SAM were attached to the moving actuation system and base of a robotic testing platform (Figure 3-6). [73] The vertical axis corresponded to the axial direction and Z component, and the horizontal axis corresponded to the radial direction and Y component, relative to the brace orientation. The two main components of the robotic testing platform used for this study were the Exlar model GSX-30 linear actuator (300 mm Range, 0.31 μm Encoder resolution) and JR3 Inc. model 100M40 six-axis load cell (Measures forces and moments about three

28
Figure 3-3. EOS Data Used in Designing the Scoliosis Analog Model.

29
Figure 3-4. Critical Anatomy Corresponding to SAM Components Used in Designing the Scoliosis Analog Model.

30
Figure 3-5. SAM Components.

31
Figure 3-6. Test Assembly Consisting of the SAM Mounted in the Programmable Robotic Testing Platform.

32
orthogonal axes, 1000 Hz Sampling rate, 800 N Compressive load capacity). The upper mounting plate of the SAM was centered and fixed to the load cell that was attached to the actuator. The lower mounting plate of the SAM was centered and fixed to a passive turn-table that prevented artifact frictional forces from building up in the linkages. Validation of SAM The SAM linkage assembly was mounted on the testing platform and moved into the starting position with an angular displacement of 30 degrees. At this point, the load cell was zeroed to cancel out the weight of the SAM assembly. The SAM assembly was tested first without an input load to ensure the links moved freely. Less than 3 N of axial force occurred over 40 degrees of linkage rotation. The next step was to verify the transmission of any forces acting on the linkage assembly. A 4.54 kg (10 pound) weight was suspended from a cable that passed over a pulley and connected to the apex of the SAM. A series of different input forces (Figure 3-7) were applied to the apex point of the SAM and the force components acting at the ends of the linkage assembly were measured to determine the error between the applied input forces and the measured force components of the SAM linkage system. Due to the rigid body design of the SAM, the expected force response was calculated based on the trigonometric relation of the known orientations of the linkages and the applied force. A Brecknell digital handheld tension scale was suspended in line between the attachment at the SAM apex and the pulley and revealed a 10% reduction of the suspended weight (or 4.5 N) [74]. Because of this, all computational tests and theoretical calculations were performed using 40 N as the input force, Fi. Relative to the apex of the SAM, the height of the pulley assembly was adjustable, which allowed the input force to be applied at a set orientation. The testing platform was programmed to displace along the vertical axis a given distance and speed (4.8 mm/s) (see Appendix A for Adept program code and Figure A-1 for a sample screenshot of the testing log during a test). Downward movement caused the SAM to transition from the original state with an angular displacement of 30 degrees to the deformed state with an angular displacement of 70 degrees, thus simulating 40 degrees change in the spinal curve. Five orientations of the input force relative to a horizontal line along the Y-axis were tested, including -20, -10, 0 (horizontal), +10, +20, and +30 degrees. In these tests, negative angles are below the horizontal reference and positive angles are above the horizontal reference (Figure 3-7). Each input load orientation was tested three times. Before each run (simulated Cobb angle of 30 degrees), the suspended weight was reset and stabilized. The force components, Fz and Fy, applied by the weight were measured at the load cell at a sampling rate of 25 Hz. These measured components were transformed to the pinned joint of the superior connector of the linkage assembly (Fz' and Fy') for analysis. Also, the linkage assembly angular displacements (i.e., simulated Cobb angle) were measured at a sampling rate of 25 Hz. Reported angle and horizontal force measurements were doubled to represent the symmetry of the SAM.

33
Figure 3-7. Two Dimensional Validation of SAM Setup.

34
A 2D CAD linkage model was created to simulate the kinematic behavior of the SAM. An analysis was performed using Working Model 2D (Design Simulation Technologies, Inc.). Just as in the experimental tests, the SAM CAD linkage model was moved from the original state to the deformed state and force components were recorded at the location of the load cell while a 45 N (10 pound) tensile force was applied to the apical connector. The orientation of the force was varied between -20 degrees and 30 degrees in 10 degree increments, as in the experimental tests. The force components measured during the experimental tests were compared to the force components measured during the computational simulations. The axial force components for the experimental and computational tests were plotted against the simulated Cobb angle for each input force angle. Using Microsoft Excel (2007), a fourth order polynomial equation was generated for each curve. The percent error relative to the computational results was calculated for each input force orientation. The mean percent error revealed that there is a 6% force reduction within the SAM system over the testing range (see Appendix B, Figure B-1 and Table B-1 for validation data). This error can be contributed to the frictional losses between the components of the linkage assembly. Brace Alterations A single curve thoracolumbar Boston brace was used for this study (Figure 3-8). Two basic, adhesive-backed Velcro strips were added to the posterior side of the brace (Figure 3-8) in order to accommodate the addition of Velcro straps (Figure 3-8). The brace was tested in nine configurations (Table 3-1), where each of these varying strap configurations represents a design alteration of the brace that could result from the professional opinion of the orthotist. All straps were placed in a horizontal orientation. The strap materials tested include basic, non-backed 38.1 mm (1.5 inch) Velcro, 25.4 mm (1 inch) Polypropylene webbing (i.e. “buckle strap”), and vinyl-coated 18-8 stainless steel wire cable. The rigid cable configuration was used to simulate a rigid brace condition. The nine configurations were grouped by material, where the Velcro strap group included one through four straps (labeled as configurations A, B, C, and D), the buckle strap group included one through three straps (labeled as configurations E, F, and G), the rigid cable group included configuration H, and the unconstrained group included configuration I. Three comparative studies were carried out: one within the Velcro group, one within the buckle strap group, and one between all four material groups. Design Protocol Parameters Suspension techniques during the assessment of adolescents with scoliosis have shown that body weight provides an effective way of loading the spinal curve to predict the amount of Cobb angle reduction possible with bracing. [22, 23] Clinically speaking, an adolescent with a scoliosis brace weighs between 100 lbs and 150 lbs, or 445 N and667 N. Based on known anthropometric data [75], the average upper torso represents half of the total body weight (between 225 N and 335 N here). As a result, two ranges of

35
Figure 3-8. The Single Curve Thoracolumbar Boston Brace Used in This Study. Table 3-1. Brace Configurations. Configuration Description
A One Velcro strap placed at apex level
B Two Velcro straps placed equidistant above apex and below apex C Three Velcro straps placed, one at apex level and two equidistant above
and below apex D Four Velcro straps placed, spaced equidistant along length of brace E One semi-rigid buckle strap placed at apex level F Two semi-rigid buckle straps placed equidistant above apex and below
apex G Three semi-rigid buckle straps placed, one at apex level and two
equidistant above and below apex H One rigid cable placed at apex level I Unconstrained
36
loading were established, the nondestructive range and the destructive range. The nondestructive range represents the Cobb angle range that would typically be treated with a scoliosis brace, and it provides an appropriate factor of safety without failure at the upper range limit. The destructive range represents any Cobb angle beyond the range that would normally be treated with the brace, and was included to demonstrate the failure response of the straps. The simulated spinal curve correction was across the entire validated SAM range of 40 degrees in order to assess the full capacity of the brace. The first 20 degrees of correction (i.e., 30 degrees Cobb to 50 degrees Cobb) represented the nondestructive range. The structural stiffness values of the brace were calculated over this loading range. Further correction (i.e., 50 degrees Cobb to 70 degrees Cobb) represented the destructive range. A targeted upper torso weight range of 225 N to 335 N served as a clinically relevant reference point for comparison to the measured axial force components. Protocol The SAM assembly was mounted and moved to the start position set to an angular displacement of 30 degrees. The brace was mounted onto the SAM assembly (Figure 3-9). At this point, the load cell was zeroed to cancel out the weight of the SAM assembly and the brace. Straps were added to the brace as described in Table 3-1. The testing platform was programmed to displace along the vertical axis a given distance and speed (0.6 mm/s). Downward movement caused the SAM to transition from the original state with an angular displacement of 30 degrees to the deformed state with an angular displacement of 70 degrees, thus simulating 40 degrees change in the spinal curve. Each brace configuration was tested three times. Before each run (at 30 degrees), the straps were reset to the original position and orientation with negligible strap tension. Data Management The 3D force components applied by the brace and the linkage assembly angular displacements (i.e., Simulated Cobb angle) were measured at a sampling rate of 25 Hz. These two variables were plotted in a force-displacement curve. The slope of the curve within the nondestructive range represented the structural properties of the brace along a specific axis, where the vertical axis corresponded to the "axial" direction and the horizontal axis corresponded to the "radial" direction. Vertical force components and angular displacement of the linkage assembly were used to calculate the axial stiffness of the brace. Horizontal force components in the plane of motion and angular displacement of the linkage assembly were used to calculate the radial stiffness of the brace. Stiffness was expressed as a resistive force relative to the angular change of the linkage system. This was preferred over the traditional linear stiffness measure so that the resultant stiffness was more easily relatable to the clinical Cobb angle measurement. IBM SPSS 22 software program (IBM Corp. Released 2013. IBM SPSS Statistics for Windows,

37
Figure 3-9. Methodology for Simulating a Changing Spinal Curve Using Linkage Components.

38
Version 22.0, Armonk, NY: IBM Corp.) was used to compare the stiffness values derived from the force-displacement curves. The mean stiffness values per configuration were calculated from the three runs, as well as the standard deviations and standard errors. The Velcro group configuration mean stiffness values were compared using a one-way ANOVA and ranked using Tukey’s post hoc test. The buckle strap group configuration mean stiffness values were compared using a one-way ANOVA and ranked using Tukey’s post hoc test. The Velcro group and the buckle group mean stiffness values were each compared to the rigid strap and unconstrained groups using a one-way ANOVA and ranked using Tukey’s post hoc test. All statistical tests were performed at α = 0.05 (see Appendix C, Table C-1 for the raw stiffness values used and Table C-2, Table C-3, and Figure C-1 for other calculated descriptive variables).
Results The axial and radial force-displacement curves for configuration "C. Three Velcro Straps" are shown in Figure 3-10. A similar graph was generated for each of the nine configurations, consisting of one radial curve and one axial curve per run. A linear trendline equation was generated for the curve within the nondestructive range. The slope of the equation for each curve represents the structural properties of the brace for that run. The mean curve of the three runs was graphed for each direction. The mean radial and axial force-displacement curves for the nine configurations are shown in Figure 3-11 and Figure 3-12. The measured axial forces for the one unconstrained and eight constrained brace configurations ranged between 0 N and 90 N and 0 N and 600 N respectively. The measured radial forces ranged between 0 N and 6 N and 0 N and 90N respectively. For the most common clinical configuration, "C. Three Velcro Straps", the measured forces ranged between 0 N and 510 N radially and between 0 N and 75 N axially. For all configurations except "H. One Rigid Cable", the axial displacement ranged between 15 mm and 30 mm and the total angular displacement was an average of 35 degrees (ranged between 25 degrees and 42 degrees). For configuration, "H. One Rigid Cable", the axially displacement was only 1.5 mm and total angular displacement was 3 degrees. The structural properties of the brace are represented by the means and standard deviations of the axial and radial stiffness values, and are shown in Figure 3-13, Figure 3-14, and Figure 3-15. The mean stiffness values for the “I. Unconstrained” configuration are 0.0 N/deg radially and 1.0 N/deg axially. The mean stiffness values are 1.3 N/deg radially and 17.6 N/deg axially for the “A. One Velcro Strap” configuration, 2.4 N/deg radially and 23.3 N/deg axially for the “B. Two Velcro Straps” configuration, 3.5 N/deg radially and 27.2 N/deg axially for the “C. Three Velcro Straps” configuration, and 3.6 N/deg radially and 29.3 N/deg axially for the “D. Four Velcro Straps” configuration. A similar trend of increased radial and axial stiffness values occurred when more buckle straps were added. Use of a rigid cable significantly increased the radially and axially stiffness levels well beyond the level achievable using either type of strap material. An optimal brace radial stiffness was achieved with three Velcro straps, i.e., there

39
Figure 3-10. Brace Force Response with Configuration “C. Three Velcro Straps.”
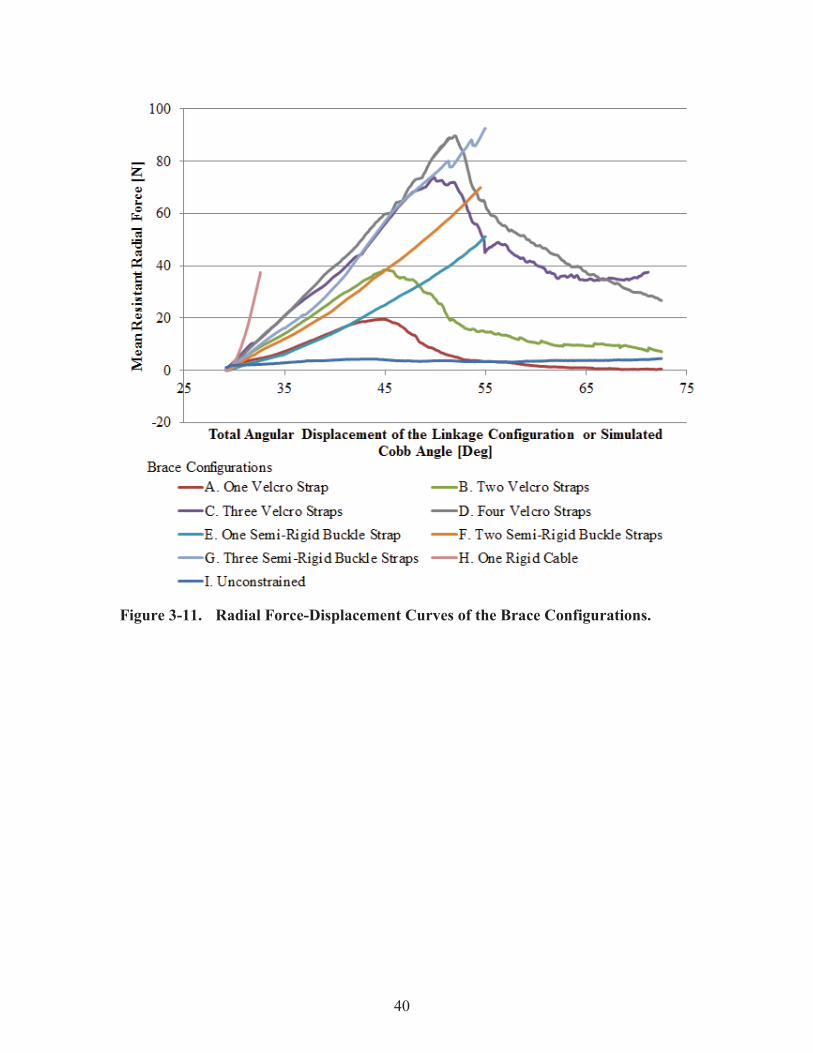
40
Figure 3-11. Radial Force-Displacement Curves of the Brace Configurations.
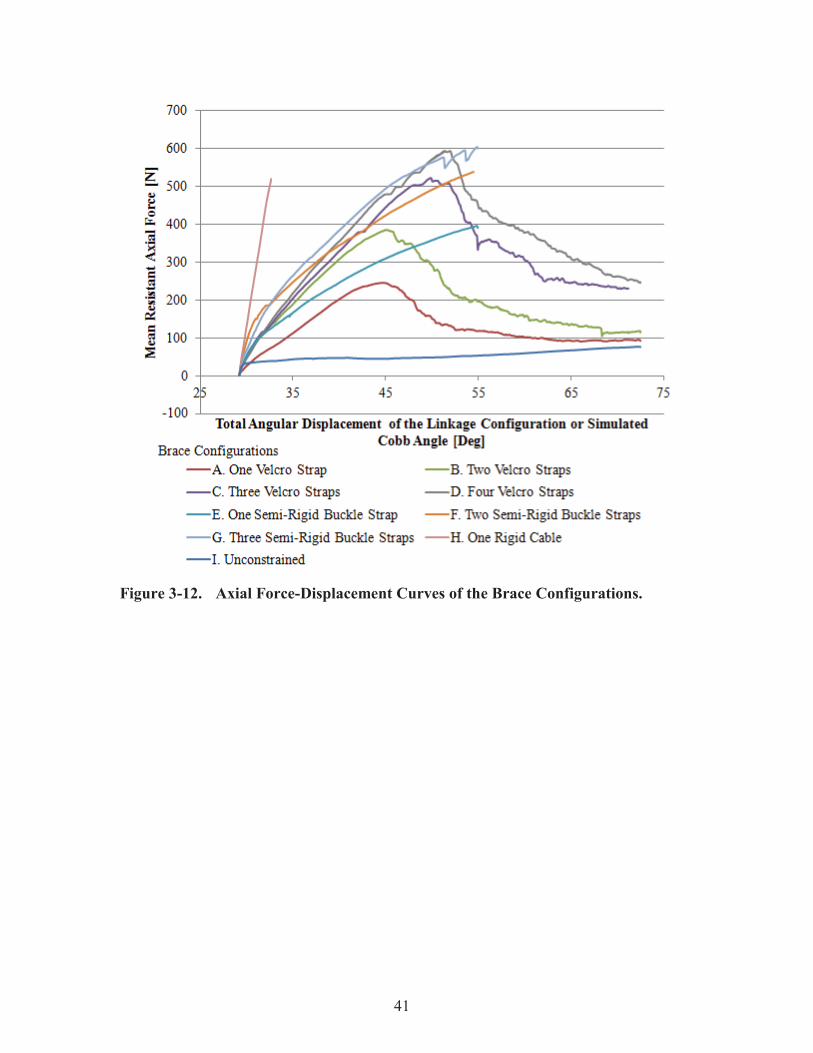
41
Figure 3-12. Axial Force-Displacement Curves of the Brace Configurations.

42
Figure 3-13. Comparative Study: Within Velcro Group. # Denotes a significant difference between the two values (p < 0.05).
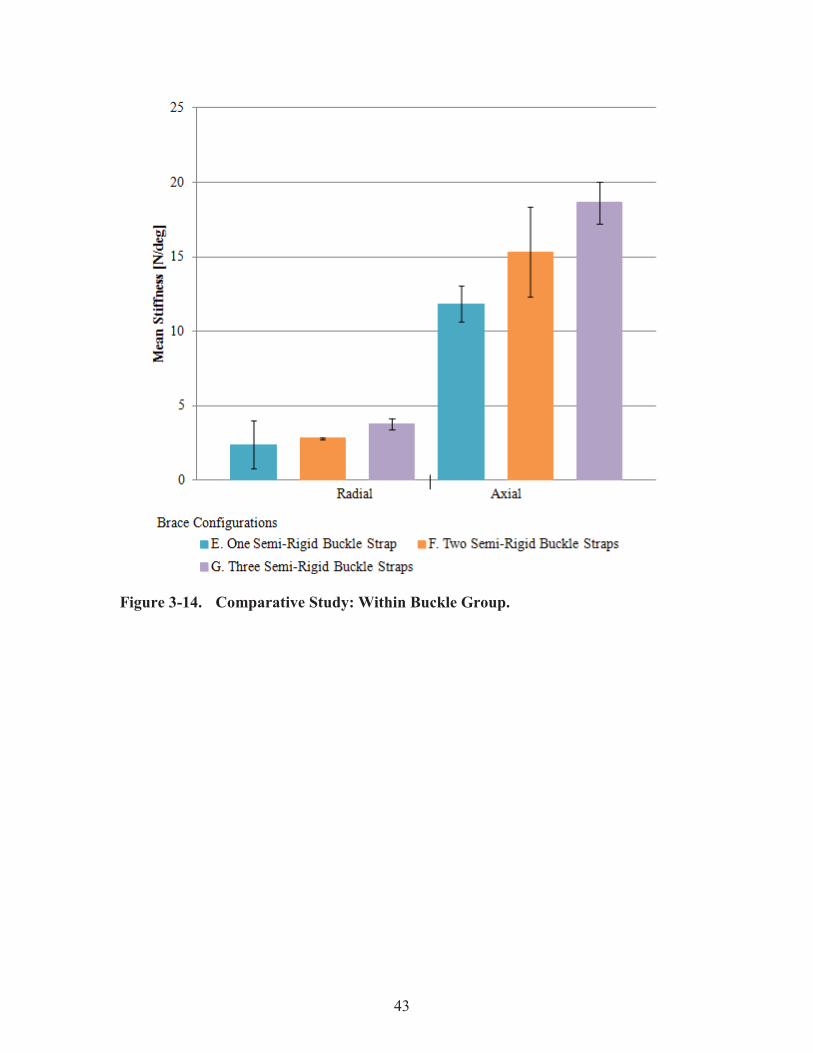
43
Figure 3-14. Comparative Study: Within Buckle Group.

44
Figure 3-15. Comparative Study: Between All Groups. * Denotes a significant difference between that configuration and the "H. One Rigid Cable" configuration (p < 0.05) and & denotes a significant difference between that configuration and the "I. Unconstrained" configuration (p < 0.05).

45
was no significant stiffness gained by adding a fourth strap (Figure 3-13). For the case of the buckle straps (Figure 3-14), no significant stiffness gain occurred when more of the semi-rigid buckle straps were added. There exists a significant difference between the rigidly constrained brace stiffness and each of the other configurations (Figure 3-15). Addition of either strap type significantly increased the stiffness values relative to the unconstrained configuration in most cases (Figure 3-15).
Discussion Findings Structural properties provide a means to compare and classify bracing technology and to understand how certain design features affect the curve correction capacity of a brace. During the fabrication of a brace, the orthotist may desire to change brace structural stiffness to achieve better patient fit, more comfort, or better brace performance. For example, a patient with poor muscle tone and excessive anatomical spinal alignment may require a stiffer brace to achieve and maintain the desired level of correction. In this case, the addition of extra Velcro straps could provide the increase in brace stiffness required for that patient. The decision to add straps is made purely based on the professional judgment of the orthotist. For the Boston brace used in this study, optimal brace stiffness was reached after application of three Velcro straps. Unlike the Velcro configurations, the addition of two and three semi-rigid buckle straps did not yield significantly different brace stiffness values (Figure 3-14). Traditionally, Dacron or cotton webbing is used as backing for the Velcro strap. This testing was performed using basic, non-backed Velcro. In the future, the SAM and test assembly can be used to characterize different types of backed Velcro straps, as well as other brace design alterations. These features include brace pads, pad placement, pad geometry, material selection, material cut-outs, rigid components, and other fitting elements. Braces serve to reduce and prevent progression of the spinal curve by applying corrective forces. Orthotists can modify the expected brace force response through alterations of the brace design, such as pad placement and orientation. Up until now, there has been no experimental model capable of quantifying the magnitude and direction of the corrective forces applied by a brace to a torso. Using the SAM, the net force components of 75 N radial (Figure 3-11) and 510 N axial (Figure 3-12) were measured during testing of the clinically-relevant configuration, "C. Three Velcro Straps" at approximately 50 degrees Cobb angle. The spine and the ribs were modeled as rigid members. Assuming the arm component to be rigid, the force orientation is transferred along the arm from the apex to the shell. These resultant spinal forces correspond to applied brace forces of 150 N inward and 510 N upward (Figure 3-16). The inward force is 150 N due to symmetry of the model. When compared to the scenario where the brace only applies a purely inward force of 150 N (Figure 3-17) which could occur when a fitting pad is placed at the level of the apex of the spinal curve, the free body diagram reveals that the maximum net vertical force component would only be 320 N

46
Figure 3-16. Free Body Diagram Showing Measured Force Response at 50 Degree Cobb Angle.
Figure 3-17. Free Body Diagram Showing Inward Only Force Response Scenario at 50 Degree Cobb Angle.
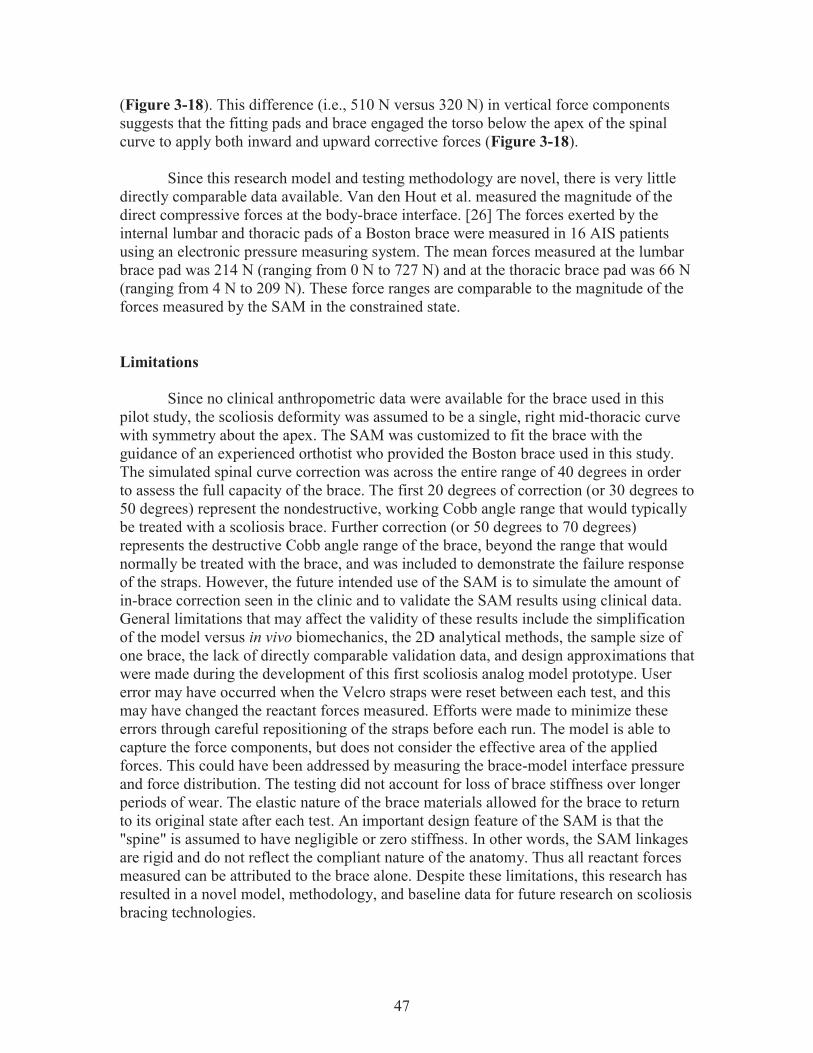
47
(Figure 3-18). This difference (i.e., 510 N versus 320 N) in vertical force components suggests that the fitting pads and brace engaged the torso below the apex of the spinal curve to apply both inward and upward corrective forces (Figure 3-18). Since this research model and testing methodology are novel, there is very little directly comparable data available. Van den Hout et al. measured the magnitude of the direct compressive forces at the body-brace interface. [26] The forces exerted by the internal lumbar and thoracic pads of a Boston brace were measured in 16 AIS patients using an electronic pressure measuring system. The mean forces measured at the lumbar brace pad was 214 N (ranging from 0 N to 727 N) and at the thoracic brace pad was 66 N (ranging from 4 N to 209 N). These force ranges are comparable to the magnitude of the forces measured by the SAM in the constrained state. Limitations Since no clinical anthropometric data were available for the brace used in this pilot study, the scoliosis deformity was assumed to be a single, right mid-thoracic curve with symmetry about the apex. The SAM was customized to fit the brace with the guidance of an experienced orthotist who provided the Boston brace used in this study. The simulated spinal curve correction was across the entire range of 40 degrees in order to assess the full capacity of the brace. The first 20 degrees of correction (or 30 degrees to 50 degrees) represent the nondestructive, working Cobb angle range that would typically be treated with a scoliosis brace. Further correction (or 50 degrees to 70 degrees) represents the destructive Cobb angle range of the brace, beyond the range that would normally be treated with the brace, and was included to demonstrate the failure response of the straps. However, the future intended use of the SAM is to simulate the amount of in-brace correction seen in the clinic and to validate the SAM results using clinical data. General limitations that may affect the validity of these results include the simplification of the model versus in vivo biomechanics, the 2D analytical methods, the sample size of one brace, the lack of directly comparable validation data, and design approximations that were made during the development of this first scoliosis analog model prototype. User error may have occurred when the Velcro straps were reset between each test, and this may have changed the reactant forces measured. Efforts were made to minimize these errors through careful repositioning of the straps before each run. The model is able to capture the force components, but does not consider the effective area of the applied forces. This could have been addressed by measuring the brace-model interface pressure and force distribution. The testing did not account for loss of brace stiffness over longer periods of wear. The elastic nature of the brace materials allowed for the brace to return to its original state after each test. An important design feature of the SAM is that the "spine" is assumed to have negligible or zero stiffness. In other words, the SAM linkages are rigid and do not reflect the compliant nature of the anatomy. Thus all reactant forces measured can be attributed to the brace alone. Despite these limitations, this research has resulted in a novel model, methodology, and baseline data for future research on scoliosis bracing technologies.

48
Figure 3-18. Translational Responses of the Spine.

49
CHAPTER 4. PRELIMINARY FINDINGS OF SAM CASE STUDY APPLICATION
Chapter 4 encompasses the preliminary results of a case study application of the SAM. The purpose of this study was to demonstrate that the SAM is a clinical representation of a patient with Scoliosis. The work described in this chapter and future work will be compiled into a manuscript and submitted to the international, peer-reviewed, journal Spine.
Introduction Demonstrating that an analog model is an accurate representation of a real world situation is essential to proving the value of the model. At LCH in Memphis, TN, adolescents with Scoliosis are assessed by orthopedic surgeons on a regular basis. The patients that are good candidates for bracing treatment are prescribed a brace and visit an orthotist. The orthotist who works with LCH, Jack Steele of COPI, fabricates, adjusts, and fits braces. Through collaboration between the UTHSC BioRobotics Laboratory, LCH, and COPI, a translational research plan was created, as shown in Figure 4-1.
An IRB approved case study was arranged to be performed in order to demonstrate the capacity of the SAM to test a patient's brace. A 13 year old, skeletally immature (Risser 0), male with AIS currently undergoing bracing treatment was selected to be studied. The patient had a right-sided thoracolumbar curve measuring 33 degrees at the start of treatment. A Boston brace was custom fabricated and fit on the patient by the orthotist. EOS images taken of the patient while wearing the brace immediately after the initial brace fitting showed a curve measuring 26 degrees. A duplicate brace was ordered and fabricated by the orthotist, and was provided to the BioRobotics Laboratory to be tested with the SAM. The objective of this study was to customize SAM to simulate spinal changes that occur through bracing treatment of a LCH patient and quantify both the forces applied by the brace to the spine to achieve the degree of correction and the structural stiffness properties of the brace.
Design parameters for the SAM customization and modified testing protocol were provided by the patient data, such as EOS images, brace design report, and patient visit reports. The patient's upper torso weight was used to determine the targeted load value. The patient's in-brace Cobb angle correction from 33 degrees to 26 degrees was simulated with the SAM and a duplicate brace. The measured brace force response was compared to the targeted load value to determine how well the SAM simulation replicates the observed correction relative to the patient's upper torso weight.

50
Figure 4-1. SAM Case Study Design with Collaboration Between LCH and UTHSC BioRobotics Laboratory. Interactions between the clinical setting and the laboratory setting allow for patient-centered model customization and brace analysis. Translational measures acquired during routine treatment are used to tune the SAM to replicate the patient’s unique deformity. Brace performance data from in vitro testing are used to make brace design recommendations. * Denotes optional in vivo tests that can be performed for additional validation measures.
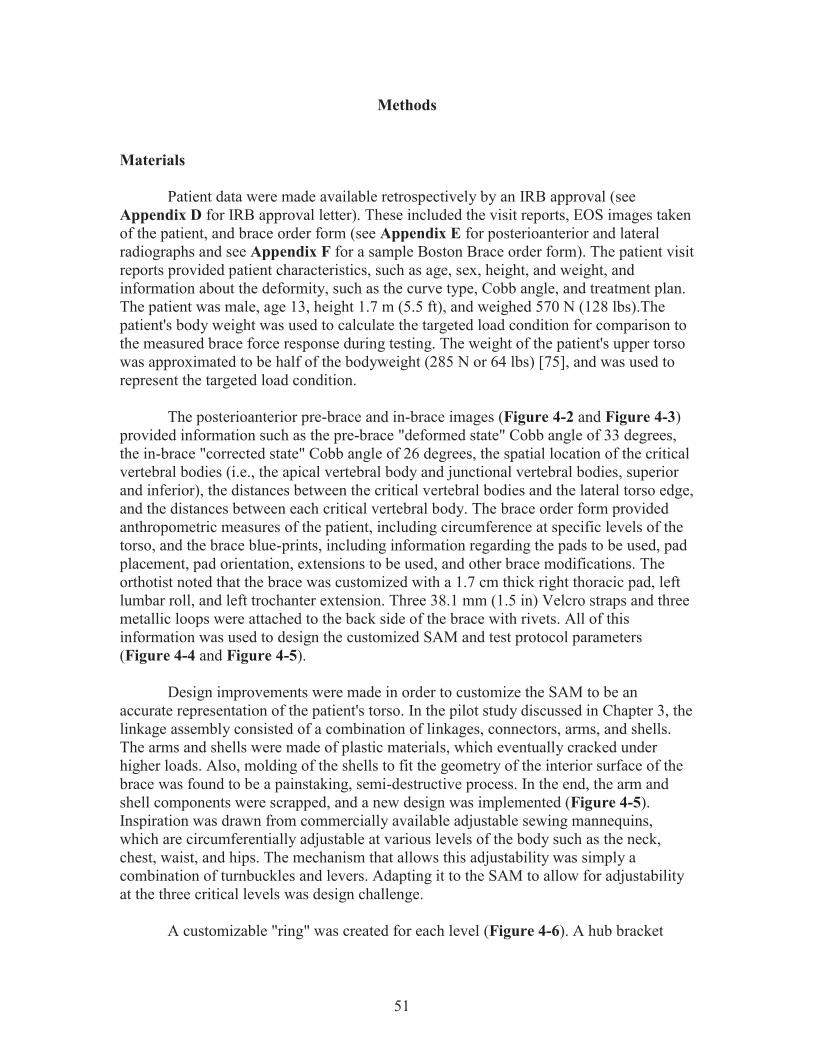
51
Methods Materials Patient data were made available retrospectively by an IRB approval (see Appendix D for IRB approval letter). These included the visit reports, EOS images taken of the patient, and brace order form (see Appendix E for posterioanterior and lateral radiographs and see Appendix F for a sample Boston Brace order form). The patient visit reports provided patient characteristics, such as age, sex, height, and weight, and information about the deformity, such as the curve type, Cobb angle, and treatment plan. The patient was male, age 13, height 1.7 m (5.5 ft), and weighed 570 N (128 lbs).The patient's body weight was used to calculate the targeted load condition for comparison to the measured brace force response during testing. The weight of the patient's upper torso was approximated to be half of the bodyweight (285 N or 64 lbs) [75], and was used to represent the targeted load condition.
The posterioanterior pre-brace and in-brace images (Figure 4-2 and Figure 4-3) provided information such as the pre-brace "deformed state" Cobb angle of 33 degrees, the in-brace "corrected state" Cobb angle of 26 degrees, the spatial location of the critical vertebral bodies (i.e., the apical vertebral body and junctional vertebral bodies, superior and inferior), the distances between the critical vertebral bodies and the lateral torso edge, and the distances between each critical vertebral body. The brace order form provided anthropometric measures of the patient, including circumference at specific levels of the torso, and the brace blue-prints, including information regarding the pads to be used, pad placement, pad orientation, extensions to be used, and other brace modifications. The orthotist noted that the brace was customized with a 1.7 cm thick right thoracic pad, left lumbar roll, and left trochanter extension. Three 38.1 mm (1.5 in) Velcro straps and three metallic loops were attached to the back side of the brace with rivets. All of this information was used to design the customized SAM and test protocol parameters (Figure 4-4 and Figure 4-5). Design improvements were made in order to customize the SAM to be an accurate representation of the patient's torso. In the pilot study discussed in Chapter 3, the linkage assembly consisted of a combination of linkages, connectors, arms, and shells. The arms and shells were made of plastic materials, which eventually cracked under higher loads. Also, molding of the shells to fit the geometry of the interior surface of the brace was found to be a painstaking, semi-destructive process. In the end, the arm and shell components were scrapped, and a new design was implemented (Figure 4-5). Inspiration was drawn from commercially available adjustable sewing mannequins, which are circumferentially adjustable at various levels of the body such as the neck, chest, waist, and hips. The mechanism that allows this adjustability was simply a combination of turnbuckles and levers. Adapting it to the SAM to allow for adjustability at the three critical levels was design challenge. A customizable "ring" was created for each level (Figure 4-6). A hub bracket
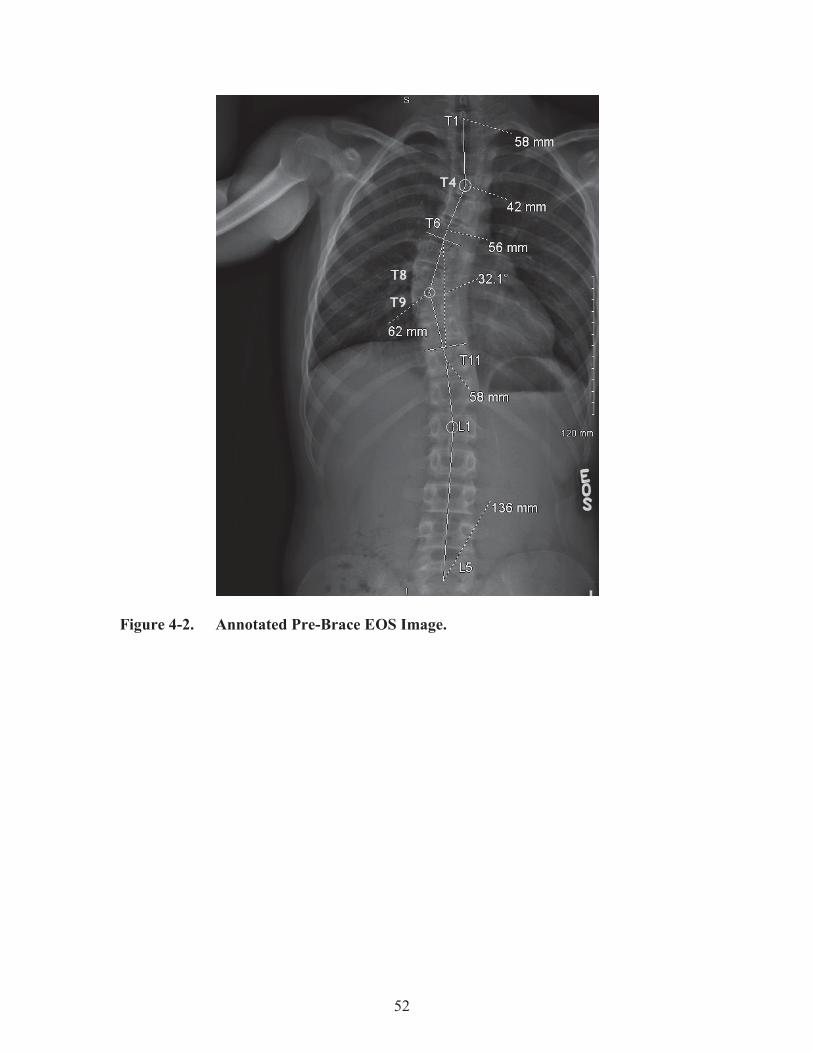
52
Figure 4-2. Annotated Pre-Brace EOS Image.

53
Figure 4-3. Annotated In-Brace EOS Image.

54
Figure 4-4. Radiographic Design Parameters for Custom SAM.
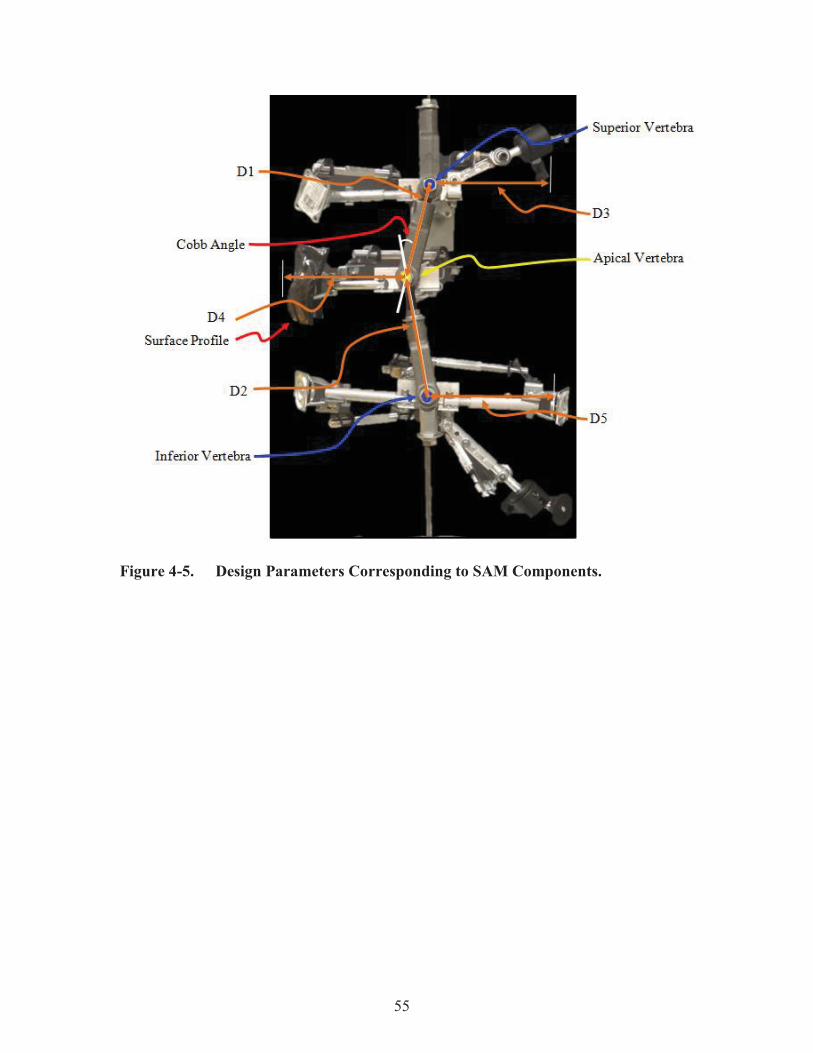
55
Figure 4-5. Design Parameters Corresponding to SAM Components.

56
Figure 4-6. SAM from Front and Rear.

57
served as the point of connection between the linkage connectors and the ring components. For coarse and fine tuning of the ring size, the design included a combination of telescoping arms, threaded brackets, and turnbuckles. To serve as points of contact between the ring and the brace, swivel caster brackets and swivel ball heads were used depending on the geometry of the brace at the point of contact. The interior surface of the case study brace presented the biggest challenge. At the superior level, a relief window and slot were cut into the brace, which limited the surface area available for engagement with the SAM. Also, the orthotist included a axillary extension on the left side in the brace design. The extension provided additional support to the patient's torso when worn, and had to be included in the SAM analysis. Since the extension was spatially superior to the superior connector plane, the ring was modified to include an offset arm, which allowed for a point of contact with the axillary extension. The right side and forward section of the superior ring remained in plane with the superior connector of the linkage model, and served as a second and third point of contact, respectively. Similarly, at the inferior level of the brace interior surface, a left side trochanter extension was included in the brace design. To make an out-of-plane point of contact with the extension, an offset arm was extended from the inferior ring. Three other points of contact, one left, one right and one forward, were made at the inferior level, each in plane. At the apical level, a right side, 1.7 cm thick thoracic pad was placed. A thermoplastic shell, similar to the shells of the previous design, was molded to capture the geometry of the pad. This could not be avoided due to the large surface area of the pad. The shell was fixed to the apical ring in plane with the apical level. A second point of contact was made at the forward section of the brace. The spatial location of the connectors, linkage lengths, inter-vertebral distances, and ring sizes were adjusted the various dimensions taken from the EOS images and reports. When fully assembled, the SAM was fit with the case study brace (Figure 4-7). The width of the posterior opening of the brace was measured and compared to the opening shown in the in-brace images to confirm proper fit. Protocol The SAM assembly was mounted and moved to the start position set to an angular displacement of 26 degrees. At this point, the load cell was zeroed to cancel out the weight of the SAM assembly. The brace was mounted onto the SAM assembly (Figure 4-8). The testing platform was programmed to displace along the vertical axis a given distance and speed (0.075 mm/s). Downward movement caused the SAM to transition from the original state with an angular displacement of 26 degrees to the deformed state with an angular displacement of 33 degrees, thus simulating 7 degrees change in the spinal curve. Twelve runs were performed. Before each run (at 26 degrees), the straps were reset to the original position and orientation with negligible strap tension.

58
Figure 4-7. Boston Brace from Front and Rear.

59
Figure 4-8. SAM Without and with Case Study Brace.
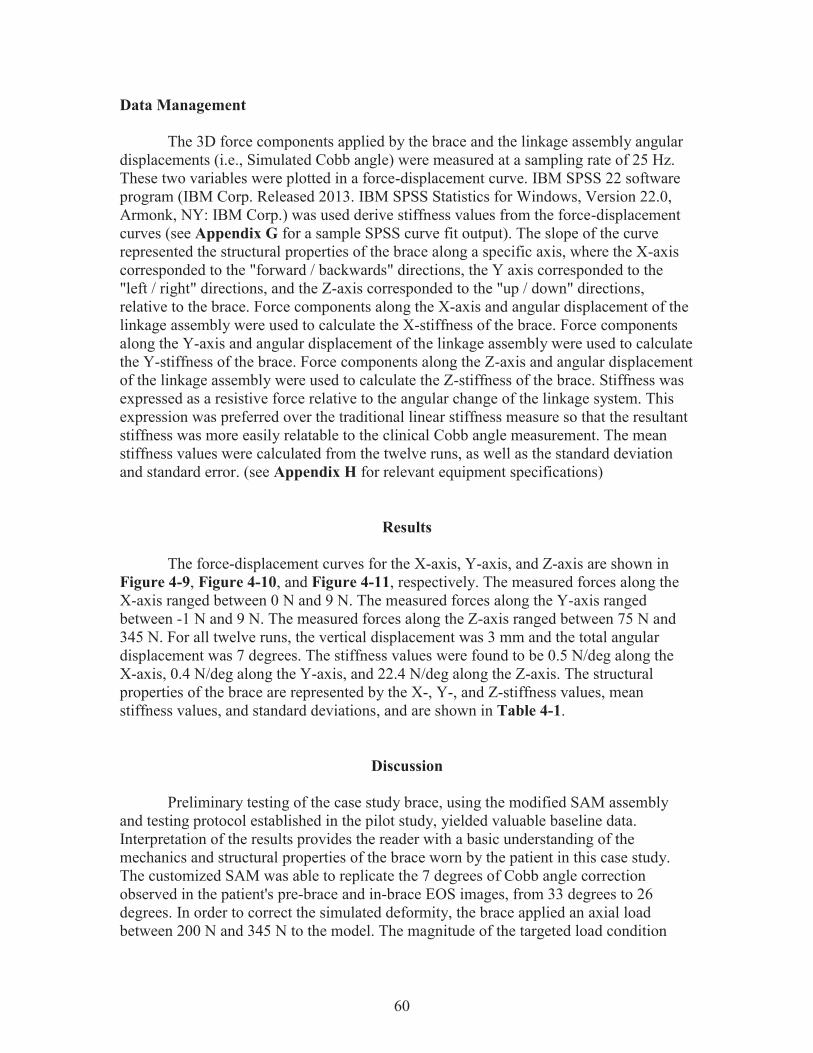
60
Data Management The 3D force components applied by the brace and the linkage assembly angular displacements (i.e., Simulated Cobb angle) were measured at a sampling rate of 25 Hz. These two variables were plotted in a force-displacement curve. IBM SPSS 22 software program (IBM Corp. Released 2013. IBM SPSS Statistics for Windows, Version 22.0, Armonk, NY: IBM Corp.) was used derive stiffness values from the force-displacement curves (see Appendix G for a sample SPSS curve fit output). The slope of the curve represented the structural properties of the brace along a specific axis, where the X-axis corresponded to the "forward / backwards" directions, the Y axis corresponded to the "left / right" directions, and the Z-axis corresponded to the "up / down" directions, relative to the brace. Force components along the X-axis and angular displacement of the linkage assembly were used to calculate the X-stiffness of the brace. Force components along the Y-axis and angular displacement of the linkage assembly were used to calculate the Y-stiffness of the brace. Force components along the Z-axis and angular displacement of the linkage assembly were used to calculate the Z-stiffness of the brace. Stiffness was expressed as a resistive force relative to the angular change of the linkage system. This expression was preferred over the traditional linear stiffness measure so that the resultant stiffness was more easily relatable to the clinical Cobb angle measurement. The mean stiffness values were calculated from the twelve runs, as well as the standard deviation and standard error. (see Appendix H for relevant equipment specifications)
Results The force-displacement curves for the X-axis, Y-axis, and Z-axis are shown in Figure 4-9, Figure 4-10, and Figure 4-11, respectively. The measured forces along the X-axis ranged between 0 N and 9 N. The measured forces along the Y-axis ranged between -1 N and 9 N. The measured forces along the Z-axis ranged between 75 N and 345 N. For all twelve runs, the vertical displacement was 3 mm and the total angular displacement was 7 degrees. The stiffness values were found to be 0.5 N/deg along the X-axis, 0.4 N/deg along the Y-axis, and 22.4 N/deg along the Z-axis. The structural properties of the brace are represented by the X-, Y-, and Z-stiffness values, mean stiffness values, and standard deviations, and are shown in Table 4-1.
Discussion Preliminary testing of the case study brace, using the modified SAM assembly and testing protocol established in the pilot study, yielded valuable baseline data. Interpretation of the results provides the reader with a basic understanding of the mechanics and structural properties of the brace worn by the patient in this case study. The customized SAM was able to replicate the 7 degrees of Cobb angle correction observed in the patient's pre-brace and in-brace EOS images, from 33 degrees to 26 degrees. In order to correct the simulated deformity, the brace applied an axial load between 200 N and 345 N to the model. The magnitude of the targeted load condition

61
Figure 4-9. X-Axis Force-Displacement Curve.
62
Figure 4-10. Y-Axis Force-Displacement Curve.

63
Figure 4-11. Z-Axis Force-Displacement Curve.

64
Table 4-1. Stiffness Values from SPSS Curve Fit Analysis [N/Deg].
Run X Y Z 1 0.3 0.2 11.3 2 0.3 0.2 23.0 3 0.3 0.2 25.6 4 0.3 0.1 16.9 5 0.4 0.0 26.7 6 0.7 0.4 13.8 7 0.9 0.6 27.5 8 0.6 0.4 17.9 9 0.4 0.4 23.6 10 0.4 0.7 25.2 11 0.5 0.8 35.2 12 0.6 0.7 22.4
Mean 0.5 0.4 22.4 St. Dev. 0.2 0.3 6.3
65
was approximated to be half of the bodyweight (285 N or 64 lbs) [75], and was shown to fall close to the median of the measured axial load range, 272.5 N. This suggests that the measured brace force response was appropriate for the patient's upper torso weight. These findings confirm that the SAM was able to replicate the observed clinical deformity and bracing treatment. With mean X- and Y-stiffness values of 0.5 N/deg and 0.4 N/deg, respectively, it can be seen that this brace offers little structural stiffness along those axes. However, with a mean Z-stiffness of 22.4 N/deg, the brace has much greater stiffness along the Z axis. The force-displacement curves show observable differences in the magnitude of the curves for each direction. These differences are believed to be due to the slight variation in the strap tension between each test. Care was taken to standardize this parameter, but no measure was taken to ensure that the strap tension value remained within a set range. Future testing will standardize this tension value between each run using a measurement system. The ability of the SAM to replicate a scoliosis deformity is most limited by the vast diversity of curve types observed in AIS. Currently, the model is limited to replicating single curve scoliosis deformities. The patient presented a single, right-sided thoracolumbar curve in the pre-brace images. However, the in-brace images showed that the brace caused the deformity to become a double curve, with a main curve and a secondary curve. The main curve showed 7 degrees reduction and was chosen to be simulated by the SAM. The secondary curve was determined to be compensatory and neglected for the purposes of this study. This proved to be the biggest limitation to achieving the case study objective, because the defined junctional vertebra changed relative to the secondary curve. Optimal brace treatment would have lessened or eliminated the main curve (i.e., straightened out the spine) without creating a secondary curve. Future SAM design improvements will permit the study of complex curve types. In a case such as this where non-optimal in-brace correction is seen, brace design recommendations can be made possible through brace analysis with the SAM. For example, future testing may include variable pad parameters such as orientation, spatial location, size, and shape to determine the impact that they have on force transmission. By understanding the effects of removing, adding, or altering the fitting pads, recommended brace design changes may result in improved in-brace correction.

66
CHAPTER 5. DISCUSSION
Comparison of Pilot Study Brace and Case Study Brace In the pilot study described in Chapter 3, the SAM was used to determine the forces applied to the spine by a scoliosis brace and to quantify the structural stiffness properties of the scoliosis brace. Demonstrating that an analog model is an accurate representation of a real world situation is essential to proving the value of the model. In the case study described in Chapter 4, the model was demonstrated to be representative of a patient during a case study through collaboration with Le Bonheur Children's Hospital (Memphis, TN) and orthotist Jack Steele of The Center for Orthotics and Prosthetics (Memphis, TN). The structural stiffness properties of the pilot study brace were found to be 3.5 0.3 N/deg radially and 27.2 3.4 N/deg axially for the “C. Three Velcro Straps” configuration. The stiffness values of the case study brace were found to be 0.5 0.2 N/deg along the X-axis, 0.4 0.3 N/deg along the Y-axis, and 22.4 6.3 N/deg along the Z-axis. These properties suggest that the pilot study brace (Figure 3-8) has higher structural stiffness properties radially and axially than the case study brace (Figure 4-7). The primary reason for these differences in the structural properties of the brace is the brace design. The brace tested in the pilot study was smaller, with 53.3 cm circumference at the apex, and did not have any material cutouts, such as relief windows or slots. On the other hand, the case study brace was made for a larger patient, 67.3 cm circumference, and included a large relief window and anterior slot. Both braces, however, corrected the simulated deformity within the acceptable, targeted upper torso weight ranges. A limitation of both of the studies presented in this thesis is the issue of variation of strap tension. Despite care taken to reset the tension between each test run, variation in the magnitude of the forces was observable in the data. Future testing will standardize this tension value between each run using a measurement system.
Other Scoliosis Research A concept that was researched, but not heavily discussed in the published papers, is "spinal flexibility." This parameter is feasible to include in future research and is discussed below in an example from literature. Another University of Montreal researcher, Lamarre [23], investigated the biomechanical scoliosis parameter of "spinal flexibility," which gives insight to factors such as the extent of the structural curves, the vertebral levels to be instrumented, and the surgical approach. The objective of this research was two-fold: to present an alternative preoperative planning method for quantifying both curve reducibility and the forces involved in vivo, and to use these measures to calculate the true mechanical flexibility of the spine, which could be used as a standard biomechanical parameter for comparison between subjects. The researchers developed a suspension assembly, which consisted of a rigid harness attached to cables that hung from overhead pulleys and connected to an adjustable winch. This device was intended to be worn by a subject in order to create a
67
spinal traction force from the subject’s body weight. Once the subject had been raised off the ground, a posteroanterior radiograph was taken of the torso. This new method was compared to the gold standard technique, the side-bending test, which assesses maximum voluntary curve reducibility. Through the application of this new method and device, the forces were able to be estimated as a portion of the known body weight acting at the inferior vertebral body of the curve. The spinal flexibility of each subject was defined as the “flexibility indexes,” which are calculated as follows: the quotient of the scoliotic curve reduction (deg) and the moment induced at the apex (Nm) in the frontal plane and the quotient of the apical vertebra derotation (deg) and the moment induced at the apex (Nm) in the transverse plane (Figure 5-1). [23]
The moment induced at the apex was calculated by taking the product of an estimation of the amount of body weight acting on the inferior junctional vertebral body of the curve and the distance between the apical vertebral body and the axis of traction. The flexibility index was derived for both the frontal and transverse planes. The resulting flexibility indexes were presented as angular displacement / estimated moment. This parameter is similar to what is measured in vitro, and is directly comparable to those results. The transverse flexibility values agreed with previously reported in vitro data. However, the frontal flexibility values were larger than their in vitro counterparts, which was believed to be associated with the reduction in preload axial compression and the mean subject age during the in vivo suspension test compared to the in vitro tests. The author’s conclusions that the suspension technique provides a better estimation of curve reducibility and spinal flexibility compared to existing methods are supported by this evidence. Similar results were reported by Buchler et al. [19], who suspended patients using a neck harness. Though, this approach differs from Lamarre's strategy in how the traction force is applied to the spine (i.e., under the shoulders versus the neck). Lamarre and Buchler define the spinal flexibility parameter as degrees per Newton-meter. Note that the structural stiffness of the Scoliosis braces studied in the research presented here is defined as Newtons per degree. This is interesting, because based on those definitions, the spinal flexibility is the inverse of the structural stiffness. Future testing with the SAM could leverage this clinical parameter as a measure for comparison to the measured structural properties of the brace. Another concept that has been utilized by other researchers and by the UTHSC BioRobotics Laboratory is the use of pressure mapping systems to measure brace-torso interface pressures. Preliminary testing using the SAM involved calibration using a pressure-mapping system (Tekscan, Inc.). However, this approach was abandoned due to issues with the complex geometry of the inner surface of the brace. Current pressure mapping systems do not have flexible design, and errors are introduced by trying to bend the sensors around the geometry of the brace. Future testing with the SAM could utilize this technology if a custom device can be made for this application.
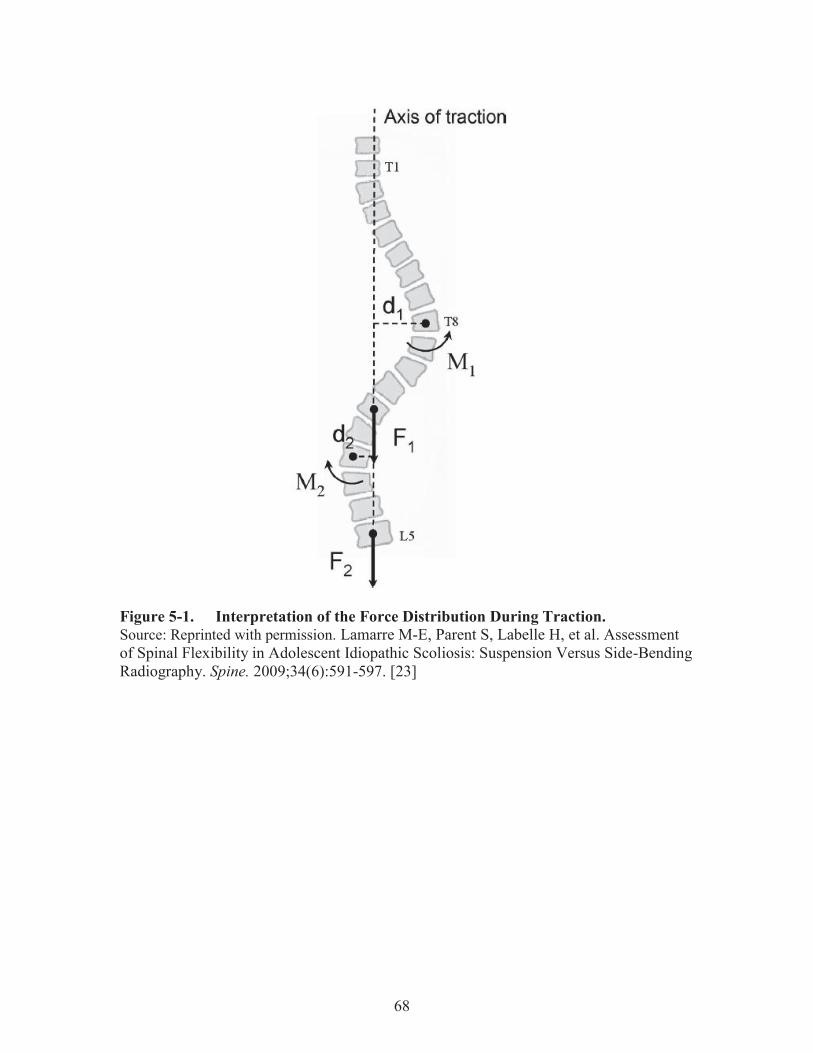
68
Figure 5-1. Interpretation of the Force Distribution During Traction. Source: Reprinted with permission. Lamarre M-E, Parent S, Labelle H, et al. Assessment of Spinal Flexibility in Adolescent Idiopathic Scoliosis: Suspension Versus Side-Bending Radiography. Spine. 2009;34(6):591-597. [23]

69
CHAPTER 6. CONCLUSION AND RECOMMENDATIONS
Pilot Study Through the development of this Scoliosis Analog Model and testing methodology, we have enabled the study of bracing technology. The testing of design alterations, i.e., variable strap configurations, showed a measureable difference in brace force response and structural properties between each configuration. Measured force components provided the first evidence of multidirectional force transmission by confirming an upward lifting effect. Future testing using this model and methodology can be performed to analyze other design features of a brace that are used by the orthotist during brace fabrication. Some of these features include brace pads, pad placement, pad geometry, material selection, material cut-outs, rigid components, and other fitting elements. This test assembly could also be used as a design tool and to develop a standard for classifying braces.
Case Study The case study performed using a modified SAM and testing methodology to test a scoliosis brace from an actual patient using targeted design parameters such as approximate upper torso weight and observed in-brace Cobb angle correction. This study demonstrated that the SAM has the capacity to model a patient's scoliosis deformity and measure the forces applied to the patient's spine by the brace. By showing that the model has this capacity, more opportunities arise for further research using this tool. Future testing that encompasses other scoliosis measures, such as axial rotation and spinal flexibility, and mechanical measures, such as strap tension and interface pressures, will further increase the sophistication of the study and value of the SAM results.
Overall Conclusion The overall objective of the research was to design, develop, and validate an analog model of the scoliosis deformity. Additionally, the model was to be used to measure the forces applied to the spine by a scoliosis brace and to quantify the structural properties of the brace. The model was used to investigate variation in a common brace design alteration, the strap material and quantity. A linkage-based model was created to interface with a scoliosis brace. Two dimensional testing of the model showed an error of 6%. The model was used to test two separate scoliosis braces. The first brace, or pilot brace, was tested across two ranges of simulated Cobb angle: the nondestructive range, or 30 degrees to 50 degrees, and the destructive range, or 50 degrees to 70 degrees. The nondestructive range represents the range of deformity that would typically be treated with a scoliosis brace. The destructive range was included to demonstrate the failure mode of the brace straps. The pilot study

70
brace was equipped with two types of straps, Velcro and buckle, in quantities of 1, 2, 3, and 4 (Velcro only). Testing of these different strapping configurations showed that the optimal strap number of Velcro straps was three Velcro straps. Comparison of these configurations to a unconstrained brace showed significant differences with the addition of each strap, and similarly that a rigidly constrained configuration was significantly more stiff than all of the configurations. Next, the model design was improved to be truly adjustable in order to accommodate the second brace, or case study brace, which was larger and had a more complex design than the pilot study brace. The SAM was customized using design parameters from the EOS image data, reports, and other forms provided with IRB approval. The brace was tested using a modified testing protocol, and the structural stiffness properties were quantified. Targeted design parameters such as approximate upper torso weight and observed in-brace Cobb angle correction were used to confirm that the SAM was able to replicate the patient's deformity. Calculated stiffness values were compared to the pilot study brace properties to demonstrate that the SAM is valuable for classifying scoliosis braces based on structural properties.
Future Work / Recommendations Up until now, testing using the SAM has included a 2D correction simulation, focusing on the Cobb angle. However, for a true "Scoliosis analog model," the testing protocol should be expanded to include 3D correction, with coupled Cobb angle simulation and axial rotation simulation. In order to accomplish this, the model design will need to be modified to allow the apex level to rotate out of plane. Also, a fixture will need to be created to hold the brace in plane. Controlled axial rotation at the load cell will cause the SAM to rotate within the brace, and the brace will resist the rotation. This behavior can be characterized by a new axial rotational stiffness parameter. Combination of all of the structural stiffness properties can be calculated as a single global stiffness of the brace. Additionally, the clinical measure of spinal flexibility can be quantified by the surgeon during assessment and used for comparison to the measured brace structural stiffness properties. By using the inverse of the spinal flexibility measured during the assessment, a "targeted stiffness" value can be used as a design parameter during future SAM testing. A comparison such as this would provide a crucial feedback step in the research that is currently missing, allowing for recommendations for adjustments to be made to the brace after the initial fitting to better match the patient's spinal flexibility. Also, measures of the interface pressures using a custom, flexible pressure mapping system would provide insight to the fit and comfort aspects of the brace. Currently, comfort and fit are subjective, but a pressure mapping system could measure pressure points within the brace that would be felt by the patient. Lastly, measurement of the strap tension is necessary in future testing. Either by using an in-line sensor or an external scale, the strap tension of each strap needs to be tracked during SAM testing to determine the relationship between strap tension and magnitude of the forces applied to the spine. These SAM improvements will provide for a more sophisticated analog model, and will increase the value of the results and of any design recommendations that may be made.

71
LIST OF REFERENCES 1. Altaf F, Gibson A, Dannawi Z, Noordeen H. Adolescent idiopathic scoliosis. BMJ
(Clinical research ed.). 2013;346:f2508.
2. National Scoliosis Foundation. Information and Support. 2015; http://www.scoliosis.org/info.php. Accessed February 26, 2015.
3. Warner WC, Sawyer JR, Kelly DM. Scoliosis and Kyphosis. Campbell's Operative Orthopaedics. 12th ed: Elsevier Inc.; 2013:1691-1895.
4. Lenke LG, Betz RR, Harms J, et al. Adolescent Idiopathic Scoliosis: A new classification to determine extent of spinal arthrodesis. The Journal of Bone and Joint Surgery. 2001;83-A(8):1169-1181.
5. Hawes MC, O'Brien JP. The transformation of spinal curvature into spinal deformity: pathological processes and implications for treatment. Scoliosis. 2006;1(3).
6. Weinstein SL, Dolan LA, Cheng JCY, Danielsson A, Morcuende JA. Adolescent idiopathic scoliosis. Lancet. 2008;371:1527-1537.
7. Martin CT, Pugely AJ, Gao Y, et al. Increasing hospital charges for adolescent idiopathic scoliosis in the United States. Spine. Sep 15 2014;39(20):1676-1682.
8. Carlson B. ScoliScore AIS Prognostic Test Personalizes Treatment for Children With Spinal Curve. Personalized Medicine - Biotechnology Healthcare. 2011.
9. Aulisa AG, Guzzanti V, Perisano C, et al. Determination of quality of life in adolescents with idiopathic scoliosis subjected to conservative treatment. Scoliosis. 2010;5(21).
10. Katz DE, Herring JA, Browne RH, Kelly DM, Birch JG. Brace wear control of curve progression in adolescent idiopathic scoliosis. The Journal of bone and joint surgery. American volume. Jun 2010;92(6):1343-1352.
11. Weinstein SL, Dolan LA, Wright JG, Dobbs MB. Effects of bracing in adolescents with idiopathic scoliosis. The New England journal of medicine. Oct 17 2013;369(16):1512-1521.
72
12. Dickey, J. P., and Gillespie, K. A., 2003, “Representation of Passive Spinal Element Contributions to In Vitro Flexion-Extension Using a Polynomial Model: Illustration Using the Porcine Lumbar Spine,” J. Biomech., 36(6), pp. 883–888.
13. Gardner-Morse, M. G., and Stokes, I. A., 2004, “Structural Behavior of Human Lumbar Spinal Motion Segments,” J. Biomech., 37(2), pp. 205–212.
14. Gilbertson, L. G., Doehring, T. C., and Kang, J. D., 2000, “New Methods to Study Lumbar Spine Biomechanics: Delineation of In Vitro Load-Displacement Characteristics by Using a Robotic/UFS Testing System With Hybrid Control,” Oper. Tech. Orthop., 10(4), pp. 246–253.
15. Thompson, R. E., Barker, T. M., and Pearcy, M. J., 2003, “Defining the Neutral Zone of Sheep Intervertebral Joints During Dynamic Motions: An In Vitro Study,” Clin. Biomech., 18(2), pp. 89–98.
16. Walker, M. R., and Dickey, J. P., 2007, “New Methodology for Multi-Dimensional Spinal Joint Testing With a Parallel Robot,” Med. Biol. Eng. Comput., 45(3), pp. 297–304.
17. Domann J, Mar D, Johnson A, James J, Friis E. The Analogue Spine Model: The First Anatomically and Mechanically Correct Synthetic Physical Model of the Lumbar Spine. The Spine Journal. 2011;11(10):S155-S156.
18. Domann JP. Development and Validation of an Analogue Lumbar Spine Model and its Integral Components, University of Kansas; 2011.
19. Buchler P, de Oliveria ME, Studer D, et al. Axial suspension test to assess pre-operative spinal flexibility in patients with adolescent idiopathic scoliosis. European spine journal : official publication of the European Spine Society, the European Spinal Deformity Society, and the European Section of the Cervical Spine Research Society. Dec 2014;23(12):2619-2625.
20. Courvoisier A, Vialle R, Skalli W. EOS 3D Imaging: assessing the impact of brace treatment in adolescent idiopathic scoliosis. Expert Rev. Med. Devices. 2014;11(1):1-3.
21. Gallo D. Control of Idiopathic Scoliosis Treatment in 147 Patients while using the RSC Brace. JPO Journal of Prosthetics and Orthotics. 2011;23(2):69-77.

73
22. Kuroki H, Inomata N, Hamanaka H, Chosa E, Tajima N. Significance of hanging total spine x-ray to estimate the indicative correction angle by brace wearing in idiopathic scoliosis patients. Scoliosis. 2012;7(8).
23. Lamarre M-E, Parent S, Labelle H, et al. Assessment of Spinal Flexibility in Adolescent Idiopathic Scoliosis: Suspension Versus Side-Bending Radiography. Spine. 2009;34(6):591-597.
24. Mac-Thiong JM, Petit Y, Aubin CE, Delorme S, Dansereau J, Labelle H. Biomechanical evaluation of the Boston brace system for the treatment of adolescent idiopathic scoliosis: relationship between strap tension and brace interface forces. Spine. Jan 1 2004;29(1):26-32.
25. Romano M, Carabalon R, Petrilli S, Sibilla P, Negrini S. Forces exerted during exercises by patients with adolescent idiopathic scoliosis wearing fiberglass braces. Scoliosis. 2006;1(12).
26. van den Hout JA, van Rhijn LW, van den Munckhof RJ, van Ooy A. Interface corrective force measurements in Boston brace treatment. European spine journal : official publication of the European Spine Society, the European Spinal Deformity Society, and the European Section of the Cervical Spine Research Society. Aug 2002;11(4):332-335.
27. Wong MS, Mak AFT, Luk KDK, Evans JH, Brown B. Effectiveness and biomechanics of spinal orthoses in the treatment of adolescent idiopathic scoliosis (AIS). Prosthetics and Orthotics International. 2000;24:148-162.
28. Wood G. Brace modifications that can result in improved curve correction in idiopathic scoliosis. Scoliosis. 2014;9(2).
29. Clin J, Aubin C-E, Parent S, Labelle H. A Biomechanical Study of the Charleston Brace for the Treatment of Scoliosis. Spine. 2010;35(19):E940-E947.
30. Clin J, Aubin C-E, Parent S, Sangole A, Labelle H. Comparison of the biomechanical 3D efficiency of different brace designs for the treatment of scoliosis using a finite element model. European spine journal : official publication of the European Spine Society, the European Spinal Deformity Society, and the European Section of the Cervical Spine Research Society. 2010;19:1169-1178.

74
31. Bauer S, Gruber K. MBS Model of the Human Lumbar Spine — Development and Applications. SIMPACK News. 2009:18-19.
32. Cukovic S, Devedzic G, Ivanovic L, Lukovic TZ, Subburaj K. Development of 3D Kinematic Model of the Spine for Idiopathic Scoliosis Simulation. Computer-Aided Design & Applications. 2010;7(1):153-161.
33. Desbiens-Blais F, Clin J, Parent S, Labelle H, Aubin C-E. New brace design combining CAD/CAM and biomechanical simulation for the treatment of adolescent idiopathic scoliosis. Clinical Biomechanics. 2012;27:999-1005.
34. Gignac D, Aubin C-É, Dansereau J, Labelle H. Optimization method for 3D bracing correction of scoliosis using a finite element model. European spine journal : official publication of the European Spine Society, the European Spinal Deformity Society, and the European Section of the Cervical Spine Research Society. 2000;9:185-190.
35. Jalalian A, Gibson I, Tay EH. Computational Biomechanical Modeling of Scoliotic Spine: Challenges and Opportunities. Spine Deformity. 2013;1:201-411.
36. Legaye J. Three-Dimensional Assessment of the Scoliosis. Recent Advances in Scoliosis.
37. Little JP, Izatt MT, Labrom RD, Askin GN, Adam CJ. An FE investigation simulating intra-operative corrective forces applied to correct scoliosis deformity. Scoliosis. 2013;8(9).
38. Nie WZ, Ye M, Liu ZD, Wang CT. The patient-specific brace design and biomechanical analysis of adolescent idiopathic scoliosis. Journal of biomechanical engineering. Apr 2009;131(4):041007.
39. Patwardhan AG, Gavin TM, Bunch WH, et al. Biomechanical Comparison of the Milwaukee Brace (CTLSO) and the TLSO for Treatment of Idiopathic scoliosis. Journal of Prosthetics and Orthotics. 1996;8(4):115-122.
40. Penčić M, Savić S, Tasevski J, Raković M, Borovac B. A robot multi-segment lumbar spine-mechanical model. 6th PSU-UNS International Conference on Engineering and Technology (ICET-2013); 2013; Novi Sad, Serbia.
75
41. Perie D, Aubin CE, Lacroix M, Lafon Y, Labelle H. Biomechanical modelling of orthotic treatment of the scoliotic spine including a detailed representation of the brace-torso interface. Med Biol Eng Comput. 2004;42:339-344.
42. Perie D, Aubin CE, Petit Y, Labelle H, Dansereau J. Personalized biomechanical simulations of orthotic treatment in idiopathic scoliosis. Clinical Biomechanics. 2004;19:190-195.
43. Perie D, Aubin C-E, Petit Y, Beause´jour M, Dansereau J, Labelle H. Boston Brace Correction in Idiopathic Scoliosis: A Biomechanical Study. Spine. 2003;28(15):1672-1677.
44. Sevrain A, Aubin C-E, Gharbi H, Wang X, Labelle H. Biomechanical evaluation of predictive parameters of progression in adolescent isthmic spondylolisthesis: a computer modeling and simulation study. Scoliosis. 2012;7(2).
45. Tong S. A Mechanical Model of the Normal Human Spine. Edmonton, Alberta: Department of Mechanical Engineering, University of Alberta; 1999.
46. Wang W, Baran GR, Betz RR, Samdani AF, Pahys JM, Cahill PJ. The Use of Finite Element Models to Assist Understanding and Treatment For Scoliosis: A Review Paper. Spine Deformity. 2014;2:10-27.
47. Van De Graaff KM, Fox SI. Concepts of Human Anatomy & Physiology. 4th ed. USA: Wm. C. Brown Communications, Inc.; 1995.
48. Carter HV. Anatomy of the Spine. Public domain, via Wikimedia Commons
49. OpenStax College. Anatomy of the Vertebra. CC BY 3.0 (http://creativecommons.org/licenses/by/3.0), via Wikimedia Commons
50. Greiner KA. Adolescent idiopathic scoliosis: radiologic decision-making. American family physician. May 1 2002;65(9):1817-1822.
51. Busscher I, Wapstra FH, Veldhuizen AG. Predicting growth and curve progression in the individual patient with adolescent idiopathic scoliosis: design of a prospective longitudinal cohort study. BMC musculoskeletal disorders. 2010;11:93.

76
52. Boston Brace International I. Reference Manual for the Boston Scoliosis Brace. 2015; https://www.srs.org/professionals/education_materials/.
53. Deschenes S, Charron G, Beaudoin G, et al. Diagnostic imaging of spinal deformities: reducing patients radiation dose with a new slot-scanning X-ray imager. Spine. Apr 20 2010;35(9):989-994.
54. Illes T, Tunyogi-Csapo M, Somoskeoy S. Breakthrough in three-dimensional scoliosis diagnosis: significance of horizontal plane view and vertebra vectors. European spine journal : official publication of the European Spine Society, the European Spinal Deformity Society, and the European Section of the Cervical Spine Research Society. Jan 2011;20(1):135-143.
55. Rowe DE. The Scoliosis Research Society Brace Manual.
56. Aulisa AG, Giordano M, Falciglia F, Marzetti E, Poscia A, Guzzanti V. Correlation between compliance and brace treatment in juvenile and adolescent idiopathic scoliosis: SOSORT 2014 award winner. Scoliosis. 2014;9(6).
57. Chan SL, Cheung KM, Luk KD, Wong KW, Wong MS. A correlation study between in-brace correction, compliance to spinal orthosis and health-related quality of life of patients with Adolescent Idiopathic Scoliosis. Scoliosis. 2014;9(1).
58. Donzelli S, Zaina F, Negrini S. In defense of adolescents: They really do use braces for the hours prescribed, if good help is provided. Results from a prospective everyday clinic cohort using thermobrace. Scoliosis. 2012;7(12).
59. Edgar M. Brace Wear Compliance. SRS Brace Manual 2013.
60. Miller DJ, Franzone JM, Matsumoto H, et al. Electronic Monitoring Improves Brace-Wearing Compliance in Patients With Adolescent Idiopathic Scoliosis. Spine. 2012;37(9):717-721.
61. Rahman T, Borkhuu B, Littleton AG, et al. Electronic monitoring of scoliosis brace wear compliance. J Child Orthop. 2010;4:343-347.
62. Rahman T, Bowen JR, Takemitsu M, Scott C. The Association Between Brace Compliance and Outcome for Patients With Idiopathic Scoliosis. J Pediatr Orthop. 2005;25:420-422.

77
63. Zaina F, Mauroy JCD, Grivas T, et al. Bracing for scoliosis in 2014: state of the
art. Eur J Phys Rehabil Med. 2014;50:93-110.
64. Weiss H. History of soft brace treatment in patients with scoliosis: a critical appraisal. Hard Tissue. 2013;2(4):35.
65. Rinsky LA, Gamble JG. Adolescent idiopathic scoliosis. The Western journal of medicine. Feb 1988;148(2):182-191.
66. FDA. https://www.accessdata.fda.gov 2015.
67. Dolan L, Weinstein S. Bracing in Adolescent Idiopathic Scoliosis: Planning, Conduct, and Results of the BrAIST Clinical Trial. American Academy of Orthotists and Prosthetists.2014.
68. Janssen MMA, Wilde RFd, Kouwenhoven J-WM, Castelein ReM. Experimental animal models in scoliosis research: a review of the literature. The Spine Journal. 2011;11(4):347-358.
69. Ouellet J, Odent T. Animal models for scoliosis research: state of the art, current concepts and future perspective applications. European spine journal : official publication of the European Spine Society, the European Spinal Deformity Society, and the European Section of the Cervical Spine Research Society. 2013;22(Suppl 2):S81-S95.
70. Wilke HJ, Mathes B, Midderhoff S, Graf N. Development of a scoliotic spine model for biomechanical in vitro studies. Clinical biomechanics (Bristol, Avon). Feb 2015;30(2):182-187.
71. Simmons JC (2014). Development of a Mobility-Enabling Spinal Orthosis and Methods for Evaluating and Developing Spinal Orthoses on a Robotic Platform. Doctoral Dissertation, UTHSC.
72. Kelly SN (2013). Development and application of a biorobotic simulation of stance phase gait to study foot and ankle kinematics. Master’s Thesis, UTHSC.

78
73. Kelly BP, DiAngelo DJ. A Multiaxis Programmable Robot for the Study of Multibody Spine Biomechanics Using a Real-Time Trajectory Path Modification Force and Displacement Control Strategy. Journal of Medical Devices. 2013;7(3):034502-034502.
74. Achelis S. Friction: Your Friend, Your Foe. Advanced Rescue Technology. 2005:35-41.
75. Winter D. Biomechanics and Motor Control of Human Movement. 4th ed. New Jersey: John Wiley & Sons; 2009.
76. JR3 Multi-Axis Load Cell Technologies. Specification Sheets: 100M40A3. 2015;
http://www.jr3.com/specification-sheets.html. Accessed October 31, 2015. 77. Exlar Actuation Solutions. Product Specifications: GSX30 Series. 2015;
http://exlar.com/product/gsx-series/specs. Accessed October 31, 2015.

79
APPENDIX A. ADEPT CODE The program code that was used to control the robotic testing platform during the pilot study and case study is as follows. ai.version = 1302 SELECT FORCE = 1 ; select base load cell, 1: upper, 2: lower FORCE.MODE (21) FORCE.MODE (10) 4.45 FORCE.MODE (11) 0.0254 FORCE.MODE (12) 5 FORCE.MODE (13) 3 FORCE.MODE (14) 6 PROMPT "For these tests, how far do you want to distract? [+ up/- down] ", distance PROMPT "How fast do you want to move? [%max capacity] ", speed PROMPT "What is the absolute Z force trip value? [N] ", for.trip 3 FORCE.READ (0) f[] TYPE /C2 TYPE " The current load cell readings are:" TYPE " Fx Fy Fz Mx My Mz" TYPE /F8.2, f[0], f[1], f[2], f[3], f[4], f[5] TYPE /C2 5 PROMPT "Would you like to zero the load cell? (y/n): ", $zeroans IF $zeroans == "y" THEN FORCE.OFFSET (0) GOTO 3 END PROMPT "What is your test name?", $specimen_name PROMPT "Hit ENTER to continue...", continue HERE begin 100 HERE start ;start relative to each move DECOMPOSE s[] = start TYPE "Starting position: ", s[0], " ", s[1], " ", s[2], " ", s[3], " ", s[4], " ", s[5] SELECT FORCE = 1 CALL fs.buf.config(-1, -1, 1000, 25, stt) ;1hz sampling rate IF stt < 0 GOTO 1000 WAIT.EVENT , 0.5 SELECT FORCE = 1 CALL fs.buf.enable() MOVES TRANS(s[0],s[1],s[2]+distance,s[3],s[4],s[5]) flast = 0 WHILE STATE(2) == 1 DO FORCE.READ (0) f[] HERE current DECOMPOSE curr[] = current

80
current_dist = curr[2]-s[2] fchange = f[2]-flast TYPE /F8.2, "Base x:", f[0], " y:", f[1], " z:", f[2], "", " Change: ", fchange, " Rotation: ", current_dist TYPE "" WAIT.EVENT , 0.5 IF ABS(f[2]) > for.trip THEN BRAKE TYPE "Force limit exceeded" SPEED 20 MOVE start BREAK END flast = f[2] END BREAK HERE end DECOMPOSE e[] = end TYPE "Ending position: ", e[0], " ", e[1], " ", e[2], " ", e[3], " ", e[4], " ", e[5] 500 PROMPT "Write to file? ", $ans IF $ans == "y" THEN TYPE "Writing File" SELECT FORCE = 1 CALL fs.buf.read(2, ^H3F, , , , p[,], stt) IF stt < 0 GOTO 1000 CALL fs.buf.read(0, ^H3F, , , , f[,], stt) IF stt < 0 GOTO 1000 CALL fs.buf.read(1, ^H3F, , , , j[,], stt) IF stt < 0 GOTO 1000 $filename = $specimen_name ATTACH (dlun, 4) "NFS" IF IOSTAT(dlun) < 0 THEN TYPE "Error attaching nfs" GOTO 1000 END FOPENW (dlun) $filename IF IOSTAT(dlun) < 0 THEN TYPE "Error opening file in biomech 8." GOTO 1000 END FOR n = 0 TO stt-1 WRITE (dlun) /F9.3, p[0,n], p[1,n], p[2,n], p[3,n], p[4,n], p[5,n], p[6,n], /S WRITE (dlun) /F9.3, f[1,n], f[2,n], f[3,n], f[4,n], f[5,n], f[6,n], /S WRITE (dlun) /F9.3, j[1,n], j[2,n], j[3,n], j[4,n], j[5,n], j[6,n] IF IOSTAT(dlun) < 0 THEN TYPE "Error writing file to Biomech8. "

81
GOTO 1000 END END FCLOSE (dlun) IF IOSTAT(dlun) < 0 THEN TYPE "Error closing file2." GOTO 1000 END END PROMPT "Move back to starting position? ", $ans IF $ans == "y" THEN SPEED 300 MOVE begin BREAK END PROMPT "Perform another run? ", $ans IF $ans == "y" THEN GOTO 3 END 1000 IF stt < 0 THEN TYPE " Error occured : ", $ERROR(stt) PAUSE END 1005 TYPE $ERROR(IOSTAT(dlun)) RETURN .END
Figure A-1 shows a sample screenshot of the testing log during a test.

82
Figure A-1. Testing Log Screenshot.

83
APPENDIX B. 2D VALIDATION DATA A fourth degree polynomial curve was fit to each the experimental and computational force-displacement curves for each Fi orientation using excel, 12 decimal. The definite integral from theta = 15 to theta = 35 was calculated for each experimental curve and computational curve. The percent error between the two curves was calculated for each Fi orientation, as shown in Figure B-1. The percent error of each input force orientation using definite integral of experimental and computational curves is shown in Table B-1.

84
Figure B-1. Sample Calculation of Definite Integral and Percent Error. In this figure, the X axis corresponds to the angular change of the linkage assembly, and the Y axis corresponds to the radial or axial measured force component. Table B-1. Percent Error of Each Input Force Orientation Using Definite Integral of Experimental and Computational Curves. Fi Orientation (deg) Experimental Computational Percent Error (%)
30 -934.27 -990.451 5.67 20 -957.937 -994.437 3.67 10 -948.437 -968.207 2.04 0 -910.673 -912.558 0.21
-10 -712.981 -829.182 14.01 -20 -622.876 -720.612 13.56
Average: 6.53 This table shows the experimental and computational definite integral results for each input force orientation and the percent error between the two values. These values were calculated as shown in Figure B-1.

85
APPENDIX C. VARIABLE STRAP DATA During the pilot testing, four comparative studies were performed to determine significant differences in the stiffness values of each strapping configuration. Table C-1 shows the raw data that was used during these tests. The run stiffness values were taken from the linear curve fit equation slope. In addition to stiffness, other parameters were extracted from the force-displacement curves. These parameters include the peak force values and calculated work. The work was calculated as the definite integral of the linear approximation equation, with bounds from the initial simulated Cobb angle to the Cobb angle corresponding to the peak force. Though these parameters were not analyzed in depth, they are pertinent to show here. Table C-2 shows the peak force values and Table C-3 shows the calculated work. Figure C-1 shows a sample calculation of the work.

86
Table C-1. Radial and Axial Stiffness Values [N/deg]. Config R1 R2 R3 RM RSD A1 A2 A3 AM ASD
A 1.2 1.3 1.4 1.3 0.1 15.2 17.8 19.7 17.6 2.3 B 2.2 2.6 2.5 2.4 0.2 19.8 28.2 21.8 23.3 4.4 C 3.2 3.8 3.4 3.5 0.3 26.6 30.8 24.2 27.2 3.4 D 3.7 3.3 3.6 3.6 0.2 29.2 28.6 30.2 29.3 0.8 E 4.2 1.2 1.7 2.4 1.6 10.5 12.1 12.8 11.8 1.2 F 2.8 2.8 2.7 2.8 0.1 12.2 18.3 15.4 15.3 3.0 G 4.2 3.7 3.4 3.8 0.4 17.2 20.0 18.7 18.6 1.4 H 10.8 13.0 8.8 10.9 2.1 165.5 162.3 133.7 153.8 17.5 I 0.2 -0.1 0.0 0.0 0.2 1.1 0.4 1.4 0.9 0.5
In this table, the radial stiffness values are labeled as "R1," R2," and "R3." The mean radial stiffness values are labeled "RM," and the radial standard deviation is labeled "RSD." Similarly, the axial stiffness values are labeled as "A1," A2," and "A3." The mean axial stiffness values are labeled "AM," and the axial standard deviation is labeled "ASD." Table C-2. Radial and Axial Peak Force Values [N]. Config R1 R2 R3 RM RSD A1 A2 A3 AM ASD
A 17.4 19.6 22.3 19.8 2.5 224.9 247.3 267.2 246.5 21.2 B 44.3 39.9 43.4 42.5 2.3 414.5 431.3 382.5 409.4 24.8 C 68.5 83.3 80.4 77.4 7.8 533.4 538.1 536.6 536.1 2.4 D 86.3 91.0 96.2 91.2 4.9 563.6 609.6 619.6 597.6 29.9 E 82.5 28.2 42.9 51.2 28.1 406.9 360.5 422.5 396.6 32.3 F 76.0 72.3 66.7 71.7 4.7 574.1 559.0 493.8 542.3 42.7 G 100.4 88.4 91.1 93.3 6.3 672.5 591.5 563.3 609.1 56.7 H 37.0 44.5 44.0 41.8 4.2 527.6 549.6 539.2 538.8 11.0 I 11.4 8.6 2.1 7.3 4.8 69.7 75.7 82.1 75.8 6.2
In this table, the radial peak force values are labeled as "R1," R2," and "R3." The mean radial peak force values are labeled "RM," and the radial standard deviation is labeled "RSD." Similarly, the axial peak force values are labeled as "A1," A2," and "A3." The mean axial peak force values are labeled "AM," and the axial standard deviation is labeled "ASD." These descriptive values were computed for information purposes only.

87
Table C-3. Radial and Axial Calculated Work Values [N-deg].
Config R1 R2 R3 RM RSD A1 A2 A3 AM ASD A 1668.3 1699.2 1789.8 1719.1 63.2 128.1 152.3 172.1 150.8 22.1 B 4298.6 3226.4 3340.2 3621.7 589.0 449.0 300.7 385.8 378.5 74.5 C 5329.6 4701.0 5890.7 5307.1 595.2 732.8 909.8 952.7 865.1 116.6 D 5418.9 6486.7 6312.9 6072.8 572.9 997.1 1252.4 1268.5 1172.7 152.3 E 6084.7 4903.7 6003.4 5664.0 659.6 776.4 334.6 532.3 547.8 221.3 F 9302.6 7749.5 6918.4 7990.1 1210.2 1028.5 905.0 820.2 917.9 104.7 G 9516.8 7255.6 6927.7 7900.0 1409.7 1196.3 1052.8 1208.8 1152.6 86.7 H 898.8 979.9 710.4 863.0 138.3 61.4 57.4 35.5 51.4 13.9 I 1682.8 2471.2 2081.9 2078.6 394.2 241.3 166.3 16.5 141.4 114.4
In this table, the radial work values are labeled as "R1," R2," and "R3." The mean radial work values are labeled "RM," and the radial standard deviation is labeled "RSD." Similarly, the axial work values are labeled as "A1," A2," and "A3." The mean axial work values are labeled "AM," and the axial standard deviation is labeled "ASD." These descriptive values were computed for information purposes only.

88
Figure C-1. Sample Calculation of Work Using Definite Integral. In this figure, the x variable corresponds to the simulated Cobb angle, and the y variable corresponds to the radial or axial measured force component. The integral of the equation with respect to the x variable within the boundaries of simulated Cobb angle equates to the work of the system.
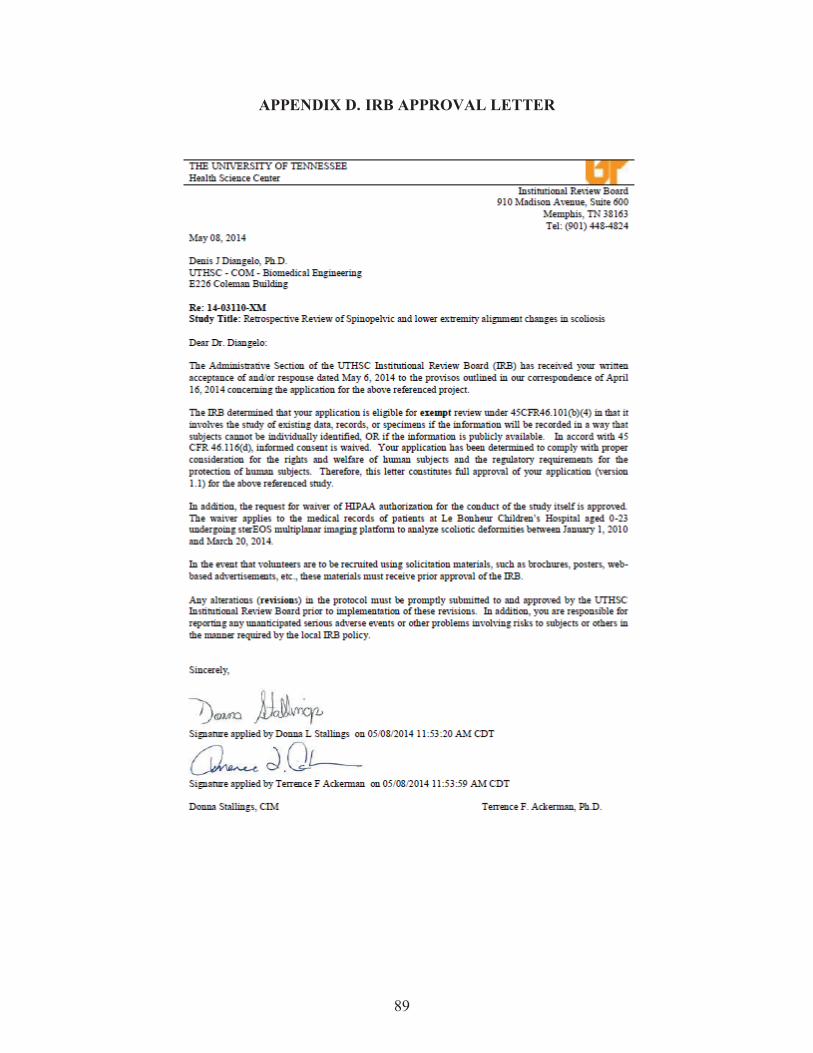
89
APPENDIX D. IRB APPROVAL LETTER
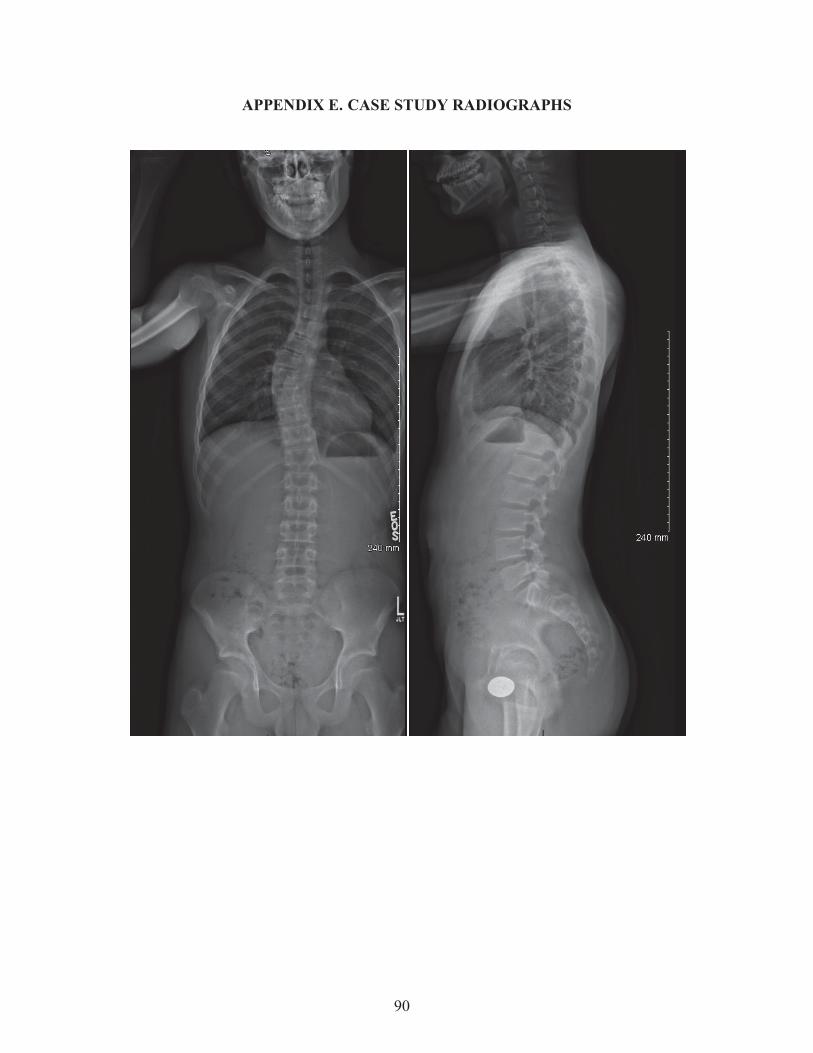
90
APPENDIX E. CASE STUDY RADIOGRAPHS

91
APPENDIX F. BOSTON BRACE ORDER FORM
Source: Reprinted with permission. Boston Brace International I. Reference Manual for the Boston Scoliosis Brace. 2015; https://www.srs.org/professionals/education_materials/. [52]
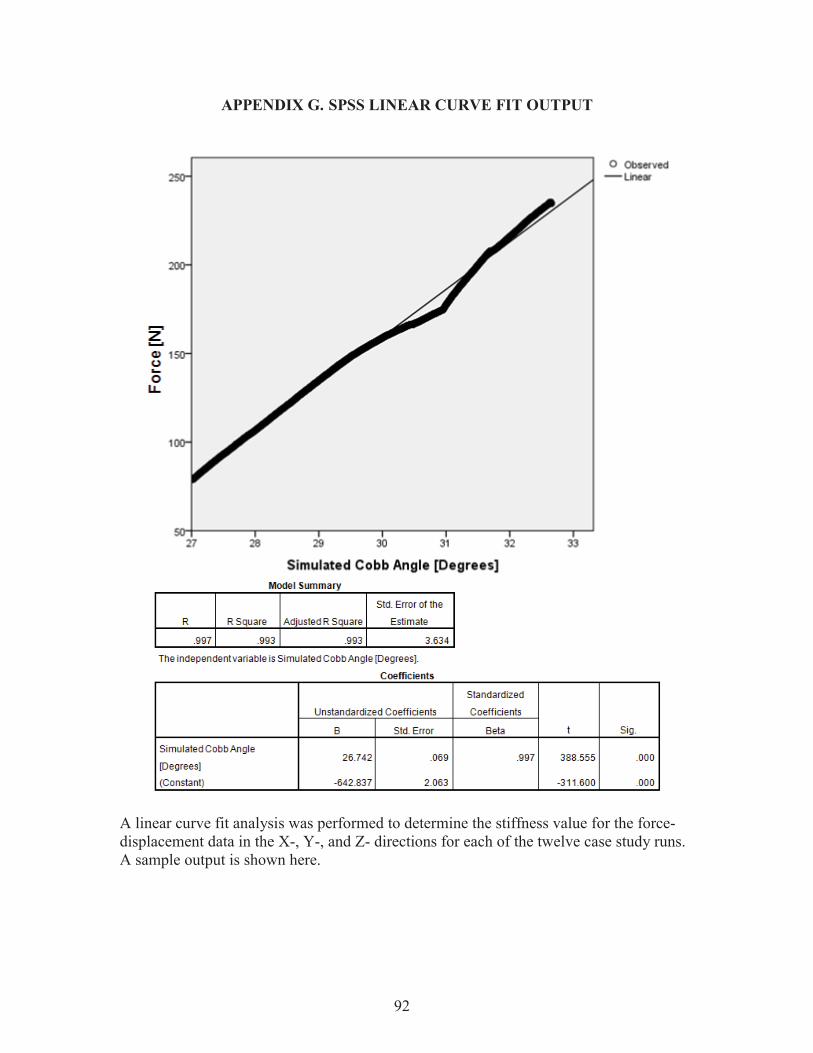
92
APPENDIX G. SPSS LINEAR CURVE FIT OUTPUT
A linear curve fit analysis was performed to determine the stiffness value for the force-displacement data in the X-, Y-, and Z- directions for each of the twelve case study runs. A sample output is shown here.

93
APPENDIX H. EQUIPMENT SPECIFICATIONS Load Cell Specifications:
JR3 Multi-Axis Force-Torque Sensor Model: 100M40A3 Mechanical Load Rating: 400 N X-Axis and Y-Axis Force Readings
Standard Measurement Range: 400 N Standard Resolution: 0.10 N Single-Axis Maximum Load: 2000 N
Z-Axis Force Readings Standard Measurement Range: 800 N Standard Resolution: 0.20 N Single-Axis Maximum Load: 8750 N
Vertical Actuator Specifications:
Exlar GSX30-1201-OFM-CS2-138-AR Serial No.: 04130798 P/N: 22749 Rev: A Volts: 230 Amps: 2.1 RPM: 3000 Frame Size: 3.125 in (79 mm) Stroke: 12 in (305 mm) Screw Lead: 0.1 in (2.54 mm) Continuous Force Rating [1/2/3 Stack]: 792/1277/NA lbs (3521/5680/NA N) Max Velocity: 5 in/sec (127 mm/sec) Maximum Static Load: 2700 lbs (12010 N) Armature Inertia: 0.00443 lb-in-s2 (0.000501 kg-m2) Dynamic Load Rating: 5516 lbs (24536 N) Weight: 20.5 lbs (9.3kg)
Sources: JR3 Multi-Axis Load Cell Technologies. Specification Sheets: 100M40A3. 2015; http://www.jr3.com/specification-sheets.html. Accessed October 31, 2015. [76] Exlar Actuation Solutions. Product Specifications: GSX30 Series. 2015; http://exlar.com/product/gsx-series/specs. Accessed October 31, 2015. [77]
94
VITA Chloe Ly Chung was born in Schenectady, New York in 1990. She was raised in Memphis, Tennessee where she graduated from St. Benedict at Auburndale High School in 2008. She attended Christian Brothers University and graduated with a Bachelor of Science in Mechanical Engineering in Spring 2013. During her undergraduate career, she completed four consecutive years of engineering internships with companies such as Medtronic, FedEx Express, and Olympus Surgical Technologies of America. She matriculated into the Joint Graduate Program in Biomedical Engineering and Imaging at the University of Tennessee Health Science Center and University of Memphis in Fall 2013. Under the guidance of Dr. Denis J DiAngelo, she focused her research efforts on studying and modeling the skeletal deformity, Scoliosis, and bracing technology.