scientific method notes
DESCRIPTION
Scientific Method Notes. Scientific Method. The way scientists learn and study about the world around them. Observe and Question. Observe- Make notice of things in the world around you Question- Scientists ask questions when they don’t understand what they have observed. - PowerPoint PPT PresentationTRANSCRIPT

Scientific Method Notes

Scientific Method The way scientists learn and
study about the world around them

Observe and QuestionObserve- Make notice of things
in the world around you
Question- Scientists ask questions when they don’t understand what they have observed

How many pennies can a bess beettle pull?
Why do leaves change colors?
What causes cancer?
How could I design a more efficient light bulb that uses less energy and saves money?
What impact does human use of pesticides have on the environment?
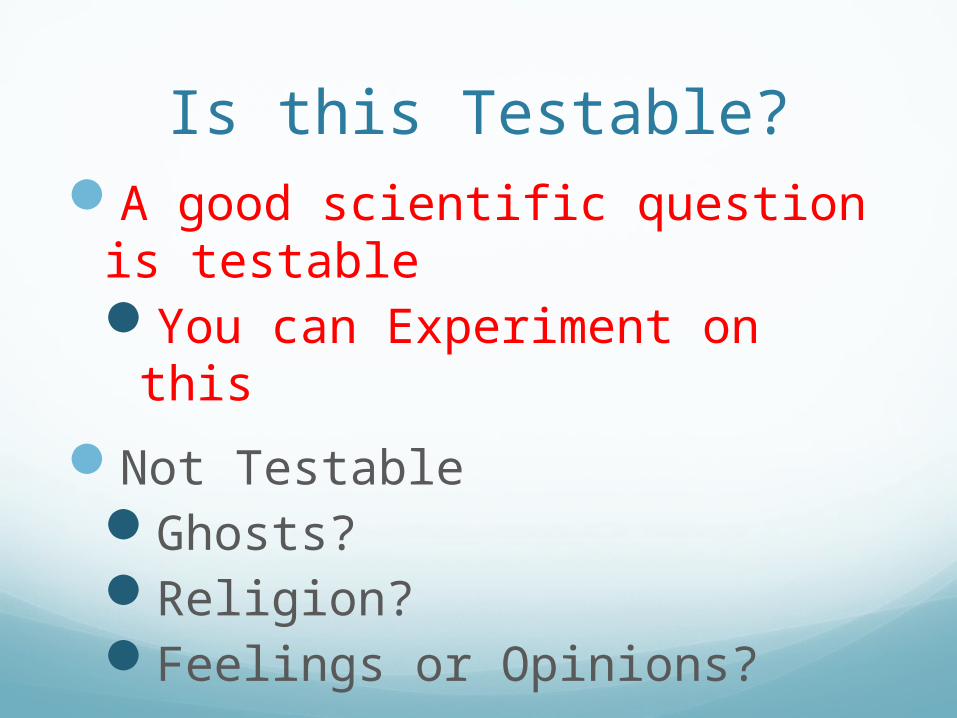
Is this Testable?A good scientific question is
testableYou can Experiment on this
Not TestableGhosts?Religion?Feelings or Opinions?

HypothesisDefine- An educated guess for
why what you observed is happening
Should be an IF…. THEN…. statement
Example- If I eat more cookies then I will gain weight

What’s the Point?How will conducting an
experiment on this help me?
What can be gained from the information collected?

VariablesWhat does it mean to vary?
Independent Variable- This is what you are testing or changing in the experimentThere should only be 1 in an experiment
Dependent Variable- This will change because of the independent variable. This is the data or what you are measuring in an experiment

ProcedureStep by step description of how
you will do the experiment
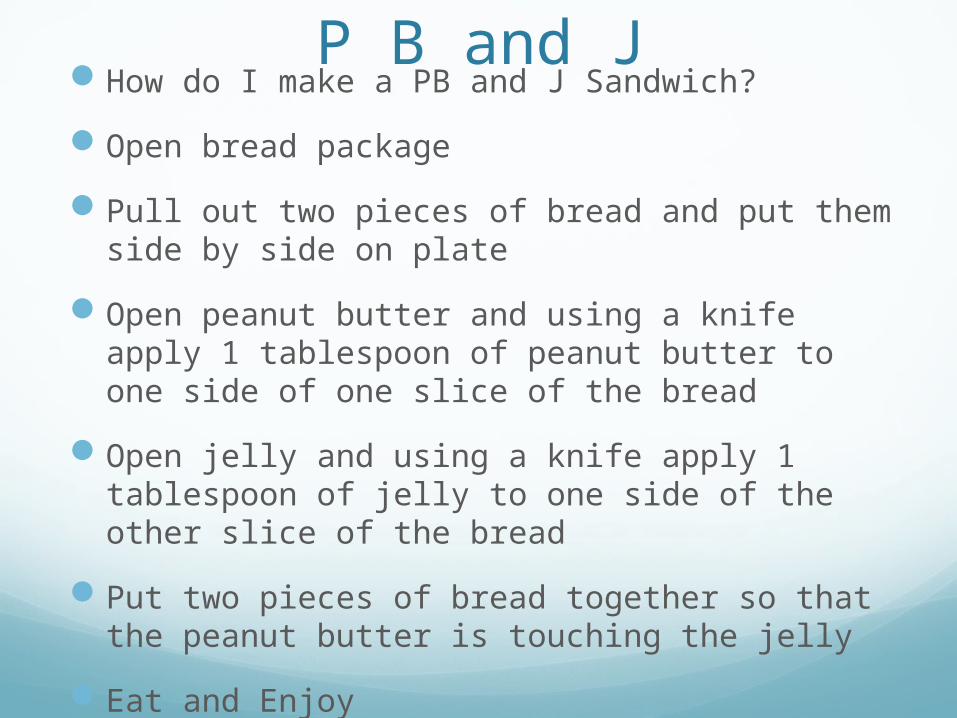
P B and JHow do I make a PB and J Sandwich?
Open bread package
Pull out two pieces of bread and put them side by side on plate
Open peanut butter and using a knife apply 1 tablespoon of peanut butter to one side of one slice of the bread
Open jelly and using a knife apply 1 tablespoon of jelly to one side of the other slice of the bread
Put two pieces of bread together so that the peanut butter is touching the jelly
Eat and Enjoy

ControlsThe group in which nothing
changes at all
Used as a comparison to the group being tested

Fair TestThere is only 1 independent
variable
This way you know that the dependent variable changed because of what you were testing and not because of an outside factor

Who can drink the water fastest?

Collect DataData- The information that you
gather
Examples:How tall did the plant growHow often did the kitten eatWhich side, light or dark, did the
insect prefer

Present DataChart- arranges information from
the experiment visually, such as in a table
Graph- placing numbers on a grid
Mathematics is Involved!
Patterns in data

Analyze DataHow you explain your data
Should summarize the graphs, tables, or charts you have
Looking for patterns

What if there’s an error?First of all, IT IS OKAY!
This just means you should take a look back at your lab, see where you can make improvements, and run more trials
What if the answer is not what we are looking for?
THATS OKAY TOO!
It’s just as important to know what doesn’t work as it is to know what does
Thomas Edison- "I have not failed 1,000 times. I have successfully discovered 1,000 ways to NOT make a light bulb."

ConclusionWas your hypothesis supported?
Should be written as
My hypothesis was supported because … (this data showed)
My hypothesis was not supported because … (this experiment showed)