scientific method · 2020. 7. 26. · • i can describe six basic steps in the scientific method...
TRANSCRIPT

Scientific Method

I Can Statements
At the end of this lesson, you should be
able to say, with confidence:
• I can describe six basic steps in the scientific
method that can be used for investigations.
• I can explain how to run a controlled experiment.
• I can distinguish between an independent variable,
a dependent variable, and a controlled variable.
• I can determine which type of graph would best
display various forms of data.
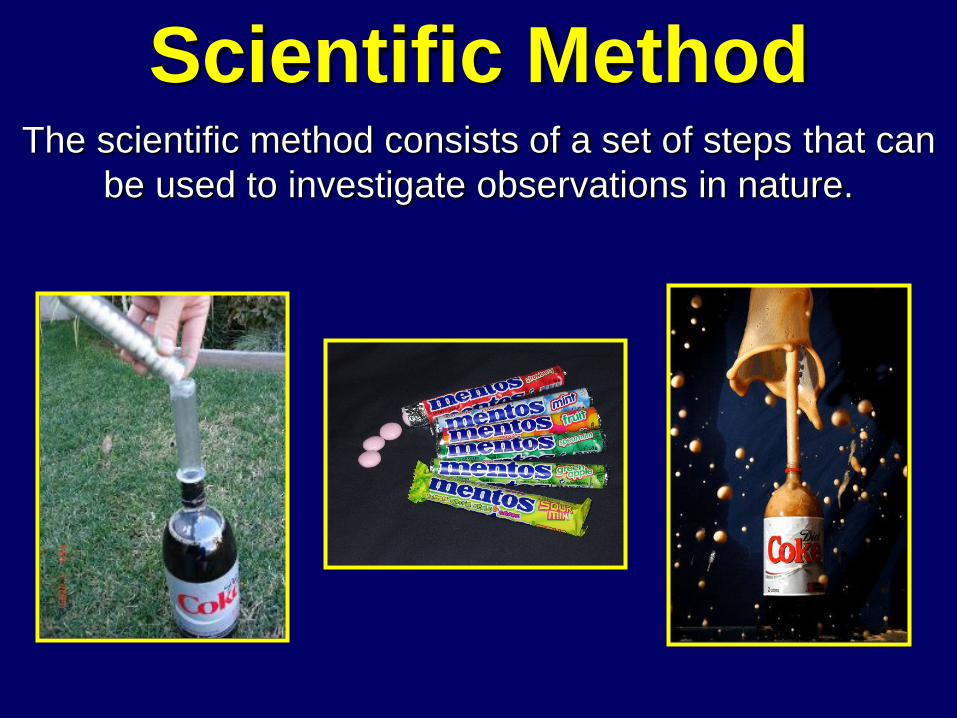
The scientific method consists of a set of steps that can
be used to investigate observations in nature.
Scientific Method

A student watched a video of Mentos candy being
placed in a 2 Liter bottle of Diet Coke and
wondered if they could make a larger explosion.
Make Observations
Scientists and other curious
people often observe something
happening and begin to wonder
why its happening or if it can be
done differently.
The first step in the scientific method, is to make
observations.

The second step is to form a hypothesis.
Form an Hypothesis
If the temperature of the Diet Coke is changed, the
explosion will be larger.
In order to be useful, a
hypothesis must be
able to be tested.
A hypothesis is usually
framed as an ‘if… then’
statement.
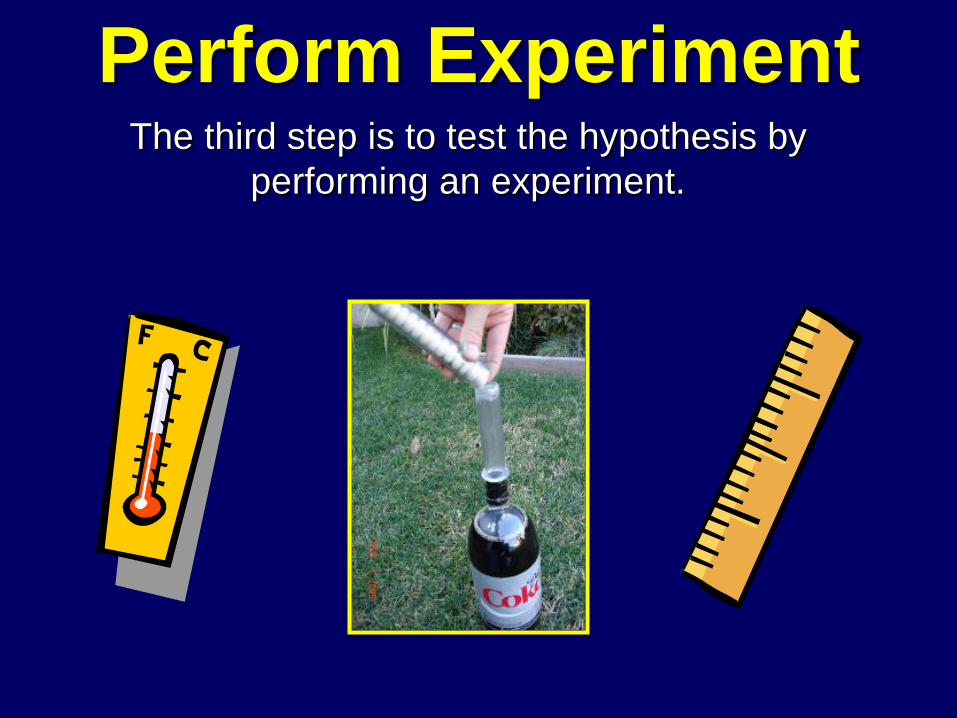
The third step is to test the hypothesis by
performing an experiment.
Perform Experiment

Experiments test the effect of one variable on another
variable using controlled conditions.
Experimental Process
In an experiment, anything that can be changed,
or can vary, is called a variable.
TemperatureHeight of
Explosion
Type &
Amount of
Soft Drink
Type &
Amount of
Candy
Procedure

Controlled Experiment
TemperatureHeight of
Explosion
Type &
Amount of
Soft Drink
Type &
Amount of
Candy
Procedure
In a controlled experiment, all the variables must be kept
the same except the variable that is being tested.
Since the student is testing the effects of temperature
on the explosion, everything else needs to be kept
exactly the same.

In a controlled experiment, all the variables must be kept
the same except the variable that is being tested.
Controlled Variables
The type and amount of Diet Coke, the type and amount of
Mentos candy, and the procedure used are all controlled
variables, in the student’s experiment.

Independent VariableThe variable being tested or changed during each
experimental trial, is called the independent variable.
In this case, temperature is the independent variable.

The dependent variable is the variable that is
measured during the experiment.
Dependent Variable
The results of the
dependent variable will
depend upon the
independent variable.
In this case, the height of the explosion is the
dependent variable.

A control group is an experimental set up in which no
variable is changed, not even the independent variable.
Control Group
Control
Group
Warm Temperature
Room Temperature
Cold Temperature
Since the student is testing temperature, the control
group would contain a Diet Coke in which the
temperature was not changed. (Room Temperature)
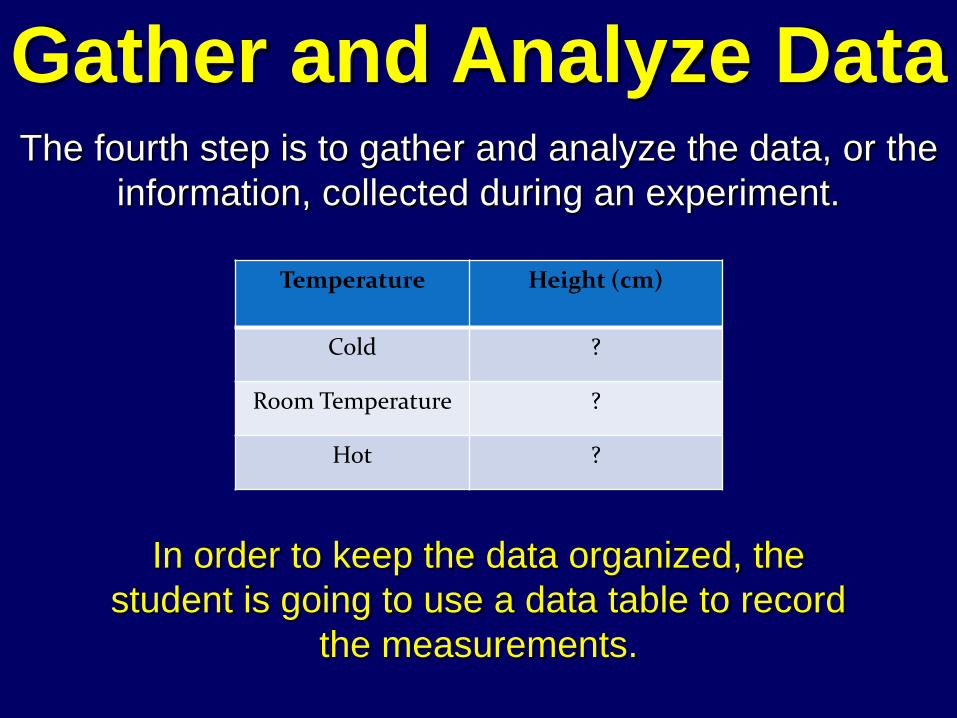
The fourth step is to gather and analyze the data, or the
information, collected during an experiment.
Gather and Analyze Data
Temperature Height (cm)
Cold ?
Room Temperature ?
Hot ?
In order to keep the data organized, the
student is going to use a data table to record
the measurements.

Line Graphs Bar Graphs
Circle Graphs
In order to easily analyze the data, graphs are often
used to visually represent the data.
There are three types of basic graphs:
Analyze the Data

Line graphs show the relationship between the
independent and dependent variables over time.
The dependent
variable is always
placed on the Y axis
and time is placed
on the X axis.
Line Graphs

Bar graphs are used for comparing measured
quantities.
Bar Graphs
Randolph County students who have read Tom Sawyer.
Nu
mb
er o
f S
tud
ents
Girls Boys
WHS ER Trinity SW

Circle graphs or pie charts are used for comparing
percentages.
School30%
Sleeping30%
Recreation30%
Studying10%
A Day in the Life of a Teenager
Circle Graphs

Analyze the Data
0
10
20
30
40
50
60
70
80
Cold Room Temperature Hot
He
igh
t (c
m)
Temperature
Diet Coke and Mentos Explosion
In Diet Coke and Mentos experiment, the height of
each explosion is being compared, so a bar graph
would be used.
The independent
variable,
temperature, is
placed on the X axis.
The dependent
variable, height, is
placed on the Y axis.

The fifth step is to draw a conclusion by deciding if the
hypothesis was supported or not supported, based on
the facts you gathered.
Draw a Conclusion
0
10
20
30
40
50
60
70
80
Cold Room Temperature Hot
He
igh
t (c
m)
Temperature
Diet Coke and Mentos Explosion
If the Diet Coke
is heated , the
explosion will
be larger.
Hypothesis
Hypothesis was
supported

If the hypothesis is not supported, then the hypothesis
can be revised or the hypothesis may just be rejected.
Unsupported hypotheses are still helpful because they tell us what doesn’t happen.
“We have not failed, we have found over 1,000
ways how not to build a light bulb”
Thomas Edison’s encouraging words to
an assistant.
Hypothesis Not Supported

Other QuestionsOne innate trait of a scientist or people who enjoy
science, is curiosity.
A lot of times,
after an
experiment has
been performed,
other questions
may arise.
Now that you know how to test a hypothesis, you
can answer all of the other questions by running
further experiments.
?

RetestIn the scientific community, when a hypothesis is
supported, other scientist would also run the
same experiment.
If after many retests,
the hypothesis was
always supported,
then the hypothesis
can become a theory.
In science, a theory is an explanation for how
something works, in nature, that is supported by a
large body of evidence.

The End