science programme€¦ · helmholtz centre for ocean research kiel with the support of cluster of...
TRANSCRIPT
volvooceanrace.com
Volvo Ocean Race
ScienceprogrammePreliminary results Leg 9 – Newport to Cardiff
volvooceanrace.com
Compiled using data provided by Dr Toste Tanhua & Dr-Ing. Sören Gutekunst, GEOMAR
Helmholtz Centre for Ocean Research Kiel with the support of Cluster of Excellence Future
Ocean. With contributions from Shaun Dolk, National Oceanic & Atmospheric
Administration.
Particular thanks to the Turn the Tide on Plastic and Team AkzoNobel race teams, and
notably Liz Wardley and Nicolai Sehested of those teams respectively, for facilitating and
conducting the data collection.
Further correspondence contact: Mairéad O'Donovan [email protected] /
Sören Gutekunst [email protected]
Media & Communication: Robin Clegg [email protected]
Central Coordination: Volvo Ocean Race: Anne-Cécile Turner
All contacts page 12
This report forms part of a suite of reports summarising the progress of data collection and
preliminary analysis. Refer also to previous reports available to download at
https://www.volvooceanrace.com/en/sustainability/legacy.html
Preliminary results Leg 9

volvooceanrace.com
Executive SummaryOver the last nine months the Volvo Ocean Race Science Programme has contributed considerable
amounts of data to extend scientific knowledge of microplastics distribution and other parameters that
indicate overall ocean health.
The arrival into Cardiff marked a significant milestone for this scientific research as it completed the world
circumnavigation back to Europe. The dataset generated by the race provides for the first time an internally
consistent picture of microplastic concentrations around the world.
This leg of the race from Newport, U.S.A to Cardiff, Wales provided an opportunity to sample a west-east
transect of the North Atlantic. Scientific drifter buoys were also deployed in areas typically difficult to seed
with these data-transmitting devices.
Samples were collected along this leg by two racing boats as both Turn the Tide on Plastic and Team
AkzoNobel carried sampling units.
Based on the preliminary results of analysis microplastics were recorded in all samples from this
transatlantic route. Remarkably the highest microplastic concentration for this transect was recorded in a
sample from the mid-Atlantic. Relatively consistent microplastics levels in the mid-Atlantic may
correspond to the northern edge of the North Atlantic Gyre or ‘Garbage Patch’.
Oceanographic measurements reflected the high summer productivity with phytoplankton sequestering
carbon dioxide from the ocean and providing an opportunity for absorption of excess atmospheric carbon
dioxide.
Collaboration, Funding
and Support
The onboard sampling component of the science programme is a collaboration between Volvo Cars,
Cluster of Excellence - The Future Ocean, GEOMAR Helmholtz Centre for Ocean Research Kiel, SubCtech
GmbH, bbe Moldaenke, Turn the Tide on Plastic and Team AkzoNobel crews. Volvo Cars has funded the
onboard equipment through profits from the sale of their Cross Country Volvo V90 Ocean Race edition
cars.
The scientific drifter buoys are part of the National Oceanic and Atmospheric Administration’s (NOAA)
drifter programme.
The sharing of meteorological data measured from the boats is part of a pilot project developed by
JCOMM (Joint technical Commission for Oceanography and Marine Meteorology, WMO – IOC1) partners.
These organisations are brought together by the Volvo Ocean Race Sustainability Programme, in order
to increase ocean knowledge, pioneer a new area of data collection and advance the technology of
instrumentation in order to contribute to create a global map of standardised data, specifically in the area of
microplastic concentration.

volvooceanrace.com On
bo
ard
sam
plin
g
Photo
© A
inhoa
Sanchez |
Volv
o O
cean R
ace

volvooceanrace.com
Preliminary resultsProvided by Dr Toste Tanhua and Dr-Ing. Sören Gutekunst, GEOMAR Helmholtz Centre for Ocean Research
Kiel with the support of Cluster of Excellence Future Oceans
Leg 9: Newport to Cardiff
Atlantic Transect
Leg 9 from Newport to Cardiff provided the opportunity to conduct a transect of the northern mid-Atlantic from east to
west over a very short period of time.
The preliminary results presented here are those from Turn the Tide on Plastic sampling effort only. To maintain
continuity of the existing dataset analyses of Turn the Tide on Plastic samples were prioritised and Team AkzoNobel
sample results will be presented at a later stage. Significantly, Liz Wardley of the Turn the Tide on Plastic crew,
increased the sampling effort on this leg by changing the microplastics filters daily. This provided a higher resolution
dataset of microplastic concentrations along the north Atlantic route. The Turn the Tide on Plastic sampling effort
rendered eight filter sets for analysis.
It is important as always to remember the preliminary nature of these results and also to view them with consideration
of ocean currents and the ‘averages’ that the numbers represent due to the potential geographical range of a single
sample.
The most notable feature of the preliminary dataset from this Atlantic transect was the relative uniformity of
concentrations through the mid-Atlantic possibly coinciding with the North Atlantic Gyre or ‘Garbage Patch’.
Mid-Atlantic microplastics
The first sample taken closest to Newport contained a microplastic concentration comparable with that measured on
the inbound leg – 75 particles/m3 at an average distance of 293km from Newport at the start of the east-bound leg,
compared to 71 particles/m3 on the approach to Newport.
A decrease to 25 particles/m3 was observed further offshore but remarkably concentrations in the mid-Atlantic
increased again to between 63 and 76 particles/m3. This may coincide with the northern edge of the North
Atlantic Gyre or ‘North Atlantic Garbage Patch’. What’s striking is that microplastics concentrations in this mid-
ocean segment of the route were comparable to concentrations recorded further inshore – 69 particles/m3 at an
average distance of 413 km from Cardiff and 75 particles/m3 at an average distance of 293km from Newport.


Measurements of oceanographic variables
reflected the time of year. The start of the
northern hemisphere summer results in an
increase in phytoplankton productivity thereby
using dissolved carbon dioxide. Consequently,
dissolved carbon levels observed during this leg
dipped below 360 ppm. This was similar to the
pattern observed in the South Indian (‘Southern’)
Ocean during the southern hemisphere summer
transect through that area.
Volvo Ocean Race 2017-2018
Oceanography
pCO2 - parts per million
Chlorophyll a – mg/m3
Maps © Sören Gutekunst, GEOMAR Helmholtz Centre for Ocean Research Kiel
The occurrence of the northern hemisphere
‘spring bloom’ was also illustrated by increased
chlorophyll a levels. This indicator of
phytoplankton productivity was particularly
elevated west of and over the Irish continental
shelf. It is important to remember that other
variables will affect chlorophyll a concentrations,
most notably the availability of daylight for
phytoplankton photosynthesis.
pH
pH levels were closely related to CO2
measurements. In correspondence with low
dissolved carbon dioxide ocean pH was relatively
basic i.e. relatively high pH value. Once again this
very clearly shows the relationship between
dissolved carbon dioxide and potential ocean
acidification.
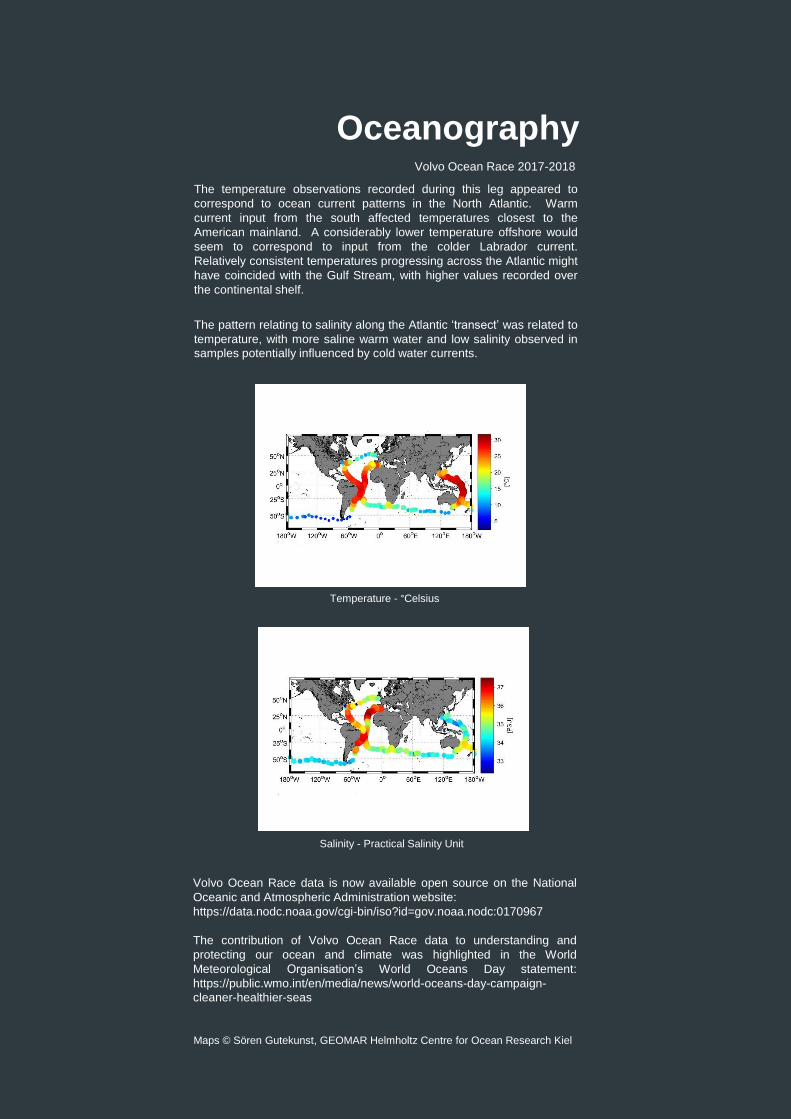
The temperature observations recorded during this leg appeared to
correspond to ocean current patterns in the North Atlantic. Warm
current input from the south affected temperatures closest to the
American mainland. A considerably lower temperature offshore would
seem to correspond to input from the colder Labrador current.
Relatively consistent temperatures progressing across the Atlantic might
have coincided with the Gulf Stream, with higher values recorded over
the continental shelf.
The pattern relating to salinity along the Atlantic ‘transect’ was related to
temperature, with more saline warm water and low salinity observed in
samples potentially influenced by cold water currents.
Volvo Ocean Race 2017-2018
Oceanography
Maps © Sören Gutekunst, GEOMAR Helmholtz Centre for Ocean Research Kiel
Temperature - °Celsius
Salinity - Practical Salinity Unit
Volvo Ocean Race data is now available open source on the National
Oceanic and Atmospheric Administration website:
https://data.nodc.noaa.gov/cgi-bin/iso?id=gov.noaa.nodc:0170967
The contribution of Volvo Ocean Race data to understanding and
protecting our ocean and climate was highlighted in the World
Meteorological Organisation’s World Oceans Day statement:
https://public.wmo.int/en/media/news/world-oceans-day-campaign-
cleaner-healthier-seas

volvooceanrace.com
Drifte
r Bu
oys
Photo
© S
am
Gre
enfield
| V
olv
o O
cean R
ace

Volvo Ocean Race 2017-2018
Scientific Drifter Buoys
Drifter buoy deployments during Leg 9 were chosen to fill gaps within the north Atlantic.
Many drifter deployment opportunities in the Atlantic basin are south of the proposed race
route, so these Volvo Ocean Race deployments aimed to seed gaps that otherwise rely on
buoys fed by the Gulf Stream.
One drifter buoy was deployed by each of the seven boats as listed below.
View the track of any of the Volvo Ocean Race Leg 9 drifter buoys at:
http://osmc.noaa.gov/Monitor/OSMC/OSMC.html
Map showing the area in the mid-Atlantic ‘seeded’ by Volvo Ocean Race drifter buoys
deployed during Leg 9.
BUOY NUMBER (WMO#) DEPLOYED BY
5401557 Team Brunel
5401566 MAPFRE
5401561 Dongfeng Race Team
5401509 Team AkzoNobel
5401562 Turn the Tide on Plastic
5401508 Sun Hung Kai Scallywag
5401567 Vestas 11th Hour Racing
Map © NOAA/GDP & NOAA/OSMC

volvooceanrace.com
See more
Watch:
https://www.volvooceanrace.com/en/news/11890_Making-sense-of-microplastics.html
Previous reports:
Download at https://www.volvooceanrace.com/en/sustainability/legacy.html
Legs 1-4 | Alicante – Lisbon – Cape Town – Melbourne – Hong Kong
‘Volvo Ocean Race Science Programme – Preliminary Results Leg 1, 2, 3 & 4'
Leg 6 | Hong Kong – Auckland
‘Volvo Ocean Race Science Programme – Leg 6 preliminary results_FINAL’
Leg 7 | Auckland - Itajaí
‘Volvo Ocean Race Science Programme – Auckland to Itajaí – Preliminary Data’
Leg 8 | Itajaí - Newport
‘Volvo Ocean Race Science Programme – Itajaí to Newport – Preliminary Data’
Interesting links:https://www.nasa.gov/topics/earth/features/perpetual-ocean.html
https://www.esa.int/SPECIALS/Eduspace_Weather_EN/SEM1HYK1YHH_1.html
View the Volvo Ocean Race Drifter buoys:
• Search for the Volvo Ocean Race drifter buoys in the list at:
http://www.aoml.noaa.gov/phod/dac/deployed.html
• Insert the WMO# of one of the buoys at http://osmc.noaa.gov/Monitor/OSMC/OSMC.html, change the
time range, display ‘All Positions’ and refresh the map to see the track line from where each buoy has
been transmitting.
• Alternatively, access the ‘Platform Info’ to view the raw near real-time data.
Photo © Volvo Ocean Race

volvooceanrace.com
Volvo Ocean Race
Scientific Consortium
.
With the support of
Contacts
Central Coordination
Anne-Cécile Turner
Sustainability Programme Leader
Volvo Ocean Race
Volvo Ocean Race Scientific Consortium coordinator
Dr Toste Tanhua
GEOMAR Helmholtz Centre for Ocean Research Kiel
On site coordinator, data analysis and reporting
Dr-Ing. Sören Gutekunst
GEOMAR Helmholtz Centre for Ocean Research Kiel
Scientific Programme copywriting and communication
Mairéad O'Donovan
Communication & Media
Robin Clegg
Sustainability Communications