scenarios for optimizing energy systems - siemens … and a third channel was opened to prepare an...
TRANSCRIPT
Answers for energy.
Connecting PossibilitiesScenarios for Optimizing Energy Systems
Living Energy

We invest more in efficient power generation so you can generate more return on investment.Affordability is a social and economic necessity.
siemens.com/energy
Answers for energy.
An affordable power supply is vital for every country’s busi-ness environment. The economic and social con sequences of high energy costs are critical, especially for industry and those who depend upon industry for their livelihood.
That’s why an economically efficient energy system is the focus of our work at Siemens. We develop pioneering ways of outstandingly efficient and cost-saving power generation and transmission with innovative technologies.
We invest more in efficient power generation so you can generate more return on investment.Affordability is a social and economic necessity.
Contents 3
Preface 4
Introduction 6
1 Europe 8
2 Russia 12
3 USA 16
4 China 20
5 Saudi Arabia 24
6 Republic of Korea 28
7 World 32
Imprint 34
Contents
3

Tomorrow’s energy: connecting possibilities
Energy is one of the fundamental requisites for the development of every society. Economic success and prosperity depend directly on the question of how reliably a society’s energy system – in particular electricity – functions. The situation naturally varies from country to country and from region to region. To ensure the availability of electricity and make it both economical and climate friendly, many questions have to be answered. And definitive answers can be found only when the search for solutions doesn’t end at a given country’s or region’s borders, but rather takes the larger contexts into account.
Our Road to the World Energy Congress in Daegu, October 2013, was a welcome opportunity to take a closer look at energy systems in regions throughout the world. Our goal wasn’t to focus on minor possibilities for improvements, but to think in larger terms. The individual scenarios make it clear that there is huge savings potential when it comes to sustainable, secure and, above all, cost-efficient energy supplies. The results are intended to stimulate ideas and motivate.
4

Preface
Dr. Michael Suess CEO Siemens Energy Sector and member of the managing board of Siemens AG
If we all promote and implement only a small share of these possibilities, we would make substantial progress toward achieving energy systems with more innovative technologies, more effective climate and environmental protection, better supply security and greater efficiency. Let’s join together and pursue this path!
Yours,
Michael Suess
5
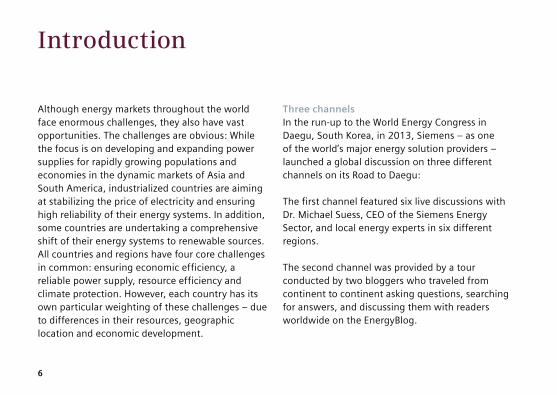
Introduction
Although energy markets throughout the world face enormous challenges, they also have vast opportunities. The challenges are obvious: While the focus is on developing and expanding power supplies for rapidly growing populations and economies in the dynamic markets of Asia and South America, industrialized countries are aiming at stabilizing the price of electricity and ensuring high reliability of their energy systems. In addition, some countries are undertaking a comprehensive shift of their energy systems to renewable sources. All countries and regions have four core challenges in common: ensuring economic efficiency, a reliable power supply, resource efficiency and climate protection. However, each country has its own particular weighting of these challenges – due to differences in their resources, geographic location and economic development.
Three channels In the run-up to the World Energy Congress in Daegu, South Korea, in 2013, Siemens – as one of the world’s major energy solution providers – launched a global discussion on three different channels on its Road to Daegu: The first channel featured six live discussions with Dr. Michael Suess, CEO of the Siemens Energy Sector, and local energy experts in six different regions. The second channel was provided by a tour conducted by two bloggers who traveled from continent to continent asking questions, searching for answers, and discussing them with readers worldwide on the EnergyBlog.
6
Introduction
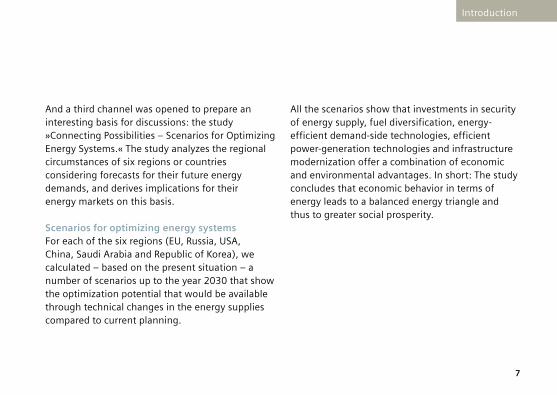
And a third channel was opened to prepare an interesting basis for discussions: the study »Connecting Possibilities – Scenarios for Optimizing Energy Systems.« The study analyzes the regional circumstances of six regions or countries considering forecasts for their future energy demands, and derives implications for their energy markets on this basis. Scenarios for optimizing energy systems For each of the six regions (EU, Russia, USA, China, Saudi Arabia and Republic of Korea), we calculated – based on the present situation – a number of scenarios up to the year 2030 that show the optimization potential that would be available through technical changes in the energy supplies compared to current planning.
All the scenarios show that investments in security of energy supply, fuel diversification, energy-efficient demand-side technologies, efficient power-generation technologies and infrastructure modernization offer a combination of economic and environmental advantages. In short: The study concludes that economic behavior in terms of energy leads to a balanced energy triangle and thus to greater social prosperity.
7

Europe
Population
552 million
58%
Self-sufficiency Power generation
thereof renewables
24%3,662 TWh
per capita
Per capita consumption
CO2 emissions per capita
CO2 emissions of power sector
5,631 kWh
CO2 intensity of power sector
440 gper kWh
1,373 Mt
2.5 t
Calculations for 2010 Source: IEA – WEO 2012; IEA – Energy Balances 2012; The World Bank – World Data Bank; Siemens calculations
8
Europe
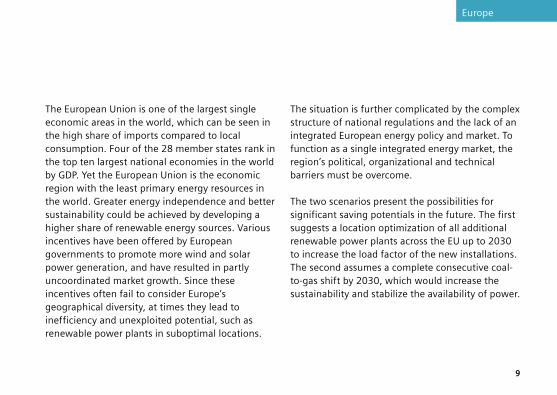
The European Union is one of the largest single economic areas in the world, which can be seen in the high share of imports compared to local consumption. Four of the 28 member states rank in the top ten largest national economies in the world by GDP. Yet the European Union is the economic region with the least primary energy resources in the world. Greater energy independence and better sustainability could be achieved by developing a higher share of renewable energy sources. Various incentives have been offered by European governments to promote more wind and solar power generation, and have resulted in partly uncoordinated market growth. Since these incentives often fail to consider Europe’s geographical diversity, at times they lead to inefficiency and unexploited potential, such as renewable power plants in suboptimal locations.
The situation is further complicated by the complex structure of national regulations and the lack of an integrated European energy policy and market. To function as a single integrated energy market, the region’s political, organizational and technical barriers must be overcome. The two scenarios present the possibilities for significant saving potentials in the future. The first suggests a location optimization of all additional renewable power plants across the EU up to 2030 to increase the load factor of the new installations. The second assumes a complete consecutive coal-to-gas shift by 2030, which would increase the sustainability and stabilize the availability of power.
9

The optimization of renewable power plant locations would lead to savings of up to USD 60 bn by 2030
2012Present
2030Optimized
»Renewable energy generation plants will be built at optimal geographic locations in the EU.«
Scenario 1
10
Europe
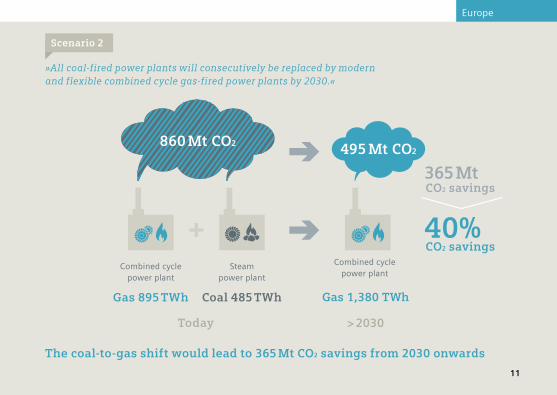
The coal-to-gas shift would lead to 365 Mt CO2 savings from 2030 onwards
> 2030Today
Gas 1,380 TWhGas 895 TWh Coal 485 TWh
Steam power plant
Combined cycle power plant
Combined cycle power plant
495 Mt CO2860 Mt CO2
+
»All coal-fired power plants will consecutively be replaced by modern and flexible combined cycle gas-fired power plants by 2030.«
Scenario 2
40%CO2 savings
365 MtCO2 savings
11

Russia
Population
142.7 million
184%
Self-sufficiency Power generation
thereof gas
50%1,036 TWh
Per capita consumption
CO2 emissions per capita
CO2 emissions of power sector
per capita
5,179 kWh
CO2 intensity of power sector
1,200 gper kWh
872 Mt
6.0 t
Calculations for 2010 Source: IEA – WEO 2012; IEA – Energy Balances 2012; The World Bank – World Data Bank; Siemens calculations
12

Russia
Stretching 17,100,000 square kilometers across northern Eurasia, Russia is the largest country in the world. Drawing on its vast energy resource reserves, Russia produced approximately 1,300 Mtoe of primary energy in 2010. This equaled more than 10% of the total worldwide primary energy demand that year. Only about half of the produced amount is consumed within the country itself; the rest is exported and thus a major driver for national GDP. Russia’s decisions concerning its energy will therefore have an influence on the security of international energy supplies, environmental sustainability and the country’s domestic economy. Most of the country’s power is generated in inefficient plants due to the lack of financial incentives for modernization. Tariff regulations in the power generation sector, for example,
discourage market competition and there is no market mechanism for investments. Nevertheless, modernization of the country’s plant fleet is necessary to tap benefits such as increased competitiveness, reduced fossil fuel dependency and environmental improvements. The scenarios quantify the efficiency potential in the Russian power generation and energy consumption sector. In terms of power generation, replacing gas-fired steam power plants would tap major potential for energy savings. With regard to end consumption, the potential offered by modernizing the industry, building and transport sectors is shown in the second scenario.
13

Additional export revenues p.a.
USD 20 bn (beginning 2030)
Combined cycle power plant
Steam power plant
Gas consumption p.a.
210 Mtoe
140 Mtoe
CO2 emissions p.a.
670 Mt
450 Mt
-33%
Regular planning 2030
Scenario 1 2030
A complete replacement of all gas-fired steam power plants by combined cycle power plants would lead to additional export revenues of USD 20 bn annually
»All gas-fired steam power plants will be replaced with efficient combined cycle power plants by 2030.«
Scenario 1
14

Russia
A rise of the efficiency of energy consumption on a best practice level would lead to additional annual export revenues of nearly USD 50 bn
»The Russian industry, transport and build-ing sectors will be modernized toward an international level of efficiency.«
Scenario 2
USD 20 bn
USD 20 bn
USD 10 bn
Additional export revenues p.a.
Building
Transport
Industry
CO2 savings p.a.
60 Mt
50 Mt
60 Mt
Energy savings p.a.
60 Mtoe
20 Mtoe
30 Mtoe
15

USA
Population
316.4 million
78%
Self-sufficiency Power generation
thereof coal
46%4,353 TWh
Per capita consumption
CO2 emissions of power sector
per capita
12,257 kWh
2,290 Mt
CO2 emissions per capita
7.4 t
CO2 intensity of power sector
530 gper kWh
Calculations for 2010 Source: IEA – WEO 2012; IEA – Energy Balances 2012; The World Bank – World Data Bank; Siemens calculations
16

USA
The United States accounts for roughly one-sixth of the global energy consumption and has until now been dependent on energy imports. Now that it is exploiting its vast reserves of unconventional fuels like shale gas to increase the affordability of its energy supplies, the U.S. is shifting from an energy-importing to an energy-exporting nation. The government’s focus on affordability of energy might be one reason for the comparably low share of renewable energy sources to date. Nevertheless, the U.S. can provide a sustainable and affordable energy supply by using its domestic natural gas in efficient combined cycle power plants. The reduction of CO2 emissions in the past years has been a positive side effect of the economically driven development that has strengthened U.S. global competitiveness. This course has helped the U.S. government achieve environmental
improvements in its energy supply while keeping energy prices low. Nonetheless, there is still potential to be realized. Most of the electricity in the U.S. is still generated by inefficient coal-fired power plants. These plants are economically viable due to the relatively low coal prices ensured by the country’s huge coal reserves. In addition, the country’s power transmission grid, with losses higher than the international average, is not adequate for today’s market conditions and is plagued by frequent supply interruptions. The two scenarios define various measures for overcoming the specific challenges in the U.S. energy market. They describe the economic and environmental savings that could be achieved by focusing on gas in power generation and modernizing the grid system.
17
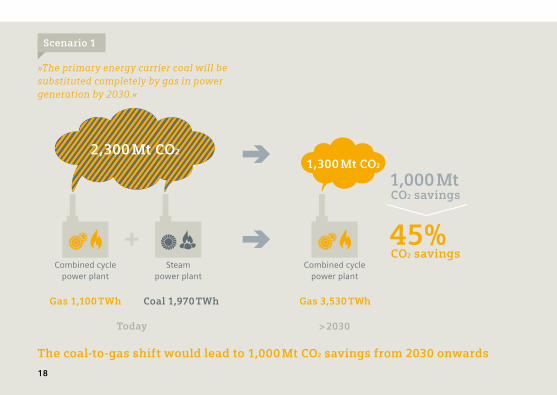
»The primary energy carrier coal will be substituted completely by gas in power generation by 2030.«
Scenario 1
1,300 Mt CO2
> 2030Today
Gas 3,530 TWh
Combined cycle power plant
2,300 Mt CO2
Gas 1,100 TWh Coal 1,970 TWh
Steam power plant
Combined cycle power plant
+ 45%CO2 savings
1,000 MtCO2 savings
The coal-to-gas shift would lead to 1,000 Mt CO2 savings from 2030 onwards
18

USA
»The power grid system in the U.S. will be modernized and developed towards an inter-national state-of-the-art level.«
Scenario 2
Reduction Annual savings
USD 4 bnReduction of overall grid losses from
about 6% currently to about 4%Annual savings in power production expenditures
The modernization of the power grid system would lead to savings of USD 4 bn annually
6% 4%
19

China
Population
1,353.3 million
91%
Self-sufficiency Power generation
thereof coal
78%4,247 TWh
Per capita consumption
CO2 emissions per capita
CO2 emissions of power sector
per capita
2,581 kWh
CO2 intensity of power sector
1,050 gper kWh
3,625 Mt
2.8 t
Calculations for 2010 Source: IEA – WEO 2012; IEA – Energy Balances 2012; The World Bank – World Data Bank; Siemens calculations
20

China
With over 1.3 billion inhabitants, China is the most populous country in the world. This vast number of people and China’s large economy make the country energy-hungry. In absolute numbers, it is the largest consumer of energy in the world and as the economy grows, demand for energy will continue to soar. To master this challenge, China needs uninterrupted access to affordable bulk energy. Furthermore, to maintain energy security, this needs to be achieved without substantially increasing the country’s dependence on energy imports. China currently has a high degree of self-sufficiency, primarily due to its extensive coal reserves.
At the same time, however, the country’s focus on coal is a key driver behind high CO2 emissions and has made China the world’s largest emitter. The government is aware of this problem and is taking various measures to control emissions. The power sector is responsible for nearly half of the total emissions in China. Given this situation, the following options for reducing CO2 emissions are feasible: modernization of aging, inefficient power plants, accelerated construction of highly efficient gas-fired power plants, and further development of non-fossil fuels, such as renewables. The scenarios examine a coal-to-gas shift for inefficient coal-fired power plants and an expansion of renewables.
21

»Replacement of inefficient coal-fired power plants (about 30% of the installed coal capacity) by efficient gas-fired combined cycle power plants by 2030.«
Scenario 1
A 30% coal-to-gas shift would lead to 1,300 Mt CO2 savings from 2030 onwards
1,200 Mtoe
1,430 Mtoe5,980 TWhSteam power plant
CO2 emissions p.a.Consumption p.a.
6,210 Mt
4,890 Mt
Regular planning 2030
Coal-to- gas shift scenario 2030
Steam power plant
4,190 TWhCombined cycle power plant
1,790 TWh
22
China
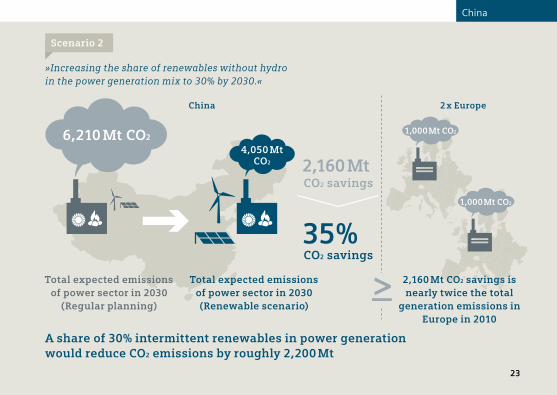
»Increasing the share of renewables without hydro in the power generation mix to 30% by 2030.«
Scenario 2
Total expected emissions of power sector in 2030
(Regular planning)
Total expected emissions of power sector in 2030 (Renewable scenario)
6,210 Mt CO2
4,050 Mt CO2
35%CO2 savings
2,160 MtCO2 savings
China
1,000 Mt CO2
1,000 Mt CO2
2,160 Mt CO2 savings is nearly twice the total
generation emissions in Europe in 2010
2 x Europe
A share of 30% intermittent renewables in power generation would reduce CO2 emissions by roughly 2,200 Mt
23

Saudi Arabia
Population
28.7 million
318%
Self-sufficiency Power generation
thereof oil
54%240 TWh
CO2 emissions per capita
CO2 emissions of power sector
Per capita consumption
per capita
7,140 kWh
CO2 intensity of power sector
940 gper kWh
183 Mt
6.7 t
Calculations for 2010 Source: IEA – WEO 2012; IEA – Energy Balances 2012; The World Bank – World Data Bank; Siemens calculations
24
Saudi Arabia
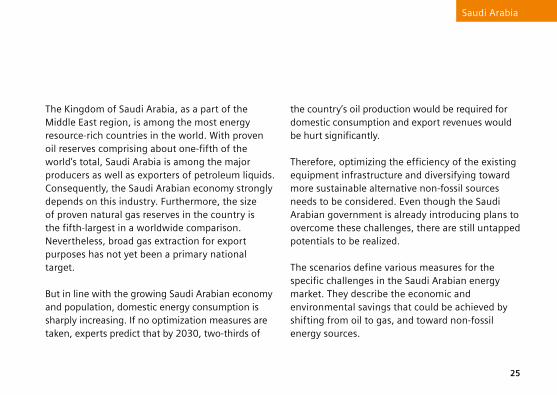
The Kingdom of Saudi Arabia, as a part of the Middle East region, is among the most energy resource-rich countries in the world. With proven oil reserves comprising about one-fifth of the world’s total, Saudi Arabia is among the major producers as well as exporters of petroleum liquids. Consequently, the Saudi Arabian economy strongly depends on this industry. Furthermore, the size of proven natural gas reserves in the country is the fifth-largest in a worldwide comparison. Nevertheless, broad gas extraction for export purposes has not yet been a primary national target. But in line with the growing Saudi Arabian economy and population, domestic energy consumption is sharply increasing. If no optimization measures are taken, experts predict that by 2030, two-thirds of
the country’s oil production would be required for domestic consumption and export revenues would be hurt significantly. Therefore, optimizing the efficiency of the existing equipment infrastructure and diversifying toward more sustainable alternative non-fossil sources needs to be considered. Even though the Saudi Arabian government is already introducing plans to overcome these challenges, there are still untapped potentials to be realized. The scenarios define various measures for the specific challenges in the Saudi Arabian energy market. They describe the economic and environmental savings that could be achieved by shifting from oil to gas, and toward non-fossil energy sources.
25
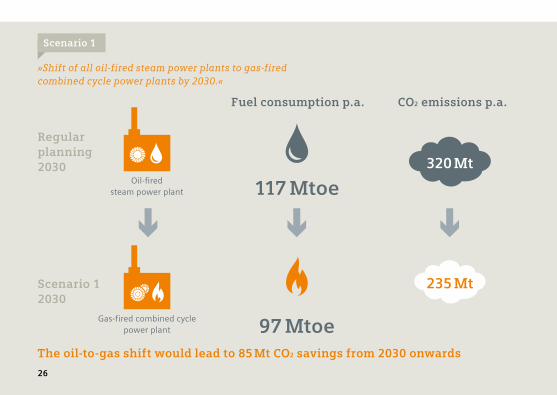
»Shift of all oil-fired steam power plants to gas-fired combined cycle power plants by 2030.«
Scenario 1
320 Mt
235 Mt
CO2 emissions p.a.
Gas-fired combined cycle power plant
Oil-fired steam power plant
The oil-to-gas shift would lead to 85 Mt CO2 savings from 2030 onwards
Regular planning 2030
Scenario 1 2030
117 Mtoe
Fuel consumption p.a.
97 Mtoe
26

Saudi Arabia
»Shift towards non-fossil energy by increasing the share of renewable and nuclear power plants by 2030.«
Scenario 2
Total expected emissions of power sector in 2030
(Regular planning)
Total expected emissions of power sector in 2030
(Scenario 2)
Saudi Arabia 1.5 x United Arab Emirates
320 Mt CO2
227 Mt CO2 60 Mt CO2
The increased share of non-fossil power generation would reduce CO2 emissions by roughly 93 Mt from 2030 onwards
93 Mt CO2 savings is approximately
1.5 times the total generation emis-
sions of the United Arab Emirates
for 2030
30%CO2 savings
93 MtCO2 savings
27

Republic of Korea
49.4 million
18%
Self-sufficiency Power generation
thereof nuclear
30%497 TWh
Per capita consumption
CO2 emissions per capita
CO2 emissions of power sector
per capita
9,186 kWh
279 Mt
5.7 t
CO2 intensity of power sector
620 gper kWh
Population
Calculations for 2010 Source: IEA – WEO 2012; IEA – Energy Balances 2012; The World Bank – World Data Bank; Siemens calculations
28

Republic of Korea
Due to its limited domestic energy resources, the Republic of Korea is heavily dependent on primary energy imports. The country consumed more than 680 million barrels of oil and 43.2 billion cubic meters of gas in 2011, partly due to its huge and advanced refinery industries. More than 85% of the country’s primary energy imports come from the Middle East, and this dependence is the major challenge faced by the Korean energy market. Greater independence of imports could be achieved by intensifying the development and integration of renewable energy sources and further expanding nuclear sources.
However, the country’s share of renewable sources in its overall primary energy supply is the lowest of all OECD countries, while its nuclear share lies above the OECD average. Consequently, improvement potentials exist that should be tapped to strengthen the economy overall and secure the country’s energy supply for the future. The scenarios have been calculated to address the specific Korean challenges and present options for the country’s energy market. In the first scenario, a coal-to-gas shift is assumed, while in the second scenario the share of renewable and nuclear power generation is assumed to increase up to 2030.
29

»All coal-fired power plants will consecutively be replaced by modern and flexible combined cycle gas-fired power plants by 2030.«
Scenario 1
The coal-to-gas shift would lead to 60 Mt CO2 savings from 2030 onwards
Regular planning 2030
Gas 210 TWh Coal 105 TWh
Steam power plantCombined cycle power plant
+
190 Mt CO2 130 Mt CO2
> 2030
Gas 315 TWh
Combined cycle power plant
30%CO2 savings
60 MtCO2 savings
30

Republic of Korea
»Shift towards non-fossil energy by increasing the share of renewable and nuclear power plants by 2030.«
Scenario 2
Total expected emissions of power sector in 2030
(Regular planning)
Total expected emissions of power sector in 2030
(Scenario 2)
190 Mt CO2 95 Mt CO2
The enhanced installation of renewables and nuclear power plants would lead to 95 Mt CO2 savings annually from 2030 onwards, compared to the regular planning
50%CO2 savings
95 MtCO2 savings
31

Résumé
The study showed that great potential for improving efficiency and reducing environmental impact lies in a coal-to-gas shift. Currently, the most efficient fossil power generation is achieved with gas-fired combined cycle power plants. Therefore, a coal- to-gas shift is the most sensible path in terms of efficiency. If one assumes a worldwide power generation shift from coal-fired steam power plants to gas-fired combined cycle power plants by 2030 (with the exception of China and India, where a 30% shift is assumed, due to extensive regional coal resources, limited gas resources, and missing infrastructure such as pipelines), this shift would result in annual CO2 savings of more than 4,000 Mt
from 2030 onward, which equals a 25% reduction in the power sector compared to the regular planning case. Technically recoverable conventional and unconventional global gas resources could cover the gas demand of a worldwide coal-to-gas scenario for more than 250 years. The calculated scenarios in this study show that investments in more efficient power generation and a heavier weighting of non-fossil energy sources like wind and solar in the energy mix would pay off in all energy markets. In short: The study concludes that economically based behavior in terms of energy leads to environmental and social benefits.
32
World
+ +Gas-fired
power plantGas-fired
power plantGas-fired
power plantCoal-fired
power plantCoal-fired
power plant
20302012
Regular planning
Coal-to- gas shift
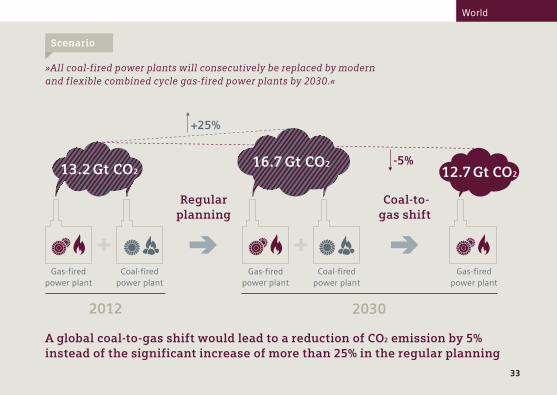
+25%
-5%13.2 Gt CO2
16.7 Gt CO212.7 Gt CO2
A global coal-to-gas shift would lead to a reduction of CO2 emission by 5% instead of the significant increase of more than 25% in the regular planning
»All coal-fired power plants will consecutively be replaced by modern and flexible combined cycle gas-fired power plants by 2030.«
Scenario
33

Imprint
Publisher Siemens Energy Sector Freyeslebenstrasse 1 91058 Erlangen Germany siemens.com/energy
For more information, please contact our Customer Support Center. Phone: +49 180 524 70 00 Fax: +49 180 524 24 71 (charges depending on provider) E-mail: [email protected] siemens.com/energy/living-energy
Image processing, graphics, layout feedback communication GmbH 90489 Nuremberg Germany
The complete study can be downloaded at: siemens.com/energy-study
Production Wünsch Offset-Druck GmbH 92318 Neumarkt, Germany
Order No. E50001-W100-A189-X-4A00 Printed in Germany Dispo 11900 fb 5859 WÜ 411260 10131.5
© 2013 by Siemens AG. All rights reserved.
The rights to all images are held by Siemens AG. The information in this document contains general descriptions of the technical options available, which may not apply in all cases.
All information and figures presented herein were current at the time of printing in September 2013.
34

siemens.com/energyFind
us at
Living Energy
E50001-G100-M164-V8-4A00

siemens.com/energy