scanner data: new opportunities for demand and...
TRANSCRIPT

Invited Presentation
Scanner Data: New Opportunities forDemand and CompetitiveStrategy Analysis
Ronald W. Cotterill
This paper reviews prior research by agricultural economists on the demand for food productsusing scanner data. Thereafter, a differentiated product’s oligopoly model with Bertrand pricecompetition is developed and used to specify brand level demand and oligopoly price reactionequations. The model has sufficient detail to estimate brand level price elasticities and priceresponse elasticities which in turn can be used to estimate three indices of market power. The
first index estimated is the familiar Rothschild Index. The paper develops estimates two new
indexes, the observed index and the Chamberlainquotient for tacit collusion. It concludes withcomments on how the proposed method for the measurement of market power in adifferentiated oligopoly can be improved.
I. Introduction
During the 1980s scanning of grocery prices fromthe universal product codes on packages becamecommon in the nation’s supermarkets. With thewide scale adoption of computerized tracking ofprice and volume movement the food industry nowoperates in an entirely new and revolutionary mar-keting and distribution environment. Wal-Mart,for example, attributes a significant portion of itscompetitive advantage to its centralized inventorymanagement and market analysis system. Check-out scanners in each Wall-Mart store instanta-neously send point of sale information to the Ben-tonville headquarters. Wal-Mart cuts store andwarehouse inventory levels to pipeline levels andevaluates marketing strategies on a weekly or evendaily basis. They negotiate with suppliers andcompete against competitors from a position ofpower based in part upon superior knowledge andlow cost operation.
Food manufacturers also have garnered signifi-cant advances in the planning, implementation,and monitoring of their distribution and marketingstrategies, Because there are real economies ofscale and scope in data processing no individualretailer has sufficient incentive to process scanner
Duector, Food Marketing Policy Center. Department of Agricukoral andResource Economics, University of Connecticut. This research was sup-ported by Special Research Grant No. 91-34178-6330with the Cooper-ative State Research Service, USDA, and by the Storrs AgriculturalExperiment Station. This report is Scientific Contribution No. 1568,Storrs Agricultural Experiment Station, Storrs, CT 06269.
data into a usable format for manufacturers. Twothird party firms, A.C. Neilsen and InformationResources, Inc. (IRI) provide virtually all scannerbased data services to food manufacturing firms.Neilsen and IRI provide food manufacturers withsummary data, however, their primary output ison-line software that allows marketing managersaccess to proprietary IRI or A.C. Neilsen analyti-cal programs as well as data to generate usefulreports.
Each company offers two basic types of scannerdata services. The first measures product flowthrough supermarkets. It is based upon a sample ofseveral thousand supermarkets and projects prod-uct movement in physical units, market share,prices, and merchandising activities for local mar-ket areas, eg., Boston, and for the entire U.S.Merchandising activity includes the percent of aproduct sold on aisle end display, the percent soldthat was featured in retailers’ local newspaper ads,and the percent price reduction when a product ison special. These data allow manufacturers tomonitor “retailer push” trade promotion activitiesthat manufacturers offer as deals to retailers. A.C.Neilsen calls its supermarket movement data baseNeilsen Scantrack. The IRI counterpart is the In-foscan data base that serves as the basis for a reg-ular feature on product marketing in the WallStreet Journal.
The second general type of commercial scannerdata base is the household panel. Both Neilsen andIRI maintain household panels with more than15,000 participants. A panel allows food manufac-

126 October 1994 Agricultural and Resource Economics Review
turers or other market analysts to evaluate “con-sumer pull” as opposed to “retailer push” mar-keting programs. The most important consumerpull strategies are manufacturer advertising (TV,radio, and print) and manufacturer coupons thatare distributed directly to consumers.
This paper will focus primarily upon aggregatesupermarket movement data (IRI Infoscan) be-cause it enables analysis of strategic interactionsbetween brands and companies on a local marketand/or national level. 1 Perhaps from a demandanalysis perspective one would prefer the house-hold level data, however, as we will see, the ag-gregate market level data do seem to allow estima-tion of demand curves for individual food prod-ucts, and even brand level demand curves. Forexample, I will present brand level demand elas-ticities for carbonated soft drinks, including Cokeand Pepsi, and Dr. Pepper.
The basic thesis of the paper is that the avail-ability of these new commercial scanner data nowallows significant advances in our understandingof food marketing because one can now estimatefirm and brand level as well as market or commod-ity demand models. The analysis can be donewithin the framework of a differentiated productoligopoly model that incorporates “supply side”conduct that may not be competitive.
The paper is organized as follows. The next sec-tion reviews prior scanner based demand and in-dustrial organization research to set the stage forthe current research opportunities. Section threeprovides examples of the IRI Infoscan data forthree products. They are from the University ofConnecticut, Food Marketing Policy Center IRIInfoscan data set. It contains quarterly data formost branded and private label grocery products inlocal IRI market areas as well as the total U.S. for1988–1992. The examples will illustrate possibil-ities for research including brand level demandanalysis, the impact of a merger upon retail prices,and farm to retail price transmission analysis. Sec-tion Four will oufiine one approach to a detailedanalysis of brand level demand and oligopoly pricerelationships. The approach provides brand levelown and cross-price elasticities, supply side pricereaction elasticities, and a new, more detailedmeasurement of market power. Currently,Lawrence Hailer, Research Scientist, and Glenn
LTo date neither company has been able to constmct a panel largeenough to merge household level “consumer pull” information with thesupermarket movement data. Thus, one cannot evaluate the impact ofmanufacturers’ coupons upon product demand. IRI and Neilsen marketarea demographic and retail market structure variables are available onan annual basis from annual editions of Progressive Grocer, kfrzrkelScope.
Langan and Hong Wen, doctoral candidates, areworking with me on a large scale project at theUniversity of Connecticut Food Marketing PolicyCenter that uses IRI data to analyze several indus-tries including soft drinks, beer, bottled water, cat-sup, cottage cheese, and cold breakfast cereal. Thesoft drink results reported here are provisional andas such should not be used for policy analysesbecause we are still developing our models andeconometric methods. Nonetheless, they illustratethe type of new theories and empirical insights thatscanner data will support.
II. Prior Research with Scanner Data
Demand Analysis
A.C. Neilsen, IRI, and their clients in the foodindustries have estimated brand and product cate-gory demand relationships; however, very few ofthese studies are public. Neilsen and IRI data havebeen systematically collected only since 1987 andthey are available to public only for a fee if at all.2The Marketing Science Institute, Cambridge, Mas-sachusetts has been a conduit for access to a lim-ited amount of IRI panel data on coffee (Cooperand Nakanishi, 1988, p, 254).
Among agricultural economists, researchers atthree different universities have collected rawscanner data from cooperating local supermarketsto estimate store level demand relationships. AtCornell, McLaughlin and Lesser (1986) studiedpotato sales in eight stores over a 42 week period.They report consumer response to price changes isrelatively elastic.
At Texas A & M, Capps (1989) and Capps andNayga (1991) estimate demand relationships formeat products. Capps analyzes weekly sales ofsteak, ground beef, roast beef, chicken, porkchops, ham and pork loin for all supermarkets of aleading chain store in the Houston market. Thereare 75 times series observations and the model is asingle equation, double log, specification withpounds per customer as the dependent variable. Italso is specified as a lagged explanatory variable tocorrect for autocorrelation and to account for habitpersistence. Cross price effects are only capturedby including an aggregate price for the other twomeat categories. A non beef price, for example, is
2 In addition the University of Connecticut purchase of quarterly In-foscan data for all major branded food products 198f+1992, the Uni-versity of Vermont has purchased quadweekly Infoscan data for real andimitation maple syrup products for four [RI mackets. Iskow et al. usesthese data to analyze sales of maple syrup.
Cotlerill Scanner Data 127
included in each specific beef product demandequation. Prices areassumed to be exogenous andZellner’s seemingly unrelated regression method isused to estimate parameters. Homogeneity orsym-metryrestrictions arenotimposed obtested. Thereis no income variable; however, Capps notes thatthis chain targets high income consumers. Themodel contains demand shift variables includinglocal advertising. Capps reports significant ownprice elasticities that are less than one except forroast beef. Given the review bv Tellis (1988) ofproduct (not commodity or indu~try) level demandstudies, wherein own price elasticities are usuallyin the 1.5 to 2.5 range, the Capps result seems lowto me. Most of Capps cross price elasticities aresignificant and pos$ive.
At the University of Tennessee, Brooker andEastman have produced several publications ana-lyzing item movement and demand for products.They use weekly scanner data from five supermar-kets of a chain store in a southeastern city. Brookeret al, (1994), for example, use a linear version ofCapps and Nayga’s model to estimate the demandfor roast beef, steak, and ground beef. The data areaggregated across stores to produce 153 time seriesobservations. In addition to own and cross priceeffects, they try to estimate own and cross elastic-ities for local TV advertising and feature newspa-per advertisements for each product. Individualequations are estimated using ordinary leastsquares with some discussion of autocomelation.Homogeneity and symmetry are not mentioned.Brooker et al. report significant own price elastic-ities ranging between – 1.01 and – 1.55, and sig-nificant negative, i.e., complementary, cross priceelasticities for ground beef. No other cross priceelasticities were significant. Own newspaper ad-vertising effects are positive and significant as hy-pothesized but TV advertising only has a signifi-cant (f30sitive) effect for roast beef. Cross adver-tising’’effects kre generally not significant.
This is not the forum for critically assessing thecontribution of these papers to demand analysis.They are to be credited for pioneering the use ofscanner data. Yet, the advent and wide scale adop-tion of the Neilsen and IRI commercial data ser-vices by the industry is replacing ad hoc local mar-ket data collection efforts and allows much moreprecise and comprehensive analysis of marketingquestions.
Iskow and others at the University of Vermontare currently using IRI Infoscan data to analyzedemand for maple syrup (Iskow et al., 1994).They have purchased quadweeldy data for a fouryear period (1988-1991) for four standard Metro-politan Statistical Areas in the Northeastern United
States. It includes prices, quantities, and promo-tional activities for price and imitation maple syrupbrands. Iskow et al. estimate price, income, andpromotion elasticities for five leading brands.They use a double log specification and Zellnersseemingly unrelated regression method with au-toregressive disturbances. Prices are assumed to beexogenous, and homogeneity and symmetry re-strictions are not considered, Iskow et al. reportsignificant negative own price elasticities at thebrand level and find that larger share brands havelower elasticities. They report positive and signif-icant cross price and promotional effects.
Industrial Organization Analysis
Even less work on the firm strategies in oligopo-listic markets has been done with scanner data,because such work requires information acrossseveral firms and/or markets as well as products.One can’t use samples of a few supermarkets fromone firm in one market. Using the IRI InfoscanHailer (1993, 1994) has analyzed the relationshipbetween brand market share and price. 3 All brandsare pooled across local markets and over quartersfor 1988–1992. Given this panel data, a fixed ef-fect estimation approach is used. For cottagecheese he reports that brands that have largershares have significantly higher prices. For coop-erative brands, however, there is no significantshare price relationship and cooperative presencein a local market tends to lower proprietary cheesebrand prices. Farmer cooperatives seem to be vol-ume rather than profit oriented, possibly to movemembers’ product and reduce milk surpluses.
Hailer also has done work on the catsup industry(1994). Cotterill and Hailer (1994) describe thelocal market structure and conduct of the icecream, butter, margarine, cottage cheese, and fluidmilk industries.
Chevalier (1993, 1994) uses IRI data in a verydifferent and unique study. She develops a modelof oligopoly that incorporates financial leverage.Depending on how leverage is modeled, she dem-onstrates in a duopoly framework that debt cantransform a firm into a tough (lowers price) or soft(raises price) competitor. The actual outcome is anempirical question. Chevalier tests her theories onthe supermarket industry where many leadingfirms underwent leveraged buyouts during the1980s. As an MIT graduate student she was able,
3 Afthough the data are retail data, note that the firms under anefysisare food manufacturers. Control variables for retaif markups are includedin these medels.

128 October 1994
through an MIT professor who sits on the IRIBoard of Directors, to obtain Infoscan data for in-dividual chains in local IRI markets. Normally,IRI refuses to identify individual chains and pro-vides only market area price for a particular prod-uct. Chevalier reports that leveraged supermarketchains did, ceteris paribus, charge significantlyhigher prices than non-leveraged chains in localmarkets. In fact she found that for 10 of the 17local markets she analyzed all LBO chains werehigher priced than non-LBO chains (1994, p. 23).Her model, however, does not include retail costand market structure variables such as firm marketshare or retail concentration ratios. One wondershow their inclusion would affect her results.
111. Specific Examples of IRI Data
As the work by Hailer and Chevalier suggest, themarket level commercial scanner data bases,Neilsen Scantrak or IRI Infoscan, are the most ap-propriate to analyze both demand and strategic in-teractions. Often a chart that illustrates relativelysimple relationships can communicate more abouta topic than equations or words. This section con-tains a set of charts to illustrate different researchtopics that the IRI Infoscan data can address. Fig-
Agricultural and Resource Economics Review
ure 1 displays the quarterly price and volumemovement data for the three leading brands of mar-garine in Chicago for 1988–1991. The IRI Info-scan data base has 47 such local markets in 1988and the number increases to 65 in 1992. These datafor Chicago clearly seem to trace out demand re-lationships for each brand. If one ignores the factthat these three brands are being sold simulta-neously and pools the data to estimate a demandcurve for “branded” margarine, one clearly ob-tains a strong hyperbolic relationship.
Since this is market and not household level dataone probably should not assume price to be exog-enous. In the next section we will endogenizeprice. Here, however, if one examines data for onecity over time, the assumption of Capps andNayga, Brooker and Eastman and Iskow et al. thatprices are exogenous seems appropriate at least asa working assumption. Market demand may berather stable and exogenous shocks to an unstablesupply curve may identify a demand curve.
Figure 2 illustrates the impact of the ConAgraacquisition of Beatrice Foods upon Hunt’s Catsup,a leading Beatrice brand. The vertical line in Fig-ure 2 indicates the date of the merger. Prior to themerger, the pricing of Hunt’s Catsup tended tofollow industry and seasonal patterns. After themerger Hunt’s Catsup follows a distinctly different
--- IMPERIAL
-T LAND O LAKES
—— PAR KAY
$1,05-Margarine - Chicago
$1.00 ~ ..—
$0.95 ~ “-:I
~ $0.90 J tf -3: $0.85 + ~
1
,L,.
; $0.80 /’ ,-.=
~+ . ... *
:$0.75 -i-4
$0.70- J .,,.—4 ++ 7- .,.
$0.65- .— —.— .-
$0.60-
$om53-~T..- ......_. —- 1 T
1000 1500 2000 2500 3000Volume Sales (1000s of pounds)
Source: Cotterill and Hailer (1994), IRI Infoscan data, Food Marketing Policy Center, Univ. of Connecticut
Figure 1. Price and Volume Sales: Quarterly 1988-1989

Co fterill Scanner Data 129
$0,85
I AA
$0.751 I
g
# $0,70,,...
,,,,
k ,/‘,: $0.65- . ‘,,
$, /’ ... ‘,.C ‘,, ,,’,/’ ~.L -----,
$0060 _::,,...”’ ,..’”...-....----
~.
\\\
\ //,’,,’ ‘\, ‘\J
,/’
~,. . . . . . .. . . , — HEINZ
-------HUNTS-- DEL MONTE
PRIVATELABEL
$0,55
1
I ,$0,501 I r12341234123412 341234
88 89 90 91 92
Sourest Hailer (1994), IRI Infosean data, Food Marketing Policy Center, Univ. of Connecticut
Figure 2. Catsup Prices: Total U.S.
and steadily increasing price trend. Data fromLeading National Advertisers indicate advertisingfor Hunt’s Catsup was cut, and Hunt’s marketshare decreased from 22.2 percent in 1989 to 20,1percent in 1992.4 The merger seems to have trig-gered a unilateral exercise of market powe~ otherfirms, including the leader Heinz, did not followHunt’s price lead.
Figure 3 tracks another major recent event infood markets. During late 1989 the Minnesota-Wisconsin price for manufacturing milk skyrock-eted from $10.98 in May to $14.93 per hundred-weight in December because of a temporary milkshort fall. In 1990 it plummeted as farmers in-creased production rapidly and substantial milksurpluses reappeared. Figure 3 displays prices in-dices (quarter 1 1988 equals 100) for the Minne-sots-Wisconsin milk price, private label and KraftAmerican Cheese. These indices allow us to ex-amine how farm level price changes are transmit-ted to the retail level. Retail prices tend to lag farmprices by a quarter, and retail price increases arelower than milk prices prior to the peak Minnesota-Wisconsin price. This is to be expected since raw
milk is only one cost factor in retail cheese pricesand other cost factors tend to be less volatile. 5With these caveats, farm and retail price changesseem to track each other quite closely prior to thepeak in the Minnesota-Wisconsin price series.Thereafter, they diverge. Private label cheese pricefollow Minnesota-Wisconsin milk prices downwith a distinct lag. The fact that they do not dropas much represents the converse of the fact thatthey do not increase as rapidly when raw milkprices rise.
Price conduct in Figure 3 for Kraft AmericanCheese, is distinctly different from private labelconduct. Retail price continues to rise for severalquarters after the Minnesota-Wisconsin milk pricebreak in the fourth quarter of 1989. Kraft’s con-duct did not go unnoticed and resulted in congres-sional hearings on cheese prices. Since the dataexist at the brand level and for major local marketsas well as the total U. S., one can analyze geo-graphic and brand or firm specific price transmis-sion. Clearly, more detailed analysis of the IRIdata can contribute to our understanding of thefarm to retail price transmission process.
4 See Hailer (1994a) for a detailed analysis of catsup pricing andHailer (1994b) for a detailed analysis of the impact of the ConAgraacquisition rrpnn the price and advertising strategy of Beatrice’s leadlngfond brands.
5 If raw milk costs account for only 50 percent of retail cheese pricethen a 20 percent increase in milk price, ceferis paribus, produces onlya 10 percent increase in cheese price.

130 October 1994 Agricultural and Resource Economics Review
160- American Cheese, 1Q 1988- 4Q 1992
150I
Indexed at 1Q 88 = 100
140
130
120
110
100
90 1-Kraft American Cheese Price Index “’”~.,-.,,, pflvate Labe[Ameflcan Cheese Price lndeX.,,.,,,,,,,,,Minn..~s, Manufacturing Milk Price Index
8Oj----T–77-7-Ty-T-- , ~ ~ ---- ~------ ~2Q 88 4Q 88 2Q 89 4Q 89 2Q 90 4Q 90 2Q 91 4Q 91 2Q 92T4Q 92
1Q88 3Q88 1Q89 3Q89 1Q90 3Q90 1Q91 3Q91 1Q92 3Q92
Source: IRI Infoscan data, Food Marketing Policy Center, Univ. of Connecticut,Federal Milk Order Market Statistics, Annual Summary, USDA.
Figure 3. Price Index Trends: Total U.S.
IV. Brand Level Demand Analysis in aDifferentiated Oligopoly
Neoclassical demand analysis usually focusesupon distinctly different commodities, for exam-ple, butter versus margarine or beef versus pork.Firm or brand level demand analysis introduces theorganization of the industry in direct and unavoid-able fashion. The demand estimation problem be-comes particularly problematic when the industryis an oligopoly that sells differentiated products.Endogenizing prices is not sufficient. Price inter-dependence between brands complicates the spec-ification of supply relationships. One cannot as-sume, for example, that the price of Pepsi remainsconstant when the price of Coke changes due toshift in a cost variable or a desire for a higher profitmargin. Some degree of price followship or tacitcollusion often exists among brands in concen-trated oligopolies.
Baker and Breshnahan (1985) were the first in-dustrial organization economists to consider care-fully the potential benefits of combining demandand industrial organization concepts to analyze
pricing in a differentiated oligopoly. Their ap-proach, however, uses residual demand modelsthat rely upon fairly restrictive supply side behav-ioral assumptions (Froeb and Werden 1991),
Brand level analysis of demand and marketpower can be based upon a more general theory,that I will present here. Assume that an industry isdifferentiated and that Bertrand competition, oc-curs, i.e. price is the strategic variable.6 Then thedemand for brand 1 in this industry of n brands is:
91 = 91(P1 . . pn, D)
Where:
ql = the quantity of brand 1PI =pieceofbrandi= l.. .nD = a vector of demand shift variables in-
cluding income.
Taking the derivative of this equation, with respectto PI, using the chain rule to account for oligopo-
6 See, for example, Deneckere and Davidson (1985), Scherer andROSS (1990, p, 19%206).

Cotterill
listic price interdependence, and some algebraicmanipulation yield the following formula for theobservable price elasticity of demand.
observable price elasticity for brand 1partial own price elasticity of demandfirm 1 cross price elasticity with re-spect tO Pi
rivals’ price response elasticity (thepercent than e in pi when p, changes
%one percent).
Baker and Breshnahan commence their anal-ysis with a similar formula, however, they analyzeperceived as opposed to actual observable demandelasticities because they consider ●jl to be brandone manager’s perceived or conjectured price re-sponse by rival i to a change in brand one’s price.Later to estimate their model they implicitly as-sume conjectures are consistent, i.e., brand onemanager’s conjecture about a rival’s price responseis equal to the actual observed price reaction bythat rival when brand one price changes. For clar-ity I make the assumption explicit and up front.
Note that a brand’s observable own price elas-ticity has two general components. The first is thefamiliar partial own price elasticity. In industrialorganization analysis we describe this as the non-followship demand elasticity because it quantifiesthe impact on brand demand when the price in-creases and no rival brands prices change. Thenonfollowship price elasticity measures the unilat-eral market power of the brand (Federal MergerGuidelines, Section 2. 11). The second componentof the actual price elasticity measures the coordi-nated market power component of a brand’s ob-servable elasticity, If other brand managers behavein a tacitly collusive fashion and follow the eleva-tion (or reduction) of brand one’s price, then the ~ilin equation 1 are positive. Assuming all productsin the industry are substitutes, i.e., differentbrands compete with each other for customers, thecross price elasticities, ~il, are also positive. Thusto the extent that coordinated market power exists,it makes the observed own price elasticity lesselastic than the partial own price elasticity.
Two special cases are worth mentioning. The
Scanner Data 131
first is when all ~il are zero and is the nonfollow-ship case discussed above. The second special caseis when tacit collusion is perfect. Given the con-sistent conjunctures assumption, all ●il are one.When tacit collusion is perfect the observed ownprice elasticity is the partial price elasticity plus thesum of the cross price elasticities which is positive,so demand is less elastic.
Figure 4 illustrates these demand relationshipsfor each individual brand. I have used the elastic-ities to draw a linear approximation at around pointPI QI of what may be nonlinear demand curves.sAssume the market is in equilibrium at PI Q1 andthe managers for brand 1 decide to raise price toP2. In this example observed output decreases toQO. If there was perfect tacit collusion, it wouldhave declined only to QF and if there was no tacitcollusion output would have declined to Q~F. Oneconstructs a measure of the degree of unilateralmarket power by dividing the slope of the nonfol-lowship demand curve by the slope of the fellow-ship demand curve. This is the Rothschild Index(Greer p, 99). A more general definition that flowsfrom my analysis is the ratio of the followshipelasticity, ~f’, to the nonfoilowship elasticity, q ~~.
Rothschild Index ~R1) = fi
‘fill
Under perfect competition the slope of the nonfol-lowship demand curve would be zero (q ~~ is infi-nitely negative) and the Rothschild Index is zero.If the nonfollowship demand curve is identical tothe fellowship then all cross price elasticities ofdemand must be zero and the brand effectively hasa monopoly position.
One can define a second measure of observed(i.e., combined unilateral and coordinated) marketpower, by dividing the slope of the observed de-mand by the followship demand. Again, a moregeneral definition would be the ratio of the fellow-ship elasticity, q:, to the observed elasticity, q~, Ifthere is no unilateral or coordinated power thisindex is zero and it ranges to one if observed de-mand equals followship demand. This index isnew to the field and I chose to call it the O Index.Thus, we have:
and05RISO151
7 In certain price reaction models it is possible to measure both con-jectures about prices and acturdprice reactions and to test for consistent(Llang).
8 Constant elasticity demand curves am nonlinear and other functionalforms such as the double log and almost ideal demand system alsoproduce nonlinear demand curves.

132 October 1994 Agricultural and Resource Economics Review
Price
P2
Followship Demand
– Observed Demand
- NonfoHowship
~ \DemandkQ NF Q. Q, Q, Quantity
Figure 4. Theoretical Demand Relationships for a Brand in a Differentiated Oligopoly (iinearapproximation).
The O Index of observed market power is alwaysgreater than or equal to the Rothschild Index ofunilateral market power because it includes coor-dinated market power.
Finally one can decompose the observed marketpower into the proportion that is due to coordinatedmarket power. I define the Chamberlain Quotient(CQ) as:
Rothschild IndexCQ=l– .lJ!J
0 Index 41
It gives the proportion of observed market powerthat is due to tacit collusion. Again this index isnew to the industrial organization field, and isnamed in recognition of Edwin Chamberlain, theeconomist who gave the English language theword’ ‘oligopoly” and who provided the first theo-retical analysis of tacit collusion (1933).
When discussing the Rothschild Index Greerstates:
. the Rothschild Index provides only oneanswer to the question “How market powershould be measured?” And it is not necessarily
the best answer. Its greatest shortcoming is itspurely theoretical nature. In practice it is notpossible to estimate the index accurately . . .[Greer 1990p. 101].
Since the Rothschild index provides only “one art-swer, ” there is need for additional measures suchas the O and Chamberlainindices. Also, this paperdemonstrates that the IRI or Neilsen brand leveldata now allow precise estimation of these indices.
To illustrate I will present provisional estimatesof the own price, cross price and price responseelasticities and the Rothschild, O, and ChamberlainIndices for a set of competing branded products.This work employs the linear approximate almostideal demand system (LA/AIDS) as developed byDeaton and Muellbauer (1980) to model the regu-lar soft driuk brands.g In this paper I assume thatthe regular carbonated soft drink group is a rele-vant product market. Although I actually estimatea demand system for nine regular soft drink cate-gories, for expository purposes assume the system
9 Ultimately, regular and diet demand system estimates will be part ofa two stage budget framework to estimate cross price effects between thetwo groups,

Cotlerill
has only two brands. The LA/AIDS demand equa-tions are:
()
xq = I?I + f3111npl+ dlzlnpz + ~llog ~
+ (312D
()
xsz = ~z + dzllnp] + dzzlnpz + 13zlog ~
+ (322D
where:
si = the market share of brand i = 1, 2Pi = the price of brand i = 1, 2X = the expenditures on the two brand
categoryin p = sllnpl + szlnpz (Stone’s linear ap-
proximation price index)D = a vector of demand shift variables
The LA/AIDS is a specific functional form for thegeneral demand equations presented as equations 1and 2. The linear approximate form substitutesStone’s price index for a more general weightedprice index because that index requires non-linearestimation. Deaton and Muellbauer demonstratethat LA/AIDS model has desirable aggregationproperties and is a preferred functional form foranalyzing market level data. The homogeneity andsymmetry restrictions of consumer demand theorycan be readily imposed. In the two good modelsthey are:
Homogeneity: 1311+ d12 = O, d21 + 13zz= O
Symmetry: a21= (3,*
Green and Alston (1990) provide an algorithm forcomputing own and cross price elasticities fromthe LA/AIDS model. Chalfant (1987) provides amethod for computing standard errors for elastici-ties. Strictly speaking the vector of demand shiftvariables, D, should be introduced in a non linearfashion as part of a generalized expenditure index,however linear estimation is possible with the cur-rent specification so we retain it.
Turning now to the supply side of the model,each oligopolist seeks to maximize profits. We as-sume Bertrand competition, i.e., price not quantityis the strategic choice variable. In the duopoly ex-ample one has:
MAX~i = piqi = ci(q~,‘-i) ./br i = 1, 2
wrt pi
where:
c~(qi>~J the brand i total cost function~i) IS brand i input price vector
Scanner Data 133
One can use the first order condition and thebrand demand curve to solve for each brand’s pricereaction function. Liang (1989) provides a linearexample that can readily be extended to the doublelog specification. Derivation of the exact func-tional form of the price reaction curves for theLA/AIDS model is not feasible, however HongWen, Lawrence Hailer and I have made someprogress for the AIDS model with its more generalprice index, Our basic results indicate that the fol-lowing functional form is appropriate.
Since the price reaction functions are logarithmicin prices, the coefficients on the other brand’sprice, E12,e21,are the price response elasticities.
In the two brand example the two demand equa-tions and the two price reaction equations seem toconstitute a four equation simultaneous systemwith brand market shares, S1and Szand prices, pland p2, are endogenous variables. However, theadding up property of the LA/AIDS demand sys-tem means that for n demand equations one esti-mates n – 1, and recovers the parameter estimatesfor the n’hequation from them. Heuristically, sincethe market shares of the brands in our two brandexample sum to 1, if one has an estimate of oneshare, one also knows the other. Thus, in the twobrand example one actually estimates a three equa-tion simultaneous system with three endogenousvariables.
Let us now turn to an empirical example forregular soft drinks. The seven leading brands areCoke, Pepsi, Royal Crown Cola (RC), Sprite,Seven-Up (7-Up), Doctor Pepper (Dr Pep), Moun-tain Dew (Mt Dew). These brands plus privatelabel regular soda (PrivLab) averaged 75 percentof regular soft drink sales in 1988-1990. All othersoft drink brands are aggregated into a brand la-beled another. The resulting simultaneous equa-tion system that is estimated includes (nine minusone) eight demand equations and nine price reac-tion equations with 17 endogenous share and pricevariables. Homogeneity ands ymmetry restrictionsare imposed on the demand system.
Appendix Tables A1–A3 report the variablesused in the analysis, system specification and de-scriptive statistics. The data set includes 12 quar-terly observations (1988-1990) for 45 IRI localmarket areas. As such, it is a balanced panel dataset with 540 observations. An error components

134 October 1994 Agricultural and Resource Economics Review
Table Al. System of Demand and Price Reaction Equations, Remdar Carbonated Soft Drinks
Shrcok, = a. + a ,Pcoke + %ppep.i + ~3pRC + ~4PsPrite + ‘5P7UP + %f’DrPep
+ c@’MtD.w + a8pPrivLab + ‘# AllOther + a ,&xpenditureX + a, ~FeaturecOke
i- a,2DisplaycOke -t ci,J?elTVAdvcOke + a ,4Temperature
ShrpeP,i = PO + ~ ,Pc.~. + @2PPep., + ~3pRC + ~4pSPri1e + fi5p7UP + ~#DrPeP
+ p7PMtDew + p8Pp,ivLab + 13#A,,other + ~ ,&xpenditureX -t ~, ,Feamre~.P.,
+ ~12DisplaypeP,i + p ,3RelTVAdvP,P,i + ~ ~dTemperature
ShrRc = ~~ + V,PcO~. + Y2p@M + y3PRC + y4pspri,e + ~5p7up + ~#DrPep
+ ?7PMtDew + y8pPri.Lob + ~#AUOther + y,&xpenditureX -!- y, ,Feature~c
+ -y,2DisplayRc + y ,3RelTVAdvRc + y ,4Temperature
[ShrA,,o,ke, = 80 + b ]Pcoti + ~2PPePSi + 63PRC + ~4PsPrite + ~5P7uP + 6#DrPeP
+ 87PM,Dew + ?i8Pp,ivkb + 8#A,,o,her + 6, &xpenditureX + 8,, FeatureAl,o,he,
+ 8,2DisplayA,,oth., + 6 ,3RelTVAdvAl,o,~e, + 8 ,4Temperature]
P Coke = K. + K ,ShrcOk. + K2Pepst + K3PRC + K41’sp,it. + K5P7UP + K#D,pep + K7pM,Dew
+ K8Pp,ivLob + KgfA,,ozh,, + K,&xpenditureX + K,, Temperature + K, *FeaturecOke+ K ,3DisplaycOk, + K,4UnitlVolcOk, + K ,J/elTVAdvcOk. + K1#upMktlGrocSale+ K, ,MktCR4 + K, ~population + K,~weetner + KmCokeCaptive
P Pqmi = k. + h ,ShrpeP,i + k#c.k, + &pRC + A4psp,ite + &pwP + ‘#’DrPeP + ~TpMIDeW
+ A8Pp,ivtib + k#Atlolhe, + A,&xpenditureX + A, ,Temperature + A,2FeaturepeP,L
+ A1@isplaypeP.{ + k ,4UnitlVolPeP.i + k ,@elTVAdvpeP,i + k, #upMktlGrocSale+ A,7MktCR4 + A,8Poptdation + A,~weetner + k2#epsiCaptive
P~c = I). + 4Jhr~~ + dJ2pc.~, + Wp.psi ● ~dpsprite ● ~S1’TUP f ~&’DrPep + ~7pMtDew
+ ~8Pp,ivLab + ~#A,lo,~e, + @,@xpenditureX i- t),, Temperature + ~,2Feature~c+ ~, @isplayRc + ~,4UnitlVolRc + t/s,5RelTVAdvRc i- ~l&SupMktlGrocSale-1- ~,7MktCR4 + IJI~Population + iJIJ’weetner
PAUO,her = ‘~ + co ,ShrA1lo,he, + m2PCoke + ~3PPePW + tI)4PRc + USPSp,j,. + @7up + ‘7pDrPqJ
+ to8P~,~eW + C@p,ivtib + w ,@xpenditureX + m,, Temperature + w, 2FearureAllothe,
+ w ,~is@ayAllOthw + o ,4Unit/ VolA,,o,~,, + m, #?elTVAdvA,,o,he, + co,.#upMktlGrocSale+ w ,7MktCR4 i- m ,8Population i- w ,$weetner
and three stage least squares estimation routinewas used to estimate the model’s parameters.’0
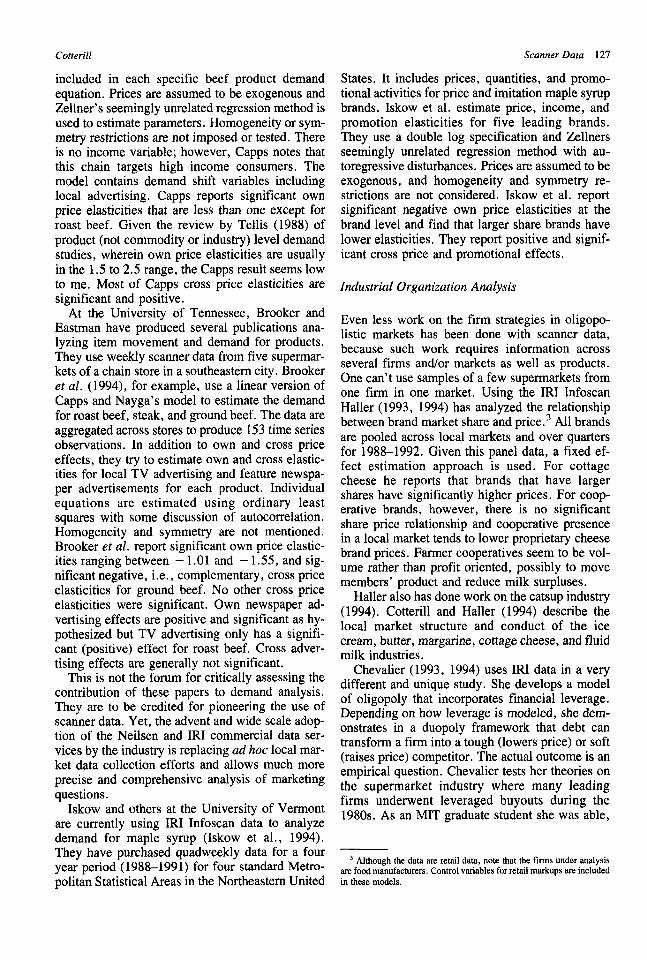
Table 1 reports own and cross price elasticitiesand significance levels. Elasticities are computedfrom the LA/AIDS coefficient estimates usingGreen and Alston’s formula iii (1990, p. 494).Significance levels are based upon standard errorscomputed using the Chalfont (1987) method.Coke’s partial own price elasticity is – 1,496.Pepsi is somewhat more elastic at – 1.868. Thesemeasures of unilateral market power, i.e., nonfol-lowship demand, indicate that if Coke or Pepsiraise price and no other brand follows, their reve-nue declines. Such a price increase may howeverstill be profitable. If profits are 10 percent of salesthen increasing price 10 percent doubles the profit
10This is ~ mndom rafier than fixed effects approach. Since manYOfour exogenous vuriables ure essentially cross section variables, e.g.,market area population, in Table A1, a fixed effects approach is notapplicable. It wipes out all cross sectinn variables (Hausman and Taylor1981).
margin of an output that is only 14,9 percent lowerfor Coke or 18.6 percent lower for Pepsi. 1*
Note that the cross price elasticities for Cokeand Pepsi are .35 and significant. The implicationis if these brands tend to follow each other on price(tacitly collude) then the observed own price elas-ticity will be less than the nonfollowship elasticityreported in Table 1. For example, if there is fullycollusive pricing between Coke and Pepsi (and allother brands do not follow their lead) then Coke’sobserved price elasticity would be – 1.496 + .355= 1.141, Pepsi’s would be – 1.86 + .353 =– 1.507. A merger between these two brands isequivalent to establishing fully collusive pricing,so if they actually were practicing nonfollowshippricing before the merger, it clearly increases theirmarket power.
Briefly examining some other brands, Royal
II see Langan and Cot@rill (1994) for a more explicit example that
uses actual company profit sales ratios, The basic point still holds.

Cotterill Scanner Data 135
Table A2. Description of Variables and Related Notes
SHRcOke the percent of regular carbonated soft drink expenditures spent on Coca ColaShrP,P,t the percent of regular carbonated soft drink expenditures spent on PepsiShr~c the percent of regular carbonated soft drink expenditures spent on RCShr~Pri,, the percent of regular carbonated soft drink expenditures spent on SpriteShr7uP the percent of regular carbonated soft drink expenditures spent on 7UpShr~rPeP the percent of regular carbonated soft drink expenditures spent on Dr PepperShr~,~eW the percent of regular carbonated soft drink expenditures spent on Mountain DewShrP,ivh, the percent of regular carbonated soft drink expenditures spent on Private LabelShrALlo,her the percent of regular carbonated soft drink expenditures spent on All Other Brands
P_ naturat log of price of brand
Expenditure natural log of (regular carbonated soft drkrk expenditures divided by a price index*)
Feature _ percent of brand’s volume sold with feature advertisingDisplay _ percent of brand’s volume sold with displays and point of purchase promotionsUnif/Vol _ number of units brand divided by the volume sold of brandRelTVAd _ brand’s national TV advertising as a percent of the leader
Temperature mean temperature in local market for a given quarterSupMktlGrocSale the percentage of all grocery sales in local market made by supermarketsMktCR4 percentage of all grocery sales in local market made by top 4 grocery chainsSweetner price of most frequently used sweetner during study period (higher fructose com syrup)Population population in local marketCokeCaptive binary variable to indicate a Coca Cola Co.-owned bottler for the local marketPepsiCaptive binary variable to indicate a Pepsi Co.-owned bottler for the local market
*Stone’s linear approximate price index was used, ie., (supra, p. 316)
Crown Cola which is priced significantly belowthe leading regular soft drink brands and marketedas a “value” brand (Duvall 1993, p. 60, 69) is themost elastic brand ( – 2. 50). Private label regularsoda performs in a very strange fashion. Onewould expect it also to be very elastic but it is themost inelastic brand, – .94. This seems to suggestthat private label soda has more unilateral marketpower than all other brands and could increaseboth revenues and profits by increasing prices. Pri-vate label also has a fairly large negative crossprice elasticity with RC and RC has a huge,– ,758, cross price elasticity with private label.’2
They clearly are strong complements. This sug-gests that they should be aggregated into a com-mon “value brand” for the analysis of marketpower. The resulting own price elasticity probablycould be more in line with the others.
Significant complements rather than substituterelationships also crop up elsewhere in Table 1.Sprite, a clear soda, for example, has a negative(complementary) cross price elasticity ( – .090) inthe Coke demand equation and Coke is a comple-ment in the Sprite equation. Since these brands are
12me imPo~ition of sYrnme~ requires that the cross price coeffi-cients in the LA/AIDS model be equal. Cross price elasticities cananddo differwhenbrandshavedifferentmarketshares.
both produced by the Coca Cola Company the re-sults do provide some evidence on the extent towhich companies position and market products ascomplements rather than substitutes. MountainDew, a Pepsico brand, however has a positive(substitute) cross price elasticity in the Pepsi de-mand equation (row 2 of Table 1).
Complementary demand relationships were notexpected among these ostensibly competing regu-lar soft drink products. Intuitively what seems tooccur is that when Coke, for example, lowers itsprice shoppers are attracted to the aisle and pickupsome Sprite as a complementary product to pro-vide “variety” or a clear soda for the uncolacrowd. Other strong complementary relationshipsexist for the following two pairs: Seven-Up andprivate label, and Mountain Dew and Dr. Pepper.
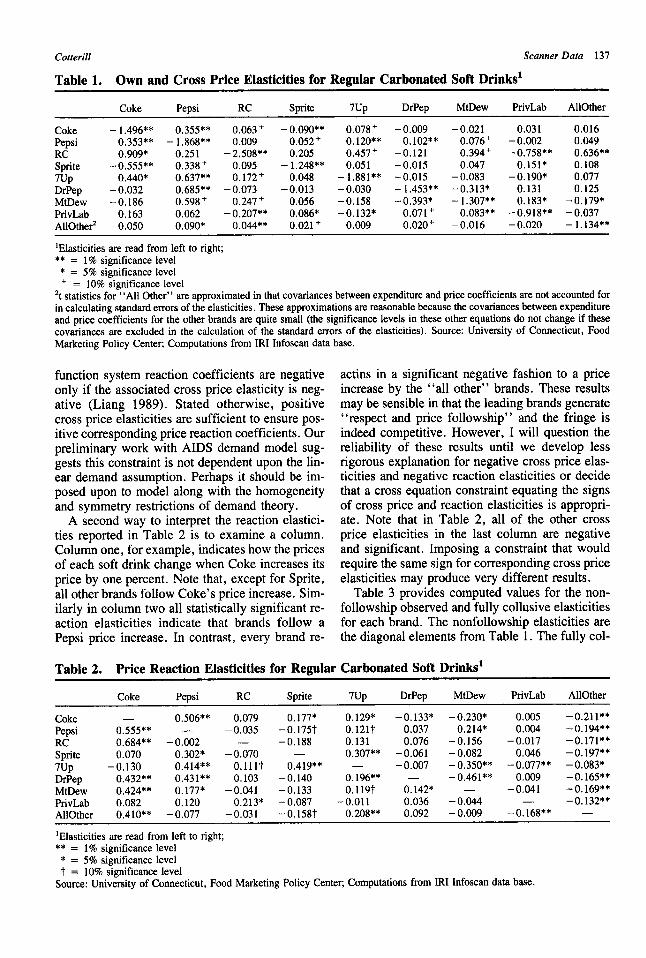
Table 2 presents estimates of the price reactionfunction elasticities for each brand. Reading acrossrow one, one can see that a 1 percent increase inPepsi price increases Coke price by .506 percent.A similar percentage point increase for RC onlyraises Coke price .079 percent; for Sprite, Cokeprice increases .177 percent; and for Seven-Up,Coke increases .129 percent.
Note that increases in Dr. Pepper, MountainDew and “all others” result in significantly lowerCoke prices. Negative price reaction coefficientswere not expected. In a linear demand and reaction

136 October 1994 Agricultural and Resource Economics Review
%s8s8888;000000000
Cotterill Scanner Data 137
Tablel. Ownand Cross Price Elasticities for Regular Carbonated Soft Drinks1
Coke Pepsi RC Sprite 7up DrPep MtDew PrivLab AllOther
CokePepsiRCSprite7upDrPepMtDewPrivLabAllOthe#
– 1.496**0.353** -0.909*
-0.555**0.440*
–0.032–0.186
0.1630.050
0.355**- 1.868**0.2510.338+0.637**0.685**0.598+0.0620.090”
0.063+0.009
–2,508**0.0950.172+
-0.0730.247+
–0.207**0.044**
–0.090**0.052+0.205
– 1.248**0.048
–0.0130,0560.086*0.021 +
0.078+o. 120**0.457+0.051
– 1.881**-0.030–0.158–0.132*
0.009
–0.009o. 102**
–0.121–0.015-0.015– 1.453**-0.393*
0.071 +0.020+
-0.0210.076+0.394+0.047
–0.083–0.313*– 1.307**
0.083**–0.016
0.031–0.002-0.758”’
0.151*– 0. 190*
0.1310.183*
-0.918**–0.020
0.0160.0490.636**0.1080.0770.125
-0.179*–0.037–1.134**
lElasticities are read from left to right;** = l~o significance level* = 5% significarrce level+ = 10% significance level
*t statistics for’ ‘AUOther” are approximated in that covariances between expenditure and price coefficients are not accounted forin calculating standard errors of the elasticities. These approximations are reasonable because the covariances between expendhureand price coefficients for the other brands are quite small (the significance levels in these other equations do not change if thesecovariances are excluded in the calculation of the standard errors of the elasticities). Source: University of Connecticut, FoodMarketing Policy Centev Computations from IRI Infoscan data base.
function system reaction coefficients are negativeonly if the associated cross price elasticity is neg-ative (Liang 1989). Stated otherwise, positivecross price elasticities are sufficient to ensure pos-itive corresponding price reaction coefficients. Ourpreliminary work with AIDS demand model sug-gests this constraint is not dependent upon the lin-ear demand assumption. Perhaps it should be im-posed upon to model along with the homogeneityand symmetry restrictions of demand theory.
A second way to interpret the reaction elastici-ties reported in Table 2 is to examine a column.Column one, for example, indicates how the pricesof each soft drink change when Coke increases itsprice by one percent. Note that, except for Sprite,all other brands follow Coke’s price increase. Sim-ilarly in column two all statistically significant re-action elasticities indicate that brands follow aPepsi price increase. In contrast, every brand re-
actins in a significant negative fashion to a priceincrease by the “all other” brands. These resultsmay be sensible in that the leading brands generate“respect and price followship” and the fringe isindeed competitive. However, I will question thereliability of these results until we develop lessrigorous explanation for negative cross price elas-ticities and negative reaction elasticities or decidethat a cross equation constraint equating the signsof cross price and reaction elasticities is appropri-ate. Note that in Table 2, all of the other crossprice elasticities in the last column are negativeand significant. Imposing a constraint that wouldrequire the same sign for corresponding cross priceelasticities may produce very different results.
Table 3 provides computed values for the non-followship observed and fully collusive elasticitiesfor each brand. The nonfollowship elasticities arethe diagonal elements from Table 1. The fully col-
Table 2. Price Reaction Elasticities for Regular Carbonated Soft Drinksl
Coke Pepsi RC Sprite 7up DrPep MtDew PrivLab AllOther
Coke — 0.506** 0.079 0. 177* O.129* -0.133” – 0.230* 0.005 –0.211**Pepsi 0.555** — –0.035 –o.175t o.121t 0.037 0.214* 0.004 -0.194**RC 0.684** – 0,002 — -0.188 0.131 0.076 -0.156 –0.017 –0.171**Sprite 0.070 0.302* –0.070 — 0.307** –0.061 – 0.082 0.046 –0.197**7up -0.130 0.414** O.lllt 0.419** — -0.007 –0.350** – 0.077** – 0.083*DrPep 0.432** 0.431** 0.103 –0.140 0.196** — – 0.461** 0.009 –0.165**MtDew 0.424** o. 177* –0.041 –0.133 o.l19t 0.142* — –0.041 -0.169**PrivLab 0.082 0.120 0.213* – 0.087 -0.011 0.036 –0.044 — –0.132**AllOther O.41O** –0.077 –0.031 -0.158t 0.208** 0.092 – 0.009 –0.168”” —
1Elasticities are read from left to right;** = 1% significance level
* = 5q. signific~ce level
t = 10% Jgnificance levelSource: University of Connecticut, Food Marketing Policy Centeq Computations from IRI Infoscan data base.

138 October 1994 Agricultural and Resource Economics Review
Table 3. Brand Elasticity Measures and Market Indices
Non-Fellowship Observed Fully Collusive Rothschild o ChamberlainElasticity Elasticity Elasticity Index Index Quotient
Coke – 1,496 – 1.276 –1,073 0.717 0,841 0.147Pepsi –1,868 –1,571 –1,109 0.594 0.706 0.159RC –2.508 –2.618 –0.535 0.213 0.204 –0.044Sprite – 1,248 –1.436 – 1.028 0.824 0,716 –0.1517up –1.881 –1,704 –0.794 0.422 0.466 0.094DrPep – 1.453 –1,457 –0.974 0.670 0,669 – 0.002MtDew – 1,307 –0,950 –1.139 0.872 1.199 0.273PrivLab –0,918 –0.896 –0.828 0.902 0.924 0.024AllOther –1,134 –1,173 –0,937 0.826 0.799 –0.034
lusive (fellowship) elasticities are the sum of therows in Table 1. The observed elasticity for abrand is computed using equation one and is thevector product of the brand’s row of demand elas-ticities in Table 1 with its column of reaction elas-ticities in Table 2.13 Table 3 also computes theRothschild, O, and Chamberlain indices for eachbrand. For Coke, Pepsi, Seven-Up, and PrivateLabel these indices behave as expected. Coke, forexample, has a nonfollowship elasticity equal to– 1.496 and its fully collusive elasticity is – 1.073so the Rothschild index is .71 and indicates a sub-stantial amount of unilateral market power. Theobserved elasticity falls between the nonfollowshipand fully collusive elasticity and produces in con-junction with the latter an O Index of unilateral andcoordinated market power equal to ,841. TheChamberlainQuotient indicates that 14.7 percent ofCoke’s market power is due to tacit collusion.
Other brands in Table 3 produce results that,quite frankly, were not expected and suggest theneed for a broader conceptualization of competi-tion and strategic interaction. Complementary(negative) cross price elasticities or negative pricereaction elasticities combine to produce negativeChamberlainquotient for four brands (R. C., Sprite,Dr. Pepper and All Others). Also Mountain Dewgenerates an observed elasticity that is greater thanthe fully collusive value. Cross equation con-straints on cross price and reaction elasticities doseem advisable. In conjunction with the symmetryconstraint they would ensure that observed elastic-ities always fall between nonfollowship and fullycollusive elasticities thereby eliminating theseanomalies.
Note that even with the imposition of crossequation constraints one can still have negativecross price elasticities and negative correspondingreaction function elasticities. Since the product oftwo negatives is positive, the integrity of the rank
13For purposes of this calculation Table 2 should also contain ones onthe diagonal to include the own price practical elasticity.
ordering of the elasticities and market power indi-ces reported in Table 3 is restored, but now one hascomplements in the formula, This leads me to sug-gest the following proposition, brands that are stra-tegic complements behave in a fashion that en-hances tacit coordination. For example, if Cokeraises its price, and brand X is a strategic comple-ment then brand X experiences lower demand forits product. Given the downward shift in its de-mand, brand X lowers its price to maximize profits(a negative price reaction to the change in Cokeprice). Due to symmetry brand X cross price elas-ticity in the Coke demand equation is also nega-tive. Consequently, a decrease in brand X priceincreases demand for Coke and thereby lessens theloss of market share due to Coke’s own price in-crease. In other words, the observed elasticity isless elastic than the nonfollowship elasticity.
V. Concluding Comments
If this paper raises more questions than it answersit has served its most basic purpose, This is a newarea of theoretical and empirical inquiry. Both su-permarket movement and household panel datacollected by IRI and A. C. Neilsen are the core datafor market research in the private sector. As thesedata become more accessible to the research pub-lic, they unquestionably will become the founda-tion for new theory and empirical science in mar-keting.
Demand modeling and empirical analysis ofprice, advertising retailer push, and consumer pullmarket strategies at the brand as well as productcategory or industry level will provide consider-ably more precise understanding of firm conductand household behavior.
Scanner data and the analytical approach dis-cussed in this paper may also contribute to theanalysis of a wider range of topics including re-source economic issues. The local market bottledwater data, for example, provide an excellent base

Cotterill
for a defensive expenditure approach to the anal-ysis of water contamination, or pollution incidentsin particular cities or for particular brands such asthe Benzine contamination of Perrier. Regardingthe former one could collect municipal water qual-ity ratings and use them plus public discussion ofthem as the stimulus variable. They may shift de-mand for bottled water. Similarly branded productrecall due to contamination and changing foodsafety perceptions may be analyzed.
In closing, I think a fundamental issue is publicaccess to IRI and Neilsen scanner data. To datepublic access has been very limited and usuallyquite expensive when approved. As this importantlane of the “information superhighway” becomesso advanced that food marketers can micromarketto millions of individual households, one has tonote the huge disparity in access by consumers,public researchers, and governmental oversightand operations staff vis a vis marketers in the pri-vate sector. Increasing access to scanner data neednot damage or compromise strategic moves byfirms, and it could improve the overall efficiencyand performance of the food marketing system be-havior. As this paper illustrates working at the in-terface of demand and industrial organizations the-ory may very well provide new theory and meth-ods that will advance both fields. At some juncturethis work may also make a significant contributionto the evolving quantitative focus of marketing re-search as taught in business schools.
References
Baker, J.B., and T.F. Bresnahan. The Gains from Merger orCollusion in Product-Differentiated Industries. Journal of
Industrial Economics 33(4) 1985:427-43.
Brooker, J.R., D.B. Eastwood, and M.D. Gray. The Impact ofAdvertising on Consumer Demand for Beef An Applica-tion of Scan Data. Journal of Food Products Marketing
2(1)1994:17-35.
Capps, O., Jr., and R.M. Nayga, Jr. Leanness and Conve-nience Dimensions of Beef Products: An Exploratory
Analysis Using Scanner Data. Bulletin 1963 (April), TheTexas Agricultural Experiment Station, Texas A&M Uni-versity, College Station, 1991.
Capps, O., Jr. Utilizing Scanner Data to Estimate Retail De-mand Functions for Meat Products. American Journal ofAgricultural Economics 71(3)1989:750-60.
Chalfant, J.A. A Globally FlexibIe, Almost Ideal Demand Sys-tem. Journal of Business and Economic Statistics
5: 19S7:233-42.
Chevalier, J.A. Capitol Structure and Product Market Compe-tition: An Empirical Study of Supermarket Pricing. Ph.D.diss., Harvard University, 1993.
_. Capitol Structure and Product Market Competition: AnEmpirical Study of Supermarket Pricing. (January) Har-vard University, 1994.
Scanner Data 139
Cooper, L.G., and M. Nakanishi. Market-Share Analysis. Bos-ton: Khrwer Academic Press, 1988.
Cotterill, R.W., and L.E. Hailer. Market Strategies in BrandedDairy Product Markets. In Competitive Strategy Analysis
for Agricultural Marketing Cooperatives, ed. R.W. Cot-terill, 99-144. Boulden Westview Press, 1994.
Deaton, A. and J. Muellbauer, Economics and Consumer Be-havior, Cambridge, England: Cambridge University Press,1980.
Deneckere, R., and C. Davidson. Incentives to Form Coalitionswith Bertrand Competition. Rand Journal of Economics
16(4) 1985:473-86.
Duvall, J.S. A Study of Horizontal and Vertical Competitive
ln~uence on Retail Price in the U.S. Soft Drink Industry.
M.S. thesis, University of Connecticut, 1993.Froeb, L.M., and G.J. Werden. Residual Demand Estimation
for Market Delineation: Complications and Limitations.Review of Industrial Organizarion 6(1)1991:33-48.
Green, R., and J.M, Alston. Elasticities in AIDS Models.American Journal of Agricultural Economics 70(2)1990:
442-445.
Greer, D.F. Industrial Organization and Public Policy. 3d ed.New York: Macmillan, 1992.
HaUer, L.E. Branded Product Pricing Strategies in the CottageCheese Market: Cooperative Versus Proprietary Firms. InCompetitive Strategy Analysis in the Food System, ed.R.W. Cotterill, 155-77. Bouldec Westview Press, 1993.
— Branded Product Pricing Strategies in the Catsup and
Cottage Chesse Industries. Ph.D. diss. University of Con-necticut, 1994a.
— . The Effects of the Beatnce-ConAgra Merger on Con-sumer Welfare. Presented at the NE165/WRCC-72 Re-search Conference, Interactions Between Public Policiesand Private Strategies in the Food Industries, June 26-8,Montreal, Quebec, 1994b.
Hausman, J.A., and W.E. Taylor. Panel Data and UnobservableIndividualEffects. Econometrics 49(6)1981: 1377-98.
Iskow, J., J. Kolodinsky, and D. Russo. Demand for SpecialtyProducts and their Mass Market Counterparts: The Case ofPure Maple Syrup. University of Vermont. Selected paperpresented at the 1994 Northeast Agricultural EconomicsAssociation annual meeting, 1994.
Langan, G., and R.W. Cotterill. Estimating Brand Level De-mand Elasticities and Measuring Market Power for Regu-lar Carbonated Soft Drinks. Paper presented at the Amer-ican Agricultural Economics Association annual meeting,August 7-10, San Diego, CA, 1994.
Liang, J .N. Price Reaction Functions and Conjectural Varia-tions: An Application to the Breakfast Cereal Industry.Review of Industrial Organization 4(2)1989:31-58.
McLaughlin, E., and W. Lesser. Experimental Price Variabil-
ity and Consumer Response: Tracking Potato Sales with
Scanners. Agricultural Staff Paper 86-28 (September),ComeU University, 1986.
Scherer, F.M., and D. Ross. Industrial Market Structure and
Economic Performance. Boston: Houghton Mifflin, 1990.Tellis, G.J. The Price Elasticity of Selective Demand: A Meta-
Analysis of Econometric Models of Sales. Journal of Mar-
keting Research (Nov)1988:331-41.
U.S. Department of Justice. 1992 Horizontal Merger Guide-
lines. Washington D.C. April 2, 1992.