scaling up responses to climate change -...
TRANSCRIPT

1 Jose Alberto Garibaldi – July 8th, 2007. Revised Draft.
Scaling Up Responses to Climate Change Technology and R&D Investment and an Environment for a Low Carbon Technology deployment.
Jose Alberto Garibaldi Santiago, July 8th, 2007.
2 Jose Alberto Garibaldi – July 8th, 2007. Revised Draft.
Introduction The climate change problem can also be framed as one of introducing available and almost commercially available low carbon technologies at the scale required in a limited time frame. This problem in turn requires mechanisms that can help both push and pull the available technologies to the markets, and create an environment where the required investments can take place and the technologies developed in time. To do so this paper examines both the current status of R&D investment, what combinations of technologies can deliver the required reductions, and what role R&D support, policies, carbon markets and financial instruments in creative an environment conducive to the level of required R&D and low carbon technology introduction. The paper is divided in three sections, examining the size of the challenge, the current situation and what is required to resolve the problems such a situation implies. Thus, the first section presents the wedges approach to climate change mitigation as developed by Robert Socolow and Stephen Pacala, and their potential combinations as analyzed by the IEA’s technology prospective. The second section examines the current expenditure trends in low carbon R&D, with an emphasis on Energy and transport, and the role the innovation cycle and the characteristics of the related energy markets have had on their decreasing trends. The third section examines what can be done to revert this decreasing trend and facilitate the creation of an environment which will both help expand low carbon R&D and market introduction of low carbon technologies in both developed and developing countries. Conclusions summarize main findings. Section I: The Challenge The scale of the climate problem underlines the urgency of a technology perspective on climate change, and its multiple ramifications in policy, finance and investment decisions. In fact, if seen from a purely technology viewpoint, no single “silver bullet” technology –say nuclear power or solar energy- that would single-handedly supply global energy demand in a carbon constrained world has been found that could produce a convincing solution. A 2004 paper by two Princeton researchers, Stephen Pacala and Robert Socolow, can however help start framing the problem. This paper started a trend on how to disaggregate the problem to address the underlying technology needs. It showed graphically how a gamut of existing technological options could be used to reduce GHG levels sufficient to avoid dangerous climate change effects. Their paper illustrated this point by disaggregating reductions down into manageable large-scale “wedges,” each provided by a different set of technologies. As the simple figure below illustrates, the concept compares a business as usual (BAU) projection of GHG emissions into the future with the desired trajectory of stable global emissions through the year 2050.

3 Jose Alberto Garibaldi – July 8th, 2007. Revised Draft.
Figure I The Mitigation Wedges
The “stabilization triangle” above provides a way of visualizing the mitigation required in the coming half century to avoid doubling the pre-industrial CO2 concentration. Socolow and Pacala argue that the triangle is bounded by 1) the Year 2054; 2) a “flat trajectory”: zero emissions growth (ZEG) for 50 years; 3) a “ramp trajectory”: linear growth leading to a doubling of global CO2-equivalent emissions in 50 years. The flat trajectory approximates a path to stabilization below doubling, but note that the emissions rate must fall in the second half of this century. The ramp trajectory approximates Business As Usual – a world that pays no deliberate attention to global carbon. Thus, achieving stabilization below doubling requires, approximately, halving anticipated mid-century emissions. Pacala and Socolow presented 15 such options to do so, with each wedge capable of potentially reducing one gigaton of carbon per year. They argued that, from a purely technological point of view, implementing only 7 of these would be enough to avoid the worst climate change effects. In all cases, the crux of the matter was technology deployment at the scale needed and within the required time frame. As they argue, most of the necessary wedge technologies are already deployed somewhere in the world at commercial scale. No fundamental breakthroughs are needed. Thus, wedges would need to be implemented using technologies that were either in commercial use today or at a development stage that made them viable for a relatively prompt large scale implementation –provided R&D support would insure they were ready in time. Radically new “silver bullet” technologies –nuclear fusion, for instance- might eventually solve the problem, but are outside the realm of the possible in the time and scale needed, and unlikely to make a meaningful impact in the required time frame. However, every wedge is hard to accomplish, because huge scale-up is required, and scale-up introduces environmental and social problems not present at limited scale. Some technologies are already being deployed at scale (natural gas to replace coal power), others are at a relatively early stage of development but potentially close to commercialization (hydrogen capture from coal with

4 Jose Alberto Garibaldi – July 8th, 2007. Revised Draft.
carbon capture and storage) while still others might operate currently within niche markets rather than at scale (such as solar photovoltaics). The best wedges for one country may not be the best for another. Such an approach is useful because it is a purposeful simplification of a complex problem, while stressing the need of deploying broadly-defined but well-known technologies on a huge scale. And more importantly, they leave aside three important factors. First, the potential combination of technologies required to achieve the reductions. Costs and opportunities for each technology differ, and not all wedges need to contribute equally to the problem: some might make a more significant contribution than others. Second, the crucial governance and policy considerations surrounding their implementation are left behind. Policies at a global or local level that apply a uniform cost of carbon will not only propel the implementation of wedge technologies, but serve as an incentive for the deployment of increased technological efficiencies, from shifts in the equipments used, to the deployment of new technologies. And third, technologies do not operate in isolation from human behavior. Their implementation requires an accompanying human practice to make them viable. This is crucial both for the large scale introduction of technologies, from their social acceptance, the lifestyle changes they will imply, and those of lower carbon lifestyles which will nevertheless be required to achieve a lower carbon economy. I.1 Some potential technology combinations The International Energy Agency (IEA) has done some work which might help address the first of these issues. As a result of the Gleneagles plan of action, the G8 asked the IEA to explore technology scenarios for a lower carbon future. The five Accelerated Technology (ACT) scenarios in the resulting Energy Technology Perspectives study demonstrated that combinations of existing or well under development technologies could indeed potentially return global energy-related CO2 emissions towards today’s level by 2050. These scenarios explored combinations of energy technologies and practices aimed at reducing energy demand and emissions, and diversifying energy sources. As in the wedge approach, they focused on technologies existing today or likely to become commercially available in the next two decades. Box 1: The Key assumptions – Policies and Incentives The IEA scenario results help illustrate the crucial role of policies and measures aimed at overcoming barriers to technology adoption, and assume significant increasingly important public and the private sectors roles in creating and disseminating new energy technologies. In fact, to illustrate the contrast, a scenario (the TECH Plus) with more optimistic assumptions about technological barriers overcoming, is also considered. The increased uptake of cleaner and more efficient energy technologies in the ACT

5 Jose Alberto Garibaldi – July 8th, 2007. Revised Draft.
scenarios is driven by two important considerations: 1. Carbon Pricing: Global and national policies and measures are assumed to be put in place leading to the adoption of a carbon price of US$25/CO2ton level by 2030 in all countries, including developing countries. The incentives could take many forms – such as regulation, pricing, tax breaks, voluntary programmes, subsidies, trading schemes or any form of carbon finance. 2. Policy deployment: This assumes countries put in place a suite of policies to overcome deployment barriers, including the following:
• Increased support for the research and development (R&D) of energy technologies that face technical challenges and need to reduce costs before they become commercially viable.
• Demonstration programs for energy technologies that need to prove they can work on a commercial scale and under relevant operating conditions.
• Deployment programs for energy technologies which are not yet cost-competitive, but whose costs could be reduced through learning-by-doing. These programs would be phased out when the technology becomes cost-competitive.
• Policy instruments to overcome commercialisation barriers that are not primarily economic. These include enabling standards and other regulations, labeling schemes, information campaigns, and energy auditing. These measures can play an important role in increasing the uptake of energy efficient technologies in the buildings and transport sectors, as well as in non-energy intensive industry branches where energy costs are low compared to other production costs.
These scenarios assume the same set of core efforts and policies, but vary in their different rates of progress in overcoming barriers, achieving cost reductions and winning public acceptance for a technology. Different assumptions were made on (1) the progress in cost reductions for renewable power generation technologies; (2) constraints on the development of nuclear power plants; (3) the risk that CO2 capture and storage (CCS) technologies will not be commercialised by 2050; and (4) the effectiveness of policies to increase the adoption of energy efficient end-use technologies. In all, robust global economic growth is assumed, at a rate of 2.9% per year between 2003 and 2050, with per capita income growing 2% per year on average (ranging from 1% in the middle east, to 4.3% in China). The main assumptions of each scenario are provided below:

6 Jose Alberto Garibaldi – July 8th, 2007. Revised Draft.
Figure II Scenario Assumptions
Source IEA 2006. I.2 The Scenario Changes The scenarios develop substantial changes through strong energy efficiency gains in transport, industry and buildings; substantial decarbonisation of electricity supply as the power generation mix shifts towards nuclear power, renewables, natural gas, and coal with CO2 capture and storage (CCS); and through the increased use of biofuels for road transport. Despite these changes, fossil fuels still supply between 66% and 71% of the world’s energy in 2050. Consequently, demand for conventional fuels -oil, coal (except in the scenario where CCS is not available) and natural gas- are all greater in 2050 than today. Investment in cleaner technologies for conventional energy sources thus remains essential. Improved energy efficiency is a key driver: it accounts for between 31% and 53% of the CO2 emissions reductions; CO2 capture and storage for between 20% and 28% (when the ACT scenario assumes it as available); fuel switching for between 11% and 16%; renewables in power generation account for between 5% and 16%; nuclear for between 2% and 10%; biofuels in transport for about 6%; and other options for between 1% and 3%. According to the IEA, these scenarios show how more energy-efficient end-use technologies can reduce total global energy consumption by 24% by 2050 compared to the ACT Baseline. Demand for electricity is reduced by one-third below the baseline level in 2050, halving its growth between 2003 and 2050. Oil savings equal more than half of today’s global oil consumption, offsetting 56% of the growth in oil product demand expected in the Baseline Scenario. Growth in oil demand is moderated by improved efficiency, the increased use of biofuels in the transport sector, and fuel switching in buildings and industry sectors. The TECH Plus scenario, based on more optimistic assumptions on the rate of progress for renewable and nuclear electricity generation technologies, for advanced biofuels, and for hydrogen fuel cells, results in CO2 emissions falling by about 16% below current

7 Jose Alberto Garibaldi – July 8th, 2007. Revised Draft.
levels in 2050. Hydrogen and biofuels provide 34% of total final transport energy demand in 2050, returning primary oil demand in 2050 to about today’s level. Global CO2 emissions resulting from the scenarios are summarised below.
Figure III Global Emissions by Scenario
Source IEA 2006. The distribution of gains by areas and technologies is summarized below for the ACT Map scenario. This includes a series of realistic assumptions considering the state of the art on different technologies and historic experience with technological progress (although, as the technology prospective argues, significant uncertainties remain in the four key ACT areas). The other scenarios are mapped against this one in terms of variations on renewables, nuclear, CCS, and efficiency.

8 Jose Alberto Garibaldi – July 8th, 2007. Revised Draft.
Figure IV The ACT MAP Scenario
Source, IEA, 2006. I.3 The Abatement Costs The Stern review presents calculations undertaken by Dennis Anderson to illustrate how fossil-fuel (energy) emissions could be cut from 24 GtCO
2e/year in 2002 to 18
GtCO2e/year in 2050 -and how much this would cost. Together with the non-fossil fuel
savings derived from avoided deforestation and other sectors, this would be consistent with a 550ppm CO
2e stabilisation trajectory in 2050.
Anderson’s study leads to an upward bias in the estimated costs. It takes the Pacala – Socolow approach of considering existing technologies, and does not consider there might other cheaper options, which might appear along the way with appropriate R&D. Anderson assumes that energy-related emissions first rise and then are reduced to 18 GtCO
2/year through a combination of improvements in energy efficiency and switching to
less emission-intensive technologies. The calculation looks only at fossil fuel related CO2
emissions, and excludes possible knock-on effects on non-fossil fuel emissions. His results show that the global cost of reducing total GHG emissions to three quarters of current levels (consistent with 550ppm CO
2e stabilisation trajectory) could be estimated
at around $1 trillion in 2050 or 1% of GDP in that year, with a range of –1.0% to 3.5% depending on the assumptions made. Anderson’s central case estimate of the total cost of reducing fossil fuel emissions to around 18 GtCO
2e/year (compared to 24 GtCO
2/year
in 2002) is estimated at $930bn, or less than 1% of GDP in 2050. This is associated with a saving of 43 GtCO
2 of fossil fuel emissions relative to baseline, at an average
abatement cost of $22/tCO2/year in 2050. These costs vary according to the underlying
assumptions. Bringing global CO2 emission levels in 2050 back to current levels, as illustrated by the ACT scenarios, could offer a pathway to eventually stabilise CO2 concentrations in the atmosphere. However, the trend of declining CO2 emissions achieved by 2050 would

9 Jose Alberto Garibaldi – July 8th, 2007. Revised Draft.
have to continue subsequently during the century to lock in the gains. In approximate terms, the ACT scenarios show how electricity generation can be substantially decarbonised by 2050. Decarbonising transport, a more difficult endeavor, would need to be achieved in the following decades. The more radical changes in the TECH Plus scenario could be regarded as providing an indication of the trends that may develop more strongly and perhaps with more certainty, in the second half of this century. Section II: The Current Situation Achieving these results will require both a significant amount of deployment policies, as well as a significant increase in innovation to ensure that technologies close to entering into the markets can actually enter them and provide the role they need to in delivering the required cuts. As policies can affect both the deployment of technologies and facilitate the processes that lead to innovation, the innovation cycle will be dealt with first, and the policy setting later. Innovation is crucial in reducing costs of technologies. It cuts across markets, the public and private sectors, as well as finance and technological change. Understanding this process can help better understand what policies may be required to encourage firms to deliver the scale of low-emission technologies required. II.1 The Innovation cycle Innovation allows to successfully use of ideas and practices previously unavailable. They can play an incremental role as partial improvements of existing products or practices add up; or radical, when inventions lead to departures from previous practices or technologies; lead to changes in the way systems are used, or throughout the economy (as with IT technology, for instance). It can include both innovation in physical capital (as with hybrid cars, for instance), as well as innovation in social practices (as with bus rapid transit systems). It can take place both in the markets and the public sector. In most markets, new products can deliver significant profits if they take off, driving investment in the early stages of the cycle. The resulting profits, coupled with the risk of loosing out in an existing or potentially new market, put pressure on firms to keep up, supporting competition. Innovation is typically a cumulative process that builds on existing progress, generating in the meanwhile competitive advantages. As competition increases, and more firms move closer to the existing technological frontier of incumbents, the expected future profits of the incumbents diminish unless they innovate further. Grubb (2004) presents an interesting version of the ‘stages’ model of innovation. It broadens the invention stage into basic R&D, applied R&D and demonstration, as shown in the subsequent figure. The term R&D can be used to also cover the demonstration stage, while the commercialisation and market accumulation phases represent early deployment in the market place, where high initial cost or other factors may mean quite low levels of uptake. While as with most models, this fails to capture many complexities of the innovation process, it is nevertheless useful for characterizing stages of development. In particular, it should be noted both that the transition between stages is not automatic (i.e. and many products fail at each stage of development) and there are also further linkages between them, as further progress in basic and applied R&D affect products already in the market, while subsequent learning also has a R&D impact.

10 Jose Alberto Garibaldi – July 8th, 2007. Revised Draft.
Figure V
The Innovation Cycle
Source: Grubb 2004. The graph refers to both ‘push’ policies –where government supports innovation for instance through grants and subsidies - as well as ‘pull’ policies –where markets provide the incentives required for the technology moving ahead to successfully reach consumers. II.2 The Innovation gap: decreasing investment A consequence of this approach is that it stresses the fact that innovation varies radically across sectors. On information technology and pharmaceuticals, for instance, there are high degrees of innovation, with private sector financing rapid technological change, in amounts equal to around 10-20% sector turnover (Neuhoff 2005). In the power sector the reverse is true: the same technologies have dominated for almost a century, while private R&D has fallen sharply with privatization, and it is currently around 0.4% of turnover (Margolis and Kammen, 1999). Consequently, private R&D has followed a decreasing trend in energy. The significant increase in energy prices after the 1970s oil crisis went hand in hand with and expansion of R&D expenditures. The collapse in prices in the 1980s led to a relaxation of R&D initiatives and support. Current price increases have so far not translated into a subsequent expansion of R&D. A number of reasons seem to be behind this. The liberalization of the energy markets in the 1990 and increased competition shifted the focus away from long term R&D towards the utilization of existing plants and technologies, particularly on combined heat and power or natural gas, rather than on R&D.1 Likewise, another important source of R&D expenditures in the 1970s -nuclear R&D- has decreased dramatically, due both to public concerns about
1 Nevetheless, in many countries the latter become obsolete with time or operate at below efficiency levels, as utilities struggle to support supply while not having resources to replace infrastructure.

11 Jose Alberto Garibaldi – July 8th, 2007. Revised Draft.
safety and waste disposal and cost overruns which minimized their appeals to voters and policy makers. In the U.S., federal funding for energy research has been steadily falling since 1980, while energy R&D federal funding has hovered between roughly $1 billion and $4 billion for the past twenty years, compared to recent expenditures.2 R&D intensity there (R&D as a share of total turnover) of the power sector was 0.5% compared to 3.3% in the car industry, 8% in the electronics industry and 15% in the pharmaceutical sector. Likewise, a survey of eleven of the biggest energy R&D funders shows that energy R&D spending worldwide has indeed stagnated, while private sector spending on energy R&D has also fallen.3 In fact, total government expenditures of IEA member countries on energy R&D decreased from some USD 9.6 billion at 2005 prices and exchange rates in 1992 to USD 8.6 billion in 1998. 4 This decline represents a less dramatic continuation of the trend already established in the 1980s. From 1998, government expenditures have slightly recovered and were estimated to be USD 9.5 billion in 2005. As the figure below shows, government budgets for energy R&D in Europe decreased by 28% from 1992 to 2005, while the IEA North America budgets decreased from 1992 to 1998 and then rose again to the same level as in 1992. Nevertheless, the budget for the Pacific region has increased over the period. In fact, between 1992 and 2005, two countries (Japan and the United States) accounted for more than 70% of total R&D government budgets in IEA countries. In 1990, the shares of total IEA spending for these two countries were nearly the same, with 29% for the United States and 34% for Japan, while most European countries’ R&D budgets have significantly decreased in real terms in nuclear research (fusion and fission) and fossil fuel extraction and transformation technologies.
2 WRI 2006. 3 Ibid, pp. 4. 4 IEA 2006. Their analysis is largely based on the data collected by the IEA statistical office from the governments of member countries on public spending in energy R&D. Considerations on quantitative trends are based on a smaller data set than the one actually available to the IEA because the government budget information is not available for all IEA countries for all years considered (1992- 2005). In order to have a consistent data set, data from the following countries was used: North America: United States and Canada. Europe: Austria, Belgium, Denmark, Finland, France, Germany, Italy, the Netherlands, Norway, Portugal, Spain, Sweden, Switzerland, the United Kingdom and Turkey. Pacific: Japan, Australia and New Zealand.

12 Jose Alberto Garibaldi – July 8th, 2007. Revised Draft.
Figure VI
Government Budgets R&D - OECD
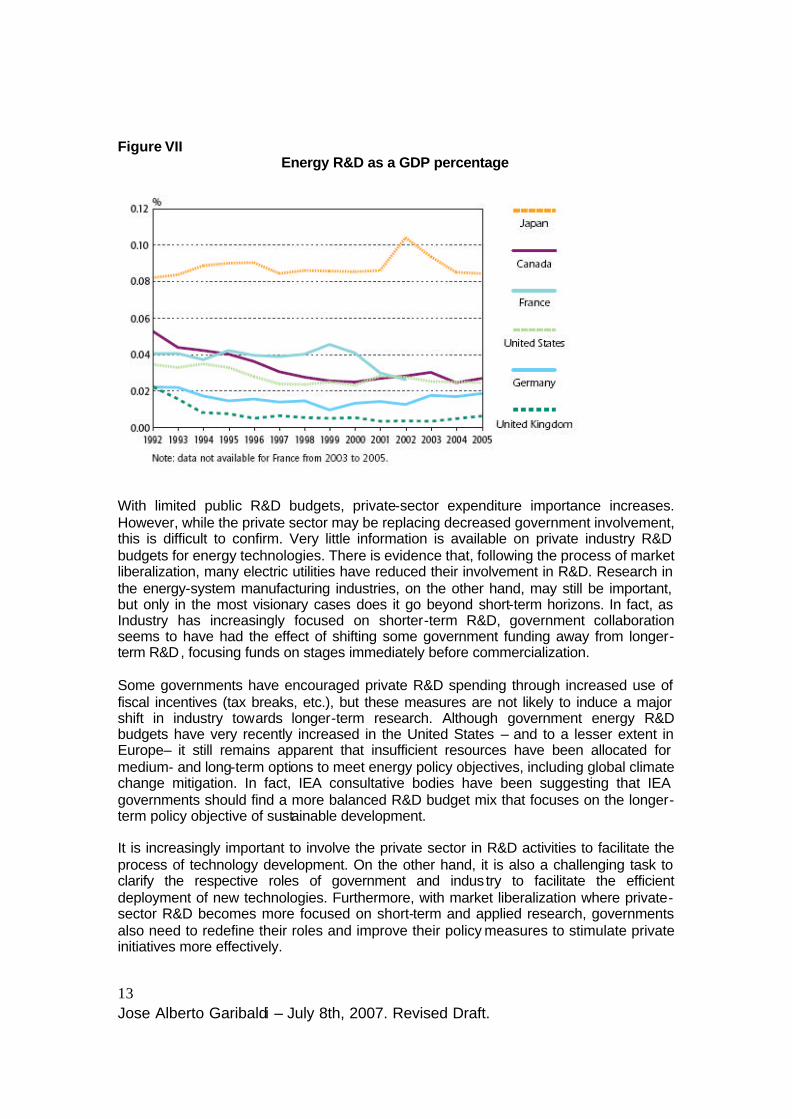
If inflation is taken into account, government expenditures for energy R&D have declined even more. The development in energy R&D budgets as a percentage of GDP for selected countries is illustrated in the graph below. Only Japan has maintained a relatively high level, whereas the R&D budget relative to GDP has declined in the US, Canada and particularly in several European countries. In Japan, energy R&D was 0.08% of GDP in 2005, but in most other IEA countries it was below 0.03%. Several IEA countries have signed up to the Barcelona Convention with the aim of increasing total public and private research and development budgets to 3% of GDP.
13 Jose Alberto Garibaldi – July 8th, 2007. Revised Draft.
Figure VII Energy R&D as a GDP percentage
With limited public R&D budgets, private-sector expenditure importance increases. However, while the private sector may be replacing decreased government involvement, this is difficult to confirm. Very little information is available on private industry R&D budgets for energy technologies. There is evidence that, following the process of market liberalization, many electric utilities have reduced their involvement in R&D. Research in the energy-system manufacturing industries, on the other hand, may still be important, but only in the most visionary cases does it go beyond short-term horizons. In fact, as Industry has increasingly focused on shorter-term R&D, government collaboration seems to have had the effect of shifting some government funding away from longer-term R&D, focusing funds on stages immediately before commercialization. Some governments have encouraged private R&D spending through increased use of fiscal incentives (tax breaks, etc.), but these measures are not likely to induce a major shift in industry towards longer-term research. Although government energy R&D budgets have very recently increased in the United States – and to a lesser extent in Europe– it still remains apparent that insufficient resources have been allocated for medium- and long-term options to meet energy policy objectives, including global climate change mitigation. In fact, IEA consultative bodies have been suggesting that IEA governments should find a more balanced R&D budget mix that focuses on the longer-term policy objective of sustainable development. It is increasingly important to involve the private sector in R&D activities to facilitate the process of technology development. On the other hand, it is also a challenging task to clarify the respective roles of government and indus try to facilitate the efficient deployment of new technologies. Furthermore, with market liberalization where private-sector R&D becomes more focused on short-term and applied research, governments also need to redefine their roles and improve their policy measures to stimulate private initiatives more effectively.

14 Jose Alberto Garibaldi – July 8th, 2007. Revised Draft.
In countries where there is a public / private markets division, R&D is most effective when funded by the private sector in response to clear price signals for future technology markets. In such a context, government R&D spending is not always smart spending, and could potentially be captured by vested interests, confined to technologies still unlikely to produce commercial opportunity. However, private sector funding alone is unlikely to be wholly adequate to driving a clean technology transformation. Well-designed government R&D efforts can bring a longer time horizon and investigate more risky options with the potential to generate breakthrough technologies. There is a potential role for government involvement where the lessons learned from R&D will apply beyond the private sector carrying out the research, and for research with long time horizons. Certainly in producing the technologies for deeper emission cuts in the second half of this century government research will be important. Even in some nearer-term wedges R&D may yet produce unforeseen technology breakthroughs. II.3 The Innovation gap: reasons for a decrease There are various inherent reasons for such a low innovation rate. Processing large amounts of energy requires large quantities of capital deployed in long periods of time –increasing risk and deterring finance. Stages in the innovation chain take a decade or more to develop, while diffusion is slow. Competition focuses mostly on price and efficiency, rather than on product differentiation. Niches are uncommon, albeit not inexistent: areas where stable output or large secure amounts are essential –such as in steel, aluminium or cement- where competition can develop around the quality of the end product being provided. These however, while important, they are not that common. In fact, in the energy sector there is a significant dependence on tacit knowledge and incremental innovations. These are advanced as the operation of existing technologies provides insights into gains in efficiency and areas where further R&D might be of interest. As a result, it is not unusual that these technologies take several decades before they become available. The costs of this learning need to be recovered somehow. When early stage technologies can be sold at a high price, early entrants have an incentive to deploy innovative technologies and recover costs through extraordinary market gains, as “early adopters” gain competitive advantages through their buying and utilizing the then exclusive technology–the IT or pharmaceutic industry cases are a case in point. Subsequent economies of scale, learning and network allow prices to be reduced and facilitate a massive introduction to the market. Indus try then displays a frequent innovation pattern. However, when there are no possibilities of recovering this cost, the firm introducing the innovation is forced to foot the bill –selling the product at a loss for a period of time. If the cost of developing the technology is such that it requires a long time to be recovered, the company might not afford to subsidize the introduction of this technology on its own, and/or might result in it collapsing, leaving -or deciding not entering- that market. Moreover, if there are no innovative ways to publicly or privately finance a promising technology through the long period it might take to enter into this homogeneous, highly regulated market, private capital markets might fail to finance it.

15 Jose Alberto Garibaldi – July 8th, 2007. Revised Draft.
The problem is compounded because the high capital energy sector operates in a risk averse and –in the power sector- highly regulated market; while its end product –electricity or other energy products- tends to either be homogenous or potentially transformable from one source into another, but with a relatively high capital intensity and cost. The scarcity of market niches conspires against using the potential gains of tapping these markets to finance R&D and innovation, while the regulation and high capital costs dampen innovation and increase risk. Furthermore, the centralized character of generation and the generalized use of grid networks can frequently be at odds with innovation. Not only such a centralized character can on occasions translate into a small number of players in a given market –and thus, diminishing competition pressure and innovation incentives- , but crucially, any technology which does not fit into the accompanying centralized grid pattern (potentially any based on a more distributed generation character) might face an inherent bias against it. If the energy source is intermittent or dispersed through many sites –as it frequently is in the case of renewable energy- the grid might face problems of stability, physical difficulties for connecting them, or increased costs for transporting it from remote and previously inaccessible locations. As a result, the path of innovation will be limited to include those which fit into the existing infrastructure and market characteristics. Las but not least, the status quo is frequently supported by massive subsidies. Calculations made by REN21 argue that fossil fuels are subsidized to the rate of 20-30US$ billion per year n OECD countries, and 150 – 200 billion globally. The IEA calculates world energy subsidies at 250 US$ billion annually globally, out of which around 90 were for oil. These subsidies not only dampen any attempt to internalize carbon and environmental externalities, but also reduce incentives to innovate: why do so if available conventional technologies are already several subsidies ahead? Climate technology might need then to address radical innovation in an areas where innovation might face inherent difficulties of a significant magnitude. Box 2: Transport The transport sector is one of the fastest emission growing sectors in the world, propelled by both continual expansion of car transport and the fast growth of the aviation industry. It is currently around 14% of the total global emissions. As in the energy sector, the dominant technology has been around for several decades, with lock-in effects derived from continuous improvements derived from learning and doing, using existing technologies, the continuous improvement in efficiency of the cars, and the relative bias the existence of a large infrastructure for the provision of gasoline for cars and other vehicles. However, unlike the power sector, there are also a number of market forces operating towards cleaner, lower carbon vehicles, from high taxes in most OECD countries, to niche markets for specific vehicles, which might propel gains in efficiency. It is likely to expect that such gains might continue in the future, a result of the need to increase fuel savings –a consequence of taxes- and/or by government regulation. Newer, already existing, technologies are increasingly being used. Additional policies, such a congestion pricing and/or intelligent traffic management, might also contribute to the reduction. For this shift towards more advanced solutions –including extensive use

16 Jose Alberto Garibaldi – July 8th, 2007. Revised Draft.
of fuel cells and hydrogen- they would require a significant government policy intervention and important social behavioral changes. In Brazil policies to encourage biofuels over the past 30 years through regulation, duty incentives and production subsidies have led to biofuels now accounting for 13% of total road fuel consumption, compared with a 3% worldwide average in 2004. Other countries are now introducing policies to increase the level of biofuels in their fuel mix. Box 16.1 shows how some governments are already acting to create conditions for hydrogen technologies to be used. Making hydrogen fuel cell cars commercial is likely to require further breakthroughs in fundamental science, which may be too large to be delivered by a single company, and are likely to be subject to knowledge spillovers. II.4 The technological “valley of death”, or how to enter into the market. While the amounts already being deployed to support new technologies –particularly within the public sector can nevertheless be significative, it also faces obstacles derived to the way its applied, its articulation with the private sector, and the need to entry into new markets. Moving from public funded demonstration to commercial viability is a particular difficulty, resulting in what Edwards and Murphy (2003) have called technology’s ‘valley of death’. This arises from different perspectives from public and private sector values, requirements and goals; the cash flow associated with the projects; and the private sector perspectives on risk. Frequently, neither the public nor the private sector consider it their duty to finance the transition stage of commercialization, creating a chasm between both where new technologies frequently fail. Firms face cash constraints in this stage: innovators might have access to public funds as technology is created; however, in between this stage and its early commercialization, firms face high cash demands and low ability to raise it. The public sector sees its commitment reduced to the early stages, while venture capitalists typically prefer to finance the venture when solid initial sales have been established –but rarely before. As a consequence, entrepreneurs face a dearth of funding in the midst of the transition. Finally, the public sector focuses on diminishing technical risks, but there are others: innovators need to create new products, with multiple prototypes; most innovators have strong technical and scientific skills, but have little or any management teams or experience –and need to introduce new products into immature markets; and finally, innovators usually have more information and expertise about their projects than those funding them, increased the risk the latter perceive. Section III: What is Required Overall, an ambitious and sustained increase in the global scale of effort on technology development is required if technologies are to be delivered within the timescales required. While the challenge is also technological, it does not restrict itself to purley technological options. Thus, in the first place, the continuous decline in global public and private sector R&D spending should be reversed. Deployment incentives will have to increase two to five-fold worldwide in order to support the scale of uptake required to
17 Jose Alberto Garibaldi – July 8th, 2007. Revised Draft.
drive cost reductions in technologies and, with the carbon price, make them competitive with existing fossil fuel options. However, a substantial policy shift will be required to ensure the required technologies will enter into the markets in both developed and developing countries, that markets expand to achieve the scale required -so cost reductions and economies of scale develop to the extent needed- and infrastructure and institutions to enable low carbon choices are available. This will need to operate side by side with financial mechanisms that diminish the gap between public and private sector support within the innovation cycle, facilitate low carbon investment and carbon finance linkages, and support low carbon consumer choices. Finally, substantive lifestyle changes will be required, both to adapt to the scale of the technologies to be deployed, as well as to develop lifestyle changes which either avoid a high carbon aspect, or deliver a lower carbon footprint. These must be deployed systematically, so that one builds on the other. Thus, for instance, it is unlikely that carbon finance on its own will deliver the required technologies. Likewise, support policies without carbon pricing will loose an important incentive. The absence of adequate financial instruments will prevent the investments taking place. Thus, strategic deployment of all this components will be central to achieve the scale required. In what follows, four related strands will be examined: the scale in which innovation expenditures need to be expanded, and the roles of carbon markets and pricing, policies, and financial instruments in supporting low carbon technologies. III.1 Increase overall Innovation Expenditures The Stern review estimated existing deployment support for renewables, biofuels and nuclear energy at $33 billion each year. Likewise, the IEA’s Energy Technology Perspectives quoted above also looks at the impact of policies to increase the rate of technological development. It assumes that $720 billion of investment in deployment support occurs over the next two to three decades. As mentioned before, this estimate is on top of an assumed carbon price (whether through tax, trading or implicitly in regulation) of $25 per tonne of CO
2. If the IEA figure is assumed to be additional to the
existing effort, it suggests an increase of deployment incentives of between 73% and 109%, depending on whether this increase is spread over two or three decades. The IEA Technological prospective calculations include estimates of the level of deployment incentives required to encourage sufficient deployment of new technologies (consistent with a 550ppm CO
2e stabilisation level). The central estimates from that work
are that the level of support required will have to increase deployment incentives by 176% in 2015 and 393% in 2025. These estimates are additional to an assumed a carbon price at a level of $25 per ton of CO
2.
At this price, abatement options are forecast to become cost effective by 2075 -so the level of support tails off to zero by then. However, if by any reason policies lead to a much higher price before the technologies are cost effective then less support will be required. Conversely, if no carbon price exists, the required support would have to increase (in limited amounts initially but by much larger amounts in the longer term). While most of this cost might end up being passed to consumers, firms may be prepared to incur a proportion of this learning cost in order to gain from a first entry and competitive advantage.

18 Jose Alberto Garibaldi – July 8th, 2007. Revised Draft.
In the studies quoted, the required support to develop abatement technologies depends on the carbon price and the rate of technological progress, both of which are uncertain variables. However, it is clear from the magnitude of the numbers involved that the level of support should increase in the decades to come - especially if for any reasons carbon pricing is not in the picture in future regimes. Based on the numbers above, an increase of 2-5 times current levels over the next 20 years should help encourage the requisite levels of deployment. As a degree of uncertainty is involved, the required amount would need to be evaluated regularly as uncertainties clear. More specifically, the Stern Review (2006) and Dennis Anderson (2006), for instance, argue that a 20 year international effort to develop low carbon technology on a significant scale could aggregate perhaps 1-2 GW of electricity production per year, requiring investments in the region of $6-10 billion per year. It would focus on technologies with significant potential for reducing greenhouse as well as in reducing emissions where the nature of the costs and benefits of developing the technology benefit from action at an international scale. Around 50% of this would be leveraged through private investment, flexible mechanisms, including the CDM and evolved version of it, and sales of the actual energy produced. Higher leverage rates would be achievable, as the these activities progressed and as conversion efficiencies and confidence in the industry improved. A key consideration would include involving scientists and engineers from developing regions which would deliver significant benefits. The positive externalities would be substantial. The incremental costs of present of current investments in low carbon technologies (the cost beyond market dominant alternatives) in OECD countries amounts to around $85 per tonne of CO2 abated. However, as costs decline through learning, scale and efficiency gains, lower values may be reached, becoming as low as $45 per tonne in 20 years time and $25 or less by 2050. National and international R&D P&M, plus incentives provided by the more familiar instruments for encouraging innovation, could results in the level of reductions required to be achieved, and –as Stern argues- result in worldwide benefits (as measured by consumers’ plus producers’ surpluses) of over $80 billion per year per gigatonne of abatement Scale is not the only consideration: support must be structured to encourage innovation at low costs. An investment portfolio approach is required, both to increase possibilities of advancing technologies which might prove cheapest in the end, and counter potential constraints on individual technologies, event if they look promising today. In fact, the technologies that might end up being the cheapest in the long run might not be those which are currently the cheapest now. Capturing this effect will require reorienting public support towards technologies that could now be further from widespread diffusion now. While some countries are already offering significant support for new technologies, globally this support is still patchy. Likewise, significant increases in public energy R&D and deployment support combined with carbon pricing should all help reverse the current downward trend and encourage an upswing in private R&D levels. This is not just about the total level of support; how this money is spent is crucial. While rigorous and regular expenditure assessments can ensure they are maintained at an appropriate level, spreading funding across a wide

19 Jose Alberto Garibaldi – July 8th, 2007. Revised Draft.
range of ideas can help provide stability to researchers while still providing healthy competition. Such levels of support do represent significant sums. However, these are modest if compared with overall levels of investment in energy supply infrastructure (or as the IEA calculates, $20 trillion up to 2030) or even estimates of current levels of fossil-fuel subsidy. III.2 Enhanced R&D and innovation leasdership from the public sector Governments do have a role to play in sectors where the market under-provides new technologies. This requires governments ensuring the private sector invests in developing and deploying low-emission technologies by creating a value for greenhouse gas emissions through pricing the externality. Additionally, governments provide a significant proportion of R&D funds, and create policy frameworks for deployment support that can help expand markets. The decreasing slope of learning R&D curves, tries to illustrate the fact that increased deployment is linked with cost reductions, suggesting that further deployment will reduce the cost of low-emission technologies. While there is a question of causation -cost reductions may lead to greater deployment, rather than viceversa, so attempts to force the reverse may lead to disappointing learning rates- nevertheless, it is a fact that most generation technologies benefited from both extensive and prolonged public support and private markets. This highlights the spillovers that occur between sectors and the need to avoid too narrow an R&D focus. From the early stages of the Cold War, the Atomic Energy Commission in the US, while overseeing the development of nuclear weapons, also promoted civilian nuclear power. Likewise, basic R&D for gas turbine technology was carried out for military jet engines, while subsequent improvements came from untapped innovations in jet engine technology from decades of experience in civil aviation. Competitive costs also were helped by low capital costs, reliability, modularity and lower pollution levels. Similarly, the first PV cells were designed for the space programme in the late 1950s. They were very expensive and converted less than 2% of the solar energy to electricity. Four decades of steady development of the space programme saw efficiency rising to nearly 25% of the solar energy in laboratories, and costs of commercial cells falling by orders of magnitude. 5In the case of wind, The oil shocks led to further investment and deployment of a technology already available for a long time. The introduction ofr support policies made these increasingly attractive particularly in Denmark (where a 30% capital tax break (1979-1989) mandated electricity prices (85% of retail) and a 10% target in 1981 led to considerable deployment) and California where public support led to extensive deployment in the 1980s. Recent renewable support programmes and technological
5 The need for storage or ancillary power sources have held the technology back but there have been some niche markets in remote locations and, opportunities to reduce peak demand in locations where solar peaks and demand peaks coincide.

20 Jose Alberto Garibaldi – July 8th, 2007. Revised Draft.
progress have encouraged an average annual growth rate of over 28 % over the past ten years. The public sector must play an expanded role in funding skills and basic knowledge At the pure science side, knowledge created works almost as a ‘public good’; on the applied end of R&D, private research is likely to be predominant -though there still may be a role for some public funding. However, R&D funding must avoid volatility to enable the research base to thrive. Funding cycles with acute variations between years –as have been common in energy- increase difficulties of laboratories to attract, develop, and maintain human capital, while reduce investors’ confidence in private R&D returns. A stable long term pattern of research can help create and environment which can facilitate the advance of technologies. Arms-length organisations and expert panels such as research-funding bodies may be best placed to direct funding to individual projects. This can help overcome the information asymmetry policymakers face vis a vis the expertise of the researchers when facing a challenge in selecting suitable projects. Three types of funding are required for university research funding. • Basic research time and resources for academic staff to pursue research. • Research programs that directs funding towards important areas. • Funding to encourage the transfer of knowledge. Information dissemination encourages progress to be applied and built on by other researchers and industry and ensures that it not be unnecessarily duplicated elsewhere. Research should cover a broad base and not just focus on what are currently considered key technologies, including basic science and some funding to research the more innovative ideas45 to address climate change. Historical examples of technological progress when the research was not directed towards specific economic highlight the importance of open-ended problem specification. Increases in energy R&D can be complemented by increased funding for science generally. The potential scale of increase in basic science will vary by country depending on their current level and research capabilities. Demonstration funding is also crucial to prove viability and reduce risk. Support demonstration projects undertaken by private firms or public/private partnerships, can include features to encourage projects development and maximise learning through provision of test site and facilities and systematic comparison of competing alternatives. ultiple examples of this exists, from tidal wave in the UK, to geothermal energy in Mexico. Finally. It is also worth noting that governments also fund the education and training of key players -scientists and engineers. As the output of low-carbon technologies in the energy sector expands nearly 20-fold over the next 40-50 years to stabilize emissions, new generations of engineers and scientists to work on energy-technology development and use will be required. Climate change may act as an inspiration to a new generation of scientists, while spurring a wider interest in science.6 6 Traditionally OECD nations have been the primary focus of innovative investments and technical education. However, as more technical education advances in large developing countries, this is likely to change. Already China and India are each graduating 250,000 engineers and scientists every year, as many as in the US and in the European Union combined.

21 Jose Alberto Garibaldi – July 8th, 2007. Revised Draft.
Partnerships between public and private sectors must support applied research Enhanced partnerships between the public and private sector will be central. Public R&D must leverages private R&D and encourage commercialization. Products are likely to be brought into the market by private firms who know them better, so public R&D should maintain the flow of knowledge by ensuring public R&D complements private sector efforts. As has already been noted, the growth and direction of private R&D efforts will follow the incentives for low-emission investments provided by both market structure and public policies. Thus, public R&D should aim to complement, not compete, with private &D, generally by concentrating on more fundamental, longer-term possibilities, and sharing risks in some larger-scale projects such as CCS. In many areas the private sector will make research investments without public support, as has been the case recently on advanced biofuels The public sector could fund private sector research through competitive research funding, with private sector companies bidding for public funds as public organisations currently do from research councils. Innovation prices can be used to encourage breakthroughs. Alternatively, the purchase of new products can be committed to reward those that successfully innovate. National investment in technology is not currently recognised as a contribution to the objectives of the UNFCCC. As the Stern review suggested, incorporating technology development into the measurement of national commitments under the UNFCCC would have the advantage of recognizing those countries that make a disproportionately large contribution towards developing new technologies. Consequently, international recognition of investment in innovation should be considered as part of a broader range of metrics over different dimensions of effort. III.3. Deploy National Support Policies Grubb (2002) mentions there are three classes of technology support policies. Market engagement programs move trial technologies from public R&D funding to engagement with the private sector; strategic deployment policies build market scale and thereby buy down the cost for technologies; and barrier removal aims to establish a level playing field for technologies. In addition, internalization policies operate throughout the cycle: classic examples being emission trade and cap or taxes, which aim to internalize damages from incumbent technologies and improve the economics of alternatives. The most controversial aspect is areas where technologies are proven and commercially available, yet remain trapped in the cycle of small volume and high costs. Strategic deployment policies can then support the large scale deployment of technologies and buying down the cost curve. This usually involves regulation to insure the adoption of technologies, securing the benefits of learning by doing and scale. Development of the wind industry in Denmark, and of the biofuels industry in Brazil both equired sustained government support for decades. Danish subsides totaled 1.3US$ Bn,

22 Jose Alberto Garibaldi – July 8th, 2007. Revised Draft.
while Danish wind companies now earn more than that every year (carbon trust, 2003)7 At current oil prices, Brazil might soon similarly recoup its investment in biofuel technology. Policies designed to support the deployment of new technologies such as feed-in tariffs and renewable portfolio standards, as described can also support investment, technology transfer and the formation of new national industries. Many developing countries have introduced such policies. China and India have encouraged large-scale renewable deployment in recent years and now have respectively the largest and fifth largest renewable energy capacity worldwide.
Policies must be tailored to the different technologies, their degree of support within the R&D cycle, and the barriers they face. Thus, a small list of potential policies could be tailored to the technology needs in different countries. Annex 1 below is an attempt at such an activity, identifying where potential gains lie, where technologies are located within the R&D cycle, and which barriers exits and how to overcome them.
Shifting the policy and regulatory environment is an important consideration because it will enable additional private sector resources to be channeled into the development and deployment of low carbon technologies. Private sector resources for energy sector investment far outweigh those available from governments and multilateral institutions, and public finance or loans can even be under-utilised in such countries. Middle-income countries, where most future GHG emissions growth will concentrate, have good access to capital from the private sector. Public sector resources and flows of carbon finance provide an important lever to channel these larger flows of domestic and international rivate sector investment to energy efficient and low-carbon technologies.
7 Carbon Trust ‘Building options for Uk renewable energy’ Oct. 2003, www.thecarbontrust.co.uk
23 Jose Alberto Garibaldi – July 8th, 2007. Revised Draft.
owever, these different sources of finance must operate together if the scale of required investment in low carbon technologies is to be achieved.
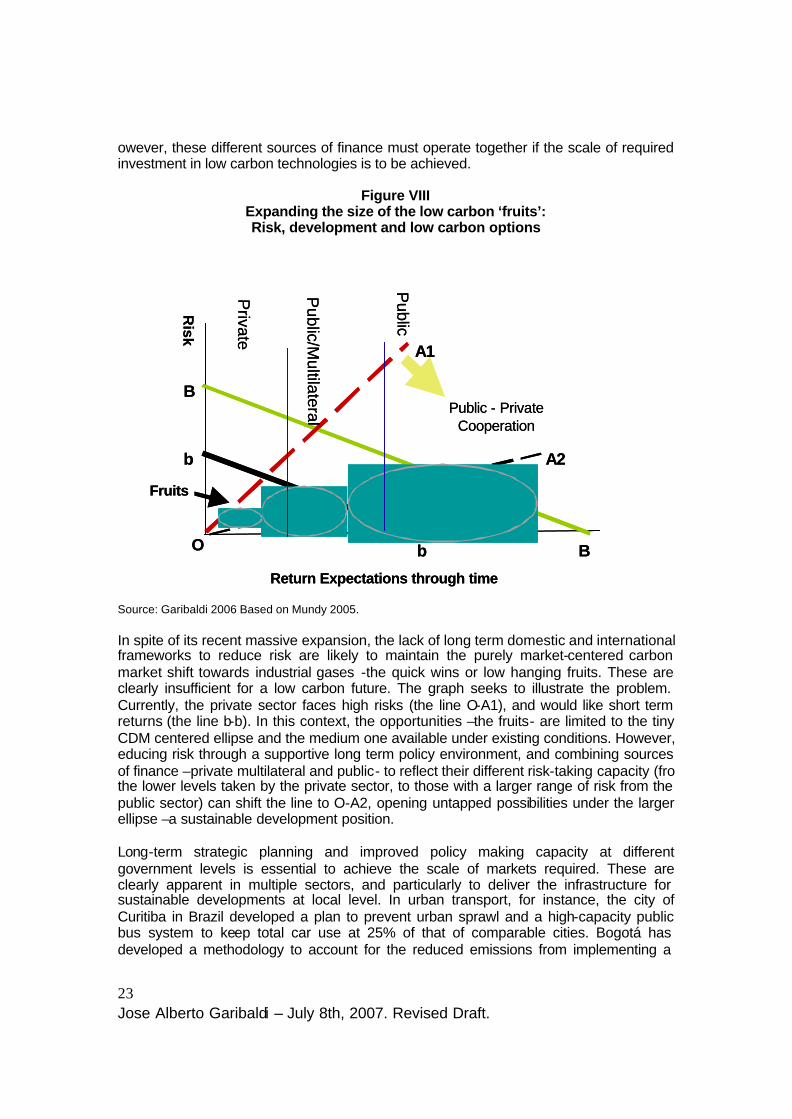
Figure VIII Expanding the size of the low carbon ‘fruits’: Risk, development and low carbon options
Source: Garibaldi 2006 Based on Mundy 2005. In spite of its recent massive expansion, the lack of long term domestic and international frameworks to reduce risk are likely to maintain the purely market-centered carbon market shift towards industrial gases -the quick wins or low hanging fruits. These are clearly insufficient for a low carbon future. The graph seeks to illustrate the problem. Currently, the private sector faces high risks (the line O-A1), and would like short term returns (the line b-b). In this context, the opportunities –the fruits- are limited to the tiny CDM centered ellipse and the medium one available under existing conditions. However, educing risk through a supportive long term policy environment, and combining sources of finance –private multilateral and public- to reflect their different risk-taking capacity (fro the lower levels taken by the private sector, to those with a larger range of risk from the public sector) can shift the line to O-A2, opening untapped possibilities under the larger ellipse –a sustainable development position. Long-term strategic planning and improved policy making capacity at different government levels is essential to achieve the scale of markets required. These are clearly apparent in multiple sectors, and particularly to deliver the infrastructure for sustainable developments at local level. In urban transport, for instance, the city of Curitiba in Brazil developed a plan to prevent urban sprawl and a high-capacity public bus system to keep total car use at 25% of that of comparable cities. Bogotá has developed a methodology to account for the reduced emissions from implementing a
Risk
Return Expectations through time
Fruits
Private
Public/M
ultilateral
Public
Public - Private Cooperation
O
A1
A2b
b
B
B
Risk
Return Expectations through time
Fruits
Private
Public/M
ultilateral
Public
Public - Private Cooperation
O
A1
A2b
b
B
B

24 Jose Alberto Garibaldi – July 8th, 2007. Revised Draft.
apid Bus transit system to generate CDM credits from this –and cities in Mexico, Chile and Peru are planning to follow suit. Meanwhile, Mexico has developed an umbrella program to expand new technology used for a Monterrey landfill-gas processing plant to other cities in the region. Regional consultations made by the UNFCCC, the UN commissions and the Regional development banks have shown that such opportunities exist and are being developed in public transport, waste management, lightning, energy efficiency, cogeneration, fuel switching, and large city based projects. Current carbon revenue can play a crucial role in catalyzing policy to improve the policy coordination, enhance project return rate facilitate enabling environment. An investment Framework operating together with government policies and measures can help underpin a programmatic approach to carbon finance, creating opportunities to increase the policy relevance of a low carbon future. By expanding opportunities for emission reductions, such an approach combined with a long term international goal, can help support the common interests of both developed and developing countries in a long term and vibrant carbon market, while securing the finance required to help regional transitions to a low carbon, climate resilient and sustainable future. III.4 Expand Carbon Markets and Pricing The UNFCCC discussions had included since the early 1990s, how to use market mechanisms to facilitate the achievement of the long term goals of the convention. As carbon markets expand and carbon pricing evolve, the incentives to introduce lower carbon technologies increase –subject to the constraints imposed by the uncertainties over the specific characteristics of its evolution. Carbon pricing is a cross cutting policy measure –it affects all technologies and sectors. Furthermore, as it has included both carbon trading –cap and trade mechanisms- and project and baseline schemes –such as the CDM- it currently encompasses both developed and developing countries. Box 3: The expansion of carbon trading schemes During the 1990s, as experience of emissions trading for air pollution grew in the US, the EU began to consider the potential of using trading to help meet its Kyoto target emission reduction obligations. Work by both the European Commission (its 2000 green paper) and the IEA showed that comprehensive trading scheme could reduce compliance costs of meeting Kyoto up to a third, compared to an autarchy scenario with o trading instrument. Besides the EU Emissions Trading Scheme (EU ETS), introduced in 2005, a number of other schemes are now planned or already operating. Norway introduced one in 2005 for energy and heavy industry, while New South Wales (Australia) operates a mandatory baseline-and-credit scheme for electricity retailers. Japan, South Korea and Mexico have also been running pilot programs for a limited number of companies or within large state owned enterprises. Elsewhere, the USA has plans for a Regional Greenhouse Gas Initiative (RGGI) from January 2009, while California’s expects to deploy its own cap and trade by 2008. Switzerland and Canada also plan to implement trading schemes to meet Kyoto commitments. Voluntary markets are also growing. The CCX (Chicago Climate Exchange) is an example of a voluntary carbon market, driven since 2003 by demand from both companies and individuals looking to reduce or offset emissions.

25 Jose Alberto Garibaldi – July 8th, 2007. Revised Draft.
Carbon pricing is probably affected most importantly by the EU emissions trading scheme (the EU ETS). The EU launched in January 2005 a trading scheme in major energy intensive and energy generation sectors, the world’s largest greenhouse gas emissions market so far. The scheme will enter a second, longer phase in 2008, and will continue with further phases beyond 2012, with a major review on the post 2012 regime to be launched in 2007. Participation is mandatory for emissions from industrial sectors included. These currently comprise energy generation, metal production, cement, bricks, and pulp and paper. Clarity over what the EU ETS will look like in Phase III and beyond will clarify the impact on their investment decisions –including the technologies to be deployed. Furthermore, the EU ETS Linking Directive has enabled EU-based industry to purchase carbon reductions from the cheapest source, including projects and programs being implemented in the developing world through the use of the Clean Development Mechanism. This has driven growing interest of EU firms in the CDM market, particularly as CDM credits can be used in either phase of the scheme. The CDM market volume grew threefold between 2005 and 2006, to 374 million tonnes (CO2e), much of this driven by demand from the EU ETS. The global carbon market has the potential to drive some of the instruments that could transfer the required low carbon technologies to the developing world.
Figure IX
Source: World Bank, 2006. Carbon prices followed closely those of the major energy products, including coal and gas, at the start of trading in January 2005, and it has proved so far to be a vibrant market. However, it is important to ensure both its transparency as well as how effectively it delivers carbon scarcity. In its initial stages, traders in the EU ETS had limited information on supply and demand for emission allowances. In particular, the

26 Jose Alberto Garibaldi – July 8th, 2007. Revised Draft.
National Allocation Plans (NAPs) did not contain clear data on the assumptions lying behind the projections of emissions used as the basis. The release of the actual emissions data from the scheme’s participants in April 2006 led to a sharp downward correction in prices (see figure above), as it showed initial allocations exceeded emissions in most sectors. The subsequent volatility underlined the crucial role of transparency and carbon scarcity.8 Their absence -and long term uncertainty- will affect price evolution, and consequently, incentives for the investment decisions revolving around the deployment of the required low carbon technologies. The Stern Review argued that up to around $40 billion a year would be generated if developed countries were to take responsibility for significant emissions reductions to 2050 on 1990 levels, and if they were to meet a proportion of those through financing action in developing countries. A transparent, deep, and stable ETS is crucial to achieve that. While a substantial international flow of funds is being generated through CDM, the mechanism falls significantly short of the scale and nature of incentives required. Its current project-by-project basis offsets against absolute reductions that would otherwise have been made by Annex one countries –already with commitments to reduce emissions under Kyoto. This requires procedures to demonstrate additionality
on a case-
by-case basis, leading to high transaction costs. Likewise, methodologies for energy efficiency in sectors dominated by small and medium-sized enterprises and transport infrastructure and demand management, which may not only be crucial for its expansion in middle income countries, but the source of significant reductions are mostly unavailable so far. Finally, projects with longer payback periods may be affected by other capital market failures, such as when long-term energy savings occur beyond the standard pay-back period used in investment appraisal or are very heavily discounted both for time and uncertainty. This does not only happen with large projects – for example, this affects the uptake of small-scale solar technologies.
8 Allocation in the EU ETS market is the sum of 25 individual member state decisions, subject to approval by the Commission. As such, it risks allocation level gaming between member states, if they make their decisions expecting allocation levels will be higher elsewhere in Europe. This has resulted in difficulties to ensure scarcity in the EU ETS market, with phase one estimated to be only 1% below projected “business as usual” emissions, while underlining the need for more stringent allocation criteria for member states, and robust decisions by the European Commission on NAPs to ensure scarcity.
27 Jose Alberto Garibaldi – July 8th, 2007. Revised Draft.
Figure X
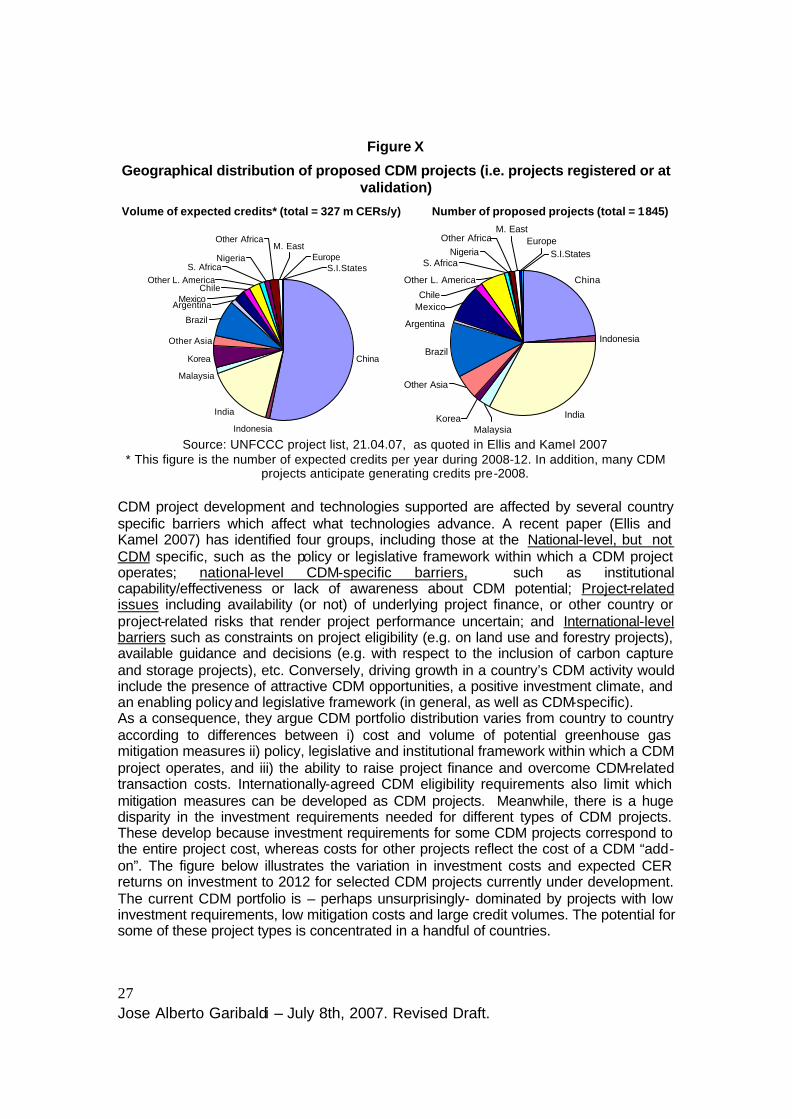
Geographical distribution of proposed CDM projects (i.e. projects registered or at validation)
Volume of expected credits* (total = 327 m CERs/y) Number of proposed projects (total = 1845)
China
Indonesia
India
Malaysia
Korea
Other Asia
Brazil
S.I.StatesEurope
Other Africa
NigeriaS. Africa
MexicoArgentina
ChileOther L. America
M. East
China
Indonesia
India
Brazil
Europe
Other L. America
ChileMexico
S.I.States
Other Asia
Argentina
M. East Other Africa
NigeriaS. Africa
KoreaMalaysia
Source: UNFCCC project list, 21.04.07, as quoted in Ellis and Kamel 2007 * This figure is the number of expected credits per year during 2008-12. In addition, many CDM
projects anticipate generating credits pre-2008. CDM project development and technologies supported are affected by several country specific barriers which affect what technologies advance. A recent paper (Ellis and Kamel 2007) has identified four groups, including those at the National-level, but not CDM specific, such as the policy or legislative framework within which a CDM project operates; national-level CDM-specific barriers, such as institutional capability/effectiveness or lack of awareness about CDM potential; Project-related issues including availability (or not) of underlying project finance, or other country or project-related risks that render project performance uncertain; and International-level barriers such as constraints on project eligibility (e.g. on land use and forestry projects), available guidance and decisions (e.g. with respect to the inclusion of carbon capture and storage projects), etc. Conversely, driving growth in a country’s CDM activity would include the presence of attractive CDM opportunities, a positive investment climate, and an enabling policy and legislative framework (in general, as well as CDM-specific). As a consequence, they argue CDM portfolio distribution varies from country to country according to differences between i) cost and volume of potential greenhouse gas mitigation measures ii) policy, legislative and institutional framework within which a CDM project operates, and iii) the ability to raise project finance and overcome CDM-related transaction costs. Internationally-agreed CDM eligibility requirements also limit which mitigation measures can be developed as CDM projects. Meanwhile, there is a huge disparity in the investment requirements needed for different types of CDM projects. These develop because investment requirements for some CDM projects correspond to the entire project cost, whereas costs for other projects reflect the cost of a CDM “add-on”. The figure below illustrates the variation in investment costs and expected CER returns on investment to 2012 for selected CDM projects currently under development. The current CDM portfolio is – perhaps unsurprisingly- dominated by projects with low investment requirements, low mitigation costs and large credit volumes. The potential for some of these project types is concentrated in a handful of countries.

28 Jose Alberto Garibaldi – July 8th, 2007. Revised Draft.
Figure XI
Investment costs and expected CER returns on investment for selected CDM projects
High investment costs
CER returnon
investment
Manure mgmt
Industrial N2O
HFC23 reduction
Landfill gas
Fuel switch
Biogas
Bagasseco-generation
Reforestation
Low investment costs
CoalmineCH4
Associated gas recovery
Wind
Natural gas power
Hydro
Geothermal
Clean coal
Energy efficiency
N.B.: Graph not to scale. Ellipses represent ranges of costs/returns on investment for which the authors have information.
Sources: Ellis and Kamel 2007.
National and international actions can both help countries’ to tap a larger proportion of their CDM potential. This work can be done by national governments, the UNFCCC negotiating process, as well as by organizations such as development agencies, financial institutions and carbon funds. It can be argued here that expanded project finance, policy reform instruments and actions, and new approaches to the CDM and carbon finance in general, including programmatic and bundled approaches can both increase the number of projects, as well as diversify the types of projects and technologies considered. Box 4: Programmatic CDM, large scale technology deployment, and future action. This was approved at the UNFCCC COP/MOP1 at Montreal in December 2005, following proposals made by Latin Am erican Countries, India and China. It allows for specific programs taking place in the context of national/regional policies to be credited. It can build upon reductions made possible by national policies, and/or deployed by national or sub-national bodies to tackle both their own development objectives as well

29 Jose Alberto Garibaldi – July 8th, 2007. Revised Draft.
as reduce GHG emissions. Its main aim is to produce larger CDM projects with lower transaction costs. A programmatic approach to CDM can do so by aggregating smaller projects within a program, for example incorporating reductions from households, small enterprises, rural electrification and transportation. These sectors cannot be addressed on an individual basis but can be tackled through an intentional government-led program to facilitate reductions. Variants still being developed could boost incentives for developing countries to initiate such programs Further developments of this instrument, innovative financial products –at multilateral or even private sector financial institutions- to support their deployment and increased linkages to carbon finance are crucial because most cost-effective, large-scale emissions reductions are likely to be linked to strategic programs (i.e. supporting integrated urban transport and development, retrofitting inefficient plants and/or systematically using carbon capture and storage). Programs on this scale can take place only in the context of structural reforms and development policies implemented by national or regional governments. CDM investment tends to go towards countries with a strong private sector investment enabling environment (including economic and political stability, liberalised markets, strong legal structures), and built up national capacity for using carbon finance. Programmatic investment and carbon facilities would thus enhance both incentives for countries to develop such environments, as well as the means to deliver the required finance to deploy the technology at the required scale. Given the relative growth of emissions in developed and developing countries, and the scale of the climate change challenge, programmatic approaches can nevertheless be seen as an important building block for supporting reductions on a much greater scale. In particular, it could evolve to a scheme in which developing countries discount some of the CERs they can sell as a contribution to the stabilization of CDM gases, provided large scale programmatic approaches are available. Thus, developing countries would still have an incentive for action with no loose targets, while making contributions to the atmosphere beyond those resulting from the reductions made by Annex I countries. Sectoral crediting mechanisms and ‘no-lose’ commitments would also help move development policies and carbon finance in directions that support achieving both development goals and low carbon technologies. These approaches all require preparatory work, particularly on mechanisms to report data and monitor reductions, as well as creating the capacity to engage the private sector. However, some example already exist which could serve as a basis. China’s program to reduce energy use by its 1000 largest enterprises, Brazils Programs to support renewable energy and domestic consumption of bio-fuels (PROINFA and PROALCOOL), or Mexico large scale Energy Efficiency Trust Funds (Fideicomiso para el Ahorro de Energia, FIDE) are all successful examples. Ongoing international initiatives can also provide information to lay foundations for these approaches. IEA and World Bank co-operation on sector-specific benchmarks for energy efficiency for Brazil, China, India, Mexico and South Africa, as part of the Energy Investment Framework arising from the Gleneagles Summit plan of action, is another example. Likewise, changes in the CDM rules allowing for program based credits means that linking the carbon market opportunity to IFI policy-based lending efforts can also create

30 Jose Alberto Garibaldi – July 8th, 2007. Revised Draft.
a platform for energy policy reform in the region not available previously. The IFI’s country strategies offers an ideal platform to promote policy reform that enhances the deployment of sustainable clean energy initiatives in individual countries. III.5 Develop Innovative Financial Mechanisms Just as there is no technological silver bullet, there is no single investment structure that would fit the requirements of the diverse low carbon markets. Currently, the main funding framework in low-carbon energy technologies is the Global Environment Facility (GEF), working through its Implementing Agencies and with a range of multilateral and bilateral donors. In spite of its achievements, GEF funding is clearly insufficient in terms of magnitude and scope. A significant expansion in the scale of funding is required if the deployment of low-carbon technologies is to be supported, and strong legal and regulatory environments and local partnerships are important in determining success. Different elements of the financial markets can support different levels of risk, so a range of custom designed instruments will be required to finance low-carbon technology deployment. This must occur from private pools of capital, as public resources will prove insufficient to meet the financing requirements of low-carbon technologies. But, these segments cannot act in isolation of each other. There needs to be cooperation between players in public and private finance. Likewise, the large-scale deployment of key low-carbon technologies is likely be funded through both existing and new innovative financing vehicles. The former might include corporate debt financing or existing capital on the balance sheet (e.g. Toyota spent an estimated $1 billion to market the Prius), as well as structured finance products in the energy sector (e.g. wind energy). Creative finance can range from export to development finance, including technology transfer agreements in the former to policy and sub-national loans in the latter. Private commercial Banks are now setting up clean technology groups to target investments from internal capital or focused on underwriting and structured finance. As a recent Goldman Sachs-WRI document stated, the bond market, which can provide longer term and lower cost financing than traditional loan facilities, is increasingly interested in financing wind farms. Moreover, there is evidence that banks are innovating in structured finance in the wind market by bundling assets from several projects to collateralize bonds sold to the market. As such document states, the Italian bank UniCredit’s HVB Group, for example, sold upwards of US$600 million in bonds last year to finance 39 wind projects in France and Germany. There is also an international dimension of capital flows to low carbon technologies. The IEA argues there is an investment need in the energy sector for developing countries of around $10 trillion to 2030, or around $165 billion per year from now to 2010 in the developing countries’ electricity sectors alone, increasing at 3% per year through to 2030. Out of this, $34 billion will be required to ensure energy access for people lacking modern energy services. This will come largely from national investment and from the private sector, and will depend to a large extent on the policy frameworks in place in the countries themselves. However, the scale of actual current domestic and foreign investment is insufficient. A large financing gap exists for basic power sector infrastructure investments, partly because policy frameworks are lacking. The World Bank estimates that there is a further significant gap, of around $20-30 billion per

31 Jose Alberto Garibaldi – July 8th, 2007. Revised Draft.
annum, to meet the incremental costs of low carbon investment in the power sector in developing countries. Investing in key emerging economies such as Brazil, Russia, India, China, or Mexico requires addressing country specific challenges and methods to tailor the required finance and investment to the policy, institutional and regulatory setting of each country. This includes both understanding the network of investment players that can support large-scale deployment of technology as well as the characteristics of the dom estic institutional and regulatory regime where the investment will take place: a utility scale project finance in Shangai in China involves a different set of players and rules than a venture capital financing of a PV company based in Silicon Valley, in California. Understanding such a distribution of financing is important because different countries draw on very different sources of capital. In China, the vast majority of capital deployed in the energy sector is domestic, and less constrained by ROI requirements than in more liberalized markets. The World Energy Outlook argues that the largest investment requirements in the power sector, some $3 trillion, will occur in China by 2030. While the majority of capital invested in emerging countries is usually from domestic sources, the sovereign risk characteristics of these countries can differ significantly, affecting the kinds and types of international lenders willing to invest in these markets. Investor risk tolerances, combined with the capacity of a country to absorb and deploy technologies, and the local policies and measures, will impact what technologies and investment capital is deployed. Commercialising emerging technologies requires risk capital that is often unavailable in developing countries. Carbon finance alone may not be sufficient to fund incremental costs, and other types of support may be needed to make a project viable. Emerging technologies are perceived as higher risk and are thus less likely to attract domestic private investment or to receive export guarantees. There are significant opportunities for the IFIs to play a role in improving the pipeline of ‘bankable’ low-carbon projects that have risk profiles and business plans suitable for attracting private sector support, including through the use of public funding to improve project identification and the preparation of investment proposals. Financial institutions have a unique opportunity to encourage their clients to seek advice on the energy efficiency of proposed investments. By building this advice into the planning and financing stage of major investment in upgrades or new infrastructure, transaction costs can be greatly reduced. Likewise, the use of financial and risk management instruments can reduce transaction costs, increase transparency and competitiveness of loan pricing, and share country and project risk.
The Investment framework coming out of the G8 summit in Gleneagles also offers an opportunity to address potential trend-breaking interventions. As a response to the invitation coming from that summit, the World Bank and the Regional development Banks have been developing specific instruments to facilitate the creation of an enabling environment for low carbon technologies within their overall poverty fighting mandate. These approaches have focused both on the global requirements of a low carbon transition, as well as on regional needs. Thus the World Bank has focused on energy access, low carbon, and adaptation; while the regional banks have tailored them to the concerns arising from the problems regional development face. Thus, In Latin America –with the largest renewable energy resources and bio-fuels expertise and almost al

32 Jose Alberto Garibaldi – July 8th, 2007. Revised Draft.
countries with some CDM experience- the Inter-American Bank has focused on clean energy (including renewables and bio-fuels), carbon finance and adaptation; in Asia, with exploding transport sector emissions and large CDM projects, the Asian Development Bank has focused on Transport and Carbon Finance. In Africa, with still massive energy access problems and acute vulnerability issues, the African Development Bank is focusing on access and adaptation.
This raises the question of whether IFI policies and approaches should pursue a technology neutral or a technology specific policy. Investment in the most advanced technologies may require a different approach, which help mitigate the risks associated with lower carbon technology projects deployment.
Box 5: Financial Instruments for development and low carbon IFI can develop instruments that can facilitate the deployment of low carbon technologies through enhanced project and blended carbon finance. These can include the following mechanisms
• Policy Loans are newly developed instruments, which support countries adjust their policy framework in a specific area –environment, transport –or any with a cross cutting low carbon component. Can be given to the Treasury (as the WB) or to a sector (as in the IADB)
• Sub-national Finance allow IFIs to lend to sub-national government without sovereign guarantees, thus allowing cities or regional governments to deploy programs or projects which can reduce carbon impacts.
• Partial or secondary guarantees can help improve the credit rating of projects and loans granted by local development and commercial financial institutions with RE/EE and other low carbon activities (carbon reduction and mitigation projects);
• Public-private sector loans/guarantees granted directly through IFIs or other financial institutions, or indirectly through national development banks, to RE/EE and low carbon investments;
• Participative loans formed by a combination of grants, low fixed interest rates nd variable market rates, based on the project financial capacity to compensate the additional transaction and development costs of RE and EE projects ;
• Guarantee Fund for CDM Projects. These facilities seek to secure for local financial institutions part of the future cash flows generated by the carbon credits generated by CDM projects. These can also help extend carbon transactions beyond 2012, while increasing trust on the continuation of a similar regulatory regimen;
• Lending programs deployed through local development and commercial banks, addressed to both public and private projects, in RE/EE and other low carbon projects, with the inclusion of financial incentives depending on the profile of the client;
• Equity investments in Clean Energy ü Venture Capital Investment oriented to capitalize and strengthen
ustainable energy firms and, at the same time, promote low carbon

33 Jose Alberto Garibaldi – July 8th, 2007. Revised Draft.
projects in developing countries; ü Sustainable Infrastructure Development Investment aimed to
identify and develop the promotion of small and medium infrastructure projects such as mini hydro, biomass, biofuel, and solid waste management.
• Special Purpose Entities (SPEs) for pooled financing of small and medium low carbon projects. SPEs can operate together with local development and commercial banks, at a country level and serve as pooling agent for carbon credits generated by the eligible projects, reducing their transaction costs.
The IFIs are normally constrained by their procurement rules to purchase standard technologies rather than advanced technologies in their mainstream investment programs. Likewise, the development of the CDM and carbon finance, and its linkages with low carbon technologies, has also translated here into the development of IFI investment instruments capable of blending carbon and project finance, helping improve the rate of return of low carbon projects in developing countries. The World Bank started the trend by developing a carbon specific facility, the Prototype Carbon Fund, which allowed investments in demonstration CDM projects before Kyoto entered into force. These were followed by other bilateral funds, by the massive expansion of CDM related funds, as well as by specific CDM carbon funds in other RDBs. Currently, the WB is working on instruments on programmatic approaches, focused on programs of activities rather than projects, following the initiatives advanced by Latin America countries and India and China at the Montreal Conference of the Parties, an in several regional consultations. These could very well work with the scaled up carbon finance mechanisms described above. III.6 Strengthen International cooperation for technology R&D Final, enhanced international cooperation is essential in accelerating efficient and cost-effective progress towards a low carbon energy future. It has an important role in:
• innovation and technology development, • eployment of advanced technology, • technology transfer around the world, • capacity building in developing countries • optimising the policy frameworks and support mechanisms for these to occur.
The central questions here are how to ensure that the combined international effort is sufficient relative to the scale and urgency required, and what types of co-operation and co-ordination are most useful. Formal co-operation on technology has supported advances ranging from basic science to space exploration and the launch of commercial satellite systems. There has been a growing debate over the importance of formal international agreements on technology co-operation as part of efforts to tackle climate change. While technology cooperation could form an easier basis for international co-operation than carbon pricing, it might ultimately be a less effective one: carbon markets and technology cooperation need to

34 Jose Alberto Garibaldi – July 8th, 2007. Revised Draft.
go hand in hand. Formal international technology co-operation is nevertheless particularly important where R&D can lead to breakthrough technologies that exhibit increasing returns to scale and where R&D co-operation might sustain a strong international response. Informal arrangements can also play a valuable role in supporting co-ordinated or parallel action. In fact, technology has some characteristics of a “club good” rather than a pure public good, in that despite the spillovers, some of the benefits of co-operation on innovation can be limited, for a time, to participants. Thus, cooperation on technology goes far beyond formal multilateral arrangements. Links between universities and research networks help to ensure that breakthroughs in basic research are widely available. Partnerships are likely to play a key role in bringing together smaller groups of public and private bodies to take a lead in developing particular technologies. Today’s energy system is vast and will expand as extensive new investment and infrastructure are added to meet future growth, particularly in developing countries. If current world energy flows are taken as a guide, the relevance of the sectors to be considered can also be examined.
Transport(29%)
Buildings, Appliances
& other(36%)
Industry Manufacturing+Construction
(35%)
End Users Supply Systems Resources
Coal (37%)
Gas (21%)
Petroleum/Oil(42%)
Direct Fuels & Heat(29%)
Refined Fuels System(35%)
Electricity System(36%)
The data show the % of global energy-related CO2 emissions associated with the different parts of the energy system (including emissions embodied in fuels and electricity).
Energy System Framework
RenewablesHydro,Wind,Solar,BIo
Nuclear
Source: uoted from Senior 2005. If such a scheme is used as a guide, key areas for international cooperation would thus include:
• End use sectors (buildings and the equipment used within them, Industry /manufacturing and Transport)
• upply systems – direct fuels(eg coal and gas) and heat, the power generation and transmission grids and refined fuels(mainly petroleum, plus biofuels)
• Resources and primary supply: Coal, Gas, Oil, Nuclear and renewables (hydro, wind, solar, bioenergy, geothermal)

35 Jose Alberto Garibaldi – July 8th, 2007. Revised Draft.
Key stakeholders involved include the research community, governments and industry, with financial institutions and NGO’s and the public increasingly important as towards commercialisation. Existing International Government Collaboration on Low Carbon Energy Technology There is a great deal of international cooperation in low carbon energy technology taking place. Most of the energy system and innovation chain are covered. Participation by countries around the world is highly variable, reflecting national priorities, resources and R&D capacity. The main activities involving national governments are summarized below. 1. Over recent years a number of high profile international partnerships have been
formed that have widespread participation(10-15+ countries) by both developed and developing countries. These also benefit from high-profile political impetus and government leadership and should generate technology push in these areas:
• The International Partnership for the Hydrogen Economy (IPHE) aims to
accelerate progress towards a Hydrogen economy, an entire energy system with renewable hydrogen production, a supply system and end use application in transport and stationary applications. The purpose is to coordinate and organise research, development and demonstration of these long-term technologies and to provide a forum to advance non-technical issues to accelerate cost-effective deployment.
• Carbon Sequestration Leadership Forum(CSLF) has a similar breadth of participation and purpose for CO2 Capture and Storage, or Sequestration. These technologies would support cleaner use of fossil fuels in the electricity system and industry sectors in the medium to long term.
• Methane to Markets(M2M) is a newer initiative focused on cost-effective methane recovery from resource sectors(landfill, coal mines, gas flaring) and it’s se as a clean energy source. This has a near term application potential.
2. The development of advanced Nuclear technologies involves a high level of
international collaboration, which shares the high costs of development. • The Generation IV International Forum (GIF) is an international government
collaboration on joint development of the next generation of nuclear technology for deployment between 2010 and 2030. It’s participants are the USA, Argentina, Brazil, Canada, France, Japan, South Korea, South Africa, Switzerland, and the UK.
• The ITER programme on Fusion power is an international project involving, the EU (Euratom), Japan, Korea, Russia and the USA, under the auspices of the IAEA. ITER is the experimental step between today’s studies of plasma physics and tomorrow's electricity-producing fusion power plants.
3. The REEEP( Renewable Energy and Energy Efficiency Partnership) was launched at
the World Summit on Sustainable Development in Johannesburg to bring together governments, business and other stakeholders with the aim of fostering international

36 Jose Alberto Garibaldi – July 8th, 2007. Revised Draft.
collaboration to accelerate the market growth of modern renewable and energy efficiency technologies. REEEP is unique in its focus and is the only systematic attempt to build human and institutional capacity for REEE market growth and innovation from the bottom up on a global basis.
IEA has 40 international collaboration agreements in energy R&D that provide comprehensive coverage of the energy system. These involve energy R&D, deployment nd dissemination under the IEA framework for cooperation, known as Implementing Agreements. These enable experts from different countries to work together and share results, which are usually published for a wider audience. All sectors are covered to some extent. Participation is either on a cost- or task-sharing basis. Most participants are IEA members and thus OECD countries are the main participants. Participation has been opened to other countries over recent years and some non-members, including China, Brazil and South Africa, have joined some collaboration agreements, including those relating to clean coal and bioenergy. 4. There are many bilateral arrangements between individual developed and
developing countries involving governments, researchers and industry and focused on specific sectors. These are important for the country’s involved but do not provide the same international benefits and leverage as larger partnerships.
Various arrangements can help to promote the positive spillovers of knowledge between technology programmes in order to speed the pace of innovation. Other International Collaboration There is much other international collaboration and cooperation that doesn’t directly involve national members. This includes research collaboration between academia and/or industry partnerships. There are many other international activities that relates to technology deployment and diffusion via international institutions and mechanisms, including: • activities under the UNFCCC such as the activity on technology transfer, • the Global Environment Facility and other WSSD partnerships, that operate
predominantly at project level. • UN agencies including UNEP and UNDP, and the UN regional commissions. • International finance Institutions also play a role in supporting and promoting
deployment of advanced technologies and have developed some technology capability to deliver this.
The recent IEA work
on the effectiveness of IEA and other technology partnerships
highlights some key lessons. First, the involvement of a range of stakeholders, including the business community, is essential to the success of technology partnerships. Second, developing country participation is important, and not only from the point of view of uilding capacity and know-how. Increasingly, the wealth of scientific and technical expertise in developing countries means they have important contributions to make in their own right. The IEA has recently launched a further initiative on Networks of Expertise in Energy Technology (NEET) to encourage further co-operation with non-member countries. The

37 Jose Alberto Garibaldi – July 8th, 2007. Revised Draft.
IEA's NEET Initiative seeks to play a catalytic role in promoting worldwide technology collaboration, linking existing energy R&D networks, bringing together policy-makers and takeholders from the financial, business, research and other key sectors, in both IEA countries and major energy-consuming non-IEA emerging economies. The challenge is not just creating new knowledge but ensuring that this knowledge is disseminated so it can be used effectively no matter where it originates from. This stimulates competition and reduces unnecessary duplication and ensures that other research efforts in both the public and private sector can benefit from the progress that is made. Pooling risk and reward for major investments in R&D
Co-operation can go beyond sharing information and co-ordinating of national priorities to include formal arrangements to spread the risk and cost of investing in new technologies. The scale of some low-carbon technologies is too large for countries to take along single handedly. The classic example of this is nuclear fusion, where the benefits can be large, but the technical challenges and the investment required are daunting. 9The ITER project -delayed for several years as a result of location disagreements- is a case in point. Discussions on a series of linked demonstration projects or for a number of different technologies could increase the opportunities to share the benefits of co-operation amongst the participants.
The agricultural sector can provide another interesting example of how to pool research. CGIAR draws together national, international and regional organizations, the private sector and 15 international agricultural centers to mobilize agricultural science, promote agricultural growth, reduce poverty and protect the environment. The CGIAR was created in the context of important agricultural challenges10 in 1971; now it has more than 8,500 scientists and staff working in over 100 countries and can provide a successful model of a research framework. It can be expected to play a strong role in enabling the agricultural sector to adapt to the impacts of climate change through research on new crop varieties and farming methods.
Several lessons from the CGIAR experience are relevant for an international program in the development of low carbon technologies and practices:
There was a shared commitment among the sponsors; • The program evolved from an already extensive network of national research centres and supplemented and enhanced national efforts; • It was based on real demonstration and R&D projects, and was not simply a ‘talking shop’;
9 The ITER
project to demonstrate the scientific and technical feasibility of nuclear fusion power is
supported by European Union, Japan, China, India, the Republic of Korea, the Russian Federation and the SA each of which has committed to financing the project’s $10 billion cost: Europe will contribute 45.45%, and China, Japan, India, Korea, Russian Federation and the USA will contribute 9.09% each. 10 How to increase food supply was a crucial concern in the mid XX century, as the scope for increasing agricultural land area was becoming limited and the world’s population was set to double. Successful efforts resulted in improved yields of agriculture research and extension, bolstering both national research stations facilitated by a network of international research centers, later brought together under the aegis of the CGIAR with the orld Bank as chair.

38 Jose Alberto Garibaldi – July 8th, 2007. Revised Draft.
The efforts were not centred on one institution in one country, but divided across a set of institutions in several countries specializing on particular crops (rice, wheat, maize, agro-forestry and so forth) and livestock farming; There were good working links between the international and national centres of R&D; • There were also good working links between the program and users (extension services and farmers in the case of agriculture), so that technology and knowledge could be rapidly diffused to those who would use it. Increased international coordination for deployment support The current level of deployment support should increase by 2 to 5 times to help deliver an appropriate portfolio of technologies. Understanding that others are taking significant measures to support technologies can encourage countries to increase their effort. Countries can also benefit from discussing effective policies and how to foster an appropriate portfolio of technologies, moving towards a common understanding of what this means. Most OECD and larger developing countries already have some sort of deployment support for low-carbon technologies, but they need to be increased to sufficient scale and ensure that potentially cost effective technologies are not ignored. International co-operation can complement national support strategies in enhancing investors’ confidence for future markets, and thus encouraging innovative investments. This is particularly true for certain technologies. Carbon Capture and Storage
(CCS) is
yet to be deployed at full commercial scale in the power sector, and remains at the demonstration stage. However, its role will be critical. Failure to develop CCS would result in a narrower portfolio of low-carbon technologies, thus substantially increasing abatement costs. The IEA tech prospective shows that, without CCS, marginal abatement costs would increase by around 50%, causing less abatement to occur at a higher cost. Likewise, the Global Energy Technology Strategy program showed that the absence of CCS more than triples stabilisation costs at all concentration levels.
Currently, the Carbon Sequestration Leadership Forum acts as a focal point for
participating governments and industry to share updated information on national programs and opportunities. While a number of projects are under development, national governments have so far found it difficult to set up policy national or international frameworks to cover the additional costs required for a full demonstration project. A single CCS demonstration project costs several hundred million dollars on top of the cost of a standard power station -and at least 10-15 such projects should be in place by 2015 at an estimated extra cost of $2.5 to $7.5 billion to demonstrate the commercial viability of the technology -a dramatic increase on the $100 million currently being spent. It may be better for a limited number of countries to demonstrate the technology, but no oordinating arrangements for these efforts exist at the scale required. This urgency is more acute as there have been several announcements from governments and the private sector on planned CCS projects. 11
11 These include at least the US Futuregen project
for to the IGCC coal generation technology
demonstration; BP’s proposed Peterhead project, including a 350MW hydrogen plant capturing 1.2 million tons of carbon each year; A Japanese proposal to capture a sixth of all their emissions by 2020; Vattenfall’s plan to build a 30 MW pilot coal plant in German, expected to be in operation by mid 2008; a geological storage pilot project in the Otway Basin in Western Victoria
planned by a
public-private research organization in Australia, with an LNG project Gorgon (North West Shelf),

39 Jose Alberto Garibaldi – July 8th, 2007. Revised Draft.
Building on already agreed projects and other which might be planned, enhanced international co-ordination could allow governments to allocate support to the demonstration of a range of different projects, and demonstration of different pre and post combustion carbon capture techniques from different generation plants, to adapt to local circumstances and fuel prices. Both understanding the best way to make new plants “capture-ready”, by building them in such a way that retrofitting CCS equipment is possible at a later date; and legal, regulatory and policy frameworks to encourage deployment after demonstration are likely to be critical. In the demonstration stage, regulation and policy frameworks should be developed in parallel, including Co2 leakage liabilities. Integrating this into policies such as emissions trading schemes and programs to encourage renewables could have an important impact on deployment. Likewise, support for renewable energy sources is common throughout the OECD and in some non-OECD countries such as India and China. The structure and ambition of this support varies greatly across –and even within- countries. Feed-in-policies (price support) and porfolio standards (quantity targets) are both common, both within and outside the OECD. In addition, a number of countries use tax incentives to encourage the deployment of renewables. China applies a much lower rate of VAT to renewable energy technologies, and Mexico offers tax relief on clean energy R&D. As with CCS, there is no formal co-ordination but the Bonn and Beijing Renewables Conferences and the REN21 network have provided a powerful mechanism to gather and share information on different national approaches and to raise awareness of the scale of national efforts amongst policymakers and industry. Conclusions An expansion of technology and R&D is a crucial element of any durable climate change solution. Currently commercially available or technically possible technologies exist capable of delivering the required reductions to stabilize GHG concentrations at levels with avoid extremes of climate interference. However, due to characteristics on the markets in which they have been operating, research on these technologies have been falling since the late 1970s, particularly in the energy sector, while support for the technology deployment has been decreasing. A reversal of this situation will a two to five-fold worldwide increase of R&D support in rder to support the scale of uptake required to drive cost reductions in technologies and, with the carbon price, make them competitive with existing fossil fuel options. A substantial policy shift will be needed in turn, to ensure the required technologies will enter into the markets in both developed and developing countries, that markets expand to achieve the scale required -so cost reductions and economies of scale develop to the extent needed- and infrastructure and institutions to enable low carbon choices are available. This will need to operate side by side with financial mechanisms that diminish the gap between public and private sector support within the innovation cycle, facilitate low carbon investment and carbon finance linkages, and support low carbon consumer choices. Finally, substantive lifestyle changes will be required, both to adapt to the scale
and the Stanwell ZeroGen IGCC -CCS project at the proposal stage; and the EU initiative seeking to develop a CCS pant in China.

40 Jose Alberto Garibaldi – July 8th, 2007. Revised Draft.
of the technologies to be deployed, as well as to develop lifestyle changes which either avoid a high carbon aspect, or deliver a lower carbon footprint. These must be deployed systematically, so that one builds on the other. Thus, strategic deployment of all this components will be central to achieve the scale required. In what follows, four related strands will be examined: the scale in which innovation expenditures need to be expanded, and the roles of carbon markets and pricing, policies, and financial instruments in supporting low carbon technologies.
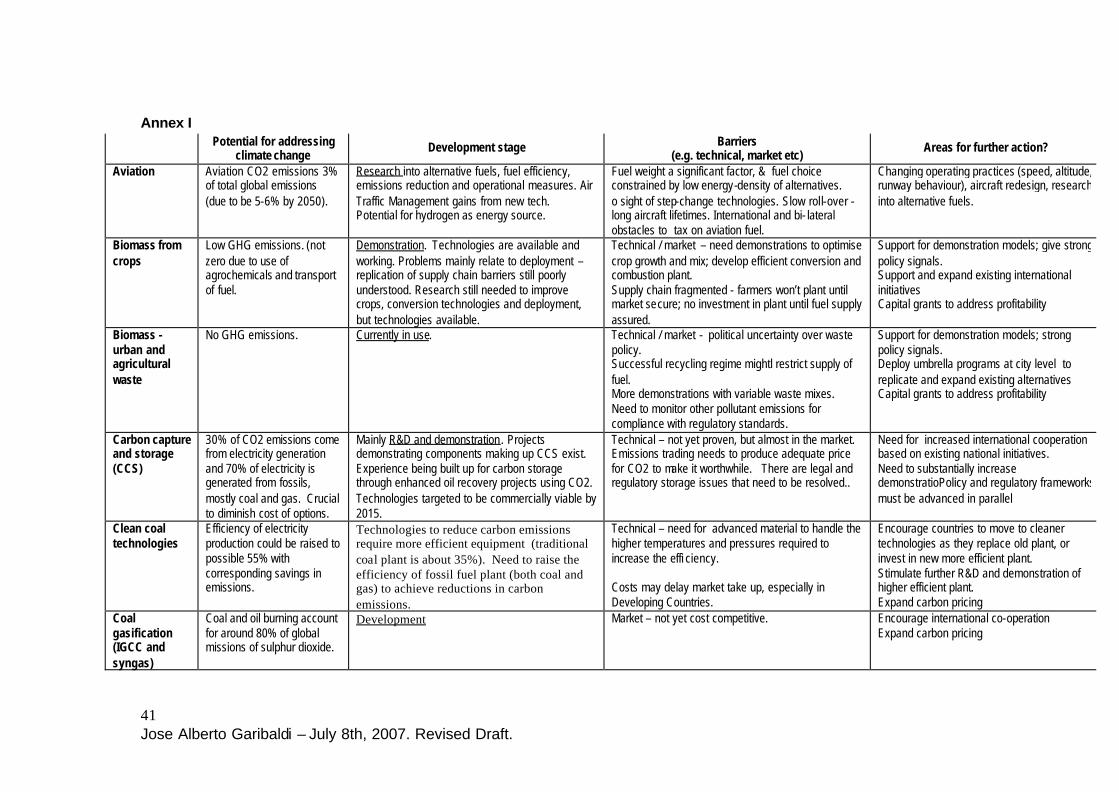
41 Jose Alberto Garibaldi – July 8th, 2007. Revised Draft.
Annex I
Potential for addressing climate change
Development stage Barriers (e.g. technical, market etc)
Areas for further action?
Aviation Aviation CO2 emissions 3% of total global emissions (due to be 5-6% by 2050).
Research into alternative fuels, fuel efficiency, emissions reduction and operational measures. Air Traffic Management gains from new tech. Potential for hydrogen as energy source.
Fuel weight a significant factor, & fuel choice constrained by low energy-density of alternatives. o sight of step-change technologies. Slow roll-over -long aircraft lifetimes. International and bi- lateral obstacles to tax on aviation fuel.
Changing operating practices (speed, altitude, runway behaviour), aircraft redesign, research into alternative fuels.
Biomass from crops
Low GHG emissions. (not zero due to use of agrochemicals and transport of fuel.
Demonstration. Technologies are available and working. Problems mainly relate to deployment – replication of supply chain barriers still poorly understood. Research still needed to improve crops, conversion technologies and deployment, but technologies available.
Technical / market – need demonstrations to optimise crop growth and mix; develop efficient conversion and combustion plant. Supply chain fragmented - farmers won’t plant until market secure; no investment in plant until fuel supply assured.
Support for demonstration models; give strong policy signals. Support and expand existing international initiatives Capital grants to address profitability
Biomass - urban and agricultural waste
No GHG emissions. Currently in use. Technical / market - political uncertainty over waste policy. Successful recycling regime mightl restrict supply of fuel. More demonstrations with variable waste mixes. Need to monitor other pollutant emissions for compliance with regulatory standards.
Support for demonstration models; strong policy signals. Deploy umbrella programs at city level to replicate and expand existing alternatives Capital grants to address profitability
Carbon capture and storage (CCS)
30% of CO2 emissions come from electricity generation and 70% of electricity is generated from fossils, mostly coal and gas. Crucial to diminish cost of options.
Mainly R&D and demonstration. Projects demonstrating components making up CCS exist. Experience being built up for carbon storage through enhanced oil recovery projects using CO2. Technologies targeted to be commercially viable by 2015.
Technical – not yet proven, but almost in the market. Emissions trading needs to produce adequate price for CO2 to make it worthwhile. There are legal and regulatory storage issues that need to be resolved..
Need for increased international cooperation based on existing national initiatives. Need to substantially increase demonstratioPolicy and regulatory frameworks must be advanced in parallel
Clean coal technologies
Efficiency of electricity production could be raised to possible 55% with corresponding savings in emissions.
Technologies to reduce carbon emissions require more efficient equipment (traditional coal plant is about 35%). Need to raise the efficiency of fossil fuel plant (both coal and gas) to achieve reductions in carbon emissions.
Technical – need for advanced material to handle the higher temperatures and pressures required to increase the effi ciency. Costs may delay market take up, especially in Developing Countries.
Encourage countries to move to cleaner technologies as they replace old plant, or invest in new more efficient plant. Stimulate further R&D and demonstration of higher efficient plant. Expand carbon pricing
Coal gasification (IGCC and syngas)
Coal and oil burning account for around 80% of global missions of sulphur dioxide.
Development Market – not yet cost competitive. Encourage international co-operation Expand carbon pricing

42 Jose Alberto Garibaldi – July 8th, 2007. Revised Draft.
Potential for addressing climate change
Development stage Barriers (e.g. technical, market etc)
Areas for further action?
Some technologies for reducing SO2 and NOx
are already commercially available and fitted
to some coal-fired power plant.
Combined heat and power
Greater efficiencies compared to electricity only plant mean lower emissions, but other technologies are steadily eroding the CHP carbon benefit.
Currently in use. For conventional CHP – micro-CHP in Development phase.
Market - struggling to due to high capital cost, rising gas prices and low price for electricity sales. Current market structure can militates against CHP. Conventional CHP not cost-competitive with condensing boilers. Micro-CHP not yet proven to work or save carbon in real domestic applications.
National policies. Expand use in large energy intensive sector (refineries, power, etc) For conventional CHP continue to promote in right applications; use public procurement. Need carbon pricing to avoid rebound.
Electricity grid (and infrastructure)
Direct benefits not significant, but grid improvements are essential to growth of renewables and CHP. UK has passive grid so need to move to active managed grids if distributed generation is to form a significant part of our electricity supply mix.
Research - for active managed grids. Power electronics and real- time management systems needed.
Market – lack of investment route within OFGEM price control mechanisms. Lack of funds to invest in grid upgrades. Potential for significant stranded assets.
Encourage collaborative R&D effort to develop intelligent grid management systems. Recent blackouts have raised level of interest in US and elsewhere.
Energy Efficiency in buildings Energy efficiency in industry
Large potential (up to half of future emissions) to reduce CO2 emissions through improved energy efficiency nd reduced energy demand
Commercial / de monstration
Buildings and industrial processes using 20-25% less energy cost effectively are commercially available now but take up is poor. Zero-low carbon buildings possible now. Need large scale demonstrations to design, build and operate offices, industrial buildings, schools etc.
Market – Consumer awareness and demand are low. Too few professionals aware of low carbon design principles. Unconventional style creates resistance amongst owners / developers. Needs independently monitored demonstrations and real life case studies to bring confidence to prospective investors. Market – landlord does not benefit from lower energy costs. Slow stock replacement and minimal standards, poorly enforced. Rapid building schedules squeeze out innovative ideas. For industry energy efficiency is
Buildings: Energy Performance of Buildings Directive; labelling regime to allow market differentiation on energy and carbon performance (cf fridge labels), domestic market transformation programs, international cooperation with leading edge countries, stimulation of R&D into energy efficient process are real priorities. Carbon Management programs.

43 Jose Alberto Garibaldi – July 8th, 2007. Revised Draft.
Potential for addressing climate change
Development stage Barriers (e.g. technical, market etc)
Areas for further action?
not core business. Fuel cells (emphasis on hydrogen source)
No GHG emissions (at point of use); overall impact will depend on source of hydrogen.
Development – niche markets such as remote power and consumer goods – 1-3 yrs; distributed generation/CHP 7-10 yrs; automotive 15-20 yrs. Most technologies would benefit from early field trial experience.
Technical – need to find cheaper materials – i.e. electrodes and proton exchange membrane, and a technology that is both efficient and operates at close to ambient temperatures and pressures. Need for fuelling infrastructure if fuel cell vehicles to be widespread. Need to prove durability and reliability of all fuel cells types (PEM, SOFC, MCFC).
Public procurement, regulations. G8 support for IPHE? Development of standards? Support for field trials.
Gas turbines Less carbon intensive than coal for power production.
Currently in use, but research could provide efficiency improvements.
Market – not yet cost-competitive due to differing levels of regulation. Significantly affected by gas price fluctuations
Explore at international level regulatory burdens / incentives blocking full entry onto markets.
Geothermal Few GHG emissions. Currently in use. Conventional geothermal and ground source heat pumps are mature technology. Hot Dry Rock is still at research/demonstration phase.
Technical – Hot Dry Rock seen as unlikely to be cost effective in UK. Very few UK sites with worthwhile resource.
Encourage others to support Geothermal, as with all promising technologies, but no direct UK interest.
Hybrid vehicles Transport responsible for about 25% of global CO2 and increasing. ‘Well to wheels’ vehicle efficiency is 15% - hybrid ehicles doubling this.
Currently in use. Some vehicles already on market – cost premium around 25% but reducing.
Market – Poor public perceptions of performance –but is rapidly changing High capital cost. Few models on the market.
Voluntary agreements with international industry groupings, like the EU and European; Japanese and Korean car manufacturers
Hydrogen (biomass, or fossils with CCS)
No GHG emissions when produced from non-carbon sources.
Research Development over next 10 - 40 years, but pyrolysis and gasification is here now.
Technical - especially related to hydrogen storage and transport (billions required for new infrastructure).
Exempt hydrogen from fuel duty for a limited period to encourage further development and take up. Prizes for development of solutions to bottleneck of energy storage
Methane CH4 is potent GHG; emissions abundant in developing world
Currently in use. Economics are poor in absence of carbon market regime.
Expansion of methane to markets initiative. Expansion of CDM projects and programmatic approaches
Nuclear fission No GHG emissions. Currently in use. Development: 4th generation due in 2030.
Pre-commercial / market – need international demonstration of modular reactors 500-1000MW, and the development of an internationally accepted “type approval” licence regime.
Action to keep open nuclear option. The Government’s skills and research initiatives will help maintain nuclear power as an option into the future and, equally importantly, benefit current generation, decommissioning and

44 Jose Alberto Garibaldi – July 8th, 2007. Revised Draft.
Potential for addressing climate change
Development stage Barriers (e.g. technical, market etc)
Areas for further action?
Widespread public resistance to nuclear power. waste issues. Nuclear fusion No GHG emissions.
Potential large-scale supplier of baseload electricity
Research concept only. Due next 40 years – consistent with other very early, speculative technologies.
Technical – in particular, materials science, containment, plasma stability. Big international facilities required to address these (ITER, IFMIF) - delays on ITER site decision threaten progress. Key issue is reliability and availability which relies on confirming there are sufficiently robust materials.
Help get key next steps in place, i.e. ITER and the smaller International Fusion Materials Testing Facility.
Off-shore wind No GHG emissions Development First two Round 1 UK offshore windfarms built at N Hoyle (N Wales) and Scroby Sands (Norfolk). Further R1 projects will come onstream in 2005-07. Larger Round 2 projects expected 2007-12
Pre-commercial / market – large demonstrations of 5MW turbines to get economies of scale in manufacture and deployment. Attracting private investment – investors wary as support regime in UK has been undertain. Grid connection issues – infrastructure and who pays for connection.
Reinforce political signals to reassure investors. Address access to grid issues.
On-shore wind No GHG emissions. Currently in use. Pre-commerical – incremental development to improve efficiency and reduce costs. Requirement for upgrade of transmission grid to transport electricity from remote areas to population centres (and associated infrastructure costs). Investment needs to be incentivised. Planning
process needs accelerating.
Concerns over interaction between wind farms and civil and defence radar.
Reinforce political signals to reassure investors. Improve interconnections and grid stability R&D into dispatch and stability Address centralized generation + grid anti wind bias in many countries trough regulatory action Ease process for land use and deployment
Solar pholtovoltaic
No GHG emissions. Currently in use globally but limited to niches. Further development over next 30 years may yield new generation PV with greater deployment potential.
Market – for current generation cost is prohibitive for unsubsidised installation (plus inadequate numbers of trained installers). Technical - 3rd generation involves nano-materials and silicon alternatives; needs long- term research
Boost R&D for 3rd generation. Public procurement. Export credit agency conditions.
Thermal solar low
No GHG emissions. Currently in use. Suitable for hot water production for domestic use
Market – current high cost to consumers as need boiler installation.
Initial subsidies / tax relief (policies that mainstreamed technology).

45 Jose Alberto Garibaldi – July 8th, 2007. Revised Draft.
Potential for addressing climate change
Development stage Barriers (e.g. technical, market etc)
Areas for further action?
temperature heating
Market transformation policies Large scale programmatic approaches in developing countries
Thermal solar electricity
No GHG emissions. Capable of meeting world demand using less than 1% of land for crops& pastures.
Development and demonstration Technology still not fully developed Expand scale of R&D and deploy strategic programs in parallel to increase learning gainsEncourage international co-operation (e.g. through GEF)
Tidal power – barrage and stream
No GHG emissions Tidal barrage currently in use (in France and with deployment support being explored UK and others). Tidal stream in early demonstration phases - two full scale prototype devices built and demonstrated in the UK to date. One device in Norway.
Market – unknown performance in use means insufficient interest form the private sector to invest at scale.
Investment in R&D to become cost competitive without subsidy. UK could offer to lead, on behalf of G8, efforts to develop marine energy resource for small islands and coastal states
Wave power No GHG emissions. Development / Demonstration. One full-scale prototype has been successfully deployed at the European Marine Energy Centre in Orkney – first grid power supplied in August 2004.
Market – unknown performance in use means insufficient interest form the private sector to invest at scale. Technical - for earlier-stage technologies uncertainties as to which will work and become cost-competitive. Cost of producing first batch for nearer market technologies is high.
Financial incentives to stimulate first batch production and possibly feed-in tarrifs. Development support for earlier stage technologies Investment in R&D to become cost competitive without subsidy.

46 Jose Alberto Garibaldi – July 8th, 2007. Revised Draft.