a progressive damage methodology for residual strength
TRANSCRIPT

June 1998
NASA/TM-1998-207646
A Progressive Damage Methodology forResidual Strength Predictions of NotchedComposite Panels
Timothy W. Coats and Charles E. HarrisLangley Research Center, Hampton, Virginia

The NASA STI Program Office ... in Profile
Since its founding, NASA has been dedicatedto the advancement of aeronautics and spacescience. The NASA Scientific and TechnicalInformation (STI) Program Office plays a keypart in helping NASA maintain thisimportant role.
The NASA STI Program Office is operated byLangley Research Center, the lead center forNASAÕs scientific and technical information.The NASA STI Program Office providesaccess to the NASA STI Database, thelargest collection of aeronautical and spacescience STI in the world. The Program Officeis also NASAÕs institutional mechanism fordisseminating the results of its research anddevelopment activities. These results arepublished by NASA in the NASA STI ReportSeries, which includes the following reporttypes: · TECHNICAL PUBLICATION. Reports of
completed research or a major significantphase of research that present the resultsof NASA programs and include extensivedata or theoretical analysis. Includescompilations of significant scientific andtechnical data and information deemedto be of continuing reference value. NASAcounter-part of peer reviewed formalprofessional papers, but having lessstringent limitations on manuscriptlength and extent of graphicpresentations.
· TECHNICAL MEMORANDUM.
Scientific and technical findings that arepreliminary or of specialized interest,e.g., quick release reports, workingpapers, and bibliographies that containminimal annotation. Does not containextensive analysis.
· CONTRACTOR REPORT. Scientific and
technical findings by NASA-sponsoredcontractors and grantees.
· CONFERENCE PUBLICATION.
Collected papers from scientific andtechnical conferences, symposia,seminars, or other meetings sponsored orco-sponsored by NASA.
· SPECIAL PUBLICATION. Scientific,
technical, or historical information fromNASA programs, projects, and missions,often concerned with subjects havingsubstantial public interest.
· TECHNICAL TRANSLATION. English-
language translations of foreign scientificand technical material pertinent toNASAÕs mission.
Specialized services that help round out theSTI Program OfficeÕs diverse offerings includecreating custom thesauri, building customizeddatabases, organizing and publishingresearch results ... even providing videos.
For more information about the NASA STIProgram Office, see the following:
· Access the NASA STI Program HomePage at http://www.sti.nasa.gov
· E-mail your question via the Internet to
[email protected] · Fax your question to the NASA Access
Help Desk at (301) 621-0134 · Phone the NASA Access Help Desk at
(301) 621-0390 · Write to:
NASA Access Help Desk NASA Center for AeroSpace Information 7121 Standard Drive Hanover, MD 21076-1320

National Aeronautics andSpace Administration
Langley Research CenterHampton, Virginia 23681-2199
June 1998
NASA/TM-1998-207646
A Progressive Damage Methodology forResidual Strength Predictions of NotchedComposite Panels
Timothy W. Coats and Charles E. HarrisLangley Research Center, Hampton, Virginia

Available from the following:
NASA Center for AeroSpace Information (CASI) National Technical Information Service (NTIS)7121 Standard Drive 5285 Port Royal RoadHanover, MD 21076-1320 Springfield, VA 22161-2171(301) 621-0390 (703) 487-4650

1
A PROGRESSIVE DAMAGE METHODOLOGY FOR RESIDUALSTRENGTH PREDICTIONS OF NOTCHED COMPOSITE PANELS
Timothy W. CoatsResident Research AssociateNational Research Council
and
Charles E. HarrisChief Technologist for Structures and Materials
NASA Langley Research CenterHampton, VA 23681
ABSTRACT: The translaminate fracture behavior of carbon/epoxy structural laminates
with through-penetration notches was investigated to develop a residual strength prediction
methodology for composite structures. An experimental characterization of several
composite materials systems revealed a fracture resistance behavior that was very similar to
the R-curve behavior exhibited by ductile metals. Fractographic examinations led to the
postulate that the damage growth resistance was primarily due to fractured fibers in the
principal load-carrying plies being bridged by intact fibers of the adjacent plies. The load
transfer associated with this bridging mechanism suggests that a progressive damage
analysis methodology will be appropriate for predicting the residual strength of laminates
with through-penetration notches. A progressive damage methodology developed by the
authors was used to predict the initiation and growth of matrix cracks and fiber fracture.
Most of the residual strength predictions for different panel widths, notch lengths, and
material systems were within about 10% of the experimental failure loads.
KEY WORDS: composites, damage, matrix cracks, fiber fracture, internal state
variable, residual strength.

2
NOMENCLATURE
ao Initial Half Crack Length (Before Damage), cm
E11 Lamina Longitudinal Modulus, GPa
E22 Lamina Transverse Modulus, GPa
G12 Lamina In-Plane Shear Modulus, GPa
L Length, cm
P Applied Far-Field Load, kN
Qijkl Ply-Level Reduced Moduli, GPa
Sxcr Lamina Critical Longitudinal Strength, MPa
Sxycr Lamina Critical Shear Strength, MPa
Sycr Lamina Critical Transverse Strength, MPa
w Width, cm
aklL Internal State Variable, cm/cm
daklL Incremental Change in the Internal State Variable, cm/cm
b Monotonic Damage Growth Parameter for Mode I Matrix Cracking
eklL Local Strain, cm/cm
ecr11 Critical Longitudinal Uniaxial Strain, cm/cm
ecr22 Critical Transverse Uniaxial Strain, cm/cm
g Monotonic Damage Growth Parameter for Fiber Fracture
go12 Yield Shear Strain, cm/cm
gcr12 Critical Shear Strain, cm/cm
n12 Lamina Poisson's Ratio
s Applied Far-Field Stress, MPa
sijL Longitudinal Ply Stress, MPa
y Monotonic Damage Growth Parameter for Mode II Matrix Cracking
3
INTRODUCTION
Structural damage tolerance has been an underlying issue driving much of the research
in laminated composite materials. Damage tolerance is broadly defined as the attribute of a
structure that permits it to retain its required residual strength for a period of usage after the
structure has sustained specific levels of fatigue, corrosion, accidental or discrete source
damage. Continuous fiber-reinforced composite materials are generally fatigue and
corrosion resistant and are typically designed to be tolerant of nonvisible impact damage
and fail-safe from discrete source damage accidents such as an uncontained engine failure.
The design of a damage tolerant structure requires a methodology capable of determining
the residual strength of a major structural component after damage. Historically, metallic
airframe primary structures have been designed to sustain large crack-like through-
penetrations, such as a 2-bay skin crack with a broken frame, that characterize the threat of
an uncontained engine failure. Composite primary structures must also be designed for the
same threats as metallic structures. Therefore, methodology must be developed to
determine the residual strength of a composite structure with through-penetration damage.
Significant prior research has been conducted to characterize the damage tolerance of
composite materials and structures. Fracture toughness and residual strength of various
fibrous composites was studied by Poe [1]. Poe found in his investigations of brittle
laminated composites that linear elastic fracture mechanics (LEFM) could be used to
determine the fracture toughness of notched composite panels. These results were accurate
only when damage at the notch-tips was small. Harris and Morris [2] conducted studies on
translaminate fracture in thick notched composite laminates in which they determined the
influence of stacking sequence and the role of delamination. They used x-ray radiographs
and fractographs of deplied specimens to observe the extent of fiber fracture, matrix
splitting, and delamination in thin (8 plies) and thick (120 plies) laminates. It was found
that the substantial matrix splitting and delaminations that occurred in the thin laminates
occurred only in the outer surface layers for the thick laminates. The interior plies of the

4
thick laminates exhibited a self-similar fracture that was uniform and relatively free of
delaminations. Harris [3] also conducted an investigation into the use of crack-tip opening
displacement with a Dugdale-type model to predict notched laminate strength. Similar
investigations by Poe et al. [4], using the deply technique, revealed the ply-by-ply fiber
fracture occurring prior to complete laminate failure. Poe et al. [5] also found that LEFM
predictions were too conservative, but damage growth resistance curves (R-curves)
determined from unstiffened panels resulted in reasonably accurate predictions of notched
composite panels with straps and stiffeners.
The characterization of damage in notched composite laminates has also led to the
development of progressive damage models to predict damage initiation, damage growth,
and residual strength. Chamis [6] studied structural characteristics such as natural
frequencies and buckling loads and the corresponding mode shapes during progressive
fracture of angle-plied polymer matrix composites. Chamis also predicted residual strength
of laminates using a finite element formulation. This study concluded that the individual
nature of the structural change was dependent on laminate configuration, fiber orientation,
and the boundary conditions. Talreja [7,8] proposed a model that incorporated internal
state variables (ISV's) for matrix cracks and delaminations and exhibited ply stacking
sequence dependence. The ISV's are strain-like quantities which represent the damage as
volume averaged quantities. Ladeveze [9] also developed a progressive damage
methodology employing the basic concepts of continuum damage mechanics. Ladeveze
and co-workers have employed internal state variables to quantify the damage state and to
vary the material moduli. This approach was utilized to model fiber fracture, matrix
cracking, fiber-matrix debonding, and delamination in composite laminates and woven
composites loaded in tension. Chang et al. [10,11] used a progressive damage analysis to
predict damage growth and failure of an open-hole tension composite specimen. The
failure analysis consisted of property degradation models and failure criteria for matrix
cracking as well as fiber and fiber-matrix shearing failure.
5
Allen and Harris developed a damage-dependent constitutive model [12-15] which
utilizes kinematic-based volume averaged damage variables to represent the effects of
matrix cracking and fiber fracture. This model has a matrix crack growth law for fatigue as
well as monotonic tension. The kinematic effects of delaminations are modeled
empirically. An experimental verification of the accuracy of the model to predict stiffness
loss in toughened matrix composite systems was documented by Coats [16].
The objective of the research reported herein is to develop a progressive damage
methodology capable of predicting the residual strength of continuous fiber-reinforced,
laminated, polymer matrix composites with through-penetration damage. The fracture
behavior of center-crack tension panels, see Figure 1, with thin crack-like slits was studied.
Since fibers are the major load-carrying constituent in polymer matrix composites,
predicting the residual strength of a laminate requires a criterion for fiber fracture. The
effects on fiber strain due to other damage mechanisms such as matrix cracking and
delaminations must also be modeled. Therefore, the research herein examines the damage
mechanisms involved in translaminate fracture and identifies the toughening mechanisms
responsible for damage growth resistance in brittle epoxy matrix systems. The mechanics
of matrix cracking and fiber fracture are discussed as is the mathematical framework for the
progressive damage model developed by the authors. The progressive damage analysis
algorithms have been implemented into a general purpose finite element code [17]
developed by NASA, the Computational Structural Mechanics Testbed (COMET).
Damage growth is numerically simulated and the analytical residual strength predictions are
compared to experimental results for a variety of notched panel configurations and materials
systems.
In this paper, first the details of the various experiments conducted are presented along
with a discussion of the fracture behavior exhibited by the composite panels. Next, the
progressive damage methodology is presented. This includes a discussion on the nonlinear
damage-dependent constitutive model, the structural analysis algorithm and failure

6
mechanics, and some details of the finite element analysis. After comparing the predicted
values of residual strength to the experimental values, a discussion of the computational
results addresses the issues of material property sensitivities and model accuracy.
EXPERIMENTAL CHARACTERIZATION
Experimental Procedure
Material and Specimen Configuration
Center-notch tension panels used in the experimental characterizations were 91 cm
wide, 230 cm long, and had a notch length of 22.86 cm. A typical center-notch tension
(CNT) specimen is shown in Figure 1. After the panels were fractured in an experimental
characterization, the undamaged material was used to make smaller specimens that were
10.16 cm and 30.5 cm wide. The 10.16 cm wide panels had notch lengths of 1.27 cm and
2.54 cm. The 30.5 cm panels had notch lengths of 7.62 cm. These dimensions were
chosen to characterize panels with two (2a/w) ratios and to observe panel width effects.
The notches were made using an ultrasonic cutter. This process resulted in notches that
were 0.5 mm wide and notch-tips that were not smooth radial notch-tips.
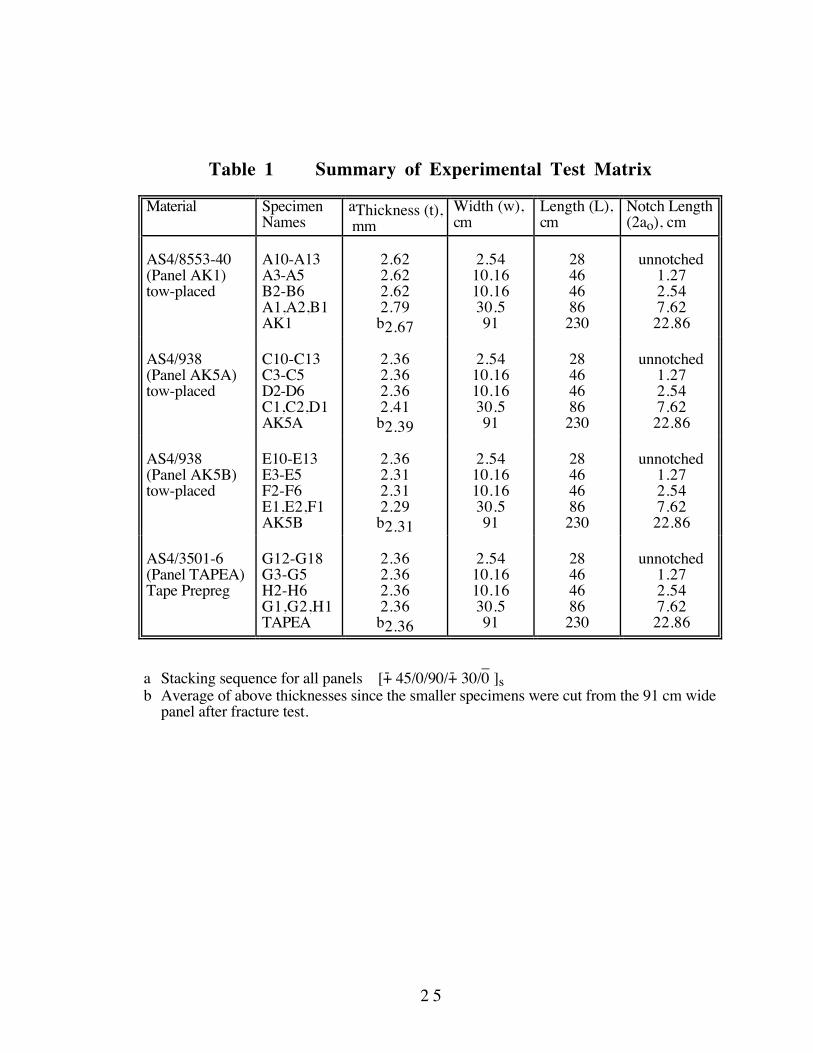
For each panel configuration, the fracture behavior of the AS4/8553-40, AS4/938, and
AS4/3501-6 material systems was investigated. The laminate stacking sequence was
[-+ 45/0/90/-+ 30/0- ]s for all panels and material systems. The AS4/3501-6 panels were
manufactured using a prepreg tape while the other panels were manufactured using a tow-
placement technique. The 8553-40 resin is a toughened resin and the other resins are
conventional epoxies. All the test materials with their test identification names, material
identifications, dimensions, and manufacturing techniques are summarized in Table 1.
The constituent materials were not available to evaluate the lamina material properties,
and since a complete and consistent set of data for the lamina material properties was not
available, the lamina material properties were obtained from various references in the
literature and are summarized in Table 2. Lamina properties for AS4/3501-6 were taken

7
from ASTM STP 1156 [18] while AS4/938 and AS4/8553-40 lamina properties were taken
from Boeing test data [19]. Fiber volume fraction for each of the 91 cm wide panels was
measured by the authors to compare with the fiber volume fractions of the materials found
in the literature. The lamina material properties for AS4/8553-40 from reference 19
correspond to a material with a fiber volume fraction of about 53%. Therefore, the rule of
mixtures was applied to obtain the lamina material properties in Table 2 for AS4/8553-40 to
adjust for the measured fiber volume fraction of 58% by the authors. Iosipescu shear test
data [20] was used to approximate quantities for the shear failure terms.
Specimen Preparation
The 10.16 cm wide notched panels and 2.54 cm wide unnotched coupons were
monotonically loaded to failure in a 222 kN servo-hydraulic testing machine. The 30.5 cm
and 91 cm wide panels were supported with anti-buckling guide plates just above and
below the notch. These specimens were loaded to failure in a 445 kN and 2220 kN servo-
hydraulic testing machine, respectively. Specimens were strain gaged and the strain data
and applied load given by the load cell were recorded during this test. A ring gage was
secured in the notch midway between the ends of the notch (x=0, y=0 in Figure 1) to
record the center-notch opening displacement.
Loading and Data Collection
As the notched panel was loaded, there were audible sounds associated with the
subcritical microcrack damage (fiber fracture, delamination, and matrix cracking local to the
notch tip). As damage progressed with increasing load, a zinc-iodide dye penetrant was
applied periodically to the notch. In-situ x-ray radiographs were taken of the right and left
notch-tip regions. The damaged material absorbed the zinc-iodide dye penetrant and is
represented in the x-ray radiograph as a blackened or shaded region in Figure 2. The panel
failed catastrophically as the load was increased. This strength at failure is called the
residual strength of the notched panel.
Some of the panels were not loaded to catastrophic failure. Instead, the specimen was

8
unloaded after taking a series of x-ray radiographs and removed from the test machine.
Then the area surrounding the notch tip was deplied. Experimental observations of fiber
fracture, matrix cracking, and delamination are discussed in the following paragraphs.
Experimental Observations of Damage Growth
The experimental techniques used in this study for observing and documenting damage
growth in the notched composite laminates were: 1) x-ray radiography of the notch-tip
damage and 2) fractographs of deplied specimens. The observations and documentation
are discussed in the following paragraphs.
X-Ray Radiography
Notch-tip damage typical of a CNT specimen was documented with x-ray radiography
and is shown in Figure 2. The x-ray radiograph in this figure was taken at 89.6% of the
catastrophic failure load at the right notch-tip of a 91 cm wide AS4/938 specimen. The far-
field strain of the panel was 2050 me when this x-ray radiograph was taken. A
dimensioned drawing of the CNT specimen is displayed to the left of the x-ray radiograph
and the actual dimensions of the x-ray radiograph are given to aid in visualizing the extent
of the notch-tip damage zone. A "dark black tear" extending from the notch-tip is identified
as fiber fracture. The surrounding shaded region is in the form of local delamination and
the thin lines extending from the notch-tip correspond to matrix cracks in the off-axis plies.
This damage state represents the damage tolerated at this load level before catastrophic
failure. The pattern and extent of damage displayed in Figure 2 was similar and typical for
the other material systems. Furthermore, there were no noticeable differences in the x-ray
radiographs between the panels made with the conventional epoxies and the panels made
with the toughened resin, 8553-40.
The applied load and the crack opening displacement (COD) at the center of the notch
was recorded and used to produce load vs. COD plots as shown in Figure 3. A schematic
of the center-notch tension panel is presented with an illustration of the loading
configuration and the location for COD measurements. The data displayed in this figure is

9
for an AS4/938 panel with a width of 30.5 cm and a notch length of 7.6 cm.
Discontinuities, or jumps, exist at various places along the load vs. COD plot where the
damage was audible during loading. The specimen was unloaded at the occurrence of each
of these discontinuities to take an x-ray radiograph. Each of the radiographs are labeled A,
B, C, and D in Figure 3. These x-ray radiographs and the corresponding loads are
provided in the plot to illustrate the amount of notch-tip damage corresponding to the
applied load at each discontinuity. The damage and the notch size shown in the x-ray
radiographs are actual size.
It was observed that for each consecutive loading, additional damage did not occur until
the loads at which previous damage had occurred were exceeded. This stable damage
growth process continued during the loading of the panel and made it possible to obtain x-
ray radiographs of the extensive notch-tip damage. The damage modes illustrated in
Figures 2 and 3 is typical of all three of the material systems investigated.
Fractography of Ply Level Damage
Five specimens were chosen to be loaded up to 84%-94% of the average ultimate
failure load. An x-ray radiograph was taken and then the notch-tip damage region was
isolated and pyrolized in an oven for about four hours at 450oC to burn out the neat resin.
The individual plies were separated and examined using a scanning electron microscope
(SEM). The SEM was used to create the fractographs in Figures 4a-4d of the left notch-tip
damage of an AS4/3501-6 panel, G4TAPEA. The damage displayed in these fractographs
resulted from a load level of about 85% of the average ultimate failure load. The
magnification is provided on each fractograph. The x-ray radiograph of the specimen is
provided for visual comparison of the two techniques for observing damage, x-ray
radiography and ply fractography.
The first 45o ply is shown in Figure 4a and the zinc iodide stain produced from the x-
ray procedure is a reliable indication of local delamination. The local delamination was
traced and a schematic is shown to the right of the fractograph. Fiber fracture is visible in

1 0
the 0o and -30o plies in Figures 4b and 4c, respecively. Again a schematic of the fiber
fracture is shown to the right of the fractographs. At this load level, there was no fiber
fracture in the -45o, +45o, +30o (Figure 4d), and of course 90o plies. Fiber fracture was
observed in the +30o plies in some of the other fractographic examinations. Local
delamination was observed at the -45o/+45o interface only. Therefore, for this panel at
85% Sult, local delaminations are primarily surface ply delaminations. The extent and
types of damage shown in Figure 4 is representative of what was observed in all of the
other fractographic examinations.
Isolation of Toughening Mechanisms
The fracture behavior of the laminates in this study illustrates an obvious toughening
behavior shown in the sequence of x-ray radiographs of Figure 3 for the CNT panel. As
the tensile load is monotonically increased, a zone of microcrack damage develops at the
notch tip and progresses with increasing load. Examinations of the radiographs, and
companion deply results performed for a few selected specimens, clearly show a well
defined pattern of fiber fracture in the 0o and 30o plies that extends a significant distance
from the notch before final translaminate fracture takes place. The pattern of fiber fracture
is collinear with the notch length and resembles the crack extension due to stable tearing
which ductile alloys exhibit prior to fracture [21,22]. In the case of a ductile alloy, stable
crack growth is the result of crack growth resistance which is due to the effects of large-
scale metal plasticity. In the case of the composite, stable damage growth is the result of
damage growth resistance which is due to two known toughening mechanisms: 1) the load
redistribution (local stress relief) resulting from the microcracks and 2) the load transferred
by the intact fibers of the off-axis plies that are adjacent to the principle load-carrying plies
with broken fibers (ply bridging). Ply bridging is evident from examining the ply
fractographs in Figure 4. Because the +45o ply in Figure 4a has not fractured and there is
no observable delamination in the +45o/0o ply interface, it seems likely that load was
transferred from the fractured 0o ply in Figure 4b to the intact +45o ply in Figure 4a.

1 1
Similarly, it seems likely that load was transferred from the fractured -30o ply in Figure 4c
to the intact +30o ply in Figure 4d. A progressive damage model has been developed that
accounts for these toughening mechanisms and is discussed in the following paragraphs.
PROGRESSIVE DAMAGE ANALYSIS
A nonlinear damage dependent constitutive model has been implemented into a multi-
purpose finite element code [17] and a computational procedure has been developed to
predict residual strength. The progressive damage methodology is applicable to any
laminate stacking sequence and the finite element analysis uses quadrilateral shell elements
to analyze general structural geometries.
Nonlinear Damage-Dependent Constitutive Model
A nonlinear, damage-dependent constitutive model was developed by Allen and Harris
[12-14] to model the behavior of microcrack damage in brittle epoxy systems and has been
extended to toughened polymer systems. The model predicts the formation of intraply
matrix cracks and fiber fracture for monotonic tensile loading and for tension-tension
fatigue (not discussed herein), the associated ply level stress and strain states, and the
residual strength of laminates. In order to rigorously predict the initiation and growth of
delamination, three-dimensional stress states such as those at the laminate free edges must
be calculated. The analysis currently does not have this capability. The Allen-Harris model
has an empirical relationship that can account for the effects of delaminations on load
redistribution in a laminate. This empirical relationship requires the user to specify the
location and extent of delamination. This approach does not contribute to the authors' goal
to develop a damage dependent finite element analysis using only lamina material
properties, therefore, delamination is not modeled in the present analysis. Complete details
of the mathematical formulation and various aspects of the model are available in references
[12-17] and will not be presented here.
The constitutive model uses internal state variables (ISV) to represent the average

1 2
effects of local deformation due to the various modes of microcrack damage. This concept
is called continuum damage mechanics. The constitutive model for a local volume element
may be written as [12]
ij ijkl LL kl kls e a= -{ }Q (1)
where sijL are the locally averaged components of stress, Qijkl are the ply-level reduced
moduli, and eklL are the locally averaged components of strain. The internal state
variables, aklL, represent the local deformation effects of the various modes of damage.
When the material is subjected to quasi-static (monotonic) loads, the incremental change of
the internal state variable is assumed to be
kl
kl kl kl
kl klL
L L crit
L crit
df if
ifae b g y e e
e e=
( ) ³
£
ìíï
îï
, , ,
0(2)
where eklcrit is the critical tensile failure strain and b,g, and y are scale factors that describe
the load carrying capability of the material after the occurrence of mode I (opening mode)
matrix cracking, fiber fracture, and mode II (shear mode) matrix cracking, respectively.
The physical interpretation of equation (2) is as follows: as long as the strains in a material
element (local volume element or finite element) are less than the critical strains, eklcrit, no
damage exists and the internal state variables have a zero value. When the strains reach
their critical value, the element is damaged and this damage is represented by an internal
state variable whose value is proportional to the local strain. The proportionality is
dependent on the scale factors b, g, and y. Based on these assumptions, when fiber
fracture, mode II matrix cracking, or mode I matrix cracking occur in a ply within an
element, the longitudinal, shear, and transverse stresses for that ply in that element are
s11 = gSxcr (3)
s12 = ySxycr (4)
s22 = bSycr , (5)
where Sxcr , S
xycr , and S
ycr are the lamina longitudinal, shear, and transverse critical
strengths, respectively. Note that damaged elements are not removed. Instead, the value

1 3
of the internal state variable in the damaged elements increases proportionately with strain
such that equations (3), (4), and (5) are not violated.
Progressive Damage and Residual Strength Methodology
Structural Analysis Algorithm
The damage dependent constitutive equations (1) are substituted into the laminate
resultant force and moment equations to produce damage dependent laminate resultant force
and moment equations [23]. These equations are substituted into the plate equilibrium
equations resulting in a set of governing differential equations which can be integrated
against variations in the displacement components to produce a weak form of the damage-
dependent laminated-plate equilibrium equations [17, 23]. By substituting displacement
interpolation functions into the weak form of the plate equilibrium equations and following
well known finite element procedures, the assembled equilibrium equations are obtained as
[K] {d} = {FA} + {FD} (6)
where [K] is the original global stiffness matrix, {d} is the global displacement vector,
{FA} is the applied force vector, and {FD} is the damage induced force vector. Since the
effects of damage are represented as damage-induced force vectors on the right hand side of
equation (6), the element stiffness matrix need not be recalculated as damage progresses as
long as the nonlinearity in the load-deflection curve is not large.
The progression of damage is predicted by an iterative and incremental procedure
outlined in the flow chart shown in Figure 5. This entire progressive failure analysis
scheme has been implemented into the finite element formulation in the NASA
Computational Mechanics Testbed (COMET) [17] computer code. The first block of
Figure 5 is a description of the information needed as model input (block numbers are
shown in the right hand bottom corner of each block). Blocks 2 and 3 are COMET
processors that calculate and assemble the elemental stiffness matrices and factor the global
stiffness matrix. In block 4, the damage induced force vector for the current damage state
is then combined with the applied force vector to update the global force vector [17]. Block
1 4
4 is called the damage resultant force (DRF) processor [17] and is part of the damage
dependency that was implemented into the finite element analysis. Using the updated
global force vector, COMET solves for global displacements, {d}, in block 5 using
equation (6).
The element stress resultants are calculated by COMET processors in block 6. The ply-
level stresses, strains, and damage are calculated in block 7 using a processor called
damage growth increment (DGI) and is the other part of the model's damage dependency
that was implemented into the finite element analysis. The final computational result of
processor DGI, block 8, is the updated damage state and post-processed ply-level stresses
and strains. Processor DGI uses equations (1) and (2) to compute and update the damage
state.
The equilibrated solution is obtained when the damage-induced force vector and the
change in displacements become negligible. If the solution shows that equilibrium is
established, then the next load increment is applied. If equilibrium is not established, then
iteration is performed holding the loads at the current level. As the applied load approaches
the catastrophic failure load, the number of iterations required to establish equilibrium
increases. This is because the strains in the surrounding undamaged elements approach
critical values. In the process of iteration, displacement increases lead to increases in strain
levels in these elements and the strains may exceed the failure strains. Therefore, damage
may grow from one iteration to the next. Eventually, as loads increase, a load level will be
reached where equilibrium is unattainable. This value of load is defined to be the
catastrophic failure load.
Failure Mechanics
The monotonic damage growth parameters (b, y, and g) can be complicated algebraic
functions describing the complex behavior of load redistribution due to matrix cracking and
fiber fracture. However, for the purpose of developing the framework for this progressive
damage methodology, simple constants were chosen for the parameters. So for this

1 5
analysis, the damage growth law parameters govern the load redistribution in a way that is
similar to the ply discount method. It is not reasonable to assume a 100% load
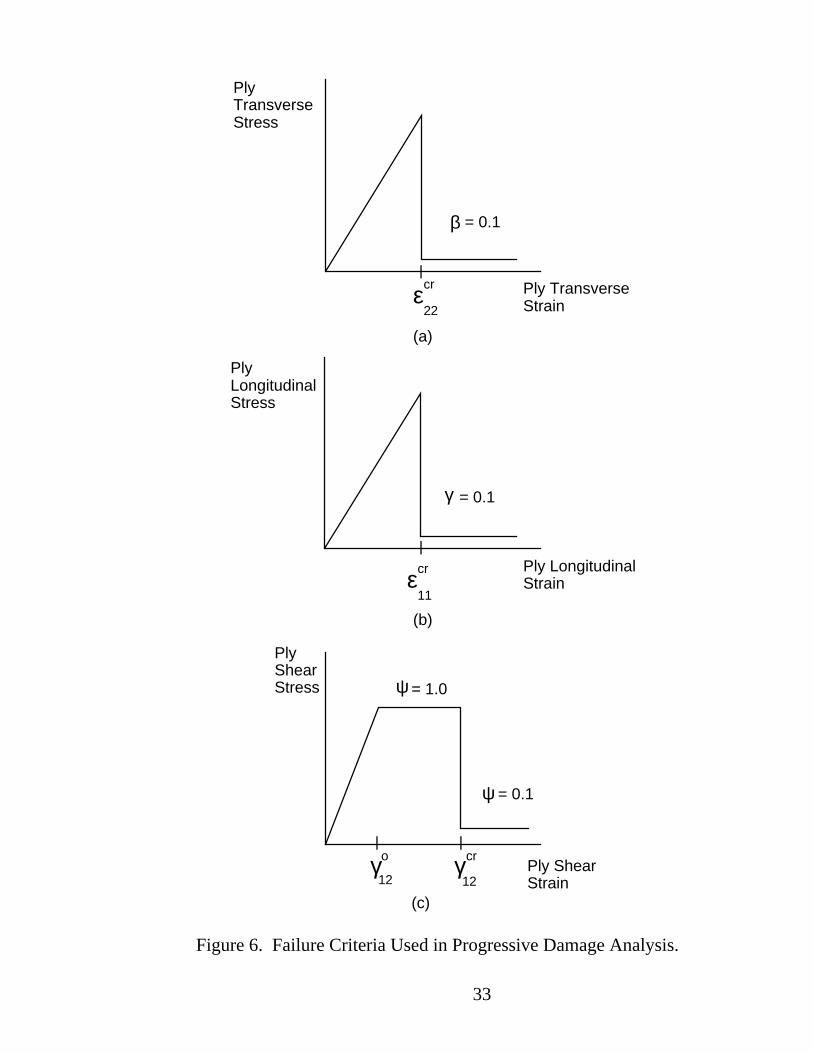
redistribution at the instant of failure for mode I matrix cracking and tensile fiber fracture.
Therefore, a 90% load redistribution was assumed, i.e. the local ply stress is only 10% of
the critical ply strength (b = 0.1 and g = 0.1). As the applied load increases, mode I matrix
cracking and tensile fiber fracture internal state variables increase in proportion to the local
strains. This results in a constant stress level (10% of the critical ply strength) in the
damaged plies, illustrated in Figures 6(a) and 6(b), with the load redistributing to the
surrounding plies and elements.
Based on Iosipescu shear data [20], there is a shear strain ( go12 ) where the behavior is
no longer linear and becomes almost perfectly plastic. At this strain level, y is equal to 1.0
to simulate elastic-perfectly plastic shear stress/strain behavior as illustrated in Figure 6c.
This implies that as the applied load increases, the damaged ply carries 100% of the critical
shear strength while the additional stress transfers to the surrounding plies and elements.
When the shear strain becomes catastrophic (gcr12 ), y is assumed to be equal to 0.1. The
load redistribution for shear is now similar to the case for mode I matrix cracking.
The material property descriptions required for the model include standard ply stiffness
and strength data determined in the conventional manner for classical lamination theory
[24]. Under monotonic tension loading, the model uses only the fiber failure strain and
matrix failure strain determined from unidirectional laminate data to predict progressive
damage and residual strength. These properties are listed in Table 2 for the three material
systems investigated in this study. The model also uses matrix failure shear strain.
Iosipescu shear data [20] was used to approximate the values of go12 and gcr
12 to be 1% and
10%, respectively.
Finite Element Analysis
The [ _+ 45/0/90/
_+ 30/0
_ ]s laminate was modeled with ply thicknesses of 0.1828 mm.
In this two-dimensional analysis, symmetry boundary conditions (v=0 on the y=0
1 6
centerline and u=0 on the x=0 centerline from the notch tip to the panel's edge) were used
to model one-quarter of the panel as shown in Figure 7. Four node quadrilateral EX47
shell elements in the COMET code were used to model the panel.
Since the individual plies of the angle-ply laminate were modeled discretely, effects of
the symmetry assumptions on the results were investigated. The results of modeling a
complete 10.2 cm panel with a 2.54 cm notch were compared to the results of modeling
one-quarter of the panel with quarter symmetry. Before damage initiation, the strain,
stress, and displacements at the free edge and near the notch-tip differed by much less than
one percent between the full model and the quarter symmetry model. Loads were then
applied monotonically until catastrophic failure and the failure strengths differed by only
three percent. Thus one-quarter panel models were used for all predictions reported herein.
The tensile loading is applied at increments of 35 N/cm (2lb/in.). Load increment
sensitivity was not an issue since the model predicted the same strength for two different
loading increments, 35 N/cm and 17.5 N/cm.
Mesh Refinement Issues Related to the Center-Notch Geometry
The notch was machined with an ultrasonic cutter which resulted in notches that did not
have smooth radial notch-tips. The drawings in Figure 8 show two different finite element
mesh configurations modeling the notch-tip, mesh 1 and mesh 2. These drawings are not
to scale.
The first notch-tip configuration, mesh 1, has no radius and results in a stress
singularity at the notch-tip. A finite element mesh refinement study was conducted for
mesh 1. The numerical results showed that very coarse meshes resulted in significantly
over-predicted values of residual strength and very fine meshes significantly under-
predicted the residual strength values, relative to the average experimental values. These
results are as expected because solutions for mesh 1 do not converge with mesh refinement
due to the stress singularity at the notch-tip. Therefore, the first ply failure load decreases
as the notch-tip element size decreases. The premature fiber fracture, represented by an

1 7
internal state variable, results in a higher compliance and an artificially low residual strength
prediction.
A mesh refinement study was performed for mesh 2 and a converged stress
concentration and solution was obtained. However, very small elements were required to
model the radius of the notch so the model consisted of a large number of elements. This
resulted in a finite element model with large degrees of freedom and hence required more
computer resources for the analysis. Furthermore, because of the very small elements
surrounding the notch in mesh 2, the notch-tip strains were much greater than in mesh 1.
As a result, damage initiated at a lower applied load level increasing the compliance and the
computed rate of damage progression. For these reasons, the authors decided to use mesh
1 to understand the effect element size had on the residual strength predictions.
The strong dependence on element size exhibited by the residual strength predictions is
probably due to the local volume averaging approach employed by the model to specify the
values of the ISV damage parameters. The averaging procedure indirectly introduces a
length-scale parameter into the damage representation. This is analogous to the point stress
or average stress models proposed by Whitney and Nuismer [25,26] which use the
unnotched laminate strength and a characteristic distance to predict fracture. The length
scale parameter was accounted for in this model by selecting a notch-tip element size that
yielded residual strength predictions within a few percent of the experimental results for the
10.2 cm wide panel with the 2.54 cm notch. This notch-tip element size was then used in
the analysis for all panel widths, notch sizes, and material systems.
EXPERIMENTAL AND COMPUTATIONAL RESULTS
Residual Strength of Center-Notch Tension Panels
Figure 9 presents the extent of damage predicted by the analytical model for the 91 cm
wide AS4/938 panel. A dimensioned drawing of the center-notch panel is shown at the top
left with a small box drawn around the notch-tip region that represents the approximate area

1 8
covered by the mesh displayed to the right of the drawing. The mesh uses shaded
elements, providing a damage contour, to represent the modeled damage at 88% of the
predicted ultimate failure load. The damage contour in Figure 9(a) illustrates the ply-level
fiber fracture in the elements near the notch-tip. Mode I and mode II matrix cracking are
illustrated in Figures 9(b) and 9(c), respectively. An interesting observation of Figure 9(a)
is that the -45o ply exhibits much less progression of fiber fracture than the +45o ply. This
is a numerical result of using a strain failure criterion to initiate damage. If a uniaxial tensile
load is applied to an unnotched composite laminate, e1 equals e2 for the +45o and -45o
plies. If the laminate has a notch, then the resultant laminate shear force is no longer equal
to zero, and e1 does not equal e2 within a 45o ply. Instead, e1 of the -45o ply is equal to e2
of the +45o ply, and e2 of the -45o ply is equal to e1 of the +45o ply. The result is as
shown in Figure 9(a), fewer fibers in the -45o ply failed because e1 in the -45o ply barely
exceeded the critical strain. These strains did eventually become critical as the applied load
approached the load at which equilibrium was unattainable (previously defined as the
catastrophic failure load).
These figures were drawn for an equilibrated solution and illustrate the capability in the
analysis to model stable damage growth. Fiber fracture has extended nominally 2.7 cm
from the notch-tip. Mode I and mode II matrix cracking has progressed to 3.2 cm and 3.0
cm, respectively. Excluding delamination, the stable damage growth illustrated in these
figures is qualitatively similar to what was observed in the experiments. There are elements
with fractured plies adjacent to intact plies and mode I matrix cracking occurs in many more
elements than the other modes of damage.
Stable damage growth is the result of damage growth resistance which is illustrated for
the 91 cm wide AS4/938 panels in Figure 10 where the experimental R-curve is compared
to the analytical predictions. A discussion on effective damage growth and the details of
how to quantify damage growth resistance in an R-curve is provided in the Appendix. The
model predicted a substantial amount of stable fiber fracture for the 91 cm wide panel. The

1 9
trend of the analytical results is similar to the experimental R-curve. The R-curve is the
average of the experimental data shown in the plot. The analytically predicted data points
are represented by the dark filled circles. The predicted effective damage growth is
approximately equal to the length of predicted fiber fracture. It is evident from this plot that
the progressive damage methodology presented here predicts damage growth resistance
well.
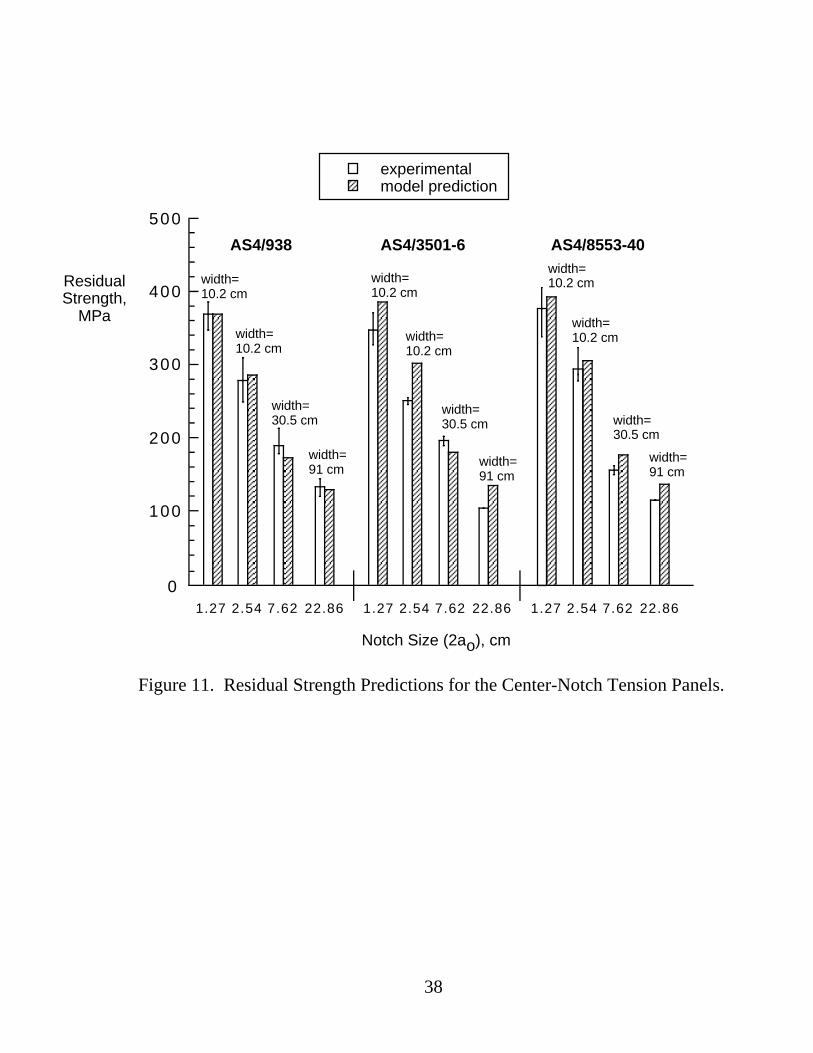
The residual strength predictions are illustrated in Figure 11 where the experimental
bars are the average of the three replicate tests, with the high and low values indicated for
each experimental entry in the bar chart. (The AS4/3501-6 and the AS4/8553-40 laminates
with the 9 inch notch had only one experimental value. The other AS4/3501-6 laminates
had only two experimental values). Most of the predictions are within +_ 10% of the
experimental average values. The overall experimental data trends are accurately predicted
by the analytical methodology. Since there is no consistent overprediction or
underprediction trend exhibited by the model results, the simple failure criteria for each
damage mechanism appears to be reasonable for the tensile fracture tests reported herein.
The fracture of the center-notch geometry exhibits a panel width and notch size effect.
This behavior is best observed by the plot of residual strength versus notch size shown in
Figure 12. The experimental average values and the model predictions are compared to the
classical linear elastic fracture mechanics (LEFM) results for the panel made of the AS4/938
material system. According to LEFM, for the same (2a/W) ratio, the ultimate strength is
inversely proportional to the square root of the half notch length. This data is plotted in
Figure 12 as the solid line labeled LEFM and was obtained by determining the fracture
toughness of the laminate from the residual strength of the smallest specimen with a (2a/W)
ratio equal to 1/4. Notice that the experimental values for the 22.9 cm notch are about 45%
higher than the LEFM based predictions. The progressive damage model correctly predicts
this increase in the fracture strength. From these results, it is obvious that the finite element
model predictions are more accurate than LEFM for wide panels where the fracture

2 0
resistance effects are dominant. This size effect is produced by toughening mechanisms
exhibited by the laminate and is correctly predicted by the progressive damage model.
DISCUSSION OF COMPUTATIONAL RESULTS
Lamina Material Property Sensitivity
A parametric study was conducted to examine the sensitivity of the predicted residual
strength to the various ply level material properties used in the analysis. The results of
several analytical case studies are reported in Tables 3 and 4 for the AS4/3501-6 material
system since the largest over-predictions were made for this material system. The
properties used in the baseline analysis are recorded in each table. The property that is
changed in cases 1 through 5 are shown in italic and bold face font. For each case, only
one property is different from the baseline properties. The resulting residual strength
predictions are given at the bottom of the column.
Notice that in Table 3, a 10% decrease in E11 (case 1) results in a 13% decrease in
strength. Furthermore, a 10% decrease in the fiber fracture critical strain (case 5) results in
an 11% decrease in residual strength. A 10% decrease in E22, G12, and ecr22 had an
insignificant effect on residual strength. These are the expected results for the tensile
fracture of a fiber dominated laminate. Case 1 and 2 of Table 4 show that one can vary the
shear failing strains by 10% with little to no effect. However, if the shear strain is not used
to initiate mode II matrix cracking as in case 3 of Table 4, the residual strength increases
significantly by as much as 24% for the case reported. This is because the longitudinal
strain in the fiber direction, e11, is dependent on the laminate resultant shear force which
includes the effects of mode II matrix cracking. These results suggest the importance of
accounting for mode II matrix cracking as well as fiber fracture, even though slight
variations in the mode II matrix cracking criterion did not affect the analytical results.
Most of the analytical predictions fell within or very near the experimental data scatter
as shown in Figure 11. Considering that the material properties may vary +_ 10%

2 1
depending on where and how they are obtained, the residual strength predictions agree well
with the experimental values with the exceptions of the 10.16 cm and 91 cm wide
AS4/3501-6 panels. Notice that the failure loads for these panels were lower than the
failure loads for the AS4/938 panels. An inspection of the lamina material properties
presented in Table 2 would lead to the conclusion that the AS4/3501-6 experimental failure
loads should have been close to the AS4/8553-40 failure loads and greater than the
AS4/938 failure loads. This was not the case. The material properties obtained from
reference [18] appear to be somewhat different than the actual material properties for the
laminates tested in this study.
Effects of Delamination on the Residual Strength
This progressive damage methodology currently does not have the capability to
rigorously model delamination. However, the experimental observations made from the x-
ray radiographs and ply fractographs provided strong evidence that the delaminations were
primarily surface ply delaminations and that fiber fracture was the dominant failure
mechanism. It was also observed that accurate analytical predictions of residual strength
were dependent primarily on the ability to model fiber fracture and mode II matrix cracking.
Based on these experimental and numerical observations, the authors believe delamination
was not a dominant failure mechanism for these laminates and that this analysis did not
need to account for the delaminations.
CONCLUDING REMARKS
An experimental investigation of translaminate fracture was conducted and a residual
strength prediction capability was developed using a progressive damage methodology. An
experimental characterization of several composite materials systems revealed occurrences
of damage growth resistance. Fractographic examinations led to the observation that this
damage growth resistance could be due to ply bridging, defined in this study as fractured
fibers of one ply bridged by intact fibers of an adjacent ply. The Allen-Harris nonlinear
constitutive model was used in a finite element code to model the matrix cracking and fiber

2 2
fracture that results from the notch-tip stresses in center-notch tension composite panels.
The fiber failure criterion used to model the progression of fiber fracture redistributes the
load so that when the ply level strain in an element of the finite element model exceeds the
fiber failure strain, the elemental ply load carrying capability is only 10% of the failure
strength. This type of fiber failure criterion resembles the ply discount method. However,
the mathematical framework exists such that any failure criterion can be implemented into
the model to simulate the nonlinear behavior due to any type or mode of damage.
Mesh refinement studies illustrated the difficulty in modeling notch-tip damage for very
thin notches with notch-tips that were not smooth radial notch-tips. This study revealed
that for the center-notch configuration, the local volume averaging of the internal state
variables introduced a length scale effect. The notch-tip element size was determined using
the results from the 10.16 cm wide panel with the 2.54 cm long notch. This element size
was used in all of the other panel and notch sizes to predict residual strengths to within +_
10% for most cases. In addition, a panel width size effect was observed in the
experiments and the model was able to accurately predict that effect. From these
observations it was concluded that the progressive damage model can predict translaminate
fracture more accurately than linear elastic fracture mechanics using only material properties
determined from the standard unidirectional laminate and Iosipescu shear test methods.
REFERENCES
[1] Poe, C.C., Jr., "A Unifying Strain Criterion for Fracture of Fibrous CompositeLaminates," Engineering Fracture Mechanics, Vol. 17, No. 2, pp. 153-171,1983.
[2] Harris, C.E. and Morris, D.H., "A Fractographic Investigation of the Influenceof Stacking Sequence on the Strength of Notched Laminated Composites,"Fractography of Modern Engineering Materials: Composites and Metals,ASTM STP 948, J.E. Masters and J.J. Au, Eds., American Society for Testingand Materials, Philadelphia, 1987, pp.131-153.
[3] Harris, C.E. and Morris, D.H.,"On the Use of Crack-Tip-Opening Displacementto Predict the Fracture Strength of Notched Graphite/Epoxy Laminates,"Experimental Mechanics, Vol. 25, No. 2, June 1985.

2 3
[4] Poe, C.C., Jr., Harris, C.E., and Morris, D.H., "Surface Crack AnalysisApplied to Impact Damage in a Thick Graphite/Epoxy Composite," Surface-Crack Growth: Models, Experiments, and Structures, ASTM STP 1060,W.G. Reuter, J.H. Underwood, and J.C. Newman, Jr., Eds., American Societyfor Testing and Materials, Philadelphia, 1990, pp. 194-212.
[5] Poe, C.C., Jr., Harris, C.E., Coats, T.W., and Walker, T.H., "TensionStrength with Discrete Source Damage," Proceedings of the Fifth NASA/DODAdvanced Composites Technology Conference, CP 3294, Vol. I, Part I, Seattle, Washington, Aug. 1994, pp. 369-438.
[6] Chamis, C.C., Murthy, P.L.N., and Minnetyan, L.,"Structural Behavior of Composites with Progressive Fracture," J. of Reinforced Plastics and Composites, Vol. 11, April 1992, pp. 413-442.
[7] Talreja, R., "A Continuum Mechanics Characterization of Damage in Composite Materials," Proc. R. Soc. London, Vol. 399A, 1985, pp. 126-216.
[8] Talreja, R., "Residual Stiffness Properties of Cracked Composite LaminateÓ, Advances in Fracture Research, Proc. Sixth Int. Conf. De Fracture, New Delhi, India, Vol. 4, 1985, pp. 3013-3019.
[9] Ladeveze, P., ÒA Damage Computational Method for Composite Structures,Ó Computers and Structures, Vol. 44, No. 1/2, 1992, pp. 79-87.
[10] Chang, K-Y, Sheng, L., and Chang, F-K, "Damage Tolerance of LaminatedComposites Containing an Open Hole and Subjected to Tensile Loadings,"J. of Composite Materials, Vol. 25, March 1991, pp. 274-301.
[11] Chang, F-K and Chang, K-Y, "A Progressive Damage Model for Laminated Composites Containing Stress Concentrations," J. of Composite Materials, Vol. 21, Sept. 1987, pp. 834-855.
[12] Allen, D.H., Groves, S.E., and Harris, C.E., "A Cumulative Damage Model for Continuous Fiber Composite Laminates with Matrix Cracking and Interply Delamination," Composite Materials: Testing and Design (8th Conference), ASTM STP 972, J.D. Whitcomb, Ed., American Society for Testing and Materials, Philadelphia, 1988, pp. 57-80.
[13] Lee, J.W., Allen, D.H., Harris, C.E., "Internal State Variable Approach for Predicting Stiffness Reductions in Fibrous Laminated Composites with Matrix Cracks," J. of Composite Materials, Vol. 23, Dec. 1989, pp. 1273-1291.
[14] Harris, C.E. and Allen, D.H., "A Continuum Damage Model of Fatigue-Induced Damage in Laminated Composites," SAMPE Journal, July/August 1988, pp. 43-51.
[15] Lo, D.C., Allen, D.H., and Harris, C.E.; "A Continuum Model forDamage Evolution in Laminated Composites," Inelastic Deformation ofComposite Materials, G.J. Dvorak, ed., Springer -Verlag, 1990, pp. 549-561.

2 4
[16] Coats, T.W. and Harris, C.E., "Experimental Verification of a ProgressiveDamage Model for IM7/5260 Laminates Subjected to Tension-Tension Fatigue,"J. of Composite Materials, Vol. 29, No. 3, 1995, pp. 280-305.
[17] Lo, D.C., Coats, T.W., Harris, C.E., and Allen, D.H., "Progressive DamageAnalysis of Laminated Composite (PDALC) (A Computational ModelImplemented in the NASA COMET Finite Element Code)," National Aeronauticsand Space Administration Technical Memorandum 4724, August 1996.
[18] Lagace, P.A., Bhat, N.V., and Gundogdu, A., "Response of NotchedGraphite/Epoxy and Graphite/Peek Systems," Composite Materials: Fatigue andFracture, Fourth Volume, ASTM STP 1156, W.W. Stinchcomb and N.E.Ashbaugh, Eds., American Society for Testing and Materials, Philadelphia,1993, pp. 55-71.
[19] Scholz, D.B., Dost, E.F., and Flynn, B.W., "Advanced Technology CompositeFuselage - Materials and Processes," National Aeronautics and SpaceAdministration Contractor Report 4731, 1995.
[20] Coquill, S.L. and Adams, D.F., "Mechanical Properties of Several Neat PolymerMatrix Materials and Unidirectional Carbon Fiber-Reinforced Composites,"National Aeronautics and Space Administration Contractor Report 181805, April1989.
[21] Dawicke, D. S., J. C. Newman, Jr., M. A. Sutton, and B. E. Amstuz, ÒInfluence of crack history on the stable tearing behavior of a thin-sheet material with multiple cracks,Ó FAA/NASA International Symposium on Advacned Structural Integrity Methods for Airframe Durability and Damage Tolerance, NASA CP 3274, Charles E. Harris, editor, National Aeronautics and Space Administration, Washington, D.C., September 1994, pp. 193-212.
[22] deWit, R., R. J. Fields, L. Mordfin, S. R. Low, and D. Harne, ÒFractureBehavior of Large-Scale Thin-Sheet Aluminum Alloy,Ó FAA/NASA InternationalSymposium on Advacned Structural Integrity Methods for Airframe Durabilityand Damage Tolerance, NASA CP 3274, Charles E. Harris, editor, NationalAeronautics and Space Administration, Washington, D.C., pp. 963-984.
[23] Buie, K.D., "A Finite Element Model for Laminated Composite Plates withMatrix Cracks and Delaminations," Thesis, Texas A&M University, December,1988.
[24] Jones, Robert, M., "Mechanics of Composite Materials," Hemisphere PublishingCorporation, 1975.
[25] Whitney, J.M. and Nuismer, R.J.,"Stress Fracture Criteria for Laminated Composites Containing Stress Concentrations," J. Composite Materials, Vol. 8, pp. 253-265, 1974.
[26] Nuismer, R.J. and Whitney, J.M.,"Uniaxial Failure of Composite Laminates Containing Stress Concentrations," Fracture Mechanics of Composites, ASTM STP 593, American Society of Testing and Materials, pp. 117-142, 1975.
[27] Tada, H., Paris, P.C., and Irwin, G.R., "The Stress Analysis of CracksHandbook," Del Research Corp., St. Louis, MO., 1973.
2 5
Table 1 Summary of Experimental Test Matrix
Material SpecimenNames
aThickness (t), mm
Width (w),cm
Length (L),cm
Notch Length(2ao), cm
AS4/8553-40(Panel AK1)tow-placed
A10-A13A3-A5B2-B6A1,A2,B1AK1
2.622.622.622.79b2.67
2.5410.1610.1630.591
28464686230
unnotched1.272.547.6222.86
AS4/938(Panel AK5A)tow-placed
C10-C13C3-C5D2-D6C1,C2,D1AK5A
2.362.362.362.41b2.39
2.5410.1610.1630.591
28464686230
unnotched1.272.547.6222.86
AS4/938(Panel AK5B)tow-placed
E10-E13E3-E5F2-F6E1,E2,F1AK5B
2.362.312.312.29b2.31
2.5410.1610.1630.591
28464686230
unnotched1.272.547.6222.86
AS4/3501-6(Panel TAPEA)Tape Prepreg
G12-G18G3-G5H2-H6G1,G2,H1TAPEA
2.362.362.362.36b2.36
2.5410.1610.1630.591
28464686230
unnotched1.272.547.6222.86
a Stacking sequence for all panels [-+ 45/0/90/-+ 30/_0 ]s
b Average of above thicknesses since the smaller specimens were cut from the 91 cm widepanel after fracture test.

2 6
Table 2 Lamina Material Properties
Material E11(GPa)
E22(GPa)
G12(GPa)
n*f
(%)
n12 e90cr
(%)e0
cr (%)
go**12 (%)
gcr**12 (%)
aAS4/8553-40 135.8 9.03 4.48 58.2 0.34 0.87 1.56 1.00 10.00
aAS4/938 135.1 9.38 4.96 57.2 0.32 0.50 1.48 1.00 10.00
bAS4/3501-6 137.9 9.38 6.00 60.3 0.28 0.50 1.50 1.00 10.00
a E11, E22, G12, n12, e90cr , and e0
cr measured by Boeing and reported in reference [19].
b E11, E22, G12, n12, e90cr , and e0
cr measured by Lagace et al. and reported in reference [18].
* nf was measured by the authors using a small sample of the 91 cm wide panels after the fracture tests.
** go12 and gcr
12 are approximations from Iosipescu shear test data reported in reference [20].

2 7
Table 3 - AS4/3501-6 Material Property Sensitivity Study,
W=10.16 cm and 2ao=2.54 cm
Properties Baseline Case 1 Case 2 Case 3 Case 4 Case 5
E11 137.9 GPa 124.1 GPa 137.9 GPa 137.9 GPa 137.9 GPa 137.9 GPa
E22 9.38 GPa 9.38 GPa 8.41 GPa 9.38 GPa 9.38 GPa 9.38 GPa
G12 6.00 GPa 6.00 GPa 6.00 GPa 5.38 GPa 6.00 GPa 6.00 GPa
n12 0.28 0.28 0.28 0.28 0.28 0.28
ec r22 0.50% 0.50% 0.50% 0.50% 0.45% 0.50%
ec r11 1.50% 1.50% 1.50% 1.50% 1.50% 1.35%
Predicted
Residual
Strength
72.1 kN
(+20%
Exp.
Average)
65.0 kN
(+7 %
Exp.
Average)
72.1 kN
(+20%
Exp.
Average)
72.1 kN
(+20%
Exp.
Average)
72.1 kN
(+20%
Exp.
Average)
65.9 kN
(+9%
Exp.
Average)
Table 4 - AS4/3501-6 Shear Failure Strain Sensitivity Study,
W=10.16 cm and 2ao=2.54 cm
Properties Baseline Case 1 Case 2 Case 3
go12 1.00 1.10 1.00 not used
gc r12 10.00 10.00 11.00 not used
Predicted
Residual
Strength
72.1 kN
(+20%
Experimental
Average)
73.4 kN
(+22%
Experimental
Average)
72.1 kN
(+20%
Experimental
Average)
86.8 kN
(+44%
Experimental
Average)

Figure 1. Center-Notch Tension Panel.
x
W
y
2a o
L
•matrix cracking•fiber fracture•delamination
σ
σ
28

RIGHT NOTCH-TIP
91 cm
230 cm
Notch Dimensions22.9 cm long0.05 cm wide
Notch
Far-field strain = 0.00205(89.6% of failure)
AS4 / 938 ( 45 / 0 / 90 / 30 / 0)s-+
-+
Figure 2. Notch-Tip Damage Due to an Applied Tensile Load on anAS4/938 Composite Laminate.
Delamination
Matrix Crack
Notch-Tip
Fiber Fracture
4.32 cm
3.40 cm
xy
P
P
Direction of0o Fibers
29

Panel D1AK5Awidth = 30.5 cm2ao = 7.6 cm D
C
A
B
Figure 3. Load vs. COD Plot for Panel D1AK5A.
(x-ray radiographs are actual size)
COD
Load
Load
A
P=97.0 kN
B
P=106.8 kN C
P=121.5 kN
D
P=124.6 kN
0
20
40
60
80
100
120
140
0 0.1 0.2 0.3 0.4 0.5 0.6 0.7 0.8
Load,P (kN)
Crack Opening Displacement, COD (mm)
30

AS4/3501-6 [ 45/0/90/ 30/0]s+ +
(a) 1st 45o ply, -45/45 interface
(b) 1st 0o ply, 45/0 interface
(c) 1st -30o ply, 90/-30 interface
(d) 1st 30o ply, -30/30 interface
Figure 4. Typical Notch-Tip Damage of the Center-Notch Tension Panels.
fiber fracture extends5 mm from notch-tip
fiber fracture extends5 mm from notch-tip
FiberFracture
Notch-Tip
FiberFracture
Notch-Tip
Notch-Tip
No Observed Damage
LocalDelamination
Notch-Tip
magnification: 12.5
magnification: 5
magnification: 10
magnification: 10
x-ray radiographmagnification: 2
Not Damage.Surface StainOnly.
Panel G4TAPEA 85% Sult
LocalDelamination
Notch
Notch
Notch
Fiber Fracture
Fiber Fracture
31

IncrementLoad
Start
Solve for Global Displacements
Calculate Ply-Level Strains, Stresses,and Damage State
Calculate Element Stiffness Matrices2
Assemble and Factor GlobalStiffness Matrix 3
Calculate Damage Resultant Forces and Update Global Force Vector 4
5
Calculate Element Stress Resultants6
7
Input Finite Element Mesh, Current Damage State,Loading Condition, and Material Properties
1
Figure 5. Progressive Failure Analysis.
EquilibriumEstablished ?
Yes
NoLaminateFailure ?
No
Yes
Stop
Update Damage State8
COMET
COMET
DRF
Iterate UntilChange inDisplacementsare Small
COMET
COMET
DGI
DGI
32
PlyTransverseStress
Ply TransverseStrain
β = 0.1
PlyLongitudinalStress
Ply LongitudinalStrain
γ = 0.1
ε22
cr
ε11
cr
Ply ShearStrain
PlyShearStress ψ = 1.0
ψ = 0.1
o
12γ γ
12
cr
Figure 6. Failure Criteria Used in Progressive Damage Analysis.
(a)
(b)
(c)
33

Figure 7. Finite Element Mesh of the Center-Notch Tension Panel.
L2ao
W
σ
σ
zero radius notch notch-tip
x
y
u
v
v=0
u=0
34

Notch-tip
mesh 1 (Not to Scale)
Notch-tip(with 0.25 mm radius)
mesh 2 (Not to Scale)
Figure 8. Mesh Refinement and Variations in Notch-Tip Geometry.
σ
σ
yx
10.2 cm
2.54 cm long0.05 cm wide
35

L22.9cm
91 cm
σ
σ
x
y
Figure 9. Damaged Elements Displayed for the AS4/938 Panel at88% of the Ultimate Failure Load. Width = 91 cm, 2ao = 22.9 cm.
(a) Fiber Fracture ε11 ε11cr
>( )
45o, 0o, -30o, 30o pliesall plies (except 90o)
45o, 0o, 30o plies
notch notch-tip
notch notch-tipnotchnotch-tip
(b) Mode I Matrix Crackingε22 ε22
cr>( )
(c) Mode II Matrix Crackingγ12 γ12
o>( )
-45o, 45o, 90o plies90o plies
all plies
-45o, 45o, -30o plies
all plies (except 30o)-45o, 45o, -30o, 30o plies
45o
-45o
36

Figure 10. Experimental and Model Predicted Damage Growth Resistance.
∆Effective Damage Growth ( a ) , mm
Experimental: Panel AK5AExperimental: Panel AK5BExperimental AverageModel Prediction
AS4/938Width = 91 cm2ao = 22.9 cm
0
500
1000
1500
2000
2500
3000
3500
0 1 0 2 0 3 0 4 0 5 0
KI,
N/mm3/2
37
0
100
200
300
400
1.27 2.54 7.62 22.86
experimentalmodel prediction
width=10.2 cm
width=10.2 cm
width=30.5 cm
width=91 cm
AS4/938
ResidualStrength,
MPa
AS4/3501-6 AS4/8553-40
Figure 11. Residual Strength Predictions for the Center-Notch Tension Panels.
Notch Size (2ao), cm
500
1.27 2.54 7.62 22.861.27 2.54 7.62 22.86
width=10.2 cm
width=10.2 cm
width=30.5 cm
width=91 cm
width=10.2 cm
width=10.2 cm
width=30.5 cm
width=91 cm
38

Experimental
Model Solution
LEFM (2a/W = 1/4)
2a/w = 1/8
2a/w = 1/4
2a/w = 1/4
2a/w = 1/4
Figure 12. Comparison of LEFM and Model Prediction for theAS4/938 Center-Notch Tension Panels.
0
200
400
600
800
1000
0 5 1 0 1 5 2 0 2 5
ResidualStrength,
MPa
Notch Length, 2ao (cm)
39

4 0
APPENDIXQuantifying Damage Growth Resistance
The notch-tip damage in a composite laminate is not a well defined and quantifiable
crack like the notch-tip damage in metals, therefore, the terms crack growth and crack
growth resistance may not be suitable for composites. The terms damage growth and
damage growth resistance will be used when discussing composite laminates.
During the monotonic loading of the center-notch tension panels, the applied load and
the COD at the center of the notch was recorded and used to produce load vs. COD plots,
as was shown previously in Figure 3 for the AS4/938 specimen D1AK5A. The damage
growth can be measured directly from these x-ray radiographs, or the load vs. COD plot
can be used with a closed form solution to approximate the characteristic half-crack length,
a. Using the change in a, the effective damage growth is determined as
Da = a - ao (A1)
The closed form elasticity solution [27] for an isotropic material under plane stress is
a = COD
4ex (A2)
where ex is the uniaxial far-field strain, and the initial notch length is small compared to the
panel width such that finite width effects are neglected. It can be shown that the closed
form elasticity solution for determining the characteristic half-crack length for an
orthotropic material under plane stress is
a = COD¥z
4ex (A3)
where z is a constant representing the effects of finite width and anisotropy. This is
demonstrated in Figure A1 where the first loading up to discontinuity 'A' (in Figure 3) is
plotted as COD vs. ex. A schematic of the notch-tip damage is given to illustrate the
configuration of the notch and damage. A linear regression analysis of the data for strains
less than 1000 me provides an initial slope before damage initiation. From Figure A1 and
equation (A3), one should observe that the initial slope is 4a/z. Since the initial slope is not

4 1
affected by damage in this figure, the characteristic half crack length is equal to the initial
half notch length, a=ao. Therefore, for this specimen configuration and material, z is a
constant equal to 0.83. As damage increases, since z is a constant, the characteristic half-
crack length will be easy to determine.
The initial loading in Figure 3 was illustrated in Figure A1 as the COD vs. ex slope to
demonstrate the calculation of the constant z. Likewise, each consecutive loading is
displayed as COD vs. ex in Figure A2 to demonstrate characteristic half-crack length
calculations. The second, third, and fourth loadings are plotted up to their respective
discontinuities. Again, a linear regression analysis was performed for strains less than
1000 me to provide an initial slope. The initial slope for the second loading is a result of the
damage that occurred at the end of the first loading of Figure A1. As shown in Figure A2,
this slope and the constant z are used to calculate the characteristic half-crack length that
resulted from the damage at the end of the first loading. Equation (A1) is then used to
calculate the effective damage growth. Likewise, Da is determined for each of the slopes in
Figure A2.
The effective damage growth, Da, and the critical stress responsible for the damage
growth was used to plot KI vs. Da where KI is the mode I stress intensity factor,
KI = sc pasec(pa/w) . (A4)
This plot is a damage growth resistance curve (R-curve), as shown in Figure 10 of this
paper.

4 2
Slope = 7.2474
a =COD¥ z
ex4
4a
zSlope =
z = 0.83
Specimen D1AK5A
COD
2a
Da
Uniaxial Far-Field Strain me,ex( )
0
0.05
0.1
0.15
0.2
0.25
0.3
0.35
0.4
0 500 1000 1500 2000 2500
a = ao = 3.81 cm
2ao = 7.62 cm
COD,mm
Figure A1. COD and Strain Data for Determining z for Panel D1AK5A.

4 3
Each Consecutiveloading is offset by
400 microstrain
2nd loading
3rd loading
4th loading
5th loading
a = z slope
4
¥
z = 0.83
Specimen D1AK5A
slope 2 = 7.2559
slope 5 = 8.171
slope 4 = 7.7271
slope 3 = 7.5566
Uniaxial Far-Field Strain me,ex( )
COD,mm
0
0.1
0.2
0.3
0.4
0.5
0.6
0.7
0.8
1000 me
Figure A2. COD and Slopes Used to Calculate Da.
REPORT DOCUMENTATION PAGE Form ApprovedOMB No. 0704-0188
Public reporting burden for this collection of information is estimated to average 1 hour per response, including the time for reviewing instructions, searching existing data sources,gathering and maintaining the data needed, and completing and reviewing the collection of information. Send comments regarding this burden estimate or any other aspect of thiscollection of information, including suggestions for reducing this burden, to Washington Headquarters Services, Directorate for Information Operations and Reports, 1215 JeffersonDavis Highway, Suite 1204, Arlington, VA 22202-4302, and to the Office of Management and Budget, Paperwork Reduction Project (0704-0188), Washington, DC 20503.
1. AGENCY USE ONLY (Leave blank) 2. REPORT DATE
June 19983. REPORT TYPE AND DATES COVERED
Technical Memorandum4. TITLE AND SUBTITLE
A Progressive Damage Methodology for Residual Strength Predictions ofNotched Composite Panels
5. FUNDING NUMBERS
538-13-11-05
6. AUTHOR(S)
Timothy W. Coats and Charles E. Harris
7. PERFORMING ORGANIZATION NAME(S) AND ADDRESS(ES)
NASA Langley Research CenterHampton, VA 23681-2199
8. PERFORMING ORGANIZATIONREPORT NUMBER
L-17729
9. SPONSORING/MONITORING AGENCY NAME(S) AND ADDRESS(ES)
National Aeronautics and Space AdministrationWashington, DC 20546-0001
10. SPONSORING/MONITORINGAGENCY REPORT NUMBER
NASA/TM-1998-207646
11. SUPPLEMENTARY NOTES
Coats: NRC-Resident Research Associate, Langley Research Center, Hampton, VA; Harris: Langley ResearchCenter, Hampton, VA
12a. DISTRIBUTION/AVAILABILITY STATEMENT
Unclassified-UnlimitedSubject Category 24 Distribution: StandardAvailability: NASA CASI (301) 621-0390
12b. DISTRIBUTION CODE
13. ABSTRACT (Maximum 200 words)
The translaminate fracture behavior of carbon/epoxy structural laminates with through-penetration notches wasinvestigated to develop a residual strength prediction methodology for composite structures. An experimentalcharacterization of several composite materials systems revealed a fracture resistance behavior that was verysimilar to the R-curve behavior exhibited by ductile metals. Fractographic examinations led to the postulate thatthe damage growth resistance was primarily due to fractured fibers in the principal load-carrying plies beingbridged by intact fibers of the adjacent plies. The load transfer associated with this bridging mechanism suggeststhat a progressive damage analysis methodology will be appropriate for predicting the residual strength oflaminates with through-penetration notches. A progressive damage methodology developed by the authors wasused to predict the initiation and growth of matrix cracks and fiber fracture. Most of the residual strengthpredictions for different panel widths, notch lengths, and material systems were within about 10% of theexperimental failure loads.
14. SUBJECT TERMS
composites, damage, matrix cracks, fiber fracture, internal state variable,15. NUMBER OF PAGES
48
residual strength 16. PRICE CODE
A0317. SECURITY CLASSIFICATION
OF REPORT
Unclassified
18. SECURITY CLASSIFICATIONOF THIS PAGE
Unclassified
19. SECURITY CLASSIFICATION OF ABSTRACT
Unclassified
20. LIMITATION OF ABSTRACT
NSN 7540-01-280-5500 Standard Form 298 (Rev. 2-89)Prescribed by ANSI Std. Z-39-18298-102