scaffolding for biology an interactive qualifying project ... · scaffolding for biology an...
TRANSCRIPT

Ecosystem ASSISTment 1
SCAFFOLDING FOR BIOLOGY
An Interactive Qualifying Project Report
Submitted to the Faculty of the
Worcester Polytechnic Institute
In partial fulfillment of the requirements for the
Bachelor of Science Degree
By:
______________________________________________________
Alec Mitnik
October 2011
Approved By:
___________________________
Professor Janice Gobert
___________________________
Professor Joseph Beck

Ecosystem ASSISTment 2
Abstract
In this project, a microworld was created in an ASSISTment, a computer based program that
assists students with inquiry as it collects data to assess their performance, that assessed middle
school students’ knowledge of ecology and inquiry skills while addressing common
misconceptions in food webs. The students’ prior knowledge of ecology was assessed through
pretest items. Through two problem scenarios in the microworld, the students were assessed on
their inquiry skills and knowledge. Their gains in knowledge were then assessed through the
same pretest items given in a posttest. The project did successfully assess the students’ inquiry
skills and knowledge, although there is room for improvements in the microworld and
scaffolding that should be made before further implementation.

Ecosystem ASSISTment 3
Table of Contents
Introduction ..................................................................................................................................... 4
ASSISTments .............................................................................................................................. 4
Background ..................................................................................................................................... 5
System Dynamics........................................................................................................................ 5
Studies on Misconceptions in Ecology ....................................................................................... 6
Massachusetts Education and Learning Strands ......................................................................... 8
Goals ............................................................................................................................................... 9
Method ............................................................................................................................................ 9
Participants .................................................................................................................................. 9
Data Collection Procedure .......................................................................................................... 9
Materials ................................................................................................................................... 10
Pre- and Post-test .................................................................................................................. 10
Microworld Design (Appendix 3b) ....................................................................................... 13
Microworld Problem Scenarios ............................................................................................ 14
Coding of Data .......................................................................................................................... 18
Results ........................................................................................................................................... 19
Student Analysis ....................................................................................................................... 22
Student 110968 ..................................................................................................................... 22
Student 110962 ..................................................................................................................... 26
Student 110969 ..................................................................................................................... 30
Student 110963 ..................................................................................................................... 33
Student 110972 ..................................................................................................................... 37
Student 110966 ..................................................................................................................... 40
Future Testing and Scaffolding ..................................................................................................... 43
Conclusions ................................................................................................................................... 44
References ..................................................................................................................................... 47
Appendices .................................................................................................................................... 48

Ecosystem ASSISTment 4
Introduction
Inquiry skills are a big focus in the National frameworks for science (National Science Education
Standards, NRC, 1996), however they are often not put to use in the classroom. Classroom
biology and field biology had developed a disconnect, with the former focused on memorization
of facts and popular theories, and the latter based around experimentation and hands-on learning.
Using the latter to teach students proves to be effective and gives them a more established idea of
real life biology (Wilensky & Reisman, 1998). In fact, an inquiry-based course on General
Ecology was shown to not only improve student performance in Ecology, but also close the gap
between students with and without research experience (Hane, 2007). Inquiry skills are
continuously shown to be crucial for scientific practice, and a greater emphasis in this area would
benefit any academically scientific pursuit.
ASSISTments
The ASSISTments platform, located at www.assistments.org, provides a computer-based
medium for assisting students with inquiry tasks while collecting assessment data on their
performance. Dr. Janice Gobert and her team is utilizing this platform by developing a science
ASSISTments program at Worcester Polytechnic Institute. The program consists of virtual
microworlds that provide engaging environments for students to solve inquiry tasks. This allows
data on both student inquiry skills and scientific knowledge to be collected and analyzed. The
ASSISTments problem sets that use these microworlds are designed in accordance with the
Massachusetts Science and Technology/Engineering Curriculum Framework. The problem sets
use a microworld to provide an avenue for students to develop a hypothesis, experiment, and

Ecosystem ASSISTment 5
analyze their data, thus honing inquiry skills while simultaneously solidifying scientific content
knowledge.
Background
System Dynamics
System dynamics is a good way for students to be able to learn concepts in science through
hands-on learning. A study by Alessi compared different system dynamics modeling systems in
several schools to look at their ease of use and effectiveness to see whether or not it would be
good to implement in the education system (Alessi, 2000). It found that of the three systems,
they all provided students with improved learning, however one of them was easier to use but
could only be applied to science. They concluded that implementing system dynamic models,
like the ones they explored, would help to enhance the students’ learning but are often times
consuming and challenging to integrate into the curriculum (Alessi, 2000).
Another study was done by Quellmalz on the use of games and simulations to help teach students
science in the classroom. I looked at two-dimensional simulations of science topics, virtual
laboratories, and various games and how successful they were in helping the students to learn
concepts, as well as how successful they were in assessing what the students had learned. The
simulations were found to be useful for measuring the learning in students, but the depth of the
understanding of the students could not be concluded as more research was needed. The games
were found to be a fun way for the students to learn science; however, more work needed to be
done in developing the assessment of the learning (Quellmalz, 2009).

Ecosystem ASSISTment 6
There was also a study done by The BioKIDS research group on another assessment system to
see if it was effective for measuring students’ inquiry skills and cognition. The PADI system was
hypothesized to provide an accurate assessment by combining aspects of knowledge and learning
rather than treating them as individual parts. A random sampling of 100 from a group of 2000
sixth graders from high poverty urban schools was tested. Students took a pretest before
attending an eight week course to learn cognition and inquiry in areas of science, and then a
posttest was used to assess the results. The conclusions were that by focusing and better
understanding a curriculum, assessment can be done more accurately to create all around more
beneficial learning environments. Though some estimated difficulties of questions seemed to be
off, the PADI system provided a more comprehensive form of assessment than comparative
systems, which could be further tweaked for more accurate use (Gotwals & Songer, 2006).
Wilensky and Reisman performed yet another study, theirs focusing on the effectiveness of using
dynamic models to teach children ecology, and how much they were able to infer without outside
help. Students, implied to be of middle-school level, were given StarLogoT language dynamic
models of various environments to use and a specific scenario to try to achieve, such as a stable
sheep-wolf population. The students created their own rules and ran simulations, then revised
them without outside help. Students were able to make unexpected inferences about the rules
needed for the goal environments, and through experimentation, were able to achieve
surprisingly accurate models (Wilensky & Reisman, 1998).
Studies on Misconceptions in Ecology
In a study done by Gallegos it was found that students had preconceptions as to what a carnivore
and a herbivore were and this influenced their creation of food webs. They believed the

Ecosystem ASSISTment 7
carnivores were big and ferocious and therefore picked them to be the top predator, while the
herbivores were passive and smaller than carnivores and were placed lower on the food web. The
students believed that larger animals ate smaller animals, and even though this is sometimes true,
it is not always. This misconception led them to incorrectly indentifying the order of a food chain
given to them (Gallegos, Jerezano, & Flores. 1994).
Gotwals and Songer conducted a study in which over a course of a year they taught a curriculum
to a group of 318 sixth grade students in the Detroit Public Schools. They then tested the students
with 20 items in which the students had to make a claim, support the claim, and explain reasons
why the evidence supports the claim. They discovered several misconceptions amongst the
students in regards to food chains and food webs as well as ecology. One of the misconceptions
was the way the students interpreted the arrows in the food chains. They did not draw the arrows
going the correct direction even though in the interviews they would explain the food web
correctly (Gotwals & Songer, 2009).
Another concept that Gotwals found students showed trouble with was the effects of one
organism in a food web to another. The students did give a correct claim when asked what would
happen to the large fish if the small fish died out, however they could not explain their reasoning
well. Also in another item the students had difficulty reasoning how changes in one level on the
food web would affect another one that was not directly connected. When the organisms were
directly connect in a predator prey relationship they were able to understand how they would be
affected, however when they were not directly connected that students showed difficulty in
reasoning the effects it would have. They also found that students had trouble reasoning the
effects a change in predator would have on its prey, although the conductors of the study were

Ecosystem ASSISTment 8
not sure if this was due to the organism used being unfamiliar to the students or actual difficulty
in reasoning with the food web (Gotwals & Songer, 2009).
In addition, AAAS Project 2061 researched middle-school students’ gaps in understanding about
interdependence in living systems by issuing distractor-driven test questions. Test questions were
each accompanied with meta questions so that any aspect of uncertainty could be picked up on
even if the question was answered correctly. The two factors indicating misconceptions that were
tested showed extremely significant impact. The use of symbols instead of animal names when
introducing a food web, as well as the focus on indirect rather than direct food web effects,
resulted in many fewer correct answers (Lennon &. DeBoer, 2008).
Massachusetts Education and Learning Strands
The Massachusetts Department of Education has established a curriculum standard that specifies
what students of each learning level are expected to be taught. In regards to middle-school level
life science, topics should cover the connectedness of biological systems, from the different
features of individual cells to the dynamics of whole ecosystems. The primary focus for this
study is strand 13 for grades 6-8, which is about the interactions of organisms within an
ecosystem and the functions they perform. The lesser, secondary focus is strand 14, which is
about the roles that producers, consumers, and decomposers have in an ecosystem, as well as the
transfer of energy (Massachusetts Department of Education, 2006). Therefore the intended
subjects of this ASSISTments project are middle-school level students, who are expected to have
been taught these topics in class.

Ecosystem ASSISTment 9
Goals
The goals of this Interactive Qualifying Project were to create an ASSISTment that would assess
middle school students on their knowledge of concepts in ecology while engaging in inquiry in
an interactive microworld. Using the background information above, a microworld was created
to address the concept of interconnectedness in food webs and the misconceptions the students
may have surrounding that concept. This microworld was then integrated into an ASSISTment
and tested on the middle school students in order to achieve the goals of this project.
Method
Participants
The participants in this study were eleven students from an after school program in Central
Massachusetts.
Data Collection Procedure
In a computer lab at Worcester Polytechnic Institute, the participants were individually tested on
computers. To begin, they did a content knowledge pretest to assess their prior knowledge of the
subject of ecology and food webs. The questions targeted the interrelationships of the food web
and asked how the organisms affect one another.
Once the pretest was completed, the students then proceeded to the first problem scenario in the
microworld. There they were asked to explore the ecosystem and follow the directions in order to
Ecosystem ASSISTment 10
stabilize the ecosystem. They made a hypothesis, experimentally tested it by manipulating the
number of organisms and recording their data, and then were asked to analyze their data. The
microworld was followed by some imbedded assessment questions, in which the students were
assessed on how much they could apply their prior knowledge to this ecosystem, and on being
able to communicate their findings. The students then completed the second problem scenario on
shrimp farms in which they did the same things as described above, followed once again by
questions that assessed their ability to communicate their findings.
Lastly, the students completed a content knowledge posttest. This was the same test given to
them in the pretest. This was used to see how much knowledge was gained through completing
the microworlds.
Materials
The following sections describe the pre test, post test, and microworld that can be seen in the
Appendices. The ASSISTment can also be found at www.assistments.org.
Pre- and Post-test
The pretest was comprised of one open response question about relationships in an ecosystem
and ten multiple-choice questions. Six of the multiple choice questions were also concerned with
relationships in an ecosystem, three had to do with classifying roles in an ecosystem, and finally
one was about energy within an ecosystem. The main focus for our assistment exercise was
relationships within an ecosystem, with a minor focus on roles with an ecosystem, and so the
question topics reflect this.

Ecosystem ASSISTment 11
Pretest 1 (Appendix 1a)
Question one dealt with relationships in an ecosystem and introduced and explained the standard
food web diagram, then asked about how a decrease in prey population affects a predator.
Pretest 2 (Appendix 1b)
Question two was about the transfer of energy in a food web and asked how energy initially
enters the ecosystem.
Pretest 3 (Appendix 1c)
Question three was concerned with classification and asked the student to identify one of the
consumers in the ecosystem.
Pretest 4 (Appendix 1d)
Question four was concerned with classification and asked the student to discern the list of
producers out of the four lists given.
Pretest 5 (Appendix 1e)
Question five was concerned with classification and asked the student to identify one of the
secondary consumers in the ecosystem.
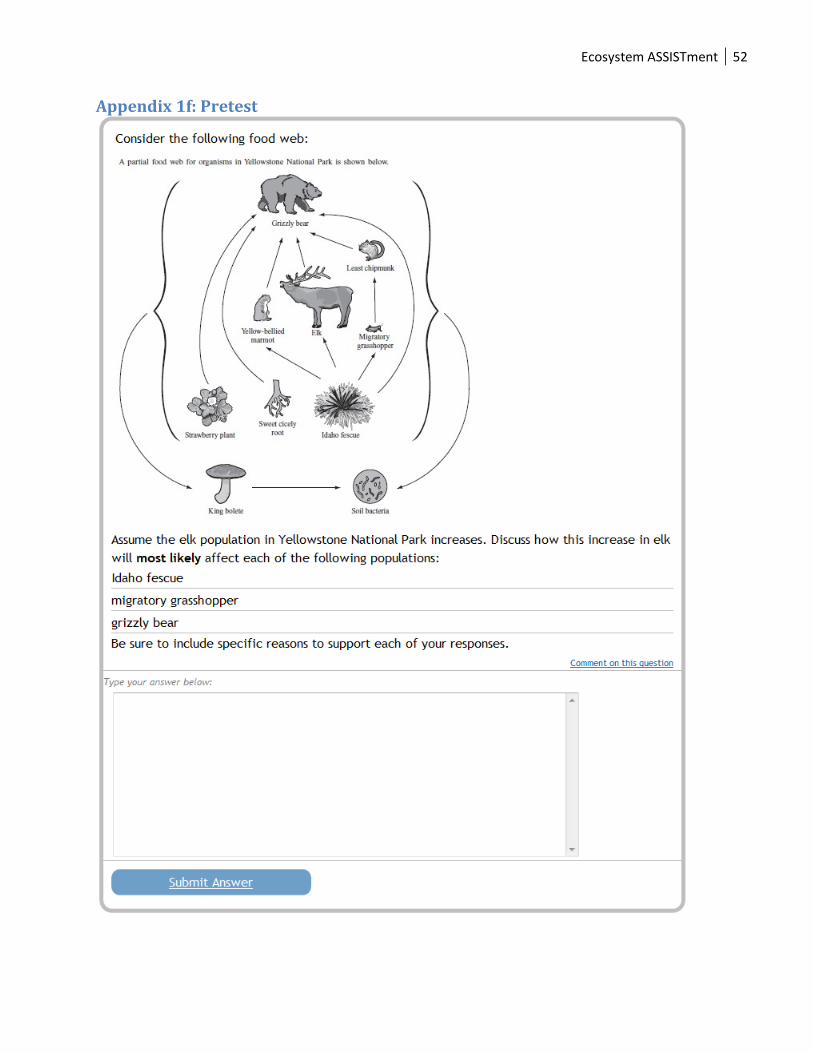
Pretest 6 (Appendix 1f)
Question six was an open response question that dealt with relationships in an ecosystem and
asked how an increase in a specific population would affect the populations of some of the other
species.

Ecosystem ASSISTment 12
Pretest 7 (Appendix 1g)
Question seven dealt with relationships in an ecosystem and reiterated the proper way to read
food web diagrams, then asked which organisms could be affected if a specific population
changed.
Pretest 8 (Appendix 1h)
Question eight dealt with relationships in an ecosystem and again reiterated the proper way to
read food web diagrams, then asked how a specific organism’s population would be affected if
another specific organism’s population decreased. This was phrased as an overfishing scenario,
and it should be noted that the two organisms in question were not in proximity to each other
within the food web.
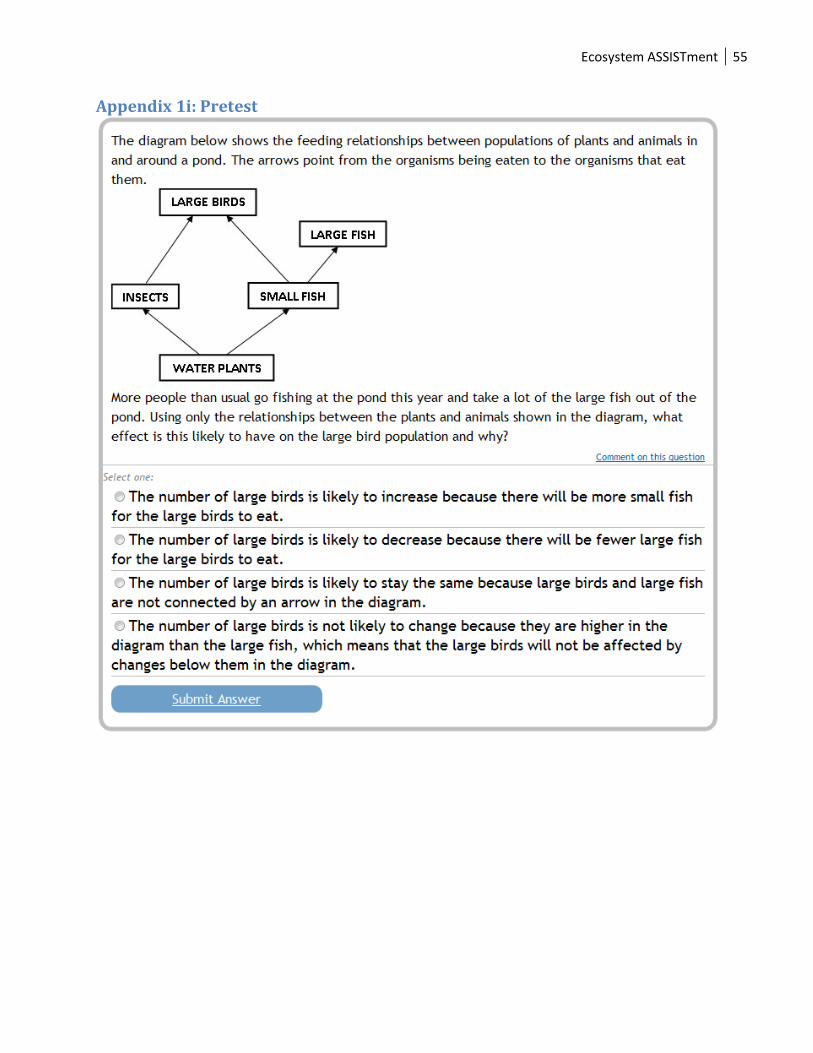
Pretest 9 (Appendix 1i)
Question nine dealt with relationships in an ecosystem and again reiterated the proper way to
read food web diagrams, then asked how a specific organism’s population would be affected if
another specific organism’s population decreased. This was phrased as an overfishing scenario,
and it should be noted that the two organisms in question were again not in proximity to each
other within the food web.
Pretest 10 (Appendix 1j)
Question ten dealt with relationships in an ecosystem and again reiterated the proper way to read
food web diagrams, then asked how a specific organism’s population would be affected if
another specific organism’s population decreased, given that an intermediate organism’s
population remained the same.

Ecosystem ASSISTment 13
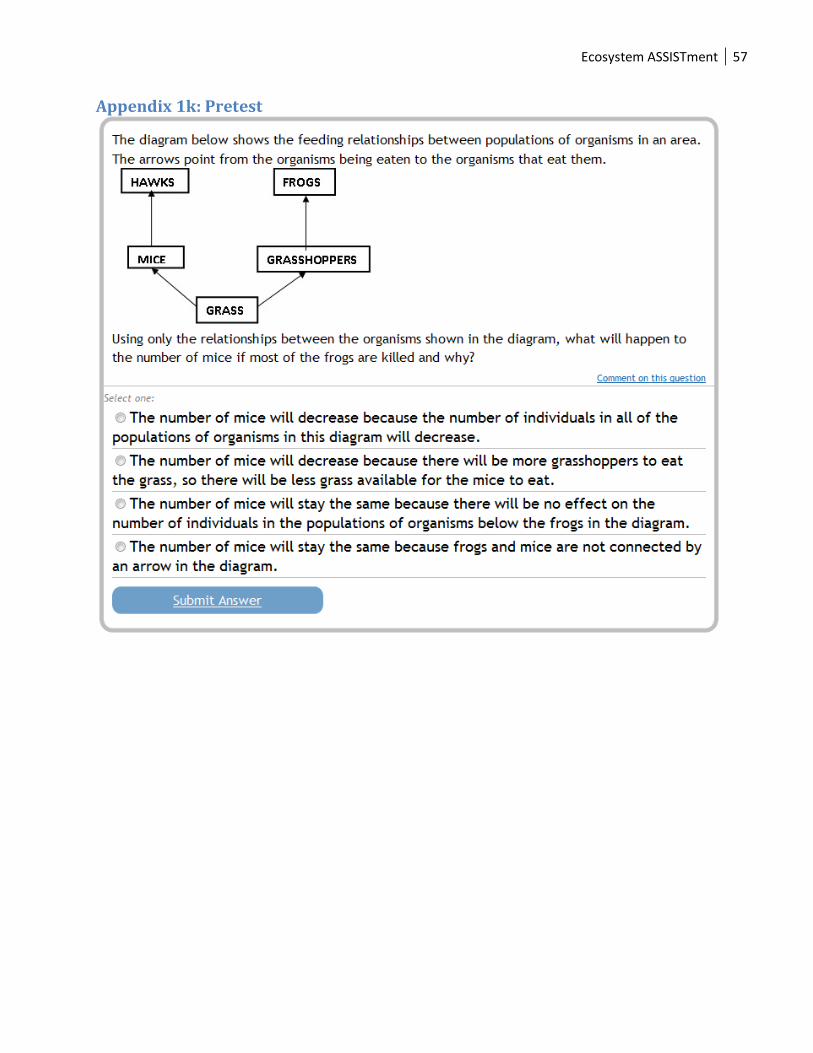
Pretest 11 (Appendix 1k)
Question eleven dealt with relationships in an ecosystem and again reiterated the proper way to
read food web diagrams, then asked how a specific organism’s population would be affected if
another specific organism’s population decreased. It should be noted that the two organisms were
not in proximity to each other within the food web.
Microworld Design (Appendix 3b)
The ecosystem microworld was designed to correlate with the knowledge presented in middle-
school level textbooks, and revolves around a simplified, linear food web that moves from
seaweed to shrimp to small fish to big fish (Appendix 13). It consists of an ecosystem area in
which organisms of each of the four types can be placed with varying numbers. These numbers
correspond to simulated populations, and when the microworld is scanned, a custom algorithm
determines the progression of those populations over a span of 80 virtual days. The algorithm
requires a sufficient prey population for a species not to starve, and not so many predators that
the species would get wiped out. The algorithm’s purpose is to be educational more than to be
completely realistic. To the right of the ecosystem area is the section that contains each of the
four organisms that can be added or removed using a drag and drop interface. The progression of
populations from the most recent scan is shown in four graphs to the far right. A “toggle charts”
button merges these graphs into one, allowing students to observe the correlation between dips
and rises in the population of each species (Appendices 7a & 7b).
For each of the problem sets, the microworld begins in an unstable state, meaning that when
scanned, and the simulation runs for 80 days, some of the populations would drop to zero (i.e.
some species would be wiped out). It is the task of the students to hypothesize what change in
the initial populations would cause the ecosystem to become stable, and then collect data through

Ecosystem ASSISTment 14
sequential scans to either support or refute this hypothesis. Though this setup is meant to assess
knowledge and understanding of ecosystems, it also expects comprehension of the scientific
method. Students who are unfamiliar with the process of hypothesizing, gathering data with
controls, and then connecting the data back to the hypothesis inevitably do not behave as desired.
Microworld Problem Scenarios
Problem Scenario 1: Lack of Seaweed (Appendices 3a-3c)
The student is shown a microworld setup with a popup message stating that they are in the
Hypothesis phase. The popup provides instructions for how to state a hypothesis, which is by
clicking on the organisms and choosing whether more or fewer of them are needed to stabilize
the ecosystem. After clicking “OK” to make the popup disappear, the student is able to make a
hypothesis. The microworld presented to them consists of an area representing the ecosystem
with one big fish, three small fish, two shrimp, and one seaweed, none of which can be
manipulated. Right above this area the problem with the ecosystem is stated to be that “The
ecosystem collapses because it lacks seaweed.” Below the ecosystem area are three buttons.
“What am I supposed to be doing?” appears in every phase, and causes the instructional popup to
reappear. “I have completed my hypothesis” moves the student on to the Experiment phase,
while “I need to explore more” transfers the student to the Explore phase. Once the student has
formulated a hypothesis, which is displayed below the organisms to select and to the right of the
ecosystem area, the student can then click “I have completed my hypothesis” to move on to the
Experiment phase.
The Explore phase (Appendices 3c & 4) provides a similar popup explaining that the Explore
phase is for the student to become familiarized with the microworld and the scanning procedure.

Ecosystem ASSISTment 15
When done exploring, the student may move back to the Hypothesis phase by clicking “I’m
ready to make a hypothesis.”
The Experiment phase (Appendices 6a & 6b) functions nearly identical to the Explore phase,
however each scan stores data for later analysis. Since it is noted above the ecosystem area that
the problem with the ecosystem is a lack of seaweed, and even explicitly stated that the student
should select “more seaweed” within the popup instructions for the Hypothesis phase, it is
expected that the hypothesis the students formulate for Problem Scenario 1 is “If the ecosystem
has more seaweed then it will be stable.”
Again a popup is shown, this time explaining that the student should add or remove organisms
from the ecosystem area, scan it to accumulate data, and that “It is OK if your hypothesis turns
out to be incorrect!” The hypothesis is displayed above the ecosystem area, where the problem
with the ecosystem was displayed during the Hypothesis phase, and below the ecosystem area is
a table that contains each scan made by the student. On the right side of the microworld are four
graphs to represent simulated populations of each of the four organisms for each scan result. A
scanned configuration that results in every population remaining above zero is considered to be a
stabilized ecosystem. At any point the student may click “I’m done experimenting. I’m ready to
analyze.” to move on to the Analyze Data phase. It is not required that they actually have any
data to do so.
At the start of the Analyze Data phase (Appendices 8a-8d), a popup instructs the student to
decide if their data supports or refutes the hypothesis, and that “It is OK if your data refute your
hypothesis.” Just as in any other phase, they have the option to return to the previous phase as
well. Once the student makes a decision, more instructions appear, indicating that the trials

Ecosystem ASSISTment 16
which support the student’s claim should be dragged into the Evidence Folder, an image in the
middle of the setup. Clicking “Submit Analysis” allows the student to finish the microworld
portion of the problem scenario. Again, it is not required that any data be submitted as evidence
to do so.
Problem Scenario 1: Embedded Assessment Questions (Appendices 9a & 9b)
Once the microworld portion is complete, the student is presented with an embedded open
response question stating: “Pretend you have a friend who did not explore the ecosystem.
Describe to him or her anything you noticed in regard to how different organisms in the
ecosystem you explored affect one another.” This is to help measure the student’s
comprehension of the exercise and observation skills, as well as to see if they are able to
communicate their findings coherently. The student is then given four multiple choice questions
in which they were asked to select as many as apply. For each question, the options are each of
the four organisms involved in the microworld. They ask, respectively, “Which of the organsims
[sic] is/are the producer(s)?”, “…primary consumer(s)?”, “… secondary consumer(s)?”, and “…
tertiary consumer(s)?” This information is not obtained from the microworld. It is for measuring
the student’s prior vocabulary knowledge, and whether they can apply it to the microworld food
web.
Problem Scenario 2: Shrimp Farming (Appendices 11a-11e)
Before doing the activity in the microworld, the student is presented with the following open
response question, “Before we move on to the microworld what are your thoughts on the
relationships between [sic] predator and prey? How do predators affect their prey populations?
(Appendix 10). Once they have answered this question, they then move into the microworld. The

Ecosystem ASSISTment 17
activity follows the same progression as described in Problem Scenario 1. The goal of this
activity, however, is to be able to stabilize the ecosystem so that the population of the shrimp is
at its highest. The ecosystem starts with no big fish, one small fish, three shrimp and four
seaweeds. In order to maximize shrimp, the students must add both small fish and big fish to the
ecosystem. Adding just small fish will stabilize the ecosystem with a reasonable amount of
shrimp, however for the shrimp population to be maximized both big and small fish must be
added.
Just as in Problem Scenario 1, the student must make a hypothesis, experiment to collect data,
and then analyze the data in the same way using the same widgets.
Problem Scenario 2: Embedded Assessment Questions (Appendices 12a & 12b)
Once the students finished the activity, they were then presented with embedded assessment
questions, as in Problem Scenario 1. There were two open response questions that assessed their
ability to communicate their findings.
The first question asked “One of your friends is going to start an eco friendly shrimp farming
business and wants to know the details of the experiment you just performed. Unfortunately he
doesn't know anything about ecology or shrimp. What can you tell him about the role of
predators in the shrimp farm ecosystem you experimented with? Was this an expected result?”
This question assesses whether or not the student is able to communicate the findings from the
results of the activity. By being able to answer this, it shows that they have an understanding of
what was happening in the ecosystem of the microworld, and are able to portray this knowledge
to others.

Ecosystem ASSISTment 18
The second question asks, “Now that you told him the details of the shrimp farm ecosystem your
friend is curious to know your thoughts about the predator and prey relationships in general?
[sic] Do you think natural ecosystems need predators? How are all the organisms in an
ecosystem related?” This question assesses the student’s ability to take their findings and
knowledge and expand it to larger implications and other applications. Being able to expand on
one’s findings into a larger implication is very important in science.
Coding of Data
The data collected from the students’ answers to pre and post test questions, logged activity in
the microworld, and embedded questions were scored in order to assess their prior knowledge of
the content, ability at performing inquiry tasks, and knowledge gains through completing the
inquiry task. All of the multiple choice questions, including the pre test, post test and embedded
questions, were scored by the ASSISTment program, as either correct (1 point) or incorrect (0
points).
The open response questions in the pre and post tests and the embedded questions were graded
by hand on a 0-2 scale. A score of 0 corresponded to no response or the answer provided did not
answer the questions asked, 1 corresponded to a partial answer that attempted to answer the
question but did not fully, and 2 corresponded to a complete answer that answered the question
well.
The students’ hypotheses were also scored based on the following point system: maximized the
solution (3 points), was a good solution (2 points), stabilized the ecosystem and showed some
effort (1 point), or none of these (0 points).

Ecosystem ASSISTment 19
Results
The tables below show the students’ scores for the Pretest, Problem Scenario 1, Problem
Scenario 2 and the Posttest. Due to a low sample size of eleven students, quantitative analysis of
the data was not possible and instead qualitative analysis was preformed. Case studies of six of
the students are presented explaining their pre test scores, logged actions in the microworlds,
embedded question scores, and post test scores. For multiple-choice questions, a (1) indicates a
correct answer, while a (0) indicates an incorrect answer. For open-response questions, (0)
means no effort in the response, (1) means partial correctness or clear effort, and (2) represents a
satisfactory response. In each table, the students are organized into three groups by level of
performance and perceived effort, from low to high.
Table 1 shows the answers for each student on each pretest multiple choice question, as well as
their total correct responses for the pretest multiple choice questions. It then includes the pretest
open response evaluation, along with the total score for the pretest.
Table 1: Student Pretest scores
Pretest
Student ID
MC
1
MC
2
MC
3
MC
4
MC
5
MC
6
MC
7
MC
8
MC
9
MC
10 MC pretest total Pretest OR
Pretest
total
110967 0 0 0 0 1 0 0 0 0 0 1 1 2
110963 0 0 0 1 0 0 0 0 0 1 2 2 4
110972 0 0 0 0 0 1 1 0 1 0 3 1 4
110966 0 1 1 0 0 1 0 1 1 0 5 1 6
110969 0 1 0 0 1 1 1 0 1 0 5 1 6
110970 0 1 0 0 0 0 1 1 0 1 4 0 4
110959 0 1 0 0 0 1 0 1 1 1 5 0 5
110965 1 1 1 0 1 0 0 1 1 1 7 2 9
110962 1 1 0 0 1 1 1 0 1 0 6 2 8
110961 0 1 1 0 1 1 0 1 0 1 6 1 7
110968 1 1 1 0 1 0 1 1 1 0 7 2 9
Ecosystem ASSISTment 20
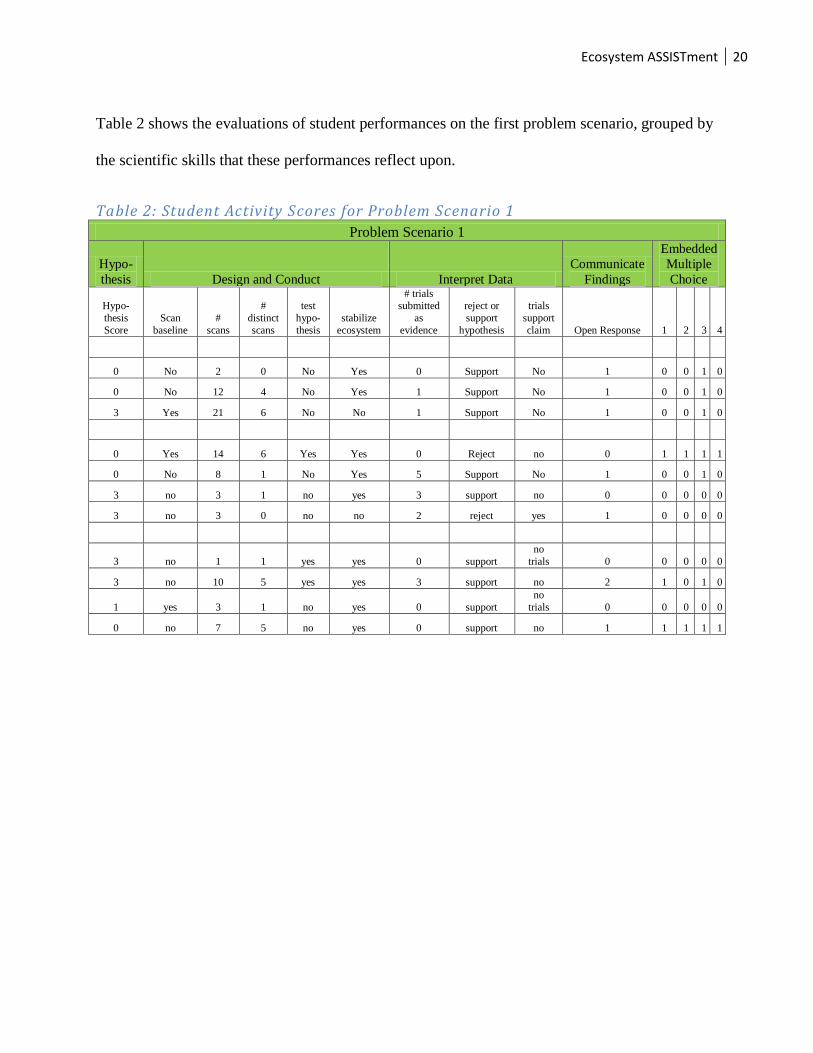
Table 2 shows the evaluations of student performances on the first problem scenario, grouped by
the scientific skills that these performances reflect upon.
Table 2: Student Activity Scores for Problem Scenario 1
Problem Scenario 1
Hypo-
thesis Design and Conduct Interpret Data
Communicate
Findings
Embedded
Multiple
Choice
Hypo-
thesis
Score
Scan
baseline
#
scans
#
distinct
scans
test
hypo-
thesis
stabilize
ecosystem
# trials
submitted
as
evidence
reject or
support
hypothesis
trials
support
claim Open Response 1 2 3 4
0 No 2 0 No Yes 0 Support No 1 0 0 1 0
0 No 12 4 No Yes 1 Support No 1 0 0 1 0
3 Yes 21 6 No No 1 Support No 1 0 0 1 0
0 Yes 14 6 Yes Yes 0 Reject no 0 1 1 1 1
0 No 8 1 No Yes 5 Support No 1 0 0 1 0
3 no 3 1 no yes 3 support no 0 0 0 0 0
3 no 3 0 no no 2 reject yes 1 0 0 0 0
3 no 1 1 yes yes 0 support
no
trials 0 0 0 0 0
3 no 10 5 yes yes 3 support no 2 1 0 1 0
1 yes 3 1 no yes 0 support
no
trials 0 0 0 0 0
0 no 7 5 no yes 0 support no 1 1 1 1 1

Ecosystem ASSISTment 21
Table 3 shows the evaluations of student performances on the second problem scenario, grouped
by the scientific skills that these performances reflect upon.
Table 3: Student Activity Scores for Problem Scenario 2
Shrimp Farm Problem
Observe
Hypo
-
thesis Design and Conduct Interpret Data
Communicate
Findings
O
R
1
went back
to Explore
phase
Hypo-
thesis
score
Scanned
baseline
#
scans
#
distinct
scans
test
hypo-
thesis
stabilize
ecosystem
# trials
submitted
as
evidence
reject or
support
hypothesis
trials
support
claim OR 2 OR 3
2 No 0 No 1 0 No Yes 0 Reject Yes 1 1
2 Yes 2 No 50 39 Yes Yes 1 Support Yes 0 0
1 No 0 No 1 1 Yes No 1 Support No 1 0
2 No 0 No 10 4 Yes Yes 0 Reject No 2 2
1 Yes 1 No 5 0 Yes Yes
4 (all
same) Support No 1 1
0 no 1 no 1 0 no yes 1 support no 0 0
1 no 1 no 1 0 no yes 1 reject no no log no log
2 yes 0 no 1 0 yes yes 0 support
no
trials 0 1
0 yes 2 no 10 4 yes yes 3 reject no no log 2
1 no 0 yes 2 0 yes yes 0 support
no
trials 1 no log
2 yes 0
in
explore 3 1 yes yes 0 reject
no
trials 0 no log

Ecosystem ASSISTment 22
Table 4 shows the answers for each student on each posttest multiple choice question, as well as
their total correct responses for the posttest multiple choice questions. It then includes the
posttest open response evaluation, along with the total score for the posttest.
Table 4: Student Posttest Scores
Posttest MC
1
MC
2
MC
3
MC
4
MC
5
MC
6
MC
7
MC
8
MC
9
MC
10
MC
Total Posttest OR Posttest Total
0 0 1 1 0 0 1 0 0 0 3 1 4
0 0 0 1 0 0 0 0 1 1 3 0 3
1 1 0 0 0 1 0 0 0 0 3 1 4
0 1 1 0 0 0 0 1 0 0 3 2 5
0 1 0 0 0 0 0 1 0 0 2 1 3
0 1 0 0 0 0 1 1 0 1 4 0 4
0 1 0 0 0 1 0 0 1 1 4 0 4
1 1 1 0 1 0 0 1 1 1 7 1 8
1 1 1 0 0 0 1 0 1 0 5 2 7
0 1 1 0 0 1 0 0 0 0 3 2 5
1 1 1 0 0 0 1 1 1 0 6 2 8
Student Analysis
Student 110968
Pretest
Student 110968 scored a total score of 9 out of 12 on the pretest. He received 7 out of 10 points
for the multiple choice and the full 2 points on the open response. This high score suggests the
student may have had some prior knowledge of the subject that he could have used to help him in
the problem sets.

Ecosystem ASSISTment 23
Problem Scenario 1
Microworld
The student went back and explored the ecosystem in the Explore phase of the microworld rather
than making a hypothesis and going to the Experiment phase. In this he did not scan the baseline,
which would have given him a foundation to base his observations and hypotheses on. The
student started by adding in all of the different organisms, therefore showing no use of the
control for variables strategy, which requires that only one variable be changed between points
of data so as to be sure of the cause of any changes. The next five scans were distinct from each
other, as the student only changed one variable in each of them. These trials did show him
control for variables strategy. He was able to stabilize the ecosystem during in this Explore
phase.
The student then moved on to the hypothesis widget and hypothesized that “If the ecosystem has
more seaweed, shrimp, big fish, and small fish then it will be stable.” This was scored 0 points as
it showed little effort and understanding because he just said to add more of everything. The
directions told him to hypothesize that more seaweed was needed so this shows he either did not
read the directions or chose to disregard them.
The student did not perform any trials in the Experiment phase of the microworld. Because of
this he did not test his hypothesis and did not collect any data to be used in the analysis phase.
He thus submitted no trials as evidence for his claim that his data supports his hypothesis. Based
on this the student did not show understanding of the scientific method of observing,
hypothesizing, testing, and then interpreting the data. He did all his testing before making the
Ecosystem ASSISTment 24
hypothesis and then did not do any experimenting in which he could gather data to interpret and
also did not scan the baseline. Even though he has prior knowledge of the subject, as seen
through his pretest score, he did not show understanding of the scientific method while doing this
problem scenario.
Embedded Post-questions
The student got a score of 1 on the embedded open response question. His answer did not fully
answer the questions and showed little understanding gained from the problem scenario that had
just been completed. He did however score the full 4 points on the embedded multiple choice
questions, which assess knowledge regarding the terminology of food web hierarchy. This shows
that he used some prior vocabulary knowledge and applied it to the food web shown in the
microworld.
Problem Scenario 2
Embedded Pre-question
For the open response pre-question the student received a full 2 points. His answer as to what his
thoughts were on predator/prey relationships was complete. Although he was only partially
correct in his answer, it was considered a complete answer to an opinion based question and
therefore he received full credit.
Microworld
In the Explore phase of the microworld, the student did scan the baseline. He then added shrimp
to the ecosystem and scanned it, giving him one distinct scan. His next scan however was not

Ecosystem ASSISTment 25
distinct as he added seaweed, small fish, and big fish to the ecosystem. Because only one of his
scans was distinct, he did not show use of the control of variables strategy.
The student hypothesized that “if the ecosystem has more big fish, more small fish, more
seaweed and more shrimp, then it will be stable.” Although this will stabilize the ecosystem, this
is not the correct hypothesis and was scored 0 once again because it did not show any effort since
he just said that more of each organism should be added.
The student did not test this hypothesis as he did not collect any data in the Experiment phase.
He skipped over the Experiment phase and went right to the analysis widget. The student
claimed the data did not support the hypothesis but had no data to submit as evidence. Based on
this, the student did not show an understanding of the scientific method. He did not test his
hypothesis as the scientific method describes, which gave him no data to interpret or use as
evidence to support or refute his hypothesis. Once again, despite prior knowledge of the content,
the student did not follow the scientific method in working in the microworld.
Embedded Post-questions
In the first open response question the student received a score of 0. His answer showed no
understanding of the relationships in the ecosystem and was incorrect. This showed that he did
not have understanding of the ecosystem in the microworld despite having a high prior
knowledge score.
Due to logging error, the answer to the second open response question was not recorded.
Ecosystem ASSISTment 26
Post-Test
The student scored 6 out of 10 on the multiple choice and 2 on the open response question giving
him a total post-test score of 8 out of 12. This was lower than his pretest score, but not
noticeably. He answered the open response well, showing an understanding of the content and a
willingness to participate. His scores showed no gain as they were not higher than those of his
pretest.
Student 110962
Pretest
Student 110962 scored a total of 9 out of 12 points on the pretest. She scored 7 points on the
multiple choice questions and received a full 2 points on the open response. This high score and
understanding in the open response shows the student has prior knowledge of the content.
Problem Scenario 1
Microworld
The student did not go to the Explore phase of the microworld. She hypothesized correct that “if
the ecosystem has more seaweed then it will be stable” showing that she did read and pay
attention to the directions. Her hypothesis maximized the solution and therefore received the full
3 points.
The student did not scan the baseline in the Experiment phase. She started by testing her
hypothesis and only adding seaweed, showing she was controlling for variables. However after
Ecosystem ASSISTment 27
this first distinct scan, she then added many of the each of the other organisms into the
ecosystem, showing she was no longer using the control for variables strategy. For the third scan,
she also did not control for variables, as she took out many organisms she had added in the
previous scan and added more of another. She scanned this condition twice, giving her two
identical scans.
She then moved on to the analysis phase, but decided she needed to go back to the experiment to
gather more data. She continued experimenting, having a total of three more scans, all of which
were distinct and controlled for variables.
Once again she moved onto the analysis phase and decided she needed to go back to the
Experiment phase to gather more data. The student ran three more trials, the first not controlling
for variables and the other two were distinct scans controlling for variables.
Finally she moved on to the analysis phase and stated that her data did support her hypothesis.
She chose three trials as evidence. These trials however did not support her claim as they were
trials in which she was not testing the hypothesis, but instead was manipulating other variables.
This showed that she had little understanding of the scientific process. Although she did make a
hypothesis and then start by testing it while controlling variables, she did not control for
variables the whole time and after the first trial was no longer testing the hypothesis. Even
though she had high prior knowledge of the content, she did not show full understanding and
execution of the scientific method.

Ecosystem ASSISTment 28
Embedded Post-questions
The student received a full 2 points on the open response questions showing that she did have an
understanding of the content. Of the four multiple choice questions, the student answered two
correctly. This could be interpreted the student not being able to apply prior knowledge to the
multiple choice questions based on the microworld interactions, as she did show high prior
knowledge in the pretest. However, since these questions tested different knowledge than the
pretest, it is also possible that the student did not have the knowledge in order to correctly answer
the questions.
Problem Scenario 2
Embedded Pre-question
Due to computer error, no answer was logged for this question.
Microworld
The student started by exploring in the Explore phase of the microworld. She once again did not
scan the baseline. Her first two scans were distinct, showing use of the control for variables
strategy, however her other two scans showed no control for variables as she manipulated more
than one organism.
With the hypothesis widget, the student hypothesized “if the ecosystem has more small fish then
the shrimp population will be at its highest.” This hypothesis is partly correctly and good, as the
ecosystem would need both more small and large fish to maximize the shrimp population so she

Ecosystem ASSISTment 29
received 2 points. This partially correct hypothesis shows that she is using her prior knowledge
to build the hypothesis.
In the first trial the student did not control for variables, as she removed seaweed and added
small fish. Her next trial both controlled for variables and tested her hypothesis as she added
more small fish. Of her final three trials, only one of them was distinct, controlling for variables.
None of them tested the hypothesis as she was manipulating organisms other than the small fish.
The student then moved onto the analysis widget and stated that her data did not support her
hypothesis. She submitted three trials as evidence of this; however, they did not support her
claim as the data did support her hypothesis. This shows that she does not have full
understanding of the scientific method. She did not scan the baseline and only occasionally
controlled for variables in her experimenting. Also she only tested her hypothesis for a couple
trials and then started to manipulate other variables instead. Her analysis of her data was also
incorrect showing that she doesn’t understand how to interpret the data. Despite having prior
content knowledge, she showed little understanding and execution of the scientific method.
Embedded Post-questions
Due to computer error, the first open response question was not recorded.
The student received a full 2 points on the second open response. This shows she was able to
apply her prior knowledge to the ecosystem of the microworld and indicates an understanding of
the content of the microworld.

Ecosystem ASSISTment 30
Posttest
The student received the full 2 points on the open response and 5 points on the multiple choice
questions giving a total post test score of 7. Her answer to the open response was complete
showing that she understood the content and had a willingness to participate. The score was
lower than the student’s pretest score showing that she did not have any gains after the
microworld.
Student 110969
Pretest
Student 110969 scored a total of 5 out of 10 points on the pretest. She scored 5 points on the
multiple choice questions and received 0 points on the open response. This score shows that he
has limited prior knowledge of the content as he did not answer the open response correctly but
was able to answer half of the multiple choice questions correctly.
Problem Scenario 1
Microworld
The student did not go back to the Explore phase. He hypothesized “if the ecosystem has more
big fish, fewer small fish, fewer seaweed and fewer shrimp then the ecosystem will be stable.”
This is incorrect, as the student was told to hypothesize “if the ecosystem has more seaweed then
it will be stable.” This shows the student did not pay attention to the instructions that were given.
Also this hypothesis does not stabilize the ecosystem, as more seaweed would be needed in order
for anything to survive, so the student received a score of 0.

Ecosystem ASSISTment 31
In the Explore phase the student did not scan the baseline. He did a total of eight scans, only one
of which was distinct where he only added one organism. This shows that he did not control for
variables in most of his experimenting. After his first four trials, he moved onto the analysis
phase where he said he needed more data, which prompted him back into the Experiment phase.
He then conducted his last four trials, in which the one distinct trail was carried out. None of his
8 trials tested the hypothesis.
Using the analysis widget the student claimed that his data supported his hypothesis. He
submitted five of his trials as evidence of this. The trials he selected, however, did not support
his claim. As he did not test the hypothesis, he did not have trial data that was able to support it.
This shows that the student had no understanding of the scientific method as he neither tested the
hypothesis nor controlled for variables during his experimentation. He also had little prior
content knowledge as seen on the pretest, showing that his understanding of the content and
scientific method were both low.
Embedded Post-questions
The student received a 0 for the open response. He answer did not address the questions and
showed no understanding and little effort. He correctly answered 1 out of 4 of the multiple
choice questions. This shows he had little understanding of the microworld and the content.

Ecosystem ASSISTment 32
Problem Scenario 2
Embedded Pre-question
The student showed little effort in his response and did not completely answer it. He did however
give a partial response, and received 1 out of 2 points. This shows that he does not understand
the content, as his answer was not complete and his ideas were incorrect.
Microworld
In the Explore phase of the microworld, the student did not scan the baseline. He added and
removed many different organisms and then scanned it, giving him one trial in the Explore
phase.
The student then moved to the hypothesis widget and hypothesized that “if the ecosystem has
fewer big fish, more small fish, more seaweed and fewer shrimp, then it will be stable.” This
hypothesis does not maximize the solution and is not a good hypothesis, showing he did not or
was unable to use prior knowledge in making it. It does however stabilize the ecosystem and
therefore the student received a score of 1.
While in the Experiment phase the student manipulated three of the four organisms at once and
then scanned. He scanned this same configuration a total of four times, giving him four total
trials. He did not test the hypothesis or control for variables, as he only tested one set of
conditions in which many things were changed.
With the analysis widget, the student claimed the data supported his hypothesis. He then added
all four of his trials as evidence of this. The trials he selected were all the same and did not

Ecosystem ASSISTment 33
support his claim, as he did not test the hypothesis. Based on this, the student did not show an
understanding of the scientific method. He did not test his hypothesis or run different distinct
trials that controlled for variables. This showed once again, that in addition to little prior content
knowledge, he did not understand or follow the scientific method.
Embedded Post-questions
The student received no points for both of the open response questions. He did not address the
questions in his answer and instead just wrote very short, unconnected information. This shows
little effort as well as no understanding of the microworld and its content.
Posttest
The student received a total score of 2 on the posttest, correctly answering two of the multiple
choice questions and receiving zero points on the open response. The student was very
unmotivated to answer the questions as he had already seen them in the pretest. Because of this
he did not put in much effort, as seen through is two word open response answer. He did not
show gains as this score was lower than his pretest score.
Student 110963
Pretest
Student 110963 scored a total score of 4 out of 12 on the pretest. He received 2 out of 10 points
for the multiple choice and the full 2 points on the open response. This low score suggests the
student may have little prior knowledge of the subject.

Ecosystem ASSISTment 34
Problem Scenario 1
Microworld
The student went back and explored the ecosystem in the Explore phase of the microworld rather
than making a hypothesis and going to the Experiment phase. In this he did not scan the baseline.
Of the 11 scans at were made, only four were distinct, so the student did not seem to fully grasp
the proper procedure for experimentation. He was able to stabilize the ecosystem during this
Explore phase.
The student then moved onto the hypothesis widget and hypothesized that “If the ecosystem has
fewer big fish and more shrimp, then it will be stable.” This is incorrect and couldn’t possibly
stabilize, and is given a score of 0. As the directions told them to hypothesize that more seaweed
was needed, he either did not read the directions or chose to disregard them. The student did not
act upon his hypothesis, adding more seaweed rather than shrimp, which caused him to stabilize
the ecosystem.
The student only scanned once outside of the Explore phase, and thus performed only one trial in
the Experiment phase of the microworld. He did not test his hypothesis and did not collect
corresponding data to be used in the analysis phase. He submitted his only trial as evidence of his
claim that his data supports his hypothesis, though it did not. Based on this the student did not
show understanding of the scientific method of observing, hypothesizing, testing, and then
interpreting the data. He did all his testing before making the hypothesis, did not do any
experiments in which he could gather data to interpret, and did not scan the baseline. He has not
Ecosystem ASSISTment 35
shown prior knowledge of the subject, as seen through his pretest score, and he did not show
understanding of the scientific method while doing this problem scenario.
Embedded Post-questions
The student got a score of 1 on the embedded open response question. His answer did not fully
answer the questions and showed little understanding gained from the problem scenario that had
just been completed. He also scored only 1 of 4 points on the embedded multiple choice
questions. This shows that the he did not have prior vocabulary knowledge to apply to the food
web shown in the microworld.
Problem Scenario 2
Embedded Pre-question
For the open response pre-question the student received a full 2 points. His answer as to what his
thoughts were on predator/prey relationships was complete and satisfactory, showing sufficient
understanding of the subject.
Microworld
The student went back and explored the ecosystem in the Explore phase of the microworld rather
than making a hypothesis and going to the Experiment phase. In this he did not scan the baseline.
Of the forty-nine scans at were made, thirty-nine were distinct, indicating that the student seemed
to somewhat grasp the proper procedure for experimentation, however the number of scans was
high relative to other students in the sample. This may indicate that the student was fooling
around, and did not have a clear understanding of the aim of his experimentation. The student
then made the hypothesis that “if the ecosystem has more small fish, then it will be stable.” This
Ecosystem ASSISTment 36
will stabilize the ecosystem and is a valid hypothesis, but is not the ideal hypothesis that more
small fish and more big fish are needed which would maximize the population of the shrimp, so
a score of 2 was given.
The student did in fact test this hypothesis, but only scanned once in the Experiment phase. The
student claimed the data did support the hypothesis, but had only one trial, which he submitted as
evidence. Still, this trial followed his hypothesis and stabilized the ecosystem, so it can be
thought to support it. He did not test his hypothesis quite as the scientific method describes,
which gave him insufficient data to interpret or use as evidence to support or refute his
hypothesis, but his activity may have been merely misplaced in the Explore phase. Despite poor
performance thus far, the student showed signs of greater understanding in working in this
microworld.
Embedded Post-questions
In the both of the open response questions the student received a score of 0. His answers were
merely mashed keys resulting in gibberish that showed no understanding of the relationships in
the ecosystem. This showed that he was not motivated to answer the questions properly, despite
much effort invested in the preceding microworld activity. However, it is possible that the
gibberish answer is due to a logging error.
Posttest
The student scored 3 out of 10 on the multiple choice questions and 0 on the open response
questions giving him a total posttest score of 3 out of 12. His multiple choice score was slightly
higher than on his pretest. His open response score was lower, although that can be attributed to

Ecosystem ASSISTment 37
lack of interest or logging error, since it contained key-mashed gibberish. His scores show a
slight drop, not providing us with any evidence of learning from the procedure.
Student 110972
Pretest
Student 110972 scored a total score of 4 out of 12 on the pretest. He received 3 out of 10 points
for the multiple choice and 1 point on the open response. This low score suggests the student
may have little prior knowledge of the subject.
Problem Scenario 1
Microworld
The student went back and explored the ecosystem in the Explore phase of the microworld rather
than making a hypothesis and going to the Experiment phase. However, he did scan the baseline.
Of the twenty scans that were made, only six were distinct, so the student did not seem to fully
grasp the proper procedure for experimentation. He did not stabilize the ecosystem.
The student then moved onto the hypothesis widget and hypothesized that “If the ecosystem has
more seaweed, then it will be stable.” This is correct, and precisely what the directions told them
to hypothesize, earning a score of 3. The student did not act upon his hypothesis however, which
prevented him from stabilizing the ecosystem. The trial he submitted had resulted in only
seaweed remaining, with all other species having died off.
The student only scanned once outside of the Explore phase, and thus performed only one trial in
the Experiment phase of the microworld. He did not test his hypothesis and did not collect

Ecosystem ASSISTment 38
corresponding data to be used in the analysis phase. He submitted his only trial as evidence of his
claim that his data supports his hypothesis, though it did not. Based on this the student did not
show understanding of the scientific method of observing, hypothesizing, testing, and then
interpreting the data. He did all his testing before making the hypothesis and then did not do any
experiment in which he could gather data to interpret. He has not shown prior knowledge of the
subject, as seen through his pretest score, and he did not show understanding of the scientific
method while doing this problem scenario.
Embedded Post-questions
The student got a score of 1 on the embedded open response question. His answer did not fully
answer the questions and showed little understanding gained from the problem scenario that had
just been completed. He also scored only 1 out of 4 on the embedded multiple choice questions.
This shows that the he did not have prior vocabulary knowledge to apply to the food web shown
in the microworld.
Problem Scenario 2
Embedded Pre-question
For the open response pre-question the student received a 1 out of 2. His answer as to what his
thoughts were on predator/prey relationships was incomplete and not entirely satisfactory,
showing some understanding of the subject.

Ecosystem ASSISTment 39
Microworld
The student went straight to making a hypothesis and going to the Experiment phase. In this he
did not scan the baseline. The student made the hypothesis that “if the ecosystem has more
seaweed, then it will be stable.” This will not stabilize the ecosystem, and is completely
incorrect, as the ideal hypothesis would be that more small fish and more big fish are needed, so
it was scored 0. He added a number of seaweed to the ecosystem and scanned that as his only
trial, indicating that the student did not quite grasp the proper procedure for experimentation. It is
curious that this would have been the correct hypothesis and scan for the previous microworld,
and perhaps the student assumed that the answer would be the same, though the approach was
insufficient regardless. This indicates a poor understanding of and attention to the problem.
The student did in fact test this hypothesis, but only scanned once. The student claimed the data
did support the hypothesis, but had only one trial, which he submitted as evidence. This trial
followed his hypothesis, but did not stabilize the ecosystem, so it did not support it. Based on
this, the student did not show any more understanding of the scientific method than before. He
did not test his hypothesis as the scientific method describes, which gave him insufficient data to
interpret or use as evidence to support or refute his hypothesis. However, he may have made the
assumption that this microworld had the same correct hypothesis as the previous one, and
thought that the correct hypothesis was all that mattered, though it was not even correct for this
microworld. The student showed no signs of greater understanding in working in this
microworld.

Ecosystem ASSISTment 40
Embedded Post-questions
In the first open response question the student received a score of 1. His answer was insufficient
and showed little understanding of the relationships in the ecosystem. This would be consistent
with his data so far. A logging error prevented his second open response answer from being
recorded.
Posttest
The student scored 3 out of 10 on the multiple choice questions and 1 on the open response
questions giving him a total posttest score of 4 out of 12. His scores show no change, providing
us with no evidence of any learning from the procedure.
Student 110966
Pretest
Student 110966 scored a total score of 6 out of 12 on the pretest. He received 5 out of 10 points
for the multiple choice and 1 point on the open response. This medium score suggests the student
may have some prior knowledge of the subject.
Problem Scenario 1
Microworld
The student went straight to making a hypothesis and going to the Experiment phase. The student
hypothesized that “If the ecosystem has more small fish, more big fish, more shrimp, and more
seaweed, then it will be stable.” Only the amount of seaweed needed to be increased, and
hypothesizing more of everything does not show proper understanding or effort, so the
Ecosystem ASSISTment 41
hypothesis was scored 0. The student did scan the baseline. Of the fourteen scans at were made,
only six were distinct, so the student did not seem to fully grasp the proper procedure for
experimentation.
The student tested his hypothesis, and subsequently stabilized the ecosystem. For some reason he
submitted no trials, even though he had fourteen to choose from with relevant data. He also
claimed that his data does not support his hypothesis, though it did. Based on this counter-
intuitive behavior, the student did not show full understanding of the scientific method of
observing, hypothesizing, testing, and then interpreting the data. He continues to show some
knowledge of the subject, as seen through his pretest score.
Embedded Post-questions
An error prevented the student’s answer on the embedded open response question from being
recorded, though he did score a full 4 points on the embedded multiple choice questions. This
shows that the he had prior vocabulary knowledge to apply to the food web shown in the
microworld.
Problem Scenario 2
Embedded Pre-question
For the open response pre-question the student received a full 2 points. His answer as to what his
thoughts were on predator/prey relationships was satisfactory, showing sufficient understanding
of the subject.

Ecosystem ASSISTment 42
Microworld
The student went straight to making a hypothesis and going to the Experiment phase. In this he
did not scan the baseline. The student made the hypothesis that “if the ecosystem has more big
fish, more small fish, fewer seaweed, and more shrimp, then it will be stable.” This is incorrect,
as the ideal hypothesis would be that only more small fish and more big fish are needed, and
such a setup could not stabilize the ecosystem, so it scores a 0. Out of ten scans, four were
distinct, indicating that the student did not quite grasp the proper procedure for experimentation.
The student did in fact test his hypothesis, and stabilize the ecosystem. He also claimed the data
did not support the hypothesis, but submitted no trials as evidence. Based on this, the student
showed some understanding of the scientific method, but still did not understand that he had to
submit trials as evidence. The student showed no clear signs of greater understanding in working
in this microworld.
Embedded Post-questions
In both open response questions the student received a score of 2. His answers were sufficient
and showed good understanding of the relationships in the ecosystem. This continues to show his
good knowledge of the subject matter, and perhaps it was the scientific method or the
microworld’s interface that troubled him.
Posttest
The student scored 3 out of 10 points on the multiple choice and 2 points on the open response
questions giving him a total post-test score of 5 out of 12 points. His scores show a slight
Ecosystem ASSISTment 43
decrease, however it is suspected that by this point the student had lost motivation, as was the
case for most students in the experiment. It does however provide us with no evidence of any
learning from the procedure.
Future Testing and Scaffolding
Learning from the data, there are a number of places where the microworld exercises could be
improved. One significant finding was that students did not properly employ the scientific
method during the activity. They need to be taught to scan the baseline and to make sure that
their scans are distinct. Many students performed all of their experimenting in the Explore phase,
so they should be reminded that data is not gained during the Explore phase, and encouraged to
make a hypothesis and move on to the Experiment Phase after considerable time spent in the
Explore phase. In addition, students should not be allowed to move on with the exercise before
performing the expected tasks, in particular analyzing data without having gathered any. A
pedagogical agent named “Rex” was used to ensure that students entered substantial information
for their open responses, and this agent could possibly be used to relate all the guidelines
mentioned. Also, an inquiry pretest could be implemented to discover each student’s preexisting
knowledge of the scientific method, in order to compare it to their execution during the activity.
Another general problem was that students took wrong actions despite the instructions clearly
contradicting such actions. For instance, the first microworld clearly states that the problem with
the ecosystem is that it lacks seaweed, and that the students should hypothesize that more
seaweed is needed, yet many ignored these instructions and made completely unrelated

Ecosystem ASSISTment 44
hypotheses. It seems that these students skipped over the instructions, likely due to lack of
motivation. A suggestion to prevent this is to condense all instructions into their most crucial
points, explaining what the student should be doing as simply as possible. The instructions
couldn’t be much more prominent than they already were, although the popup instructions for
the current phase may have distracted from them. Perhaps they could be integrated more
dynamically, through popups or some similar format, or the phase instructions could be made
less intrusive. Hopefully future students can be better motivated somehow, such as by offering a
minor reward for completion, or timing the activity so that it doesn’t occur when the students are
tired from school.
Lastly, there are technical errors to correct. A number of open responses weren’t logged due to
an error, crippling the data gathered. The pretest and posttest questions were also in different
orders, so that should be corrected. Many students didn’t understand that the posttest questions
were meant to be a repeat of the pretest questions, so that could be made more clear as well. The
trial performed resorted to showing an image of the ecosystem’s food web on a nearby projector,
but instead it should be included in the actual activity. These adjustments would allow for a more
polished and official scientific exercise.
Conclusions
The ecosystem microworld was developed in order to assess the students’ knowledge of
ecosystems as well as their knowledge and ability to perform inquiry tasks. This was done by
addressing the common misconception in food web ecology that organisms not directly

Ecosystem ASSISTment 45
connected in the web do not affect one another, while the students navigated the microworld
following the steps of the scientific method.
Most of the students showed little to no understanding of the scientific method, as they did not
follow the steps while experimenting. The scientific method includes the steps of exploring,
hypothesizing, testing the experiment to collect data, analyzing the data, and then
communicating the findings in relations. They very rarely scanned the baseline to give the
preliminary data. Also, they often did not test their hypothesis, giving them no conclusive data
for analysis. Since there was no analysis and therefore little was gained from the microworld, the
students did not communicate their findings well. This all shows they were not able to use the
scientific method in their inquiry task.
The students showed no gain in knowledge from the pre- to post-test. Their posttest scores were
either similar to or lower than their pretest scores. The students had already seen the posttest
questions during the pretest and expressed that they did not want to answer them again.
Therefore, the lower scores were concluded to be due to a lack of motivation. Also after doing
the microworld experiments, the students were tired and unmotivated to do any more work. The
students were taken from an afterschool program and had arrived for testing after a day of
school. Because they had already gone through a full day of school, they no longer wanted to do
anything that had to do with learning, and that added to their lack of motivation.
In conclusion, the data shows that in order for the students to succeed in this inquiry task, they
need more knowledge on the scientific method. Also, as discussed above in the previous section,
the data shows many places in which more scaffolding and direction could be used in future
testing as well as changes that could be made to the design. Implementing these changes would

Ecosystem ASSISTment 46
help ensure that useful data is gathered when the assistment becomes implemented in school
systems.

Ecosystem ASSISTment 47
References
Alessi, S. (2000). The Application of System Dynamics Modeling in Elementary and Secondary
School Curricula. Retrieved from http://depts.washington.edu/edtech/Alessi-System.pdf
Gallegos, L., Jerezano, M. E., & Flores, F. (1994) Preconceptions and Relatoins Used by
Children in the construction of Food Chains. Journal of Research in Science Teaching,
31(3), 259-272.
Gotwals, A. W., & Songer, N. B. (2006). Cognitive Predictions: BioKIDS Implementation of the
PADI Assessment System. Retrieved from
http://padi.sri.com/downloads/TR10_BioKIDS.pdf
Gotwals, A. W., & Songer, N. B. (2009). Reasoning Up and Down a Food Chain: Using an
Assessment Framework to Investigate Students’ Middle Knowledge. Wiley InterScience.
Retrieved from http://sitemaker.umich.edu/songer/files/gotwals_songer.foodweb.pdf
Hane, Elizabeth N. (2007). Use of an Inquiry-based Approach to Teaching Experimental Design
Concepts in a General Ecology Course. Teaching Issues and Experiments in Ecology,
Vol. 5. Retrieved from http://tiee.ecoed.net/vol/v5/research/hane/article.html
Lennon, K. & DeBoer, G. E. (2008). Probing Middle School Students’ Understanding of Ideas
About Interdependence in Living Systems Through Content-Aligned Assessment.
Retrieved from
http://www.project2061.org/publications/2061connections/2008/media/5a_Kristen_NAR
ST%20ID%20Poster%20Paper%20final.pdf
Massachusetts Department of Education. (2006). Massachusetts Science and
Technology/Engineering Curriculum Framework. Retrieved from
http://www.doe.mass.edu/frameworks/scitech/1006.pdf
Quellmalz, E. S., Timms, M. J., & Schneider, S. A. (2009). Assessment of Student Learning in
Science and Games. Retrieved from
http://www7.nationalacademies.org/bose/Schneider_Gaming_CommissionedPaper.pdf
Wilensky, U., & Reisman, K. (1998). ConnectedScience: Learning Biology through
Constructing and Testing Computational Theories - an Embodied Modeling Approach.
Proceedings of the Second International Conference on Complex Systems. Retrieved
from http://ccl.northwestern.edu/papers/bio/short/

Ecosystem ASSISTment 48
Appendices
Appendix 1a: Pretest

Ecosystem ASSISTment 49
Appendix 1b: Pretest

Ecosystem ASSISTment 50
Appendix 1c: Pretest
Appendix 1d: Pretest

Ecosystem ASSISTment 51
Appendix 1e: Pretest
Ecosystem ASSISTment 52
Appendix 1f: Pretest

Ecosystem ASSISTment 53
Appendix 1g: Pretest

Ecosystem ASSISTment 54
Appendix 1h: Pretest
Ecosystem ASSISTment 55
Appendix 1i: Pretest

Ecosystem ASSISTment 56
Appendix 1j: Pretest
Ecosystem ASSISTment 57
Appendix 1k: Pretest

Ecosystem ASSISTment 58
Appendix 2: Directions for Problem Sets

Ecosystem ASSISTment 59
Appendix 3a: Problem Set 1 Instructions and Hypothesis Phase Instructions
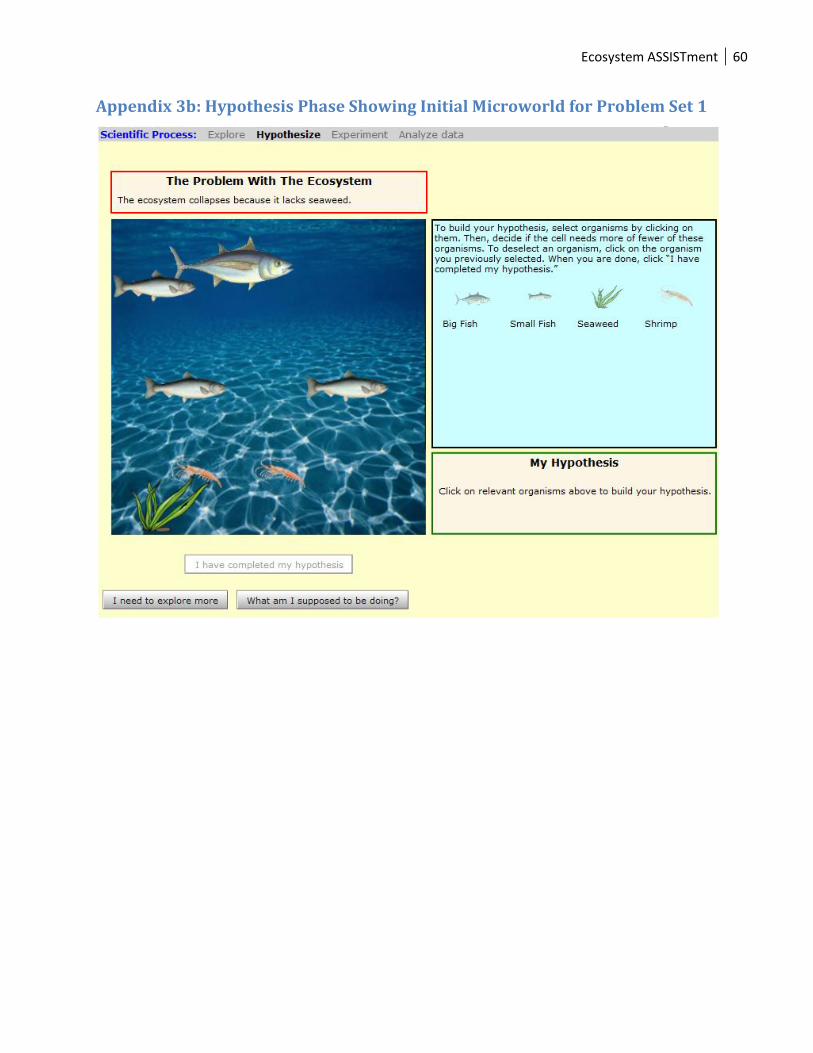
Ecosystem ASSISTment 60
Appendix 3b: Hypothesis Phase Showing Initial Microworld for Problem Set 1

Ecosystem ASSISTment 61
Appendix 3c: Problem Set 1 Instructions and Explore Phase Instructions

Ecosystem ASSISTment 62
Appendix 4: Explore Phase
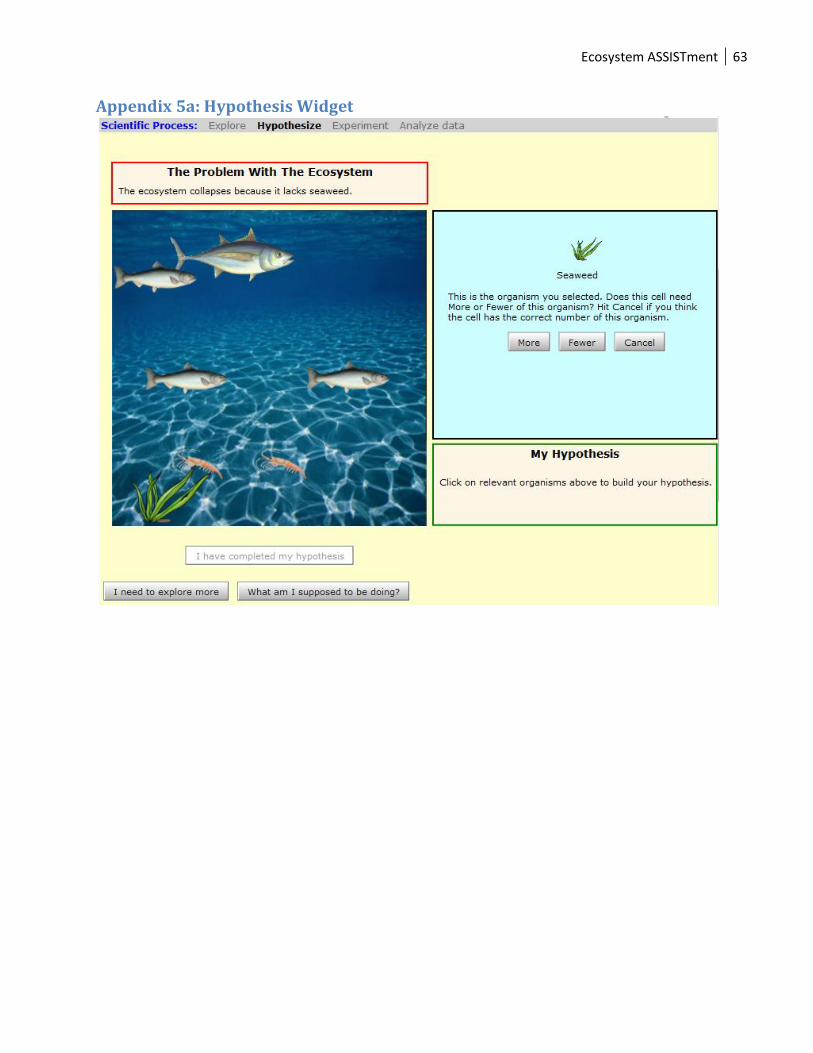
Ecosystem ASSISTment 63
Appendix 5a: Hypothesis Widget

Ecosystem ASSISTment 64
Appendix 5b: Hypothesis Phase with Formed Hypothesis

Ecosystem ASSISTment 65
Appendix 5c: Hypothesis Phase Completion

Ecosystem ASSISTment 66
Appendix 6a: Experiment Phase Instructions

Ecosystem ASSISTment 67
Appendix 6b: Experiment Phase

Ecosystem ASSISTment 68
Appendix 7a: Problem Set 1 Stable Ecosystem Graphed after Scan

Ecosystem ASSISTment 69
Appendix 7b: Graphs of Stable Ecosystem Collapsed Together

Ecosystem ASSISTment 70
Appendix 8a: Analyze Data Phase Part 1 Instructions

Ecosystem ASSISTment 71
Appendix 8b: Analyze Data Phase Part 1

Ecosystem ASSISTment 72
Appendix 8c: Analyze Data Phase Part 2 Instructions

Ecosystem ASSISTment 73
Appendix 8d: Analyze Data Phase Part 2

Ecosystem ASSISTment 74
Appendix 8e: Analyze Data Completion

Ecosystem ASSISTment 75
Appendix 9a: Problem Set 1 Embedded Open Response Question

Ecosystem ASSISTment 76
Appendix 9b: Problem Set 1 Embedded Multiple Choice Questions
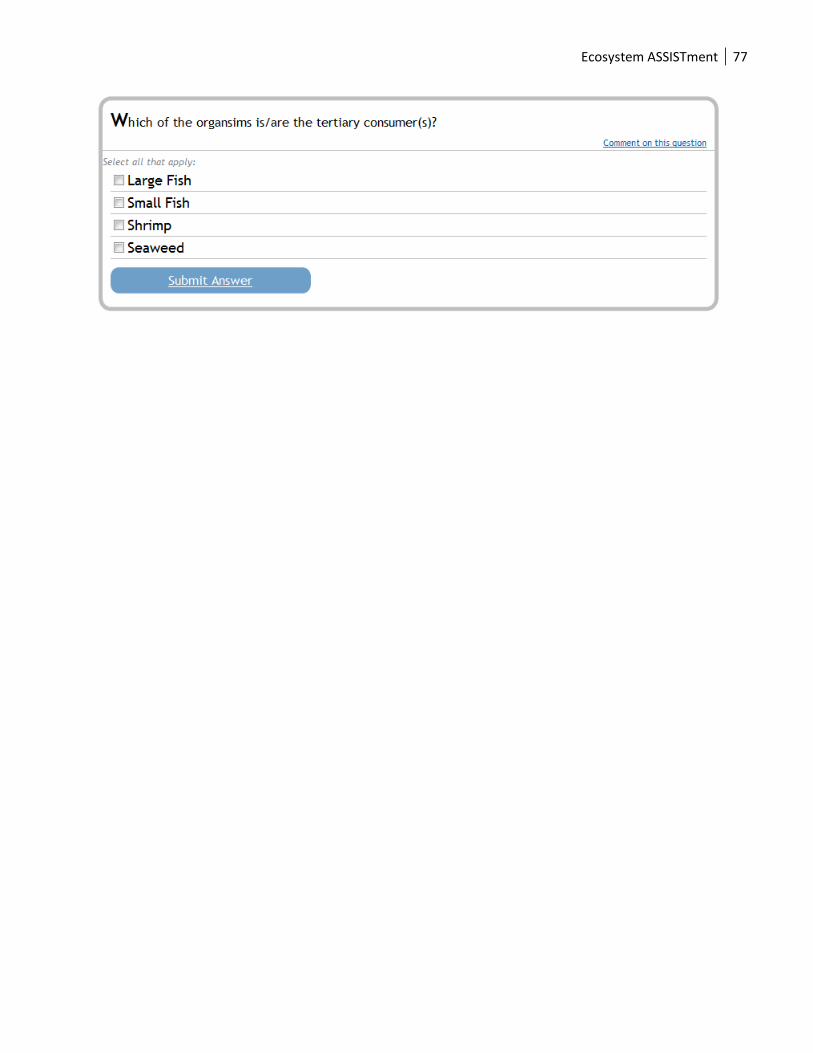
Ecosystem ASSISTment 77
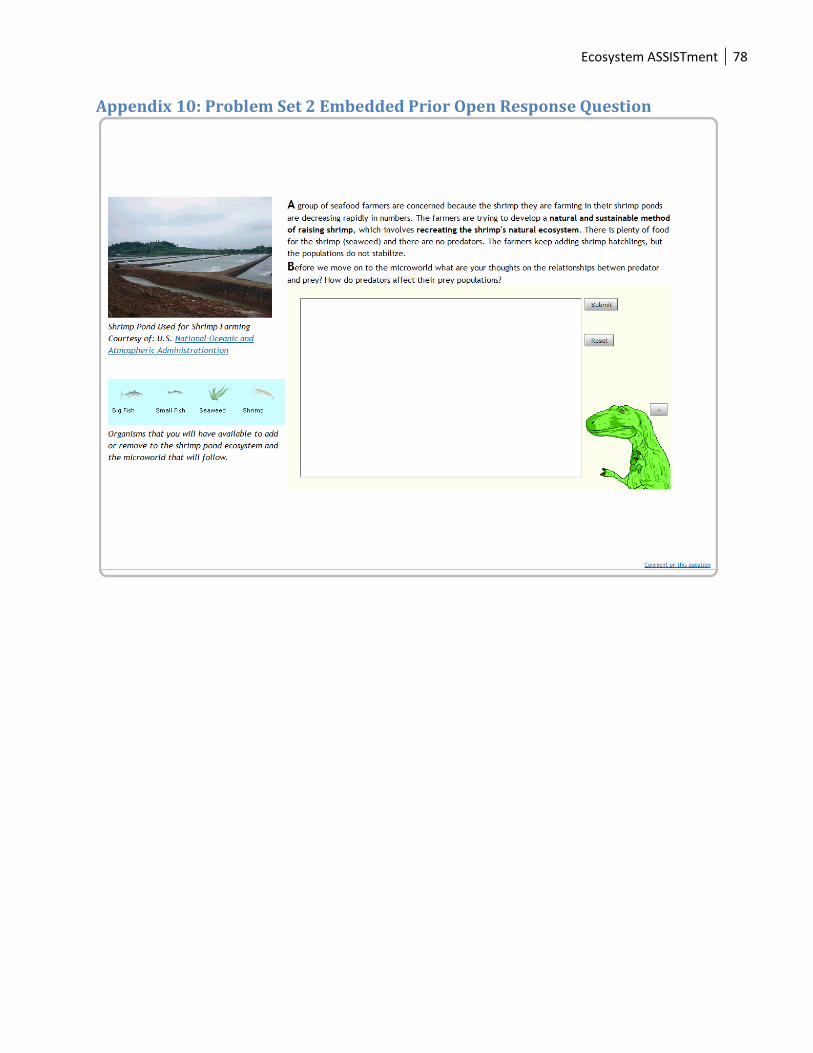
Ecosystem ASSISTment 78
Appendix 10: Problem Set 2 Embedded Prior Open Response Question
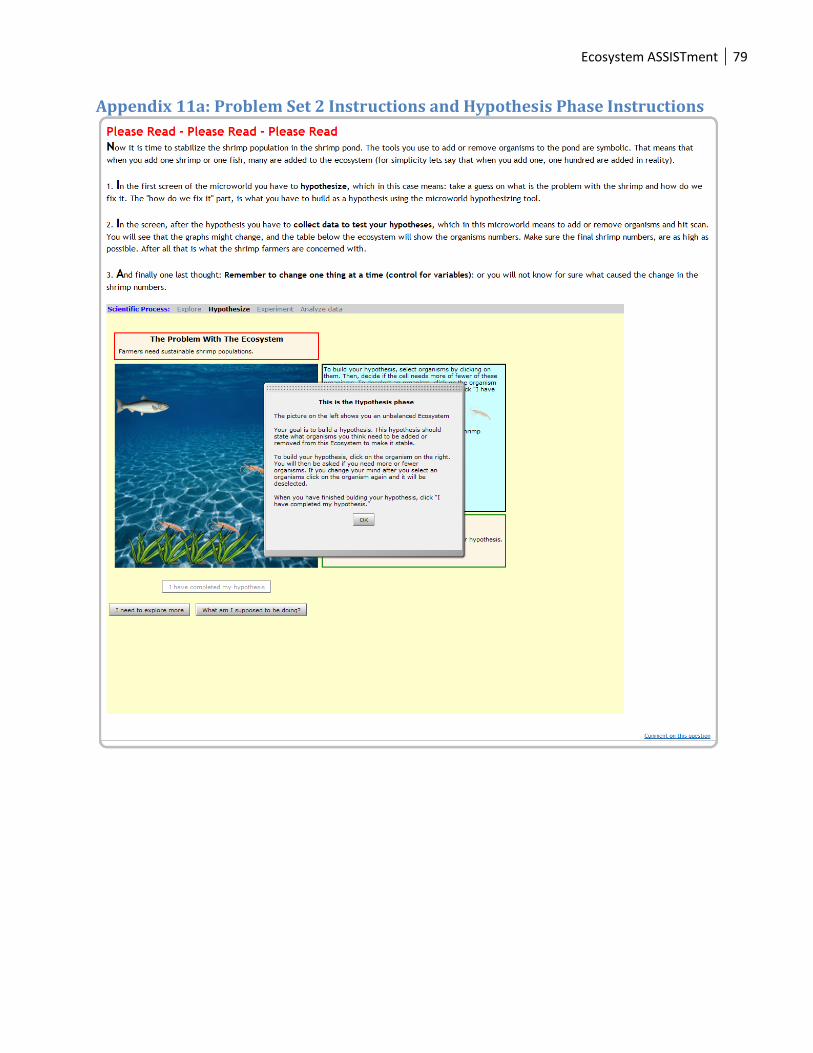
Ecosystem ASSISTment 79
Appendix 11a: Problem Set 2 Instructions and Hypothesis Phase Instructions
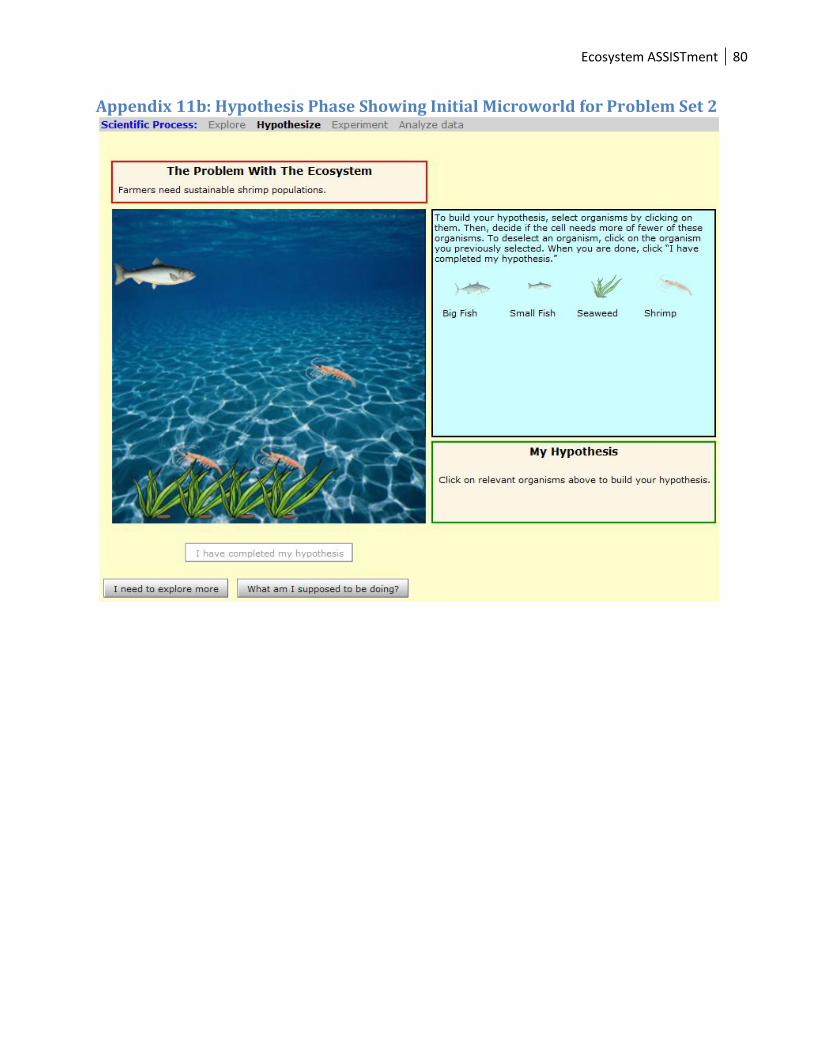
Ecosystem ASSISTment 80
Appendix 11b: Hypothesis Phase Showing Initial Microworld for Problem Set 2

Ecosystem ASSISTment 81
Appendix 11c: Problem Set 2 Instructions and Experiment Phase Instructions

Ecosystem ASSISTment 82
Appendix 11d: Problems Set 2 Experiment Phase

Ecosystem ASSISTment 83
Appendix 11e: Problem Set 2 Stable Ecosystem Graphed after Scan

Ecosystem ASSISTment 84
Appendix 12a: Problem Set 2 Embedded Subsequent Open Response Question 1

Ecosystem ASSISTment 85
Appendix 12b: Problem Set 2 Embedded Subsequent Open Response Question 2
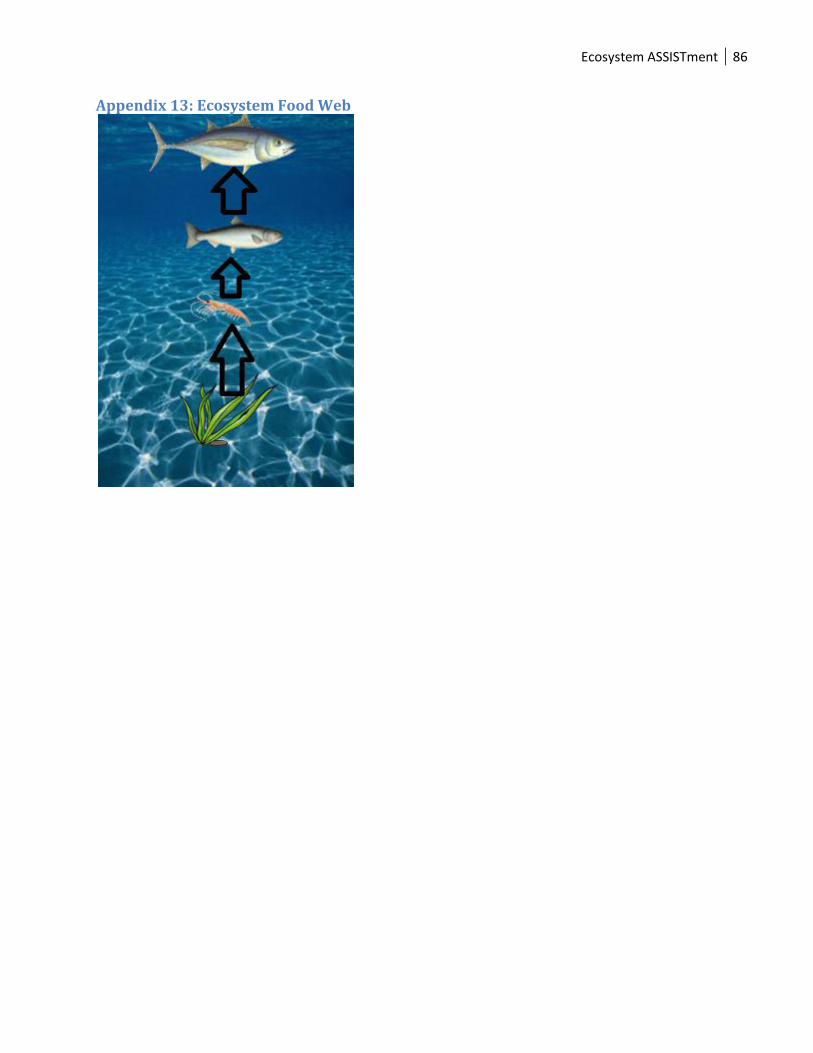
Ecosystem ASSISTment 86
Appendix 13: Ecosystem Food Web