sbi equity fund february 2018 - loan | investmentregular flows from mutual funds have kept the...
TRANSCRIPT

February 2018
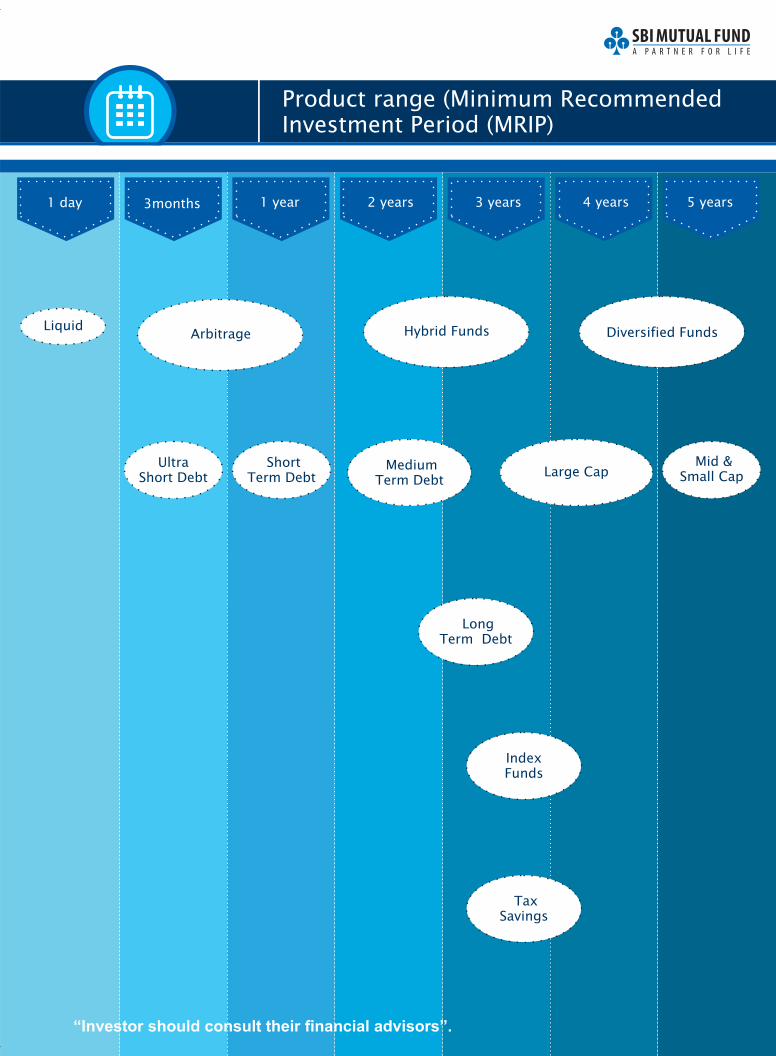
Product range (Minimum RecommendedInvestment Period (MRIP)
1 day
Liquid
3months 5 years4 years3 years2 years1 year
Arbitrage Hybrid Funds Diversified Funds
UltraShort Debt
ShortTerm Debt
MediumTerm Debt
Large CapMid &
Small Cap
LongTerm Debt
IndexFunds
TaxSavings
“Investor should consult their financial advisors”.
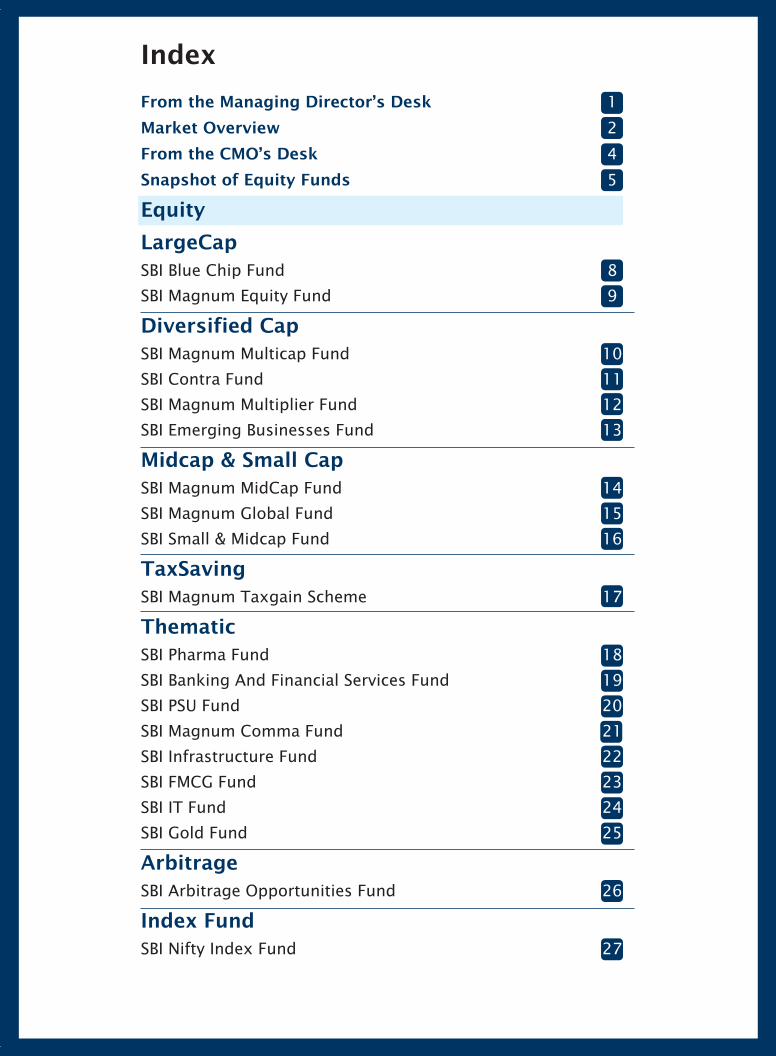
Index
From the Managing Director’s Desk
Market Overview
From the CMO’s Desk
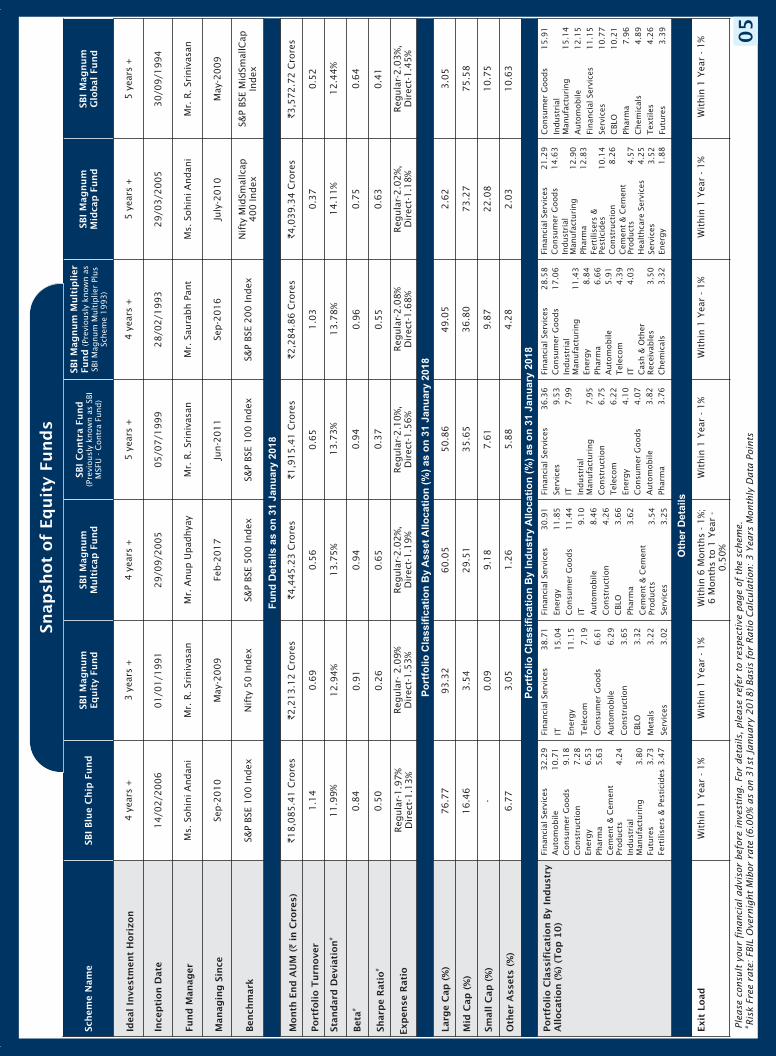
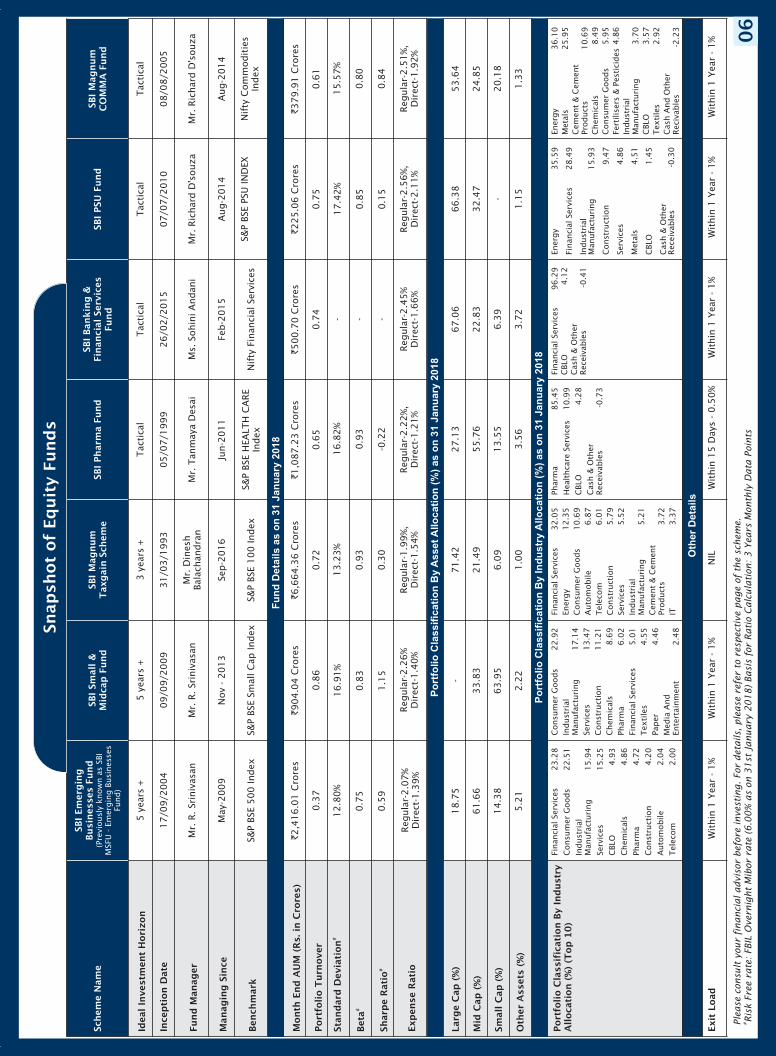
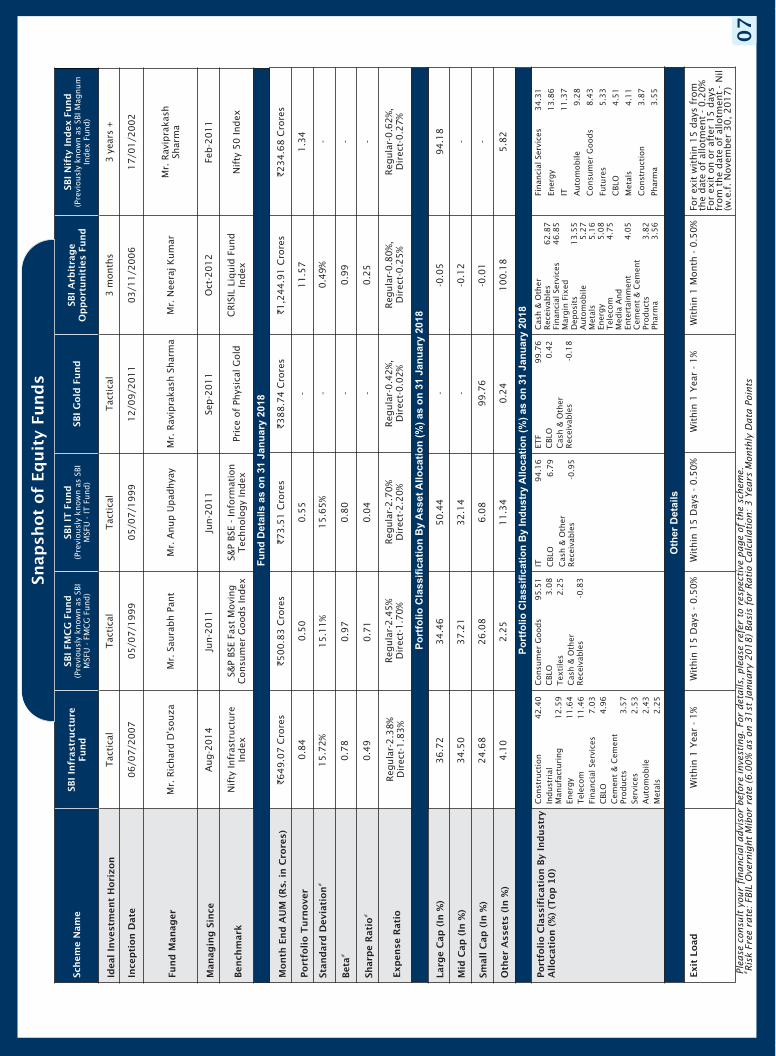
Snapshot of Equity Funds
Equity
LargeCap
Diversified Cap
Midcap & Small Cap
TaxSaving
Thematic
Arbitrage
Index Fund
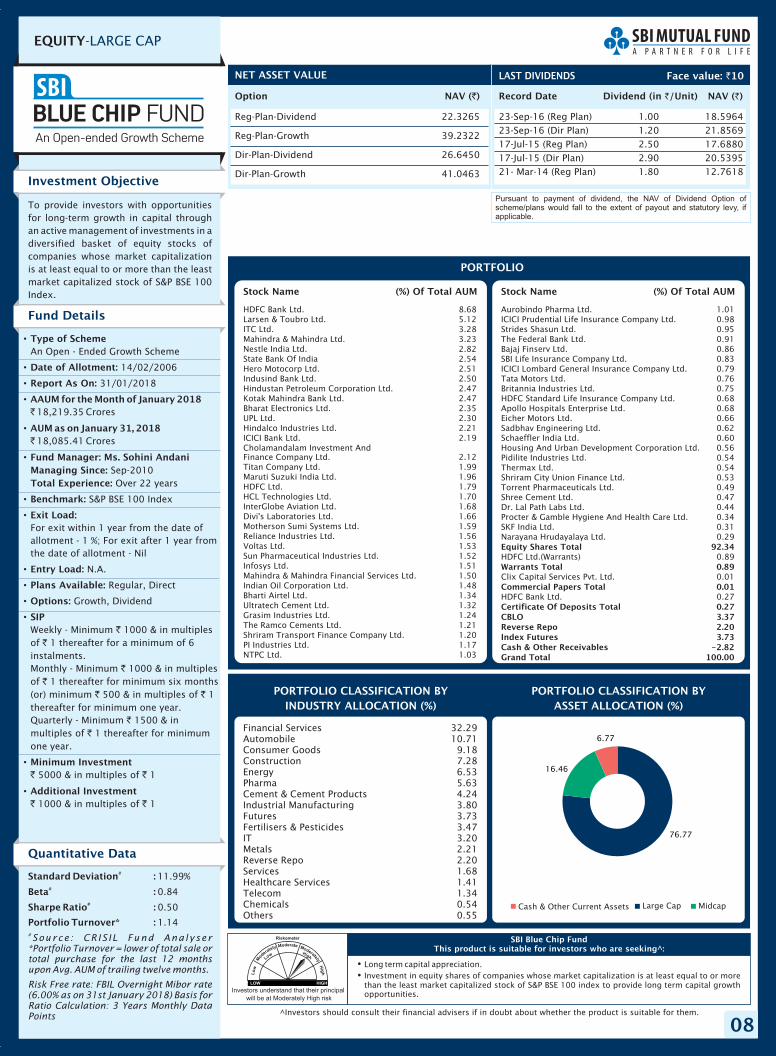
SBI Blue Chip Fund
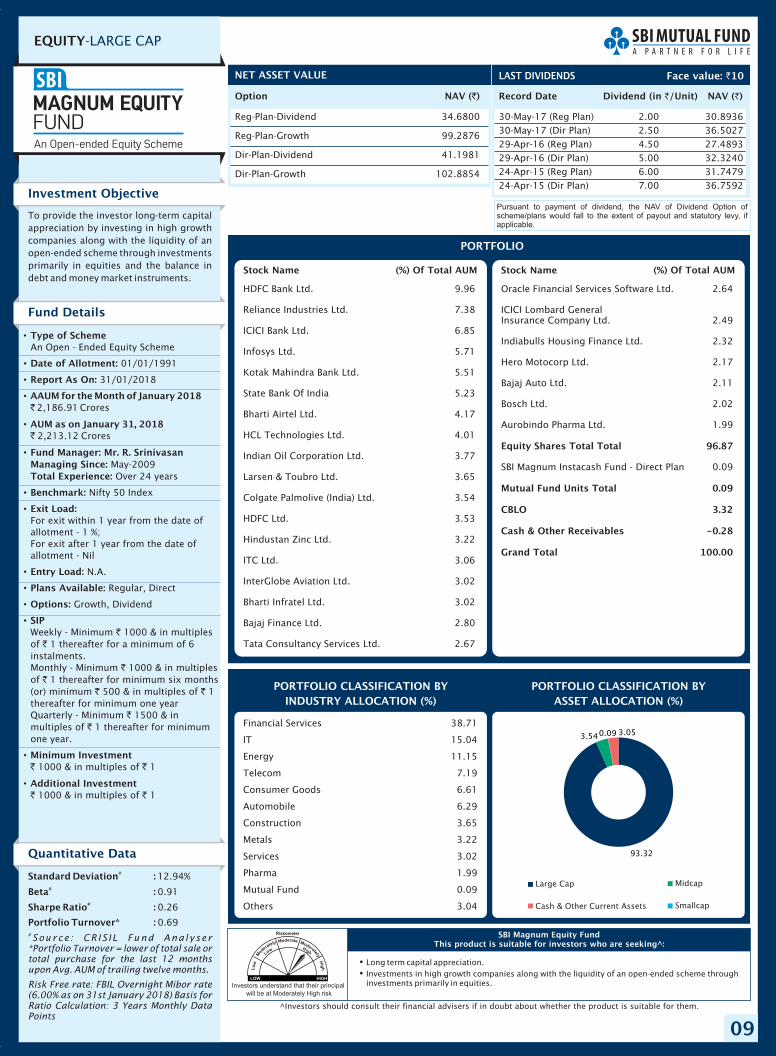
SBI Magnum Equity Fund
SBI Magnum Multicap Fund
SBI Contra Fund
SBI Magnum Multiplier Fund
SBI Magnum MidCap Fund
SBI Magnum Global Fund
SBI Small & Midcap Fund
SBI Magnum Taxgain Scheme
SBI Pharma Fund
SBI Banking And Financial Services Fund
SBI PSU Fund
SBI Magnum Comma Fund
SBI Infrastructure Fund
SBI FMCG Fund
SBI IT Fund
SBI Gold Fund
SBI Arbitrage Opportunities Fund
SBI Nifty Index Fund
SBI Emerging Businesses Fund
1
2
4
5
8
9
10
11
12
14
15
16
17
18
19
20
21
22
23
24
25
26
27
13
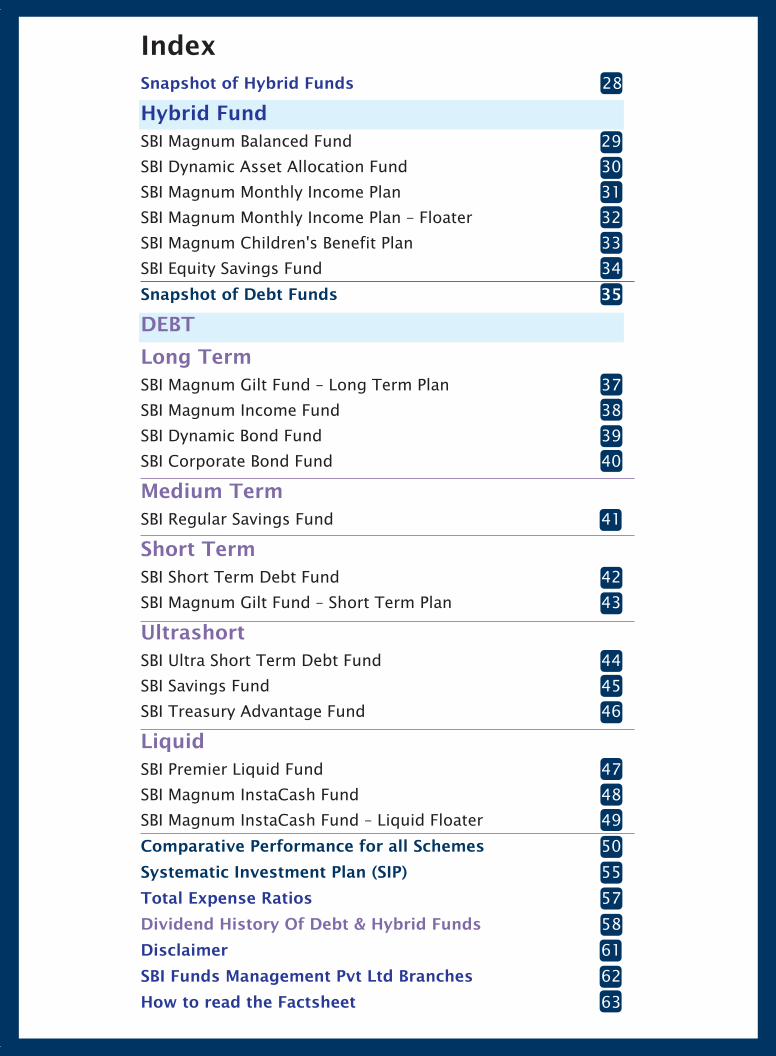
IndexSnapshot of Hybrid Funds
How to read the Factsheet
Hybrid Fund
Total Expense Ratios
Disclaimer
SBI Funds Management Pvt Ltd Branches
SBI Magnum Balanced Fund
SBI Dynamic Asset Allocation Fund
SBI Magnum Monthly Income Plan
SBI Magnum Monthly Income Plan – Floater
SBI Magnum Children's Benefit Plan
SBI Equity Savings Fund
SBI Magnum Gilt Fund – Long Term Plan
SBI Magnum Income Fund
SBI Dynamic Bond Fund
SBI Corporate Bond Fund
SBI Regular Savings Fund
SBI Short Term Debt Fund
SBI Magnum Gilt Fund – Short Term Plan
SBI Ultra Short Term Debt Fund
SBI Savings Fund
SBI Treasury Advantage Fund
SBI Premier Liquid Fund
SBI Magnum InstaCash Fund
SBI Magnum InstaCash Fund – Liquid Floater
28
29
30
31
32
33
34
63
35
37
38
39
40
41
42
43
44
45
46
47
48
49
50
55
57
58
61
62
Snapshot of Debt Funds
Comparative Performance for all Schemes
Systematic Investment Plan (SIP)
DEBT
Long Term
Short Term
Ultrashort
Liquid
Medium Term
Dividend History Of Debt & Hybrid Funds
From the Managing Director’s Desk
Dear Investors,
Managing Director & CEO
Indian equity markets touched new highs in the first month of the calendar year 2018. S&P BSESensex was up 5.6% and Nifty 50 delivered 4.7% returns in the month of January 2018. Marketmovement was a result of positive global and domestic economic cues such as centralgovernments reduced borrowing plan, improved GST collections for December 2017, strong IIPnumbers and IMF’s positive growth forecast of Indian economy for 2018-19. Mutual Funds alsoreplicated the market trend with positive net inflows of 1.06 lakh crore for the last month ofJanuary 2018.
Regular flows from mutual funds have kept the equity market buoyant and have also beeninstrumental in reducing the impact on markets of sustained FII outflows in the recent quarters.Mutual Funds through 1.8 crore SIP accounts is contributing approximately more than 5,000crores every month. Securities and Exchange Board of India (SEBI) is also working towards makingthe industry more transparent and investor friendly. Against this backdrop, year 2018 will witnessimplementation of two key reforms for the mutual fund industry. SEBI has issued guidelines withrespect to scheme categorisation and benchmarking for mutual funds with a view to enable easierscheme selection and better performance comparison for the investors.
Categorisation & Rationalisation of Mutual Fund schemes would allow only one scheme per sub-categories defined within the broad five scheme categories viz. Equity, Debt, Hybrid, SolutionOriented and other schemes. SEBI intends to eliminate the situation of having multiple schemeswith overlapping strategies through this exercise. Scheme categorisation will also enablesimplification of choices for the investors as schemes under each category will have similarcharacteristics and investment universe across the industry.
Second key regulatory change is the change in benchmark indices for mutual funds’ performancecomparison from Price Return Index (PRI) to Total Return Index (TRI). TRI is computed taking intoaccount the dividend and interest payments on the index constituents over and above the capitalgains that form a part of PRI. This change would align Indian mutual funds in line with the globalpractices.
These regulatory initiatives are a welcome change for the mutual fund industry. This will help tocreate better transparency for the investors and enable higher acceptance of mutual funds as apreferred investment avenue. These steps will also support the process of financial inclusion – oneof the key themes of the current government.
We at SBI Mutual fund, welcome the initiatives taken by the regulator to enhance the reach andacceptance of mutual funds in India. We endeavor to support our investors with their investmentneeds in all possible ways and to make their investment journey effortless and fulfilling. Keepingthe same in mind, we are working towards creating and improving our digital assets such aswebsite, mobile application and distribution portal for all our stakeholders. You may get in touchwith your financial advisor or visit our website for information on SBI Mutual Fund products.
Warm Regards,
Anuradha Rao
`
`
Anuradha RaoMD & CEO
01
Market Overview
Navneet MunotED & CIO
2018-19 budget faced unique pressures and constraints. India has participated in the globalequity market rally but not fully in the global growth momentum - laying the narratives forcounter-cyclical growth supportive measures in the budget. A pre-election year budget laid thepossibility of higher expenditures and palliatives to certain stressed sectors of the economy. But,the rating upgrade by Moody’s had put the credibility pressure on the stated fiscal consolidationpath. Further, with the advent of GST, government may not be able to change vast majority ofindirect taxes, leave aside the prevailing uncertainty on the final revenue buoyancy. And finally, oilat US$ 70 per barrel and rising bond yields have begun to induce macroeconomic pressures andconstrain the fiscal space.
Amidst all the push and pulls, the government had eventually sided with glidepath on fiscalconsolidation. Fiscal slippage in 2017-18 was limited to 30bps and revised deficit estimate ispegged at 3.5% of GDP. The shortfall in indirect tax collection, profits transfer from RBI andtelecom related receipts were only partly offset by higher direct taxes and disinvestment receipts,and explain the fiscal slippage.
FY19 pencils the deficit at 3.3% of GDP. Overall fiscal arithmetic looks credible and has frayed awayfrom any populist spending. The consolidation is achieved largely through expenditure restraint.
Interestingly, tax-to-GDP is at the highest level while government expenditure to GDP is at ahistoric low. Total expenditure (ex of GST cess transfer to states) is budgeted to grow at just 9.1%.However, oil subsidy is unchanged for next year and could be at risk of slippage if crude oil stayshigh. While the capex spending share through budgetary resources is gradually declining, it ismade good by increased capex through PSEs’ resources. A large part of the expenditure side(salaries, pensions, defense, interest payment) is sticky. Hence, it is imperative that tax-to-GDPratio increase substantially to enable higher spending on social and physical infrastructure. Tothat end, GST, digitalization, data mining, crackdown on black money followed by likely reformson the direct tax side should lead to higher tax revenues going forward.
Barring the uncertainty on GST (in the light of pending refunds and devolution to states), theassumed tax buoyancy on budgeted taxes appears realistic. Dividend from RBI and PSUs same aslast year and telecom revenue at 487 billion – all appear to be credible. FY18 has seen the highestdisinvestment proceeds in the history. Also, it is the first time in last 15 years that thedisinvestment targets have been over-achieved. In FY19, the divestment proceeds have beenpegged at 800 billion, which looks achievable. We hope to see beginning of strategic sales, ascharted by NITI Aayog, materializing next year.
The budget continued its focus on rural economy and the farm sector- with measures focusingparticularly on enhancing productivity. Government intends to ensure that the difference betweenMSP and market price is compensated to the farmers. The intent to liberalize the export ofagriculture and commence an operation green (targeting higher production of key vegetables)bode well for the farm income. Phase III of the Pradhan Mantri Gram Sadak Yojna (PMGSY) willfocus on improving the hinterland connectivity. The monetary allocation and targets for the ruralhousing schemes, though, stands broadly unchanged.
One of the big moves in budget was the expansion of social security ambit. This is pertinent torealize our true demographic potential and achieve an inclusive growth. While the monetary outlayon the new grand health insurance scheme in this budget is low, it can be ramped up as the proper
`
`
02
eco-system is put in place. MGNREGA, Financial Inclusion, Atal pension scheme, Ujjwala Yojna andnow the health insurance – India is constructing a variable of Universal Basic Income for at least itsbottom of the pyramid. That said, effective execution will be the key.
The corporate tax rates for small businesses were cut to 25%. Tax relief to senior citizens, salariedemployees and small enterprises can likely help in increasing the disposable income. Support toMSME sector can have positive impact on job creation. US has embarked on a sharp tax rate reductionwhich may be followed by most other economies. India may eventually have to follow suit and lowertax rate for big corporates as well. The thought of having a unique ID for businesses (on the lines ofAadhar which is for individuals) can go a long way in improving the ‘ease of doing business’.
Despite the headline commitment to fiscal consolidation and lower than expected gross marketborrowings, bond market sold off. 10 year G-sec yield rose by 18 bps to 7.60%, suggesting the likelyconcern on MSP-hikes pushing inflation expectations higher and possible change in RBI’s stance.Rising global bond yields and crude oil prices are also weighing on the sentiments.
While the budget opens the door for large MSP revision, the eventual inflationary and fiscal impactwill depend on the methodology for measuring the cost of production. A cursory study of the currentprice setting mechanism suggests that most agri-products are already witnessing an MSP of nearly1.5x of their production cost.
The imposition of LTCG tax on equities and increased income tax exemption for senior citizens mayattract more funds in the fixed income space. However, one also needs to take cognizance of theincreased borrowings through public sector enterprises. Further the expected credit recovery canreduce the banks’ appetite for government bonds. Banks’ holding of G-Sec is already well above theSLR level and foreign investor limit on government securities is nearly used up. However, withincreased penetration of insurance and pension sector, one needs to keenly watch their demand forbonds. We believe, investor should build exposure gradually as bond yields are entering in anattractive zone.
Coming to the equity market, the budget finally quelled the long-standing market speculation onlong term capital gains tax (LTCG). Budget measures leading to higher disposable income along withfarm and rural thrust, consumption growth momentum should continue. The continued focus on theinfrastructure (9% increases in monetary allocation) is positive for the related sectors.
Rising bond yields may have an impact on domestic equity flows while global liquidity tighteningcould challenge the FII investment. To that extent, earnings trajectory will be closely watched in2018. So far, the latest Q3 FY18 results are comforting. The revival in earnings is critical for such richvaluations to sustain. Last few years have favored growth over value stocks. However, recently wehave seen interest emerging in contrarian themes such as corporate lenders, IT, telecom andconstruction. After the stellar performance in 2018, particularly in the mid and small caps segment,it is very important to keep an eye on valuations. With little scope of valuation re-rating, bulk of thereturns are likely to be guided by earnings growth. We continue to focus on bottom up stock pickingwhich we believe is the best way to generate alpha.
The event is behind us, so back to global cues and earning trajectory!
Navneet Munot, ED & CIO – SBI Funds Management Private Limited
(Mutual funds' investments are subject to market risks, read all scheme related documentscarefully.)
03
Dear Friends,
Executive Director & CMO (Domestic Business)
The Year 2018 started on a very positive note with domestic indices S&P BSE Sensex and Nifty 50
crossing new highs of 36,000 and 11,000 levels and ending the month at 35, 965 and 11,028 points
respectively – up 5.60% and 4.72%. The mutual fund industry saw over 1.06 lakh crore of inflows
taking the overall industry assets to an all-time high of 22.41 lakh crore, with equity-based funds
(Equity, Balanced and ELSS) seeing inflows of over 23,000 crore.
However, post Budget 2018, the equity markets have seen some correction due to some major
announcements. Long-Term Capital Gains (LTCG) tax has been imposed at 10.4% (including the
cess) on capital gains of more than 1 lakh in equity mutual funds and direct equities, after a holding
period of 1 year. For investors who have a long-term investment horizon in mind, this is but a minor
bump in the road.
I certainly recommend you look at your asset allocation and whether you need to invest a bit more to
reach your goals, after accounting for the LTCG tax. This exercise should however be done from time
to time to account for any such changes happening with your investments. I do believe the growth in
equity-based mutual funds is here to stay as despite the LTCG in place, equities as an asset class still
have the potential to deliver better post-tax and inflation-adjusted returns. SIPs clearly are the right
way to invest for the long-term into equity funds and we as an industry will now have to fine tune our
communications even better to communicate that Budget 2018 ke baad bhi mutual funds sahi hai.
As part of our continuous efforts to deliver solutions for our investors’ needs, we at SBI Mutual Fund
launched a unique facility called ‘Bandhan SWP’. Through this facility, you can setup a Systematic
Withdrawal Plan (SWP) with direct monthly payout in your beneficiary’s (family members) bank
account – it can be either your child, sibling, spouse or a parent, by just giving one-time instruction.
This can ensure financial security for your loved ones in the form of funding your child’s higher
education needs, a fixed sum to your spouse/sibling to manage household expenses or may be a
regular allocation of funds to your parents, so that they can face their retirement years with
confidence.
Just choose the Bandhan SWP facility specifying beneficiary details, withdrawal amount and
duration. Submit the application form along with the beneficiary KYC – establishing the relationship
status and bank account proof. Post which, the pay-outs will be directly credited to your
beneficiary’s account. Facilities like SWP are convenient and tax-efficient considering you are taxed
only on the gains of your investment. Visit bandhanswp.sbimf.com to know more.
As always, we value your investments and look forward to your continued patronage.
Warm Regards,
D.P.Singh
`
`
`
`
D.P. SinghED & CMO (Domestic Business)
04
From the CMO’s Desk
Po
rtfo
lio
Cla
ssif
icati
on
By In
du
str
yA
llo
cati
on
(%
) as o
n 3
1 J
an
uary
2018
Port
folio C
lass
ific
ati
on B
y In
dust
ryA
lloca
tion (
%)
(Top
10)
Oth
er
Deta
ils
Exit
Load
Wit
hin
1 Y
ear
- 1%
Wit
hin
1 Y
ear
- 1%
Wit
hin
6 M
onth
s -
1%
;6 M
onth
s to
1 Y
ear
-0.5
0%
Wit
hin
1 Y
ear
- 1%
Wit
hin
1 Y
ear
- 1%
Wit
hin
1 Y
ear
- 1%
Wit
hin
1 Y
ear
- 1%
Finan
cial
Ser
vice
s3
2.2
9A
uto
mobile
10
.71
Consu
mer
Goods
9.1
8C
onst
ruct
ion
7.2
8En
ergy
6.5
3Ph
arm
a5.6
3C
emen
t &
Cem
ent
Product
s4
.24
Indust
rial
Man
ufa
cturi
ng
3.8
0Fu
ture
s3
.73
Fert
ilise
rs &
Pes
tici
des
3.4
7
Finan
cial
Ser
vice
s38.7
1
IT15.0
4
Ener
gy
11.1
5
Tel
ecom
7.1
9
Consu
mer
Goods
6.6
1
Auto
mobile
6.2
9
Const
ruct
ion
3.6
5
CBL
O3.3
2
Met
als
3.2
2
Serv
ices
3.0
2
Finan
cial
Ser
vice
s30.9
1
Ener
gy
11.8
5
Consu
mer
Goods
11.4
4
IT9.1
0
Auto
mobile
8.4
6
Const
ruct
ion
4.2
6
CBL
O3.6
6
Phar
ma
3.6
2
Cem
ent
& C
emen
tPr
oduct
s3.5
4
Serv
ices
3.2
5
Finan
cial
Ser
vice
s36.3
6
Serv
ices
9.5
3
IT7.9
9
Indust
rial
Man
ufa
cturi
ng
7.9
5
Const
ruct
ion
6.7
5
Tel
ecom
6.2
2
Ener
gy
4.1
0
Consu
mer
Goods
4.0
7
Auto
mobile
3.8
2
Phar
ma
3.7
6
Finan
cial
Ser
vice
s28.5
8C
onsu
mer
Goods
17.0
6In
dust
rial
Man
ufa
cturi
ng
11.4
3En
ergy
8.8
4Ph
arm
a6.6
6A
uto
mobile
5.9
1Tel
ecom
4.3
9IT
4.0
3C
ash &
Oth
erRec
eiva
ble
s3.5
0C
hem
ical
s3.3
2
Finan
cial
Ser
vice
s21.2
9C
onsu
mer
Goods
14.6
3In
dust
rial
Man
ufa
cturi
ng
12.9
0Ph
arm
a12.8
3Fe
rtili
sers
&Pe
stic
ides
10.1
4C
onst
ruct
ion
8.2
6C
emen
t &
Cem
ent
Product
s4.5
7H
ealt
hca
re S
ervi
ces
4.2
5Se
rvic
es3.5
2En
ergy
1.8
8
Consu
mer
Goods
15.9
1
Indust
rial
Man
ufa
cturi
ng
15.1
4
Auto
mobile
12.1
5
Finan
cial
Ser
vice
s11.1
5
Serv
ices
10.7
7
CBL
O10.2
1
Phar
ma
7.9
6
Chem
ical
s4.8
9
Tex
tile
s4.2
6
Futu
res
3.3
9
Fu
nd
Deta
ils a
s o
n 3
1 J
an
uary
2018
Month
End
AU
M (
in C
rore
s)`
`18,0
85.4
1 C
rore
s`2,2
13.1
2 C
rore
s`4,4
45.2
3 C
rore
s`1,9
15.4
1 C
rore
s`2,2
84.8
6 C
rore
s`4,0
39.3
4 C
rore
s`3,5
72.7
2 C
rore
s
Port
folio T
urn
over
1.1
40.6
90.5
60.6
51.0
30.3
70.5
2
Exp
ense
Rati
oReg
ula
r-1.9
7%
Dir
ect-
1.1
3%
Reg
ula
r- 2
.09%
Dir
ect-
1.5
3%
Reg
ula
r-2.0
2%
,D
irec
t-1.1
9%
Reg
ula
r-2.1
0%
,D
irec
t-1.5
6%
Reg
ula
r-2.0
8%
Dir
ect-
1.6
8%
Reg
ula
r-2.0
2%
,D
irec
t-1.1
8%
Reg
ula
r-2.0
3%
,D
irec
t-1.4
5%
Stand
ard
Dev
iati
on
Bet
a
#
#
#Sh
arp
e R
ati
o
11.9
9%
0.8
4
0.5
0
12.9
4%
0.9
1
0.2
6
13.7
5%
0.9
4
0.6
5
13.7
3%
0.9
4
0.3
7
13.7
8%
0.9
6
0.5
5
14.1
1%
0.7
5
0.6
3
12.4
4%
0.6
4
0.4
1
Schem
e N
am
eSB
I Blu
e C
hip
Fund
SBI
Magnum
Eq
uit
y Fu
nd
SBI
Magnum
Mult
icap
Fund
SBI
Contr
a F
und
(Pre
viousl
y kn
ow
n a
s SB
IM
SFU
- C
ontr
aFu
nd)
SBI
Magnum
Mult
iplier
Fund
(Pre
viousl
y kn
ow
n a
sSB
I M
agnum
Mult
iplie
r Pl
us
Schem
e 1993)
SBI
Magnum
Mid
cap
Fund
SBI
Magnum
Glo
bal Fu
nd
Idea
l In
ves
tmen
t H
ori
zon
4ye
ars
+3
year
s+
4ye
ars
+5
year
s+
4ye
ars
+5
year
s+
5ye
ars
+
Ince
pti
on D
ate
14/0
2/2
006
01/0
1/1
991
29/0
9/2
005
05/0
7/1
999
28/0
2/1
993
29/0
3/2
005
30/0
9/1
994
Fund
Manager
Ms.
Sohin
i A
ndan
iM
r. R
. Sr
iniv
asan
Mr.
Anup U
pad
hya
yM
r. R
. Sr
iniv
asan
Mr.
Sau
rabh P
ant
Ms.
Sohin
i A
ndan
iM
r. R
. Sr
iniv
asan
Managin
g S
ince
Sep-2
010
May
-20
09
Feb-2
017
Jun-2
011
Sep-2
016
July
-2010
May
-20
09
Ben
chm
ark
S&P
BSE
100 Index
Nif
ty 5
0 Index
S&P
BSE
500 Index
S&P
BSE
100 Index
S&P
BSE
200 Index
Nif
ty M
idSm
allc
ap400 Index
S&P
BSE
Mid
Smal
lCap
Index
Po
rtfo
lio
Cla
ssif
icati
on
By
Asset
Allo
cati
on
(%
) as o
n 3
1 J
an
uary
2018
Larg
e C
ap
(%
)
Mid
Cap
(%
)
Small C
ap
(%
)
Oth
er A
sset
s (%
)
76.7
7
16.4
6
-
6.7
7
93.3
2
3.5
4
0.0
9
3.0
5
60.0
5
29.5
1
9.1
8
1.2
6
50.8
6
35.6
5
7.6
1
5.8
8
49.0
5
36.8
0
9.8
7
4.2
8
2.6
2
73.2
7
22.0
8
2.0
3
3.0
5
75.5
8
10.7
5
10.6
3
Snap
shot
of
Eq
uit
y Fu
nd
s
Ple
ase
consu
lt y
our
financia
l advis
or
befo
re invest
ing. For
deta
ils,
ple
ase
refe
r to
resp
ecti
ve p
age o
f th
e s
chem
e.
#Ris
k F
ree r
ate
: FBIL
Overn
ight
Mib
or
rate
(6.0
0%
as
on 3
1st
January
2018)
Basi
s fo
r Rati
o C
alc
ula
tion: 3 Y
ears
Month
ly D
ata
Poin
ts05
Po
rtfo
lio
Cla
ssif
icati
on
By In
du
str
yA
llo
cati
on
(%
) as o
n 3
1 J
an
uary
2018
Port
folio C
lass
ific
ati
on B
y In
dust
ryA
lloca
tion (
%)
(Top
10)
Finan
cial
Ser
vice
s2
3.2
8
Consu
mer
Goods
22
.51
Indust
rial
Man
ufa
cturi
ng
15
.94
Serv
ices
15.2
5
CBL
O4
.93
Chem
ical
s4
.86
Phar
ma
4.7
2
Const
ruct
ion
4.2
0
Auto
mobile
2.0
4
Tel
ecom
2.0
0
Consu
mer
Goods
22.9
2In
dust
rial
Man
ufa
cturi
ng
17.1
4Se
rvic
es13.4
7C
onst
ruct
ion
11.2
1C
hem
ical
s8.6
9Ph
arm
a6.0
2Fi
nan
cial
Ser
vice
s5.0
1T
exti
les
4.5
5Pa
per
4.4
6M
edia
And
Ente
rtai
nm
ent
2.4
8
Finan
cial
Ser
vice
s32.0
5En
ergy
12.3
5C
onsu
mer
Goods
10.6
9A
uto
mobile
6.8
7Tel
ecom
6.0
1C
onst
ruct
ion
5.7
9Se
rvic
es5.5
2In
dust
rial
Man
ufa
cturi
ng
5.2
1C
emen
t &
Cem
ent
Product
s3.7
2IT
3.3
7
Phar
ma
85.4
5
Hea
lthca
re S
ervi
ces
10.9
9
CBL
O4.2
8
Cas
h &
Oth
erRec
eiva
ble
s-0
.73
Finan
cial
Ser
vice
s96.2
9C
BLO
4.1
2C
ash &
Oth
erRec
eiva
ble
s-0
.41
Ener
gy
35.5
9
Finan
cial
Ser
vice
s28.4
9
Indust
rial
Man
ufa
cturi
ng
15.9
3
Const
ruct
ion
9.4
7
Serv
ices
4.8
6
Met
als
4.5
1
CBL
O1.4
5
Cas
h &
Oth
erRec
eiva
ble
s-0
.30
Ener
gy
36.1
0M
etal
s2
5.9
5C
emen
t &
Cem
ent
Product
s10.6
9C
hem
ical
s8.4
9C
onsu
mer
Goods
5.9
5Fe
rtili
sers
& P
esti
cides
4.8
6In
dust
rial
Man
ufa
cturi
ng
3.7
0C
BLO
3.5
7Tex
tile
s2.9
2C
ash A
nd O
ther
Rec
ivab
les
-2.2
3
Fu
nd
Deta
ils a
s o
n 3
1 J
an
uary
2018
Month
End
AU
M (
Rs.
in C
rore
s)`2,4
16.0
1 C
rore
s`904.0
4 C
rore
s`6,6
64.3
6 C
rore
s`1,0
87.2
3 C
rore
s`500.7
0 C
rore
s`225.0
6 C
rore
s`379.9
1 C
rore
s
Port
folio T
urn
over
0.3
70.8
60.7
20.6
50.7
40.7
50.6
1
Exp
ense
Rati
oReg
ula
r-2.0
7%
Dir
ect-
1.3
9%
Reg
ula
r-2.2
6%
Dir
ect-
1.4
0%
Reg
ula
r-1.9
9%
,D
irec
t-1.5
4%
Reg
ula
r-2.2
2%
,D
irec
t-1.2
1%
Reg
ula
r-2.4
5%
Dir
ect-
1.6
6%
Reg
ula
r-2.5
6%
,D
irec
t-2.1
1%
Reg
ula
r-2.5
1%
,D
irec
t-1.9
2%
Stand
ard
Dev
iati
on
Bet
a
#
#
#Sh
arp
e R
ati
o
12.8
0%
0.7
5
0.5
9
16.9
1%
0.8
3
1.1
5
13.2
3%
0.9
3
0.3
0
16.8
2%
0.9
3
-0.2
2
- - -
17.4
2%
0.8
5
0.1
5
15.5
7%
0.8
0
0.8
4
Schem
e N
am
e
SBI
Em
ergin
gBusi
nes
ses
Fund
(Pre
viousl
y kn
ow
n a
s SB
IM
SFU
- E
mer
gin
g B
usi
nes
ses
Fund)
SBI
Small &
Mid
cap
Fund
SBI
Magnum
Taxgain
Sch
eme
SBI
Pharm
a F
und
SBI
Bankin
g &
Financi
al Se
rvic
esFu
nd
SBI
PSU
Fund
SBI
Magnum
CO
MM
A F
und
Idea
l In
ves
tmen
t H
ori
zon
5ye
ars
+5
year
s+
3ye
ars
+T
acti
cal
Tac
tica
lT
acti
cal
Tac
tica
l
Ince
pti
on D
ate
17/0
9/2
004
09/0
9/2
009
31/0
3/1
993
05/0
7/1
999
26/0
2/2
015
07/0
7/2
010
08/0
8/2
005
Fund
Manager
Mr.
R. Sr
iniv
asan
Mr.
R. Sr
iniv
asan
Mr.
Din
esh
Bala
chan
dra
nM
r. T
anm
aya
Des
aiM
s. S
ohin
i A
ndan
iM
r. R
ichar
d D
'souza
Mr.
Ric
har
d D
'souza
Managin
g S
ince
May
-20
09
Nov
- 2013
Sep-2
016
Jun-2
011
Feb-2
015
Aug-2
014
Aug-2
014
Ben
chm
ark
S&P
BSE
500 Index
S&P
BSE
Smal
l C
ap Index
S&P
BSE
100 Index
S&P
BSE
HEA
LTH
CA
RE
Index
Nif
ty F
inan
cial
Ser
vice
sS&
P BS
E PS
U IN
DEX
Nif
ty C
om
modit
ies
Index
Po
rtfo
lio
Cla
ssif
icati
on
By
Asset
Allo
cati
on
(%
) as o
n 3
1 J
an
uary
2018
Larg
e C
ap
(%
)
Mid
Cap
(%
)
Small C
ap
(%
)
Oth
er A
sset
s (%
)
18.7
5
61.6
6
14.3
8
5.2
1
-
33.8
3
63.9
5
2.2
2
71.4
2
21.4
9
6.0
9
1.0
0
27.1
3
55.7
6
13.5
5
3.5
6
67.0
6
22.8
3
6.3
9
3.7
2
66.3
8
32.4
7
-
1.1
5
53.6
4
24.8
5
20.1
8
1.3
3
Oth
er
Deta
ils
Exit
Load
Wit
hin
1 Y
ear
- 1
%W
ithin
1 Y
ear
- 1%
NIL
Wit
hin
15 D
ays
- 0.5
0%
Wit
hin
1 Y
ear
- 1%
Wit
hin
1 Y
ear
- 1%
Wit
hin
1 Y
ear
- 1%
Snap
shot
of
Eq
uit
y Fu
nd
s
Ple
ase
consu
lt y
our
financia
l advis
or
befo
re invest
ing. For
deta
ils,
ple
ase
refe
r to
resp
ecti
ve p
age o
f th
e s
chem
e.
#Ris
k F
ree r
ate
: FBIL
Overn
ight
Mib
or
rate
(6.0
0%
as
on 3
1st
January
2018)
Basi
s fo
r Rati
o C
alc
ula
tion: 3 Y
ears
Month
ly D
ata
Poin
ts06
Po
rtfo
lio
Cla
ssif
icati
on
By In
du
str
yA
llo
cati
on
(%
)as o
n 3
1 J
an
uary
2018
Port
folio C
lass
ific
ati
on B
y In
dust
ryA
lloca
tion (
%)
(Top
10)
Const
ruct
ion
42.4
0In
dust
rial
Man
ufa
cturi
ng
12.5
9En
ergy
11.6
4T
elec
om
11.4
6Fi
nan
cial
Ser
vice
s7.0
3C
BLO
4.9
6C
emen
t &
Cem
ent
Product
s3.5
7Se
rvic
es2.5
3A
uto
mobile
2.4
3M
etal
s2
.25
Consu
mer
Goods
95.5
1C
BLO
3.0
8Tex
tile
s2.2
5C
ash &
Oth
erRec
eiva
ble
s-0
.83
IT94.1
6
CBL
O6.7
9
Cas
h &
Oth
erRec
eiva
ble
s-0
.95
ETF
99.7
6C
BLO
0.4
2C
ash &
Oth
erRec
eiva
ble
s-0
.18
Cas
h &
Oth
erRec
eiva
ble
s62.8
7Fi
nan
cial
Ser
vice
s46.8
5M
argin
Fix
edD
eposi
ts13.5
5A
uto
mobile
5.2
7M
etal
s5
.16
Ener
gy
5.0
8Tel
ecom
4.7
5M
edia
And
Ente
rtai
nm
ent
4.0
5C
emen
t &
Cem
ent
Product
s3.8
2Ph
arm
a3.5
6
Finan
cial
Ser
vice
s34.3
1
Ener
gy
13.8
6
IT11.3
7
Auto
mobile
9.2
8
Consu
mer
Goods
8.4
3
Futu
res
5.3
3
CBL
O4.5
1
Met
als
4.1
1
Const
ruct
ion
3.8
7
Phar
ma
3.5
5
Fu
nd
Deta
ils
as o
n 3
1 J
an
uary
2018
Month
End
AU
M (
Rs.
in C
rore
s)`649.0
7 C
rore
s`500.8
3 C
rore
s`73.5
1 C
rore
s`388.7
4 C
rore
s`1,2
44.9
1 C
rore
s`234.6
8 C
rore
s
Port
folio T
urn
over
0.8
40.5
00.5
5-
11.5
71.3
4
Exp
ense
Rati
oReg
ula
r-2.3
8%
Dir
ect-
1.8
3%
Reg
ula
r-2.4
5%
Dir
ect-
1.7
0%
Reg
ula
r-2.7
0%
Dir
ect-
2.2
0%
Reg
ula
r-0.4
2%
,D
irec
t-0.0
2%
Reg
ula
r-0.8
0%
,D
irec
t-0.2
5%
Reg
ula
r-0.6
2%
,D
irec
t-0.2
7%
Stand
ard
Dev
iati
on
Bet
a
#
#
#Sh
arp
e R
ati
o
15.7
2%
0.7
8
0.4
9
15.1
1%
0.9
7
0.7
1
15.6
5%
0.8
0
0.0
4
- - -
0.4
9%
0.9
9
0.2
5
- - -
Schem
e N
am
eSB
I In
frast
ruct
ure
Fund
SBI
FMC
G F
und
(Pre
viousl
y kn
ow
n a
s SB
IM
SFU
- F
MC
G F
und)
SBI
IT F
und
(Pre
viousl
y kn
ow
n a
s SB
IM
SFU
- IT F
und)
SBI
Gold
Fund
SBI
Arb
itra
ge
Op
port
unit
ies
Fund
SBI
Nif
ty I
nd
ex F
und
(Pre
viousl
y kn
ow
n a
s SB
I M
agnum
Index
Fund)
Idea
l In
ves
tmen
t H
ori
zon
Tac
tica
lT
acti
cal
Tac
tica
lT
acti
cal
3m
onth
s3
year
s+
Ince
pti
on D
ate
06/0
7/2
007
05/0
7/1
999
05/0
7/1
999
12/0
9/2
011
03/1
1/2
006
17/0
1/2
002
Fund
Manager
Mr.
Ric
har
d D
'souza
Mr.
Sau
rabh P
ant
Mr.
Anup U
pad
hya
yM
r. R
avip
raka
sh S
har
ma
Mr.
Nee
raj K
um
arM
r. R
avip
raka
shSh
arm
a
Managin
g S
ince
Aug-2
014
Jun-2
011
Jun-2
011
Sep-2
011
Oct
-2012
Feb-2
011
Ben
chm
ark
Nif
ty Infr
astr
uct
ure
Index
S&P
BSE
Fast
Movi
ng
Consu
mer
Goods
Index
S&P
BSE
- In
form
atio
nTec
hnolo
gy
Index
Pric
e of
Phys
ical
Gold
CRIS
IL L
iquid
Fund
Index
Nif
ty 5
0 Index
Po
rtfo
lio
Cla
ssif
icati
on
By
Asset
Allo
cati
on
(%
) as o
n 3
1 J
an
uary
2018
Larg
e C
ap
(In
%)
Mid
Cap
(In
%)
Small C
ap
(In
%)
Oth
er A
sset
s (I
n %
)
36.7
2
34.5
0
24.6
8
4.1
0
34.4
6
37.2
1
26.0
8
2.2
5
50.4
4
32.1
4
6.0
8
11.3
4
- -
99.7
6
0.2
4
-0.0
5
-0.1
2
-0.0
1
100.1
8
94.1
8
- -
5.8
2
Oth
er
Deta
ils
Exit
Load
Wit
hin
1 Y
ear
- 1
%W
ithin
15 D
ays
- 0.5
0%
Wit
hin
15 D
ays
- 0.5
0%
Wit
hin
1 Y
ear
- 1%
Wit
hin
1 M
onth
- 0
.50%
For
exit
wit
hin
15 d
ays
from
the
dat
e of
allo
tmen
t -
0.2
0%
For
exit
on o
r af
ter
15 d
ays
from
the
da t
e of
allo
tmen
t -
Nil
(w.e
.f. N
ove
mber
30, 2017)
Snap
shot
of
Eq
uit
y Fu
nd
s
Ple
ase
consu
lt y
our
financia
l advis
or
befo
re invest
ing. For
deta
ils,
ple
ase
refe
r to
resp
ecti
ve p
age o
f th
e s
chem
e.
#Ris
k F
ree r
ate
: FBIL
Overn
ight
Mib
or
rate
(6.0
0%
as
on 3
1st
January
2018)
Basi
s fo
r Rati
o C
alc
ula
tion: 3 Y
ears
Month
ly D
ata
Poin
ts07
08
EQUITY-LARGE CAP
Option NAV ( )`
Reg-Plan-Dividend 22.3265
Reg-Plan-Growth 39.2322
Dir-Plan-Dividend 26.6450
Dir-Plan-Growth 41.0463
NET ASSET VALUE
Record Date Dividend NAV ( )`(in /Unit)`
23-Sep-16 (Reg Plan) 1.00 18.596423-Sep-16 (Dir Plan) 1.20 21.856917-Jul-15 (Reg Plan) 2.50 17.688017-Jul-15 (Dir Plan) 2.90 20.539521- Mar-14 (Reg Plan) 1.80 12.7618
LAST DIVIDENDS
Investors understand that their principal
will be at Moderately High risk
�
�
Long term capital appreciation.Investment in equity shares of companies whose market capitalization is at least equal to or morethan the least market capitalized stock of S&P BSE 100 index to provide long term capital growthopportunities.
SBI Blue Chip FundThis product is suitable for investors who are seeking^:
Face value: 10`
Investment Objective
Quantitative Data
To provide investors with opportunitiesfor long-term growth in capital throughan active management of investments in adiversified basket of equity stocks ofcompanies whose market capitalizationis at least equal to or more than the leastmarket capitalized stock of S&P BSE 100Index.
Fund Details
Standard Deviation :
Beta :
Sharpe Ratio :
Portfolio Turnover* :
#
#
#
11.99%
0.84
0.50
1.14#Source : CR IS IL Fund Analyser
*Portfolio Turnover = lower of total sale ortotal purchase for the last 12 monthsupon Avg. AUM of trailing twelve months.
Risk Free rate: FBIL Overnight Mibor rate(6.00% as on 31st January 2018) Basis forRatio Calculation: 3 Years Monthly DataPoints
PORTFOLIO CLASSIFICATION BY(%)ASSET ALLOCATION
Financial Services 32.29Automobile 10.71Consumer Goods 9.18Construction 7.28Energy 6.53Pharma 5.63Cement & Cement Products 4.24Industrial Manufacturing 3.80Futures 3.73Fertilisers & Pesticides 3.47IT 3.20Metals 2.21Reverse Repo 2.20Services 1.68Healthcare Services 1.41Telecom 1.34Chemicals 0.54Others 0.55
•
•
•
•
•
•
•
•
•
•
•
•
•
•
Type of Scheme
Date of Allotment:
Report As On:
AAUM for the Month of January 2018
AUM as on January 31, 2018
Fund Manager: Ms. Sohini AndaniManaging Since:Total Experience:
Benchmark:
Exit Load:
Entry Load:
Plans Available:
Options:
SIP
Minimum Investment
Additional Investment
An Open - Ended Growth Scheme
14/02/2006
31/01/2018
18,219.35 Crores
18,085.41 Crores
Sep-2010Over 22 years
S&P BSE 100 Index
For exit within 1 year from the date ofallotment - 1 %; For exit after 1 year fromthe date of allotment - Nil
N.A.
Regular, Direct
Growth, Dividend
Weekly - Minimum 1000 & in multiplesof 1 thereafter for a minimum of 6instalments.Monthly - Minimum 1000 & in multiplesof 1 thereafter for minimum six months(or) minimum 500 & in multiples of 1thereafter for minimum one year.Quarterly - Minimum 1500 & inmultiples of 1 thereafter for minimumone year.
5000 & in multiples of 1
1000 & in multiples of 1
`
`
`
`
`
`
` `
`
`
` `
` `
PORTFOLIO CLASSIFICATION BYINDUSTRY ALLOCATION (%)
PORTFOLIO
HDFC Bank Ltd. 8.68Larsen & Toubro Ltd. 5.12ITC Ltd. 3.28Mahindra & Mahindra Ltd. 3.23Nestle India Ltd. 2.82State Bank Of India 2.54Hero Motocorp Ltd. 2.51Indusind Bank Ltd. 2.50Hindustan Petroleum Corporation Ltd. 2.47Kotak Mahindra Bank Ltd. 2.47Bharat Electronics Ltd. 2.35UPL Ltd. 2.30Hindalco Industries Ltd. 2.21ICICI Bank Ltd. 2.19Cholamandalam Investment AndFinance Company Ltd. 2.12Titan Company Ltd. 1.99Maruti Suzuki India Ltd. 1.96HDFC Ltd. 1.79HCL Technologies Ltd. 1.70InterGlobe Aviation Ltd. 1.68Divi's Laboratories Ltd. 1.66Motherson Sumi Systems Ltd. 1.59Reliance Industries Ltd. 1.56Voltas Ltd. 1.53Sun Pharmaceutical Industries Ltd. 1.52Infosys Ltd. 1.51Mahindra & Mahindra Financial Services Ltd. 1.50Indian Oil Corporation Ltd. 1.48Bharti Airtel Ltd. 1.34Ultratech Cement Ltd. 1.32Grasim Industries Ltd. 1.24The Ramco Cements Ltd. 1.21Shriram Transport Finance Company Ltd. 1.20PI Industries Ltd. 1.17NTPC Ltd. 1.03
Stock Name (%) Of Total AUM Stock Name (%) Of Total AUM
Aurobindo Pharma Ltd. 1.01ICICI Prudential Life Insurance Company Ltd. 0.98Strides Shasun Ltd. 0.95The Federal Bank Ltd. 0.91Bajaj Finserv Ltd. 0.86SBI Life Insurance Company Ltd. 0.83ICICI Lombard General Insurance Company Ltd. 0.79Tata Motors Ltd. 0.76Britannia Industries Ltd. 0.75HDFC Standard Life Insurance Company Ltd. 0.68Apollo Hospitals Enterprise Ltd. 0.68Eicher Motors Ltd. 0.66Sadbhav Engineering Ltd. 0.62Schaeffler India Ltd. 0.60Housing And Urban Development Corporation Ltd. 0.56Pidilite Industries Ltd. 0.54Thermax Ltd. 0.54Shriram City Union Finance Ltd. 0.53Torrent Pharmaceuticals Ltd. 0.49Shree Cement Ltd. 0.47Dr. Lal Path Labs Ltd. 0.44Procter & Gamble Hygiene And Health Care Ltd. 0.34SKF India Ltd. 0.31Narayana Hrudayalaya Ltd. 0.29
HDFC Ltd.(Warrants) 0.89
Clix Capital Services Pvt. Ltd. 0.01
HDFC Bank Ltd. 0.27
Equity Shares Total 92.34
Warrants Total 0.89
Commercial Papers Total 0.01
Certificate Of Deposits Total 0.27CBLO 3.37Reverse Repo 2.20Index Futures 3.73Cash & Other Receivables -2.82Grand Total 100.00
Pursuant to payment of dividend, the NAV of Dividend Option ofscheme/plans would fall to the extent of payout and statutory levy, ifapplicable.
^Investors should consult their financial advisers if in doubt about whether the product is suitable for them.
Large Cap MidcapCash & Other Current Assets
76.77
16.46
6.77
09
EQUITY-LARGE CAP
Option NAV ( )`
Reg-Plan-Dividend 34.6800
Reg-Plan-Growth 99.2876
Dir-Plan-Dividend 41.1981
Dir-Plan-Growth 102.8854
NET ASSET VALUE
Record Date Dividend NAV ( )`(in /Unit)`
30-May-17 (Reg Plan) 2.00 30.8936(Dir Plan) 2.50 36.502730-May-17
29-Apr-16 (Reg Plan) 4.50 27.489329-Apr-16 (Dir Plan) 5.00 32.324024-Apr-15 (Reg Plan) 6.00 31.747924-Apr-15 (Dir Plan) 7.00 36.7592
LAST DIVIDENDS
Investors understand that their principal
will be at Moderately High risk
�
�
Long term capital appreciation.Investments in high growth companies along with the liquidity of an open-ended scheme throughinvestments primarily in equities.
SBI Magnum Equity FundThis product is suitable for investors who are seeking^:
Face value: 10`
Investment Objective
Quantitative Data
To provide the investor long-term capitalappreciation by investing in high growthcompanies along with the liquidity of anopen-ended scheme through investmentsprimarily in equities and the balance indebt and money market instruments.
Fund Details
Standard Deviation :
Beta :
Sharpe Ratio :
Portfolio Turnover* :
#
#
#
12.94%
0.91
0.26
0.69#Source : CR IS IL Fund Analyser
*Portfolio Turnover = lower of total sale ortotal purchase for the last 12 monthsupon Avg. AUM of trailing twelve months.
Risk Free rate: FBIL Overnight Mibor rate(6.00% as on 31st January 2018) Basis forRatio Calculation: 3 Years Monthly DataPoints
PORTFOLIO CLASSIFICATION BY(%)ASSET ALLOCATION
Financial Services 38.71
IT 15.04
Energy 11.15
Telecom 7.19
Consumer Goods 6.61
Automobile 6.29
Construction 3.65
Metals 3.22
Services 3.02
Pharma 1.99
Mutual Fund 0.09
Others 3.04
Pursuant to payment of dividend, the NAV of Dividend Option ofscheme/plans would fall to the extent of payout and statutory levy, ifapplicable.
•
•
•
•
•
•
•
•
•
•
•
•
•
•
Type of Scheme
Date of Allotment:
Report As On:
AAUM for the Month of January 2018
AUM as on January 31, 2018
Fund Manager: Mr. R. SrinivasanManaging Since:Total Experience:
Benchmark:
Exit Load:
Entry Load:
Plans Available:
Options:
SIP
Minimum Investment
Additional Investment
An Open - Ended Equity Scheme
01/01/1991
31/01/2018
2,186.91 Crores
2,213.12 Crores
May-2009Over 24 years
Nifty 50 Index
For exit within 1 year from the date ofallotment - 1 %;For exit after 1 year from the date ofallotment - Nil
N.A.
Regular, Direct
Growth, Dividend
Weekly - Minimum 1000 & in multiplesof 1 thereafter for a minimum of 6instalments.Monthly - Minimum 1000 & in multiplesof 1 thereafter for minimum six months(or) minimum 500 & in multiples of 1thereafter for minimum one yearQuarterly - Minimum 1500 & inmultiples of 1 thereafter for minimumone year.
1000 & in multiples of 1
1000 & in multiples of 1
`
`
`
`
`
`
` `
`
`
` `
` `
PORTFOLIO CLASSIFICATION BYINDUSTRY ALLOCATION (%)
PORTFOLIO
HDFC Bank Ltd. 9.96
Reliance Industries Ltd. 7.38
ICICI Bank Ltd. 6.85
Infosys Ltd. 5.71
Kotak Mahindra Bank Ltd. 5.51
State Bank Of India 5.23
Bharti Airtel Ltd. 4.17
HCL Technologies Ltd. 4.01
Indian Oil Corporation Ltd. 3.77
Larsen & Toubro Ltd. 3.65
Colgate Palmolive (India) Ltd. 3.54
HDFC Ltd. 3.53
Hindustan Zinc Ltd. 3.22
ITC Ltd. 3.06
InterGlobe Aviation Ltd. 3.02
Bharti Infratel Ltd. 3.02
Bajaj Finance Ltd. 2.80
Tata Consultancy Services Ltd. 2.67
Stock Name (%) Of Total AUM Stock Name (%) Of Total AUM
Oracle Financial Services Software Ltd. 2.64
ICICI Lombard GeneralInsurance Company Ltd. 2.49
Indiabulls Housing Finance Ltd. 2.32
Hero Motocorp Ltd. 2.17
Bajaj Auto Ltd. 2.11
Bosch Ltd. 2.02
Aurobindo Pharma Ltd. 1.99
SBI Magnum Instacash Fund - Direct Plan 0.09
Equity Shares Total Total 96.87
Mutual Fund Units Total 0.09
CBLO 3.32
Cash & Other Receivables -0.28
Grand Total 100.00
^Investors should consult their financial advisers if in doubt about whether the product is suitable for them.
Large Cap Midcap
Cash & Other Current Assets Smallcap
93.32
3.540.09 3.05
10
EQUITY-DIVERSIFIED CAP
Option NAV ( )`
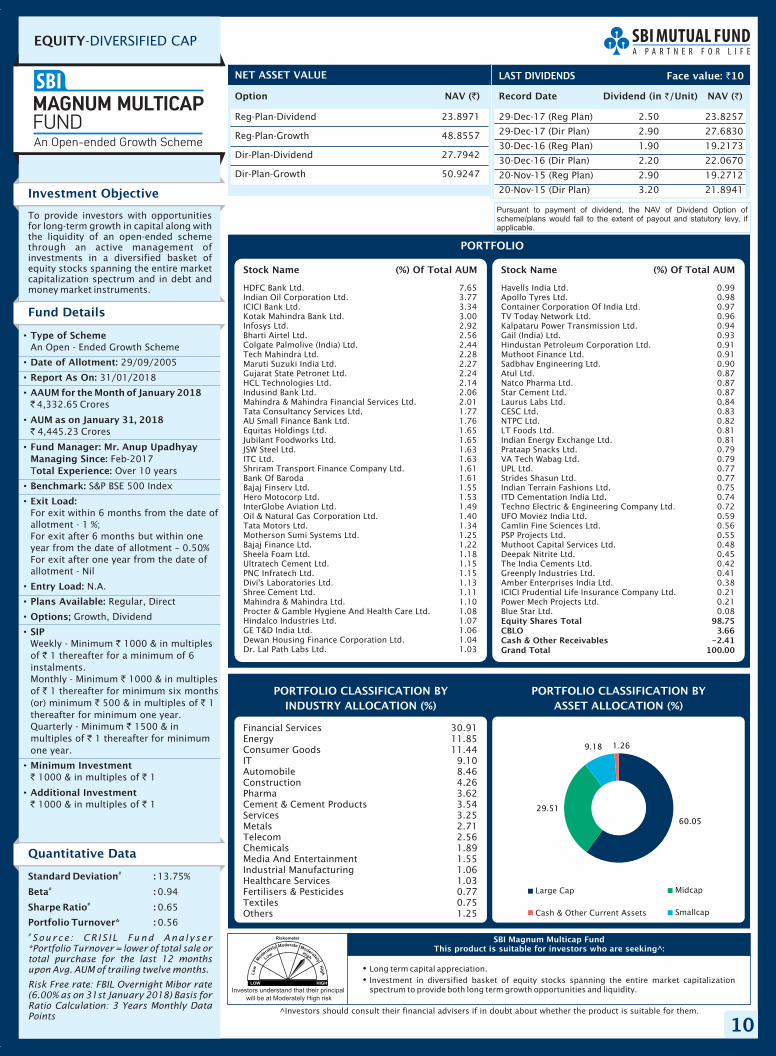
Reg-Plan-Dividend 23.8971
Reg-Plan-Growth 48.8557
Dir-Plan-Dividend 27.7942
Dir-Plan-Growth 50.9247
NET ASSET VALUE
Record Date Dividend NAV ( )`(in /Unit)`
29-Dec-17 (Reg Plan) 2.50 23.8257
Dir
30-Dec-16 (Reg Plan) 1.90 19.2173
30-Dec-16 (Dir Plan) 2.20 22.0670
20-Nov-15 (Reg Plan) 2.90 19.2712
20-Nov-15 (Dir Plan) 3.20 21.8941
29-Dec-17 ( Plan) 2.90 27.6830
LAST DIVIDENDS
Investors understand that their principal
will be at Moderately High risk
�
�
Long term capital appreciation.Investment in diversified basket of equity stocks spanning the entire market capitalizationspectrum to provide both long term growth opportunities and liquidity.
SBI Magnum Multicap FundThis product is suitable for investors who are seeking^:
Face value: 10`
Investment Objective
Quantitative Data
To provide investors with opportunitiesfor long-term growth in capital along withthe liquidity of an open-ended schemethrough an active management ofinvestments in a diversified basket ofequity stocks spanning the entire marketcapitalization spectrum and in debt andmoney market instruments.
Fund Details
Standard Deviation :
Beta :
Sharpe Ratio :
Portfolio Turnover* :
#
#
#
13.75%
0.94
0.65
0.56#Source : CR IS IL Fund Analyser
*Portfolio Turnover = lower of total sale ortotal purchase for the last 12 monthsupon Avg. AUM of trailing twelve months.
Risk Free rate: FBIL Overnight Mibor rate(6.00% as on 31st January 2018) Basis forRatio Calculation: 3 Years Monthly DataPoints
PORTFOLIO CLASSIFICATION BY(%)ASSET ALLOCATION
Financial Services 30.91Energy 11.85Consumer Goods 11.44IT 9.10Automobile 8.46Construction 4.26Pharma 3.62Cement & Cement Products 3.54Services 3.25Metals 2.71Telecom 2.56Chemicals 1.89Media And Entertainment 1.55Industrial Manufacturing 1.06Healthcare Services 1.03Fertilisers & Pesticides 0.77Textiles 0.75Others 1.25
Pursuant to payment of dividend, the NAV of Dividend Option ofscheme/plans would fall to the extent of payout and statutory levy, ifapplicable.
•
•
•
•
•
•
•
•
•
•
•
•
•
•
Type of Scheme
Date of Allotment:
Report As On:
AAUM for the Month of January 2018
AUM as on January 31, 2018
Fund Manager: Mr. Anup UpadhyayManaging Since:otal Experience:
Benchmark:
Exit Load:
Entry Load:
Plans Available:
Options;
SIP
Minimum Investment
Additional Investment
An Open - Ended Growth Scheme
29/09/2005
31/01/2018
4,332.65 Crores
4,445.23 Crores
Feb-2017T Over 10 years
S&P BSE 500 Index
For exit within 6 months from the date ofallotment - 1 %;For exit after 6 months but within oneyear from the date of allotment – 0.50%For exit after one year from the date ofallotment - Nil
N.A.
Regular, Direct
Growth, Dividend
Weekly - Minimum 1000 & in multiplesof 1 thereafter for a minimum of 6instalments.Monthly - Minimum 1000 & in multiplesof 1 thereafter for minimum six months(or) minimum 500 & in multiples of 1thereafter for minimum one year.Quarterly - Minimum 1500 & inmultiples of 1 thereafter for minimumone year.
1000 & in multiples of 1
1000 & in multiples of 1
`
`
`
`
`
`
` `
`
`
` `
` `
Large Cap Midcap
Cash & Other Current Assets Smallcap
PORTFOLIO CLASSIFICATION BYINDUSTRY ALLOCATION (%)
PORTFOLIO
HDFC Bank Ltd. 7.65Indian Oil Corporation Ltd. 3.77ICICI Bank Ltd. 3.34Kotak Mahindra Bank Ltd. 3.00Infosys Ltd. 2.92Bharti Airtel Ltd. 2.56Colgate Palmolive (India) Ltd. 2.44Tech Mahindra Ltd. 2.28Maruti Suzuki India Ltd. 2.27Gujarat State Petronet Ltd. 2.24HCL Technologies Ltd. 2.14Indusind Bank Ltd. 2.06Mahindra & Mahindra Financial Services Ltd. 2.01Tata Consultancy Services Ltd. 1.77AU Small Finance Bank Ltd. 1.76Equitas Holdings Ltd. 1.65Jubilant Foodworks Ltd. 1.65JSW Steel Ltd. 1.63ITC Ltd. 1.63Shriram Transport Finance Company Ltd. 1.61Bank Of Baroda 1.61Bajaj Finserv Ltd. 1.55Hero Motocorp Ltd. 1.53InterGlobe Aviation Ltd. 1.49Oil & Natural Gas Corporation Ltd. 1.40Tata Motors Ltd. 1.34Motherson Sumi Systems Ltd. 1.25Bajaj Finance Ltd. 1.22Sheela Foam Ltd. 1.18Ultratech Cement Ltd. 1.15PNC Infratech Ltd. 1.15Divi's Laboratories Ltd. 1.13Shree Cement Ltd. 1.11Mahindra & Mahindra Ltd. 1.10Procter & Gamble Hygiene And Health Care Ltd. 1.08Hindalco Industries Ltd. 1.07GE T&D India Ltd. 1.06Dewan Housing Finance Corporation Ltd. 1.04Dr. Lal Path Labs Ltd. 1.03
Stock Name (%) Of Total AUM Stock Name (%) Of Total AUM
Havells India Ltd. 0.99Apollo Tyres Ltd. 0.98Container Corporation Of India Ltd. 0.97TV Today Network Ltd. 0.96Kalpataru Power Transmission Ltd. 0.94Gail (India) Ltd. 0.93Hindustan Petroleum Corporation Ltd. 0.91Muthoot Finance Ltd. 0.91Sadbhav Engineering Ltd. 0.90Atul Ltd. 0.87Natco Pharma Ltd. 0.87Star Cement Ltd. 0.87Laurus Labs Ltd. 0.84CESC Ltd. 0.83NTPC Ltd. 0.82LT Foods Ltd. 0.81Indian Energy Exchange Ltd. 0.81Prataap Snacks Ltd. 0.79VA Tech Wabag Ltd. 0.79UPL Ltd. 0.77Strides Shasun Ltd. 0.77Indian Terrain Fashions Ltd. 0.75ITD Cementation India Ltd. 0.74Techno Electric & Engineering Company Ltd. 0.72UFO Moviez India Ltd. 0.59Camlin Fine Sciences Ltd. 0.56PSP Projects Ltd. 0.55Muthoot Capital Services Ltd. 0.48Deepak Nitrite Ltd. 0.45The India Cements Ltd. 0.42Greenply Industries Ltd. 0.41Amber Enterprises India Ltd. 0.38ICICI Prudential Life Insurance Company Ltd. 0.21Power Mech Projects Ltd. 0.21Blue Star Ltd. 0.08Equity Shares Total 98.75CBLO 3.66Cash & Other Receivables -2.41Grand Total 100.00
^Investors should consult their financial advisers if in doubt about whether the product is suitable for them.
60.05
29.51
9.18 1.26
11
EQUITY-DIVERSIFIED CAP
Option NAV ( )`
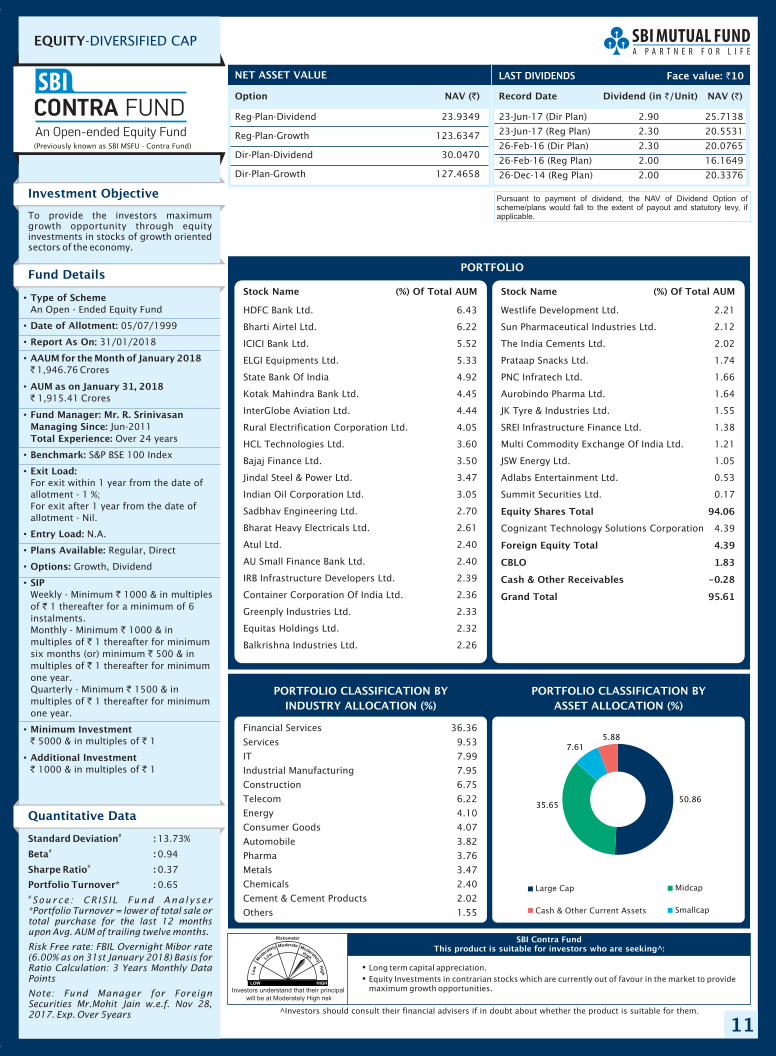
Reg-Plan-Dividend 23.9349
Reg-Plan-Growth 123.6347
Dir-Plan-Dividend 30.0470
Dir-Plan-Growth 127.4658
NET ASSET VALUE
Investors understand that their principal
will be at Moderately High risk
�
�
Long term capital appreciation.Equity Investments in contrarian stocks which are currently out of favour in the market to providemaximum growth opportunities.
SBI Contra FundThis product is suitable for investors who are seeking^:
Investment Objective
Quantitative Data
To provide the investors maximumgrowth opportunity through equityinvestments in stocks of growth orientedsectors of the economy.
Fund Details
Standard Deviation :
Beta :
Sharpe Ratio :
Portfolio Turnover* :
#
#
#
13.73%
0.94
0.37
0.65#Source : CR IS IL Fund Analyser
*Portfolio Turnover = lower of total sale ortotal purchase for the last 12 monthsupon Avg. AUM of trailing twelve months.
Risk Free rate: FBIL Overnight Mibor rate(6.00% as on 31st January 2018) Basis forRatio Calculation: 3 Years Monthly DataPoints
Note: Fund Manager for ForeignSecurities Mr.Mohit Jain w.e.f. Nov 28,2017. Exp. Over 5years
PORTFOLIO CLASSIFICATION BY(%)ASSET ALLOCATION
Financial Services 36.36
Services 9.53
IT 7.99
Industrial Manufacturing 7.95
Construction 6.75
Telecom 6.22
Energy 4.10
Consumer Goods 4.07
Automobile 3.82
Pharma 3.76
Metals 3.47
Chemicals 2.40
Cement & Cement Products 2.02
Others 1.55
•
•
•
•
•
•
•
•
•
•
•
•
•
•
Type of Scheme
Date of Allotment:
Report As On:
AAUM for the Month of January 2018
AUM as on January 31, 2018
Fund Manager: Mr. R. SrinivasanManaging Since:Total Experience:
Benchmark:
Exit Load:
Entry Load:
Plans Available:
Options:
SIP
Minimum Investment
Additional Investment
An Open - Ended Equity Fund
05/07/1999
31/01/2018
1,946.76 Crores
1,915.41 Crores
Jun-2011Over 24 years
S&P BSE 100 Index
For exit within 1 year from the date ofallotment - 1 %;For exit after 1 year from the date ofallotment - Nil.
N.A.
Regular, Direct
Growth, Dividend
Weekly - Minimum 1000 & in multiplesof 1 thereafter for a minimum of 6instalments.Monthly - Minimum 1000 & inmultiples of 1 thereafter for minimumsix months (or) minimum 500 & inmultiples of 1 thereafter for minimumone year.Quarterly - Minimum 1500 & inmultiples of 1 thereafter for minimumone year.
5000 & in multiples of 1
1000 & in multiples of 1
`
`
`
`
`
`
`
`
`
`
` `
` `
Large Cap Midcap
Cash & Other Current Assets Smallcap
PORTFOLIO CLASSIFICATION BYINDUSTRY ALLOCATION (%)
PORTFOLIO
HDFC Bank Ltd. 6.43
Bharti Airtel Ltd. 6.22
ICICI Bank Ltd. 5.52
ELGI Equipments Ltd. 5.33
State Bank Of India 4.92
Kotak Mahindra Bank Ltd. 4.45
InterGlobe Aviation Ltd. 4.44
Rural Electrification Corporation Ltd. 4.05
HCL Technologies Ltd. 3.60
Bajaj Finance Ltd. 3.50
Jindal Steel & Power Ltd. 3.47
Indian Oil Corporation Ltd. 3.05
Sadbhav Engineering Ltd. 2.70
Bharat Heavy Electricals Ltd. 2.61
Atul Ltd. 2.40
AU Small Finance Bank Ltd. 2.40
IRB Infrastructure Developers Ltd. 2.39
Container Corporation Of India Ltd. 2.36
Greenply Industries Ltd. 2.33
Equitas Holdings Ltd. 2.32
Balkrishna Industries Ltd. 2.26
Stock Name (%) Of Total AUM Stock Name (%) Of Total AUM
Westlife Development Ltd. 2.21
Sun Pharmaceutical Industries Ltd. 2.12
The India Cements Ltd. 2.02
Prataap Snacks Ltd. 1.74
PNC Infratech Ltd. 1.66
Aurobindo Pharma Ltd. 1.64
JK Tyre & Industries Ltd. 1.55
SREI Infrastructure Finance Ltd. 1.38
Multi Commodity Exchange Of India Ltd. 1.21
JSW Energy Ltd. 1.05
Adlabs Entertainment Ltd. 0.53
Summit Securities Ltd. 0.17
Cognizant Technology Solutions Corporation 4.39
Equity Shares Total 94.06
Foreign Equity Total 4.39
CBLO 1.83
Cash & Other Receivables -0.28
Grand Total 95.61
(Previously known as SBI MSFU - Contra Fund)
^Investors should consult their financial advisers if in doubt about whether the product is suitable for them.
Record Date Dividend NAV ( )`(in /Unit)`
23-Jun-17 (Dir Plan) 2.90 25.7138
23-Jun-17 (Reg Plan) 2.30 20.5531
26-Feb-16 (Dir Plan) 2.30 20.0765
26-Feb-16 (Reg Plan) 2.00 16.1649
26-Dec-14 (Reg Plan) 2.00 20.3376
LAST DIVIDENDS Face value: 10`
Pursuant to payment of dividend, the NAV of Dividend Option ofscheme/plans would fall to the extent of payout and statutory levy, ifapplicable.
50.8635.65
7.615.88
12
EQUITY-DIVERSIFIED CAP
Option NAV ( )`
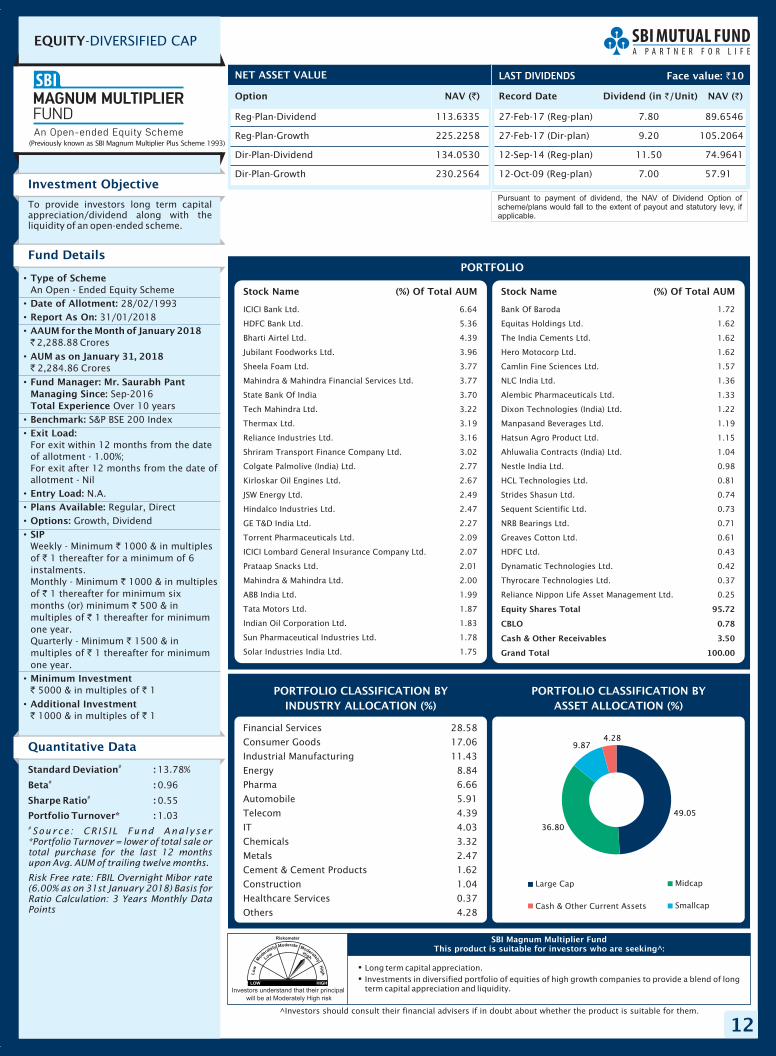
Reg-Plan-Dividend 113.6335
Reg-Plan-Growth 225.2258
Dir-Plan-Dividend 134.0530
Dir-Plan-Growth 230.2564
NET ASSET VALUE
Record Date Dividend NAV ( )`(in /Unit)`
27-Feb-17 (Reg-plan) 7.80 89.6546
27-Feb-17 (Dir-plan) 9.20 105.2064
12-Sep-14 (Reg-plan) 11.50 74.9641
12-Oct-09 (Reg-plan) 7.00 57.91
LAST DIVIDENDS
Investors understand that their principal
will be at Moderately High risk
�
�
Long term capital appreciation.Investments in diversified portfolio of equities of high growth companies to provide a blend of longterm capital appreciation and liquidity.
SBI Magnum Multiplier FundThis product is suitable for investors who are seeking^:
Face value: 10`
Investment Objective
Quantitative Data
To provide investors long term capitalappreciation/dividend along with theliquidity of an open-ended scheme.
Fund Details
Standard Deviation :
Beta :
Sharpe Ratio :
Portfolio Turnover* :
#
#
#
13.78%
0.96
0.55
1.03#Source : CR IS IL Fund Analyser
*Portfolio Turnover = lower of total sale ortotal purchase for the last 12 monthsupon Avg. AUM of trailing twelve months.
Risk Free rate: FBIL Overnight Mibor rate(6.00% as on 31st January 2018) Basis forRatio Calculation: 3 Years Monthly DataPoints
PORTFOLIO CLASSIFICATION BY(%)ASSET ALLOCATION
Financial Services 28.58
Consumer Goods 17.06
Industrial Manufacturing 11.43
Energy 8.84
Pharma 6.66
Automobile 5.91
Telecom 4.39
IT 4.03
Chemicals 3.32
Metals 2.47
Cement & Cement Products 1.62
Construction 1.04
Healthcare Services 0.37
Others 4.28
Pursuant to payment of dividend, the NAV of Dividend Option ofscheme/plans would fall to the extent of payout and statutory levy, ifapplicable.
•
•
•
•
•
•
•
•
•
•
•
•
•
•
Type of Scheme
Date of Allotment:Report As On:AAUM for the Month of January 2018
AUM as on January 31, 2018
Fund Manager: Mr. Saurabh PantManaging Since:Total ExperienceBenchmark:Exit Load:
Entry Load:Plans Available:Options:SIP
Minimum Investment
Additional Investment
An Open - Ended Equity Scheme28/02/1993
31/01/2018
2,288.88 Crores
2,284.86 Crores
Sep-2016Over 10 years
S&P BSE 200 Index
For exit within 12 months from the dateof allotment - 1.00%;For exit after 12 months from the date ofallotment - Nil
N.A.Regular, Direct
Growth, Dividend
Weekly - Minimum 1000 & in multiplesof 1 thereafter for a minimum of 6instalments.Monthly - Minimum 1000 & in multiplesof 1 thereafter for minimum sixmonths (or) minimum 500 & inmultiples of 1 thereafter for minimumone year.Quarterly - Minimum 1500 & inmultiples of 1 thereafter for minimumone year.
5000 & in multiples of 1
1000 & in multiples of 1
`
`
`
`
`
`
`
`
`
`
` `
` `
Large Cap Midcap
Cash & Other Current Assets Smallcap
PORTFOLIO CLASSIFICATION BYINDUSTRY ALLOCATION (%)
PORTFOLIO
ICICI Bank Ltd. 6.64
HDFC Bank Ltd. 5.36
Bharti Airtel Ltd. 4.39
Jubilant Foodworks Ltd. 3.96
Sheela Foam Ltd. 3.77
Mahindra & Mahindra Financial Services Ltd. 3.77
State Bank Of India 3.70
Tech Mahindra Ltd. 3.22
Thermax Ltd. 3.19
Reliance Industries Ltd. 3.16
Shriram Transport Finance Company Ltd. 3.02
Colgate Palmolive (India) Ltd. 2.77
Kirloskar Oil Engines Ltd. 2.67
JSW Energy Ltd. 2.49
Hindalco Industries Ltd. 2.47
GE T&D India Ltd. 2.27
Torrent Pharmaceuticals Ltd. 2.09
ICICI Lombard General Insurance Company Ltd. 2.07
Prataap Snacks Ltd. 2.01
Mahindra & Mahindra Ltd. 2.00
ABB India Ltd. 1.99
Tata Motors Ltd. 1.87
Indian Oil Corporation Ltd. 1.83
Sun Pharmaceutical Industries Ltd. 1.78
Solar Industries India Ltd. 1.75
Stock Name (%) Of Total AUM Stock Name (%) Of Total AUM
Bank Of Baroda 1.72
Equitas Holdings Ltd. 1.62
The India Cements Ltd. 1.62
Hero Motocorp Ltd. 1.62
Camlin Fine Sciences Ltd. 1.57
NLC India Ltd. 1.36
Alembic Pharmaceuticals Ltd. 1.33
Dixon Technologies (India) Ltd. 1.22
Manpasand Beverages Ltd. 1.19
Hatsun Agro Product Ltd. 1.15
Ahluwalia Contracts (India) Ltd. 1.04
Nestle India Ltd. 0.98
HCL Technologies Ltd. 0.81
Strides Shasun Ltd. 0.74
Sequent Scientific Ltd. 0.73
NRB Bearings Ltd. 0.71
Greaves Cotton Ltd. 0.61
HDFC Ltd. 0.43
Dynamatic Technologies Ltd. 0.42
Thyrocare Technologies Ltd. 0.37
Reliance Nippon Life Asset Management Ltd. 0.25
Equity Shares Total 95.72
CBLO 0.78
Cash & Other Receivables 3.50
Grand Total 100.00
(Previously known as SBI Magnum Multiplier Plus Scheme 1993)
^Investors should consult their financial advisers if in doubt about whether the product is suitable for them.
49.05
36.80
9.874.28
13
EQUITY-DIVERSIFIED CAP
Option NAV ( )`
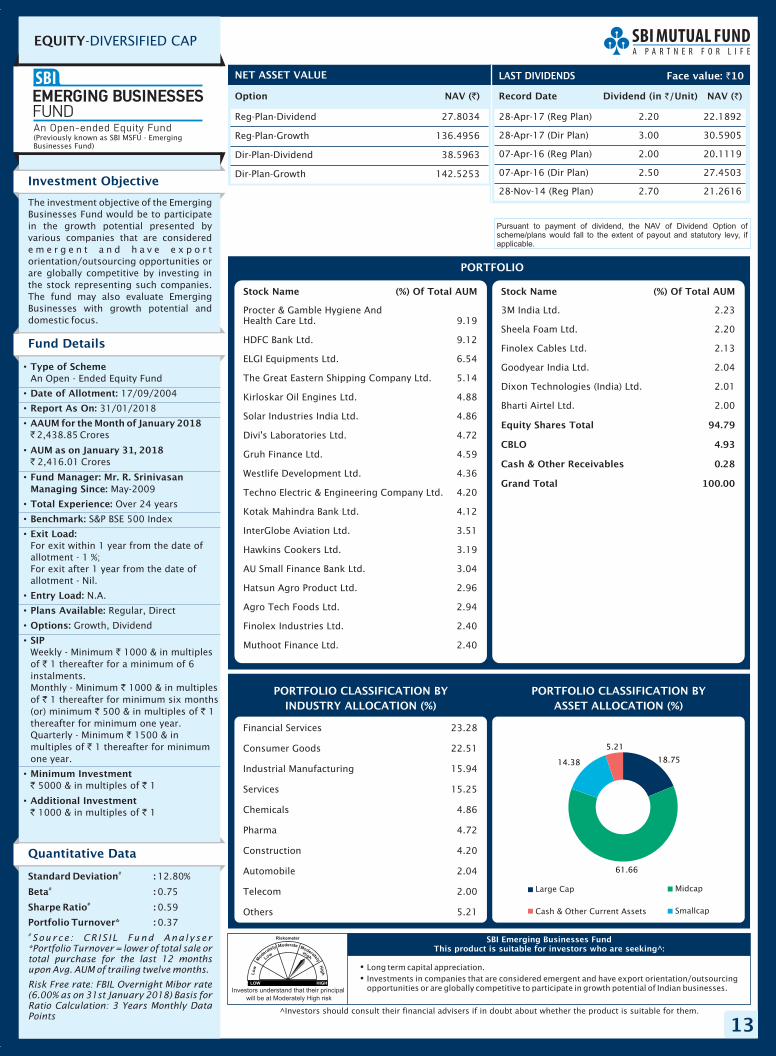
Reg-Plan-Dividend 27.8034
Reg-Plan-Growth 136.4956
Dir-Plan-Dividend 38.5963
Dir-Plan-Growth 142.5253
NET ASSET VALUE
Record Date Dividend NAV ( )`(in /Unit)`
28-Apr-17 (Reg Plan) 2.20 22.1892
(Dir Plan) 3.00 30.590528-Apr-17
07-Apr-16 (Reg Plan) 2.00 20.1119
07-Apr-16 (Dir Plan) 2.50 27.4503
28-Nov-14 (Reg Plan) 2.70 21.2616
LAST DIVIDENDS
Investors understand that their principal
will be at Moderately High risk
�
�
Long term capital appreciation.Investments in companies that are considered emergent and have export orientation/outsourcingopportunities or are globally competitive to participate in growth potential of Indian businesses.
SBI Emerging Businesses FundThis product is suitable for investors who are seeking^:
Face value: 10`
Investment Objective
Quantitative Data
The investment objective of the EmergingBusinesses Fund would be to participatein the growth potential presented byvarious companies that are considerede m e r g e n t a n d h a v e e x p o r torientation/outsourcing opportunities orare globally competitive by investing inthe stock representing such companies.The fund may also evaluate EmergingBusinesses with growth potential anddomestic focus.
Fund Details
Standard Deviation :
Beta :
Sharpe Ratio :
Portfolio Turnover* :
#
#
#
12.80%
0.75
0.59
0.37#Source : CR IS IL Fund Analyser
*Portfolio Turnover = lower of total sale ortotal purchase for the last 12 monthsupon Avg. AUM of trailing twelve months.
Risk Free rate: FBIL Overnight Mibor rate(6.00% as on 31st January 2018) Basis forRatio Calculation: 3 Years Monthly DataPoints
PORTFOLIO CLASSIFICATION BY(%)ASSET ALLOCATION
Financial Services 23.28
Consumer Goods 22.51
Industrial Manufacturing 15.94
Services 15.25
Chemicals 4.86
Pharma 4.72
Construction 4.20
Automobile 2.04
Telecom 2.00
Others 5.21
Pursuant to payment of dividend, the NAV of Dividend Option ofscheme/plans would fall to the extent of payout and statutory levy, ifapplicable.
•
•
•
•
•
•
•
•
•
•
•
•
•
•
•
Type of Scheme
Date of Allotment:
Report As On:
AAUM for the Month of January 2018
AUM as on January 31, 2018
Fund Manager: Mr. R. SrinivasanManaging Since:
Total Experience:
Benchmark:
Exit Load:
Entry Load:
Plans Available:
Options:
SIP
Minimum Investment
Additional Investment
An Open - Ended Equity Fund
17/09/2004
31/01/2018
2,438.85 Crores
2,416.01 Crores
May-2009
Over 24 years
S&P BSE 500 Index
For exit within 1 year from the date ofallotment - 1 %;For exit after 1 year from the date ofallotment - Nil.
N.A.
Regular, Direct
Growth, Dividend
Weekly - Minimum 1000 & in multiplesof 1 thereafter for a minimum of 6instalments.Monthly - Minimum 1000 & in multiplesof 1 thereafter for minimum six months(or) minimum 500 & in multiples of 1thereafter for minimum one year.Quarterly - Minimum 1500 & inmultiples of 1 thereafter for minimumone year.
5000 & in multiples of 1
1000 & in multiples of 1
`
`
`
`
`
`
` `
`
`
` `
` `
PORTFOLIO CLASSIFICATION BYINDUSTRY ALLOCATION (%)
PORTFOLIO
Procter & Gamble Hygiene AndHealth Care Ltd. 9.19
HDFC Bank Ltd. 9.12
ELGI Equipments Ltd. 6.54
The Great Eastern Shipping Company Ltd. 5.14
Kirloskar Oil Engines Ltd. 4.88
Solar Industries India Ltd. 4.86
Divi's Laboratories Ltd. 4.72
Gruh Finance Ltd. 4.59
Westlife Development Ltd. 4.36
Techno Electric & Engineering Company Ltd. 4.20
Kotak Mahindra Bank Ltd. 4.12
InterGlobe Aviation Ltd. 3.51
Hawkins Cookers Ltd. 3.19
AU Small Finance Bank Ltd. 3.04
Hatsun Agro Product Ltd. 2.96
Agro Tech Foods Ltd. 2.94
Finolex Industries Ltd. 2.40
Muthoot Finance Ltd. 2.40
Stock Name (%) Of Total AUM Stock Name (%) Of Total AUM
3M India Ltd. 2.23
Sheela Foam Ltd. 2.20
Finolex Cables Ltd. 2.13
Goodyear India Ltd. 2.04
Dixon Technologies (India) Ltd. 2.01
Bharti Airtel Ltd. 2.00
Equity Shares Total 94.79
CBLO 4.93
Cash & Other Receivables 0.28
Grand Total 100.00
(Previously known as SBI MSFU - EmergingBusinesses Fund)
^Investors should consult their financial advisers if in doubt about whether the product is suitable for them.
Large Cap Midcap
Cash & Other Current Assets Smallcap
18.75
61.66
14.38
5.21
14
EQUITY-MIDCAP & SMALLCAP
Option NAV ( )`
Reg-Plan-Dividend 35.9814
Reg-Plan-Growth 83.4588
Dir-Plan-Dividend 52.2922
Dir-Plan-Growth 87.4487
NET ASSET VALUE
Record Date Dividend NAV ( )`(in /Unit)`
30-Jun-16 (Reg-Plan) 2.50 28.244530-Jun-16 (Dir-Plan) 3.50 40.305020-Mar-15 (Reg-Plan) 4.80 26.661920-Mar-15 (Dir-Plan) 6.80 37.404008-Aug-13 (Reg-Plan) 5.00 18.1066
LAST DIVIDENDS
Investors understand that their principal
will be at Moderately High risk
�
�
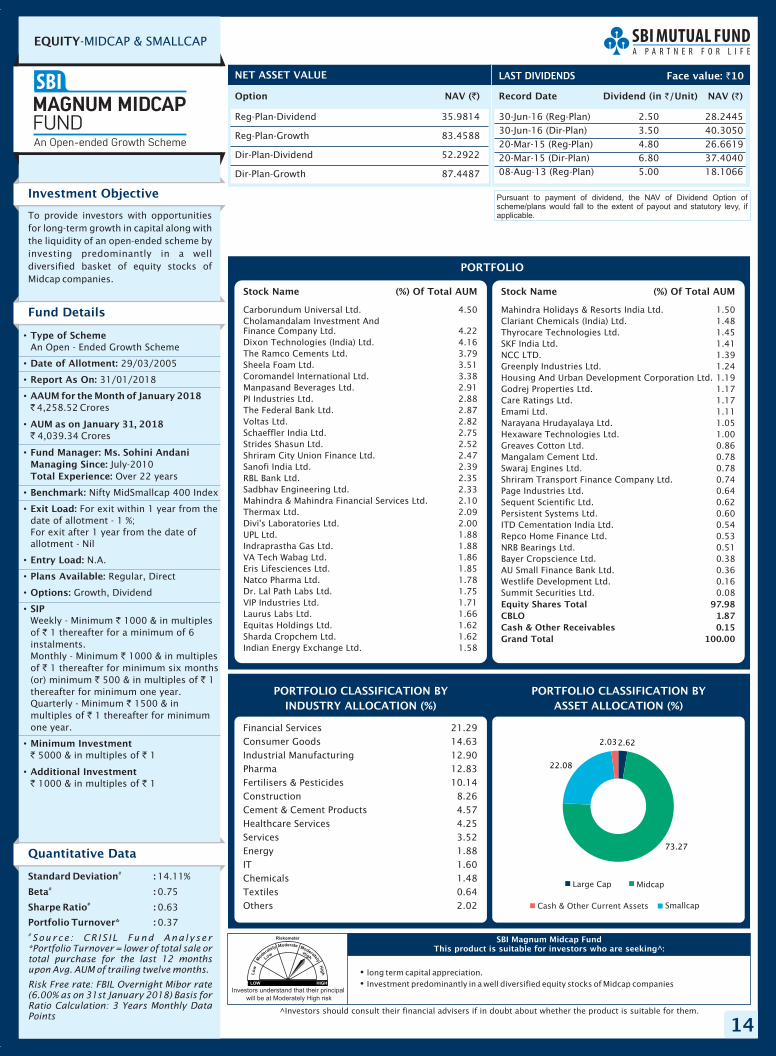
long term capital appreciation.Investment predominantly in a well diversified equity stocks of Midcap companies
SBI Magnum Midcap FundThis product is suitable for investors who are seeking^:
Face value: 10`
Investment Objective
Quantitative Data
To provide investors with opportunitiesfor long-term growth in capital along withthe liquidity of an open-ended scheme byinvesting predominantly in a welldiversified basket of equity stocks ofMidcap companies.
Fund Details
Standard Deviation :
Beta :
Sharpe Ratio :
Portfolio Turnover* :
#
#
#
14.11%
0.75
0.63
0.37#Source : CR IS IL Fund Analyser
*Portfolio Turnover = lower of total sale ortotal purchase for the last 12 monthsupon Avg. AUM of trailing twelve months.
Risk Free rate: FBIL Overnight Mibor rate(6.00% as on 31st January 2018) Basis forRatio Calculation: 3 Years Monthly DataPoints
PORTFOLIO CLASSIFICATION BY(%)ASSET ALLOCATION
Financial Services 21.29Consumer Goods 14.63Industrial Manufacturing 12.90Pharma 12.83Fertilisers & Pesticides 10.14Construction 8.26Cement & Cement Products 4.57Healthcare Services 4.25Services 3.52Energy 1.88IT 1.60Chemicals 1.48Textiles 0.64Others 2.02
Pursuant to payment of dividend, the NAV of Dividend Option ofscheme/plans would fall to the extent of payout and statutory levy, ifapplicable.
•
•
•
•
•
•
•
•
•
•
•
•
•
•
Type of Scheme
Date of Allotment:
Report As On:
AAUM for the Month of January 2018
AUM as on January 31, 2018
Fund Manager: Ms. Sohini AndaniManaging Since:Total Experience:
Benchmark:
Exit Load:
Entry Load:
Plans Available:
Options:
SIP
Minimum Investment
Additional Investment
An Open - Ended Growth Scheme
29/03/2005
31/01/2018
4,258.52 Crores
4,039.34 Crores
July-2010Over 22 years
Nifty MidSmallcap 400 Index
For exit within 1 year from thedate of allotment - 1 %;For exit after 1 year from the date ofallotment - Nil
N.A.
Regular, Direct
Growth, Dividend
Weekly - Minimum 1000 & in multiplesof 1 thereafter for a minimum of 6instalments.Monthly - Minimum 1000 & in multiplesof 1 thereafter for minimum six months(or) minimum 500 & in multiples of 1thereafter for minimum one year.Quarterly - Minimum 1500 & inmultiples of 1 thereafter for minimumone year.
5000 & in multiples of 1
1000 & in multiples of 1
`
`
`
`
`
`
` `
`
`
` `
` `
Large Cap Midcap
Cash & Other Current Assets Smallcap
PORTFOLIO CLASSIFICATION BYINDUSTRY ALLOCATION (%)
PORTFOLIO
Carborundum Universal Ltd. 4.50Cholamandalam Investment AndFinance Company Ltd. 4.22Dixon Technologies (India) Ltd. 4.16The Ramco Cements Ltd. 3.79Sheela Foam Ltd. 3.51Coromandel International Ltd. 3.38Manpasand Beverages Ltd. 2.91PI Industries Ltd. 2.88The Federal Bank Ltd. 2.87Voltas Ltd. 2.82Schaeffler India Ltd. 2.75Strides Shasun Ltd. 2.52Shriram City Union Finance Ltd. 2.47Sanofi India Ltd. 2.39RBL Bank Ltd. 2.35Sadbhav Engineering Ltd. 2.33Mahindra & Mahindra Financial Services Ltd. 2.10Thermax Ltd. 2.09Divi's Laboratories Ltd. 2.00UPL Ltd. 1.88Indraprastha Gas Ltd. 1.88VA Tech Wabag Ltd. 1.86Eris Lifesciences Ltd. 1.85Natco Pharma Ltd. 1.78Dr. Lal Path Labs Ltd. 1.75VIP Industries Ltd. 1.71Laurus Labs Ltd. 1.66Equitas Holdings Ltd. 1.62Sharda Cropchem Ltd. 1.62Indian Energy Exchange Ltd. 1.58
Stock Name (%) Of Total AUM Stock Name (%) Of Total AUM
Mahindra Holidays & Resorts India Ltd. 1.50Clariant Chemicals (India) Ltd. 1.48Thyrocare Technologies Ltd. 1.45SKF India Ltd. 1.41NCC LTD. 1.39Greenply Industries Ltd. 1.24Housing And Urban Development Corporation Ltd. 1.19Godrej Properties Ltd. 1.17Care Ratings Ltd. 1.17Emami Ltd. 1.11Narayana Hrudayalaya Ltd. 1.05Hexaware Technologies Ltd. 1.00Greaves Cotton Ltd. 0.86Mangalam Cement Ltd. 0.78Swaraj Engines Ltd. 0.78Shriram Transport Finance Company Ltd. 0.74Page Industries Ltd. 0.64Sequent Scientific Ltd. 0.62Persistent Systems Ltd. 0.60ITD Cementation India Ltd. 0.54Repco Home Finance Ltd. 0.53NRB Bearings Ltd. 0.51Bayer Cropscience Ltd. 0.38AU Small Finance Bank Ltd. 0.36Westlife Development Ltd. 0.16Summit Securities Ltd. 0.08Equity Shares Total 97.98CBLO 1.87Cash & Other Receivables 0.15Grand Total 100.00
^Investors should consult their financial advisers if in doubt about whether the product is suitable for them.
2.62
73.27
22.08
2.03
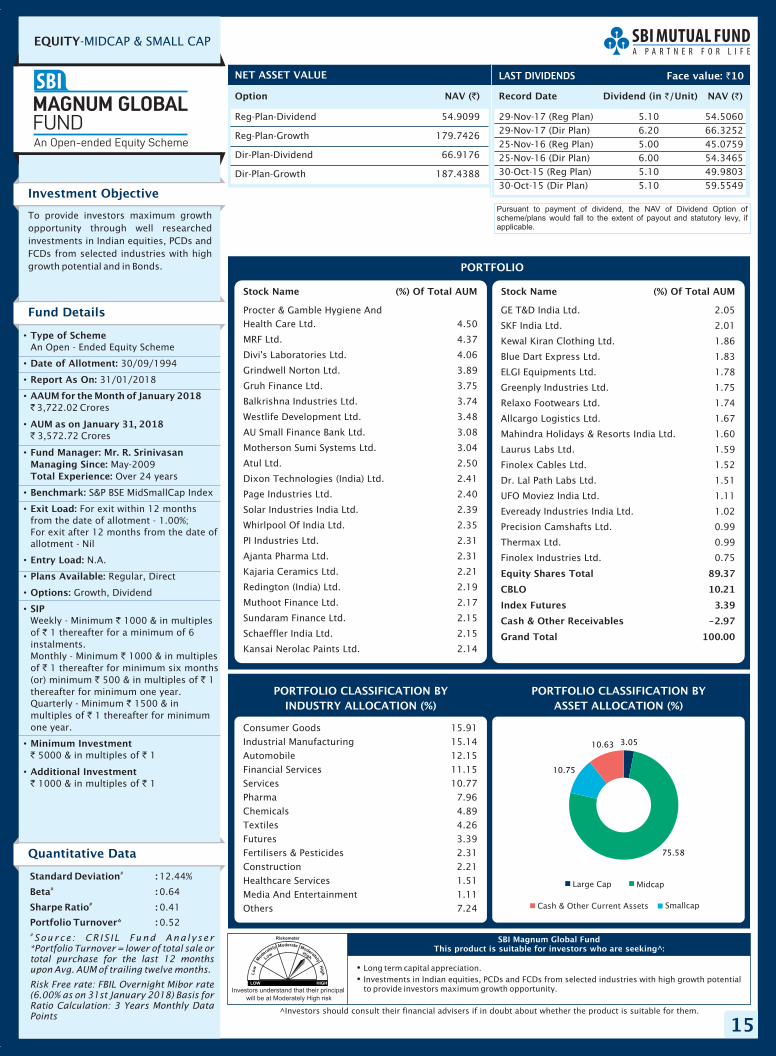
15
EQUITY-MIDCAP & SMALL CAP
Option NAV ( )`
Reg-Plan-Dividend 54.9099
Reg-Plan-Growth 179.7426
Dir-Plan-Dividend 66.9176
Dir-Plan-Growth 187.4388
NET ASSET VALUE
Investors understand that their principal
will be at Moderately High risk
�
�
Long term capital appreciation.Investments in Indian equities, PCDs and FCDs from selected industries with high growth potentialto provide investors maximum growth opportunity.
SBI Magnum Global FundThis product is suitable for investors who are seeking^:
Investment Objective
Quantitative Data
To provide investors maximum growthopportunity through well researchedinvestments in Indian equities, PCDs andFCDs from selected industries with highgrowth potential and in Bonds.
Fund Details
Standard Deviation :
Beta :
Sharpe Ratio :
Portfolio Turnover* :
#
#
#
12.44%
0.64
0.41
0.52#Source : CR IS IL Fund Analyser
*Portfolio Turnover = lower of total sale ortotal purchase for the last 12 monthsupon Avg. AUM of trailing twelve months.
Risk Free rate: FBIL Overnight Mibor rate(6.00% as on 31st January 2018) Basis forRatio Calculation: 3 Years Monthly DataPoints
PORTFOLIO CLASSIFICATION BY(%)ASSET ALLOCATION
Consumer Goods 15.91
Industrial Manufacturing 15.14
Automobile 12.15
Financial Services 11.15
Services 10.77
Pharma 7.96
Chemicals 4.89
Textiles 4.26
Futures 3.39
Fertilisers & Pesticides 2.31
Construction 2.21
Healthcare Services 1.51
Media And Entertainment 1.11
Others 7.24
•
•
•
•
•
•
•
•
•
•
•
•
•
•
Type of Scheme
Date of Allotment:
Report As On:
AAUM for the Month of January 2018
AUM as on January 31, 2018
Fund Manager: Mr. R. SrinivasanManaging Since:Total Experience:
Benchmark:
Exit Load:
Entry Load:
Plans Available:
Options:
SIP
Minimum Investment
Additional Investment
An Open - Ended Equity Scheme
30/09/1994
31/01/2018
3,722.02 Crores
3,572.72 Crores
May-2009Over 24 years
S&P BSE MidSmallCap Index
For exit within 12 monthsfrom the date of allotment - 1.00%;For exit after 12 months from the date ofallotment - Nil
N.A.
Regular, Direct
Growth, Dividend
Weekly - Minimum 1000 & in multiplesof 1 thereafter for a minimum of 6instalments.Monthly - Minimum 1000 & in multiplesof 1 thereafter for minimum six months(or) minimum 500 & in multiples of 1thereafter for minimum one year.Quarterly - Minimum 1500 & inmultiples of 1 thereafter for minimumone year.
5000 & in multiples of 1
1000 & in multiples of 1
`
`
`
`
`
`
` `
`
`
` `
` `
PORTFOLIO CLASSIFICATION BYINDUSTRY ALLOCATION (%)
PORTFOLIO
Procter & Gamble Hygiene AndHealth Care Ltd. 4.50
MRF Ltd. 4.37
Divi's Laboratories Ltd. 4.06
Grindwell Norton Ltd. 3.89
Gruh Finance Ltd. 3.75
Balkrishna Industries Ltd. 3.74
Westlife Development Ltd. 3.48
AU Small Finance Bank Ltd. 3.08
Motherson Sumi Systems Ltd. 3.04
Atul Ltd. 2.50
Dixon Technologies (India) Ltd. 2.41
Page Industries Ltd. 2.40
Solar Industries India Ltd. 2.39
Whirlpool Of India Ltd. 2.35
PI Industries Ltd. 2.31
Ajanta Pharma Ltd. 2.31
Kajaria Ceramics Ltd. 2.21
Redington (India) Ltd. 2.19
Muthoot Finance Ltd. 2.17
Sundaram Finance Ltd. 2.15
Schaeffler India Ltd. 2.15
Kansai Nerolac Paints Ltd. 2.14
Stock Name (%) Of Total AUM Stock Name (%) Of Total AUM
GE T&D India Ltd. 2.05
SKF India Ltd. 2.01
Kewal Kiran Clothing Ltd. 1.86
Blue Dart Express Ltd. 1.83
ELGI Equipments Ltd. 1.78
Greenply Industries Ltd. 1.75
Relaxo Footwears Ltd. 1.74
Allcargo Logistics Ltd. 1.67
Mahindra Holidays & Resorts India Ltd. 1.60
Laurus Labs Ltd. 1.59
Finolex Cables Ltd. 1.52
Dr. Lal Path Labs Ltd. 1.51
UFO Moviez India Ltd. 1.11
Eveready Industries India Ltd. 1.02
Precision Camshafts Ltd. 0.99
Thermax Ltd. 0.99
Finolex Industries Ltd. 0.75
Equity Shares Total 89.37
CBLO 10.21
Index Futures 3.39
Cash & Other Receivables -2.97
Grand Total 100.00
^Investors should consult their financial advisers if in doubt about whether the product is suitable for them.
Record Date Dividend NAV ( )`(in /Unit)`
29-Nov-17 (Reg Plan) 5.10 54.506029-Nov-17 (Dir Plan) 6.20 66.325225-Nov-16 (Reg Plan) 5.00 45.075925-Nov-16 (Dir Plan) 6.00 54.346530-Oct-15 (Reg Plan) 5.10 49.980330-Oct-15 (Dir Plan) 5.10 59.5549
LAST DIVIDENDS Face value: 10`
Pursuant to payment of dividend, the NAV of Dividend Option ofscheme/plans would fall to the extent of payout and statutory levy, ifapplicable.
Large Cap Midcap
Cash & Other Current Assets Smallcap
3.05
75.58
10.75
10.63
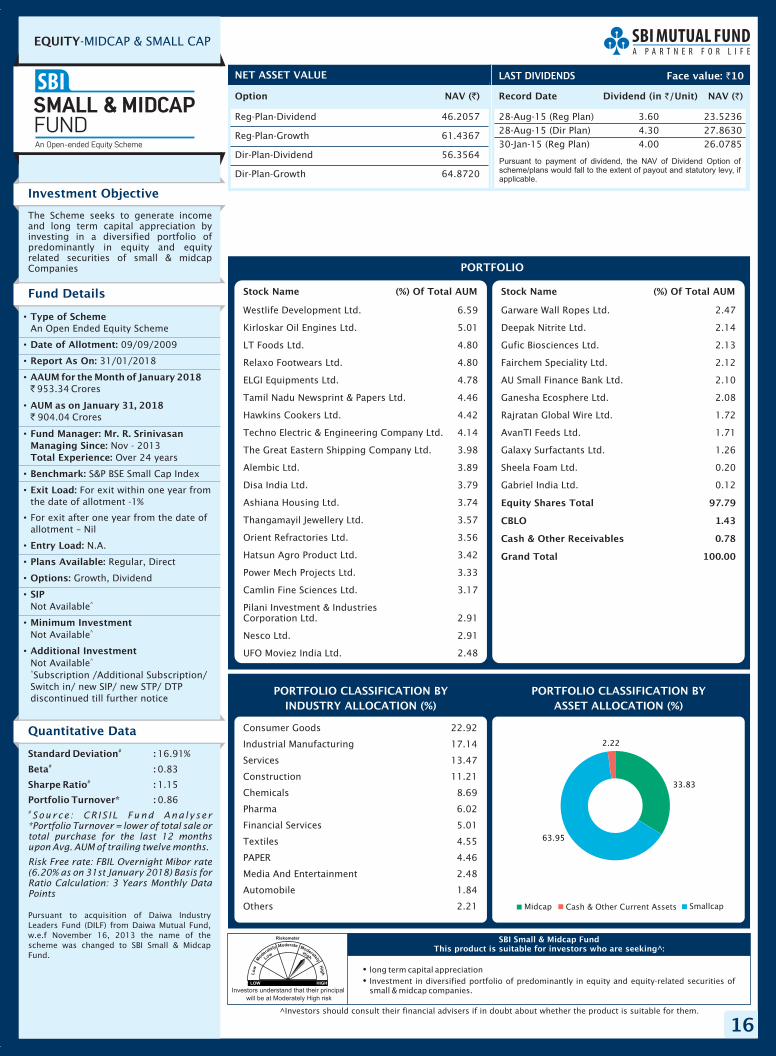
16
EQUITY-MIDCAP & SMALL CAP
Option NAV ( )`
Reg-Plan-Dividend 46.2057
Reg-Plan-Growth 61.4367
Dir-Plan-Dividend 56.3564
Dir-Plan-Growth 64.8720
NET ASSET VALUE
Record Date Dividend NAV ( )`(in /Unit)`
28-Aug-15 (Reg Plan) 3.60 23.523628-Aug-15 (Dir Plan) 4.30 27.863030-Jan-15 (Reg Plan) 4.00 26.0785
LAST DIVIDENDS
Investors understand that their principal
will be at Moderately High risk
�
�
long term capital appreciationInvestment in diversified portfolio of predominantly in equity and equity-related securities ofsmall & midcap companies.
SBI Small & Midcap FundThis product is suitable for investors who are seeking^:
Face value: 10`
Investment Objective
Quantitative Data
The Scheme seeks to generate incomeand long term capital appreciation byinvesting in a diversified portfolio ofpredominantly in equity and equityrelated securities of small & midcapCompanies
Fund Details
Standard Deviation :
Beta :
Sharpe Ratio :
Portfolio Turnover* :
#
#
#
16.91%
0.83
1.15
0.86#Source : CR IS IL Fund Analyser
*Portfolio Turnover = lower of total sale ortotal purchase for the last 12 monthsupon Avg. AUM of trailing twelve months.
Risk Free rate: FBIL Overnight Mibor rate(6.20% as on 31st January 2018) Basis forRatio Calculation: 3 Years Monthly DataPoints
PORTFOLIO CLASSIFICATION BY(%)ASSET ALLOCATION
Consumer Goods 22.92
Industrial Manufacturing 17.14
Services 13.47
Construction 11.21
Chemicals 8.69
Pharma 6.02
Financial Services 5.01
Textiles 4.55
PAPER 4.46
Media And Entertainment 2.48
Automobile 1.84
Others 2.21
Pursuant to payment of dividend, the NAV of Dividend Option ofscheme/plans would fall to the extent of payout and statutory levy, ifapplicable.
•
•
•
•
•
•
•
•
•
•
•
•
•
•
•
Type of Scheme
Date of Allotment:
Report As On:
AAUM for the Month of January 2018
AUM as on January 31, 2018
Fund Manager: Mr. R. SrinivasanManaging Since:Total Experience:
Benchmark:
Exit Load:
Entry Load:
Plans Available:
Options:
SIP
Minimum Investment
Additional Investment
An Open Ended Equity Scheme
09/09/2009
31/01/2018
953.34 Crores
904.04 Crores
Nov - 2013Over 24 years
S&P BSE Small Cap Index
For exit within one year fromthe date of allotment -1%
For exit after one year from the date ofallotment – Nil
N.A.
Regular, Direct
Growth, Dividend
Not Available
Not Available
Not AvailableSubscription /Additional Subscription/
Switch in/ new SIP/ new STP/ DTPdiscontinued till further notice
`
`
^
^
^
^
PORTFOLIO CLASSIFICATION BYINDUSTRY ALLOCATION (%)
PORTFOLIO
Westlife Development Ltd. 6.59
Kirloskar Oil Engines Ltd. 5.01
LT Foods Ltd. 4.80
Relaxo Footwears Ltd. 4.80
ELGI Equipments Ltd. 4.78
Tamil Nadu Newsprint & Papers Ltd. 4.46
Hawkins Cookers Ltd. 4.42
Techno Electric & Engineering Company Ltd. 4.14
The Great Eastern Shipping Company Ltd. 3.98
Alembic Ltd. 3.89
Disa India Ltd. 3.79
Ashiana Housing Ltd. 3.74
Thangamayil Jewellery Ltd. 3.57
Orient Refractories Ltd. 3.56
Hatsun Agro Product Ltd. 3.42
Power Mech Projects Ltd. 3.33
Camlin Fine Sciences Ltd. 3.17
Pilani Investment & IndustriesCorporation Ltd. 2.91
Nesco Ltd. 2.91
UFO Moviez India Ltd. 2.48
Stock Name (%) Of Total AUM Stock Name (%) Of Total AUM
Garware Wall Ropes Ltd. 2.47
Deepak Nitrite Ltd. 2.14
Gufic Biosciences Ltd. 2.13
Fairchem Speciality Ltd. 2.12
AU Small Finance Bank Ltd. 2.10
Ganesha Ecosphere Ltd. 2.08
Rajratan Global Wire Ltd. 1.72
AvanTI Feeds Ltd. 1.71
Galaxy Surfactants Ltd. 1.26
Sheela Foam Ltd. 0.20
Gabriel India Ltd. 0.12
Equity Shares Total 97.79
CBLO 1.43
Cash & Other Receivables 0.78
Grand Total 100.00
Pursuant to acquisition of Daiwa IndustryLeaders Fund (DILF) from Daiwa Mutual Fund,w.e.f November 16, 2013 the name of thescheme was changed to SBI Small & MidcapFund.
^Investors should consult their financial advisers if in doubt about whether the product is suitable for them.
Midcap Cash & Other Current Assets Smallcap
33.83
63.95
2.22
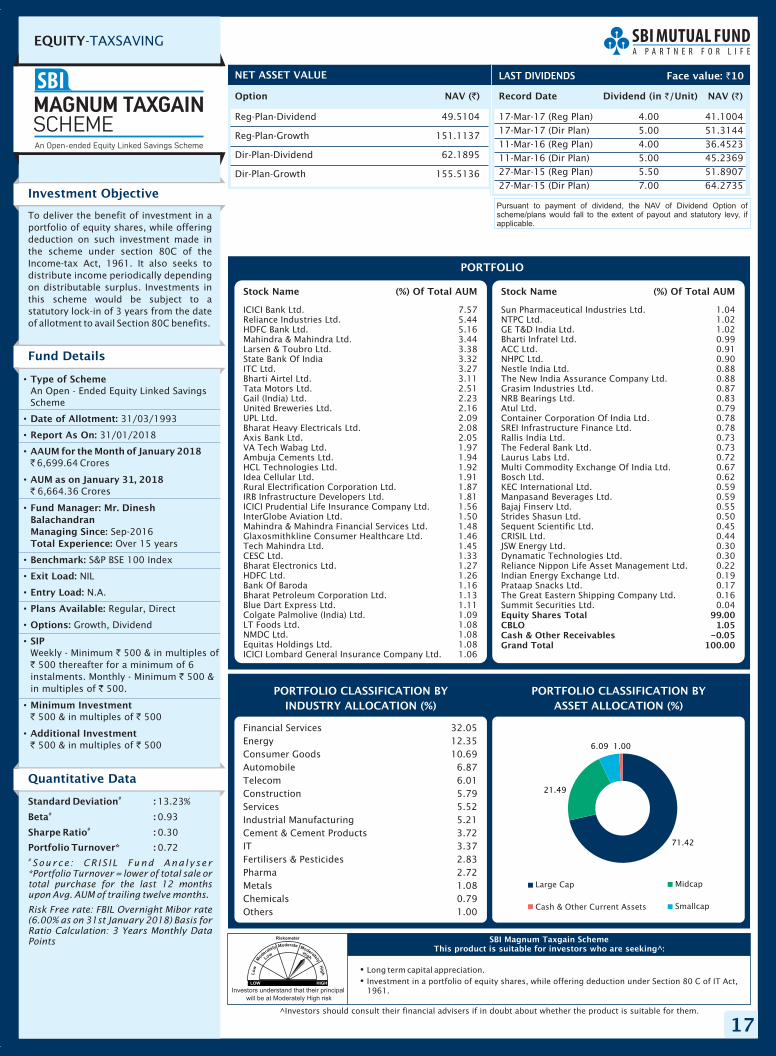
17
EQUITY-TAXSAVING
Option NAV ( )`
Reg-Plan-Dividend 49.5104
Reg-Plan-Growth 151.1137
Dir-Plan-Dividend 62.1895
Dir-Plan-Growth 155.5136
NET ASSET VALUE
Record Date Dividend NAV ( )`(in /Unit)`
17-Mar-17 (Reg Plan) 4.00 41.100417-Mar-17 (Dir Plan) 5.00 51.314411-Mar-16 (Reg Plan) 4.00 36.452311-Mar-16 (Dir Plan) 5.00 45.236927-Mar-15 (Reg Plan) 5.50 51.890727-Mar-15 (Dir Plan) 7.00 64.2735
LAST DIVIDENDS
Investors understand that their principal
will be at Moderately High risk
�
�
Long term capital appreciation.Investment in a portfolio of equity shares, while offering deduction under Section 80 C of IT Act,1961.
SBI Magnum Taxgain SchemeThis product is suitable for investors who are seeking^:
Face value: 10`
Investment Objective
Quantitative Data
To deliver the benefit of investment in aportfolio of equity shares, while offeringdeduction on such investment made inthe scheme under section 80C of theIncome-tax Act, 1961. It also seeks todistribute income periodically dependingon distributable surplus. Investments inthis scheme would be subject to astatutory lock-in of 3 years from the dateof allotment to avail Section 80C benefits.
Fund Details
Standard Deviation :
Beta :
Sharpe Ratio :
Portfolio Turnover* :
#
#
#
13.23%
0.93
0.30
0.72#Source : CR IS IL Fund Analyser
*Portfolio Turnover = lower of total sale ortotal purchase for the last 12 monthsupon Avg. AUM of trailing twelve months.
Risk Free rate: FBIL Overnight Mibor rate(6.00% as on 31st January 2018) Basis forRatio Calculation: 3 Years Monthly DataPoints
PORTFOLIO CLASSIFICATION BY(%)ASSET ALLOCATION
Financial Services 32.05Energy 12.35Consumer Goods 10.69Automobile 6.87Telecom 6.01Construction 5.79Services 5.52Industrial Manufacturing 5.21Cement & Cement Products 3.72IT 3.37Fertilisers & Pesticides 2.83Pharma 2.72Metals 1.08Chemicals 0.79Others 1.00
Pursuant to payment of dividend, the NAV of Dividend Option ofscheme/plans would fall to the extent of payout and statutory levy, ifapplicable.
•
•
•
•
•
•
•
•
•
•
•
•
•
•
Type of Scheme
Date of Allotment:
Report As On:
AAUM for the Month of January 2018
AUM as on January 31, 2018
Fund Manager: Mr. DineshBalachandranManaging Since:Total Experience:
Benchmark:
Exit Load:
Entry Load:
Plans Available:
Options:
SIP
Minimum Investment
Additional Investment
An Open - Ended Equity Linked SavingsScheme
31/03/1993
31/01/2018
6,699.64 Crores
6,664.36 Crores
Sep-2016Over 15 years
S&P BSE 100 Index
NIL
N.A.
Regular, Direct
Growth, Dividend
Weekly - Minimum 500 & in multiples of500 thereafter for a minimum of 6
instalments. Monthly - Minimum 500 &in multiples of 500.
500 & in multiples of 500
500 & in multiples of 500
`
`
`
`
`
`
` `
` `
Large Cap Midcap
Cash & Other Current Assets Smallcap
PORTFOLIO CLASSIFICATION BYINDUSTRY ALLOCATION (%)
PORTFOLIO
ICICI Bank Ltd. 7.57Reliance Industries Ltd. 5.44HDFC Bank Ltd. 5.16Mahindra & Mahindra Ltd. 3.44Larsen & Toubro Ltd. 3.38State Bank Of India 3.32ITC Ltd. 3.27Bharti Airtel Ltd. 3.11Tata Motors Ltd. 2.51Gail (India) Ltd. 2.23United Breweries Ltd. 2.16UPL Ltd. 2.09Bharat Heavy Electricals Ltd. 2.08Axis Bank Ltd. 2.05VA Tech Wabag Ltd. 1.97Ambuja Cements Ltd. 1.94HCL Technologies Ltd. 1.92Idea Cellular Ltd. 1.91Rural Electrification Corporation Ltd. 1.87IRB Infrastructure Developers Ltd. 1.81ICICI Prudential Life Insurance Company Ltd. 1.56InterGlobe Aviation Ltd. 1.50Mahindra & Mahindra Financial Services Ltd. 1.48Glaxosmithkline Consumer Healthcare Ltd. 1.46Tech Mahindra Ltd. 1.45CESC Ltd. 1.33Bharat Electronics Ltd. 1.27HDFC Ltd. 1.26Bank Of Baroda 1.16Bharat Petroleum Corporation Ltd. 1.13Blue Dart Express Ltd. 1.11Colgate Palmolive (India) Ltd. 1.09LT Foods Ltd. 1.08NMDC Ltd. 1.08Equitas Holdings Ltd. 1.08ICICI Lombard General Insurance Company Ltd. 1.06
Stock Name (%) Of Total AUM Stock Name (%) Of Total AUM
Sun Pharmaceutical Industries Ltd. 1.04NTPC Ltd. 1.02GE T&D India Ltd. 1.02Bharti Infratel Ltd. 0.99ACC Ltd. 0.91NHPC Ltd. 0.90Nestle India Ltd. 0.88The New India Assurance Company Ltd. 0.88Grasim Industries Ltd. 0.87NRB Bearings Ltd. 0.83Atul Ltd. 0.79Container Corporation Of India Ltd. 0.78SREI Infrastructure Finance Ltd. 0.78Rallis India Ltd. 0.73The Federal Bank Ltd. 0.73Laurus Labs Ltd. 0.72Multi Commodity Exchange Of India Ltd. 0.67Bosch Ltd. 0.62KEC International Ltd. 0.59Manpasand Beverages Ltd. 0.59Bajaj Finserv Ltd. 0.55Strides Shasun Ltd. 0.50Sequent Scientific Ltd. 0.45CRISIL Ltd. 0.44JSW Energy Ltd. 0.30Dynamatic Technologies Ltd. 0.30Reliance Nippon Life Asset Management Ltd. 0.22Indian Energy Exchange Ltd. 0.19Prataap Snacks Ltd. 0.17The Great Eastern Shipping Company Ltd. 0.16Summit Securities Ltd. 0.04Equity Shares Total 99.00CBLO 1.05Cash & Other Receivables -0.05Grand Total 100.00
^Investors should consult their financial advisers if in doubt about whether the product is suitable for them.
71.42
21.49
6.09 1.00
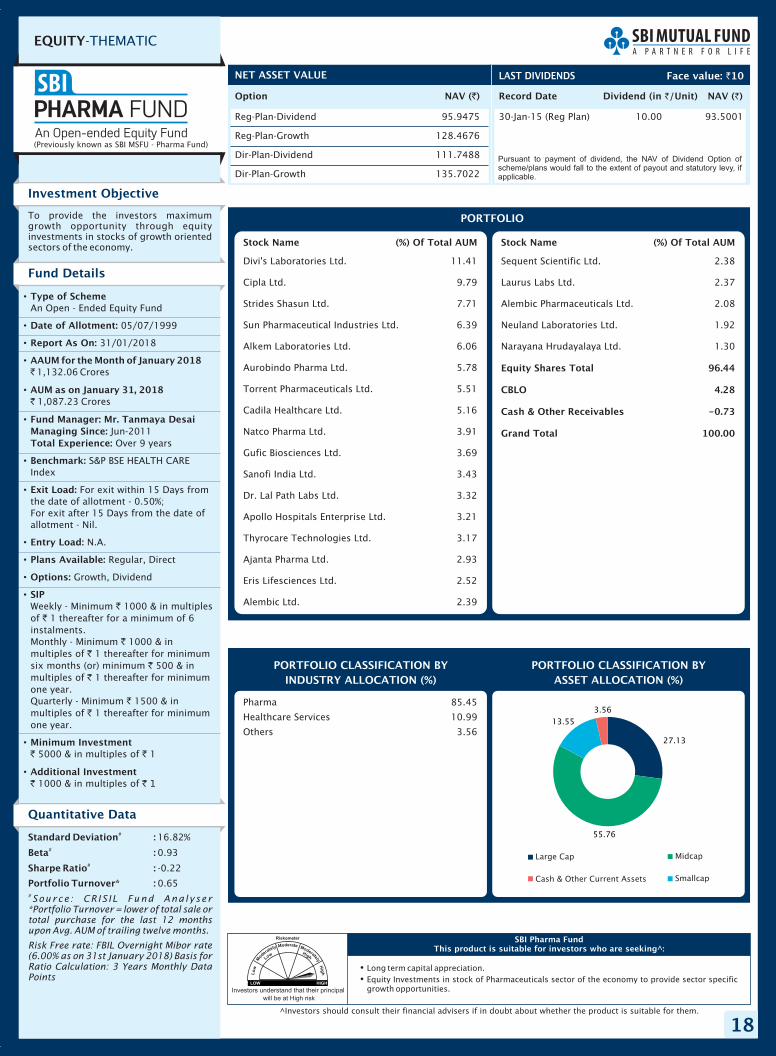
18
EQUITY-THEMATIC
Option NAV ( )`
Reg-Plan-Dividend 95.9475
Reg-Plan-Growth 128.4676
Dir-Plan-Dividend 111.7488
Dir-Plan-Growth 135.7022
NET ASSET VALUE
Record Date Dividend NAV ( )`(in /Unit)`
30-Jan-15 (Reg Plan) 10.00 93.5001
LAST DIVIDENDS
Investors understand that their principal
will be at High risk
�
�
Long term capital appreciation.Equity Investments in stock of Pharmaceuticals sector of the economy to provide sector specificgrowth opportunities.
SBI Pharma FundThis product is suitable for investors who are seeking^:
Face value: 10`
Investment Objective
Quantitative Data
To provide the investors maximumgrowth opportunity through equityinvestments in stocks of growth orientedsectors of the economy.
Fund Details
Standard Deviation :
Beta :
Sharpe Ratio :
Portfolio Turnover* :
#
#
#
16.82%
0.93
-0.22
0.65#Source : CR IS IL Fund Analyser
*Portfolio Turnover = lower of total sale ortotal purchase for the last 12 monthsupon Avg. AUM of trailing twelve months.
Risk Free rate: FBIL Overnight Mibor rate(6.00% as on 31st January 2018) Basis forRatio Calculation: 3 Years Monthly DataPoints
PORTFOLIO CLASSIFICATION BY(%)ASSET ALLOCATION
Pharma 85.45
Healthcare Services 10.99
Others 3.56
Pursuant to payment of dividend, the NAV of Dividend Option ofscheme/plans would fall to the extent of payout and statutory levy, ifapplicable.
•
•
•
•
•
•
•
•
•
•
•
•
•
•
Type of Scheme
Date of Allotment:
Report As On:
AAUM for the Month of January 2018
AUM as on January 31, 2018
Fund Manager: Mr. Tanmaya DesaiManaging Since:Total Experience:
Benchmark:
Exit Load:
Entry Load:
Plans Available:
Options:
SIP
Minimum Investment
Additional Investment
An Open - Ended Equity Fund
05/07/1999
31/01/2018
1,132.06 Crores
1,087.23 Crores
Jun-2011Over 9 years
S&P BSE HEALTH CAREIndex
For exit within 15 Days fromthe date of allotment - 0.50%;For exit after 15 Days from the date ofallotment - Nil.
N.A.
Regular, Direct
Growth, Dividend
Weekly - Minimum 1000 & in multiplesof 1 thereafter for a minimum of 6instalments.Monthly - Minimum 1000 & inmultiples of 1 thereafter for minimumsix months (or) minimum 500 & inmultiples of 1 thereafter for minimumone year.Quarterly - Minimum 1500 & inmultiples of 1 thereafter for minimumone year.
5000 & in multiples of 1
1000 & in multiples of
`
`
`
`
`
`
`
`
`
`
` `
` ` 1
Large Cap Midcap
Cash & Other Current Assets Smallcap
PORTFOLIO CLASSIFICATION BYINDUSTRY ALLOCATION (%)
PORTFOLIO
Divi's Laboratories Ltd. 11.41
Cipla Ltd. 9.79
Strides Shasun Ltd. 7.71
Sun Pharmaceutical Industries Ltd. 6.39
Alkem Laboratories Ltd. 6.06
Aurobindo Pharma Ltd. 5.78
Torrent Pharmaceuticals Ltd. 5.51
Cadila Healthcare Ltd. 5.16
Natco Pharma Ltd. 3.91
Gufic Biosciences Ltd. 3.69
Sanofi India Ltd. 3.43
Dr. Lal Path Labs Ltd. 3.32
Apollo Hospitals Enterprise Ltd. 3.21
Thyrocare Technologies Ltd. 3.17
Ajanta Pharma Ltd. 2.93
Eris Lifesciences Ltd. 2.52
Alembic Ltd. 2.39
Stock Name (%) Of Total AUM Stock Name (%) Of Total AUM
Sequent Scientific Ltd. 2.38
Laurus Labs Ltd. 2.37
Alembic Pharmaceuticals Ltd. 2.08
Neuland Laboratories Ltd. 1.92
Narayana Hrudayalaya Ltd. 1.30
Equity Shares Total 96.44
CBLO 4.28
Cash & Other Receivables -0.73
Grand Total 100.00
(Previously known as SBI MSFU - Pharma Fund)
^Investors should consult their financial advisers if in doubt about whether the product is suitable for them.
27.13
55.76
13.553.56
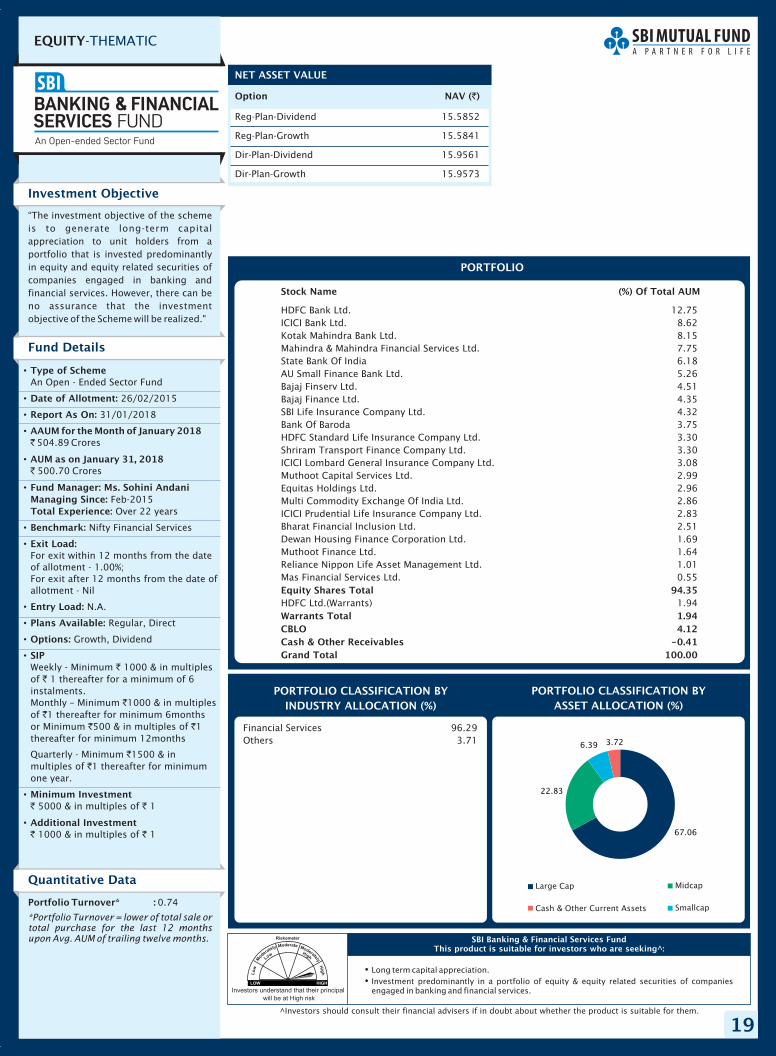
19
EQUITY-THEMATIC
Option NAV ( )`
Reg-Plan-Dividend 15.5852
Reg-Plan-Growth 15.5841
Dir-Plan-Dividend 15.9561
Dir-Plan-Growth 15.9573
NET ASSET VALUE
�
�
Long term capital appreciation.Investment predominantly in a portfolio of equity & equity related securities of companiesengaged in banking and financial services.
SBI Banking & Financial Services FundThis product is suitable for investors who are seeking^:
Investment Objective
“The investment objective of the schemeis to generate long-term capitalappreciation to unit holders from aportfolio that is invested predominantlyin equity and equity related securities ofcompanies engaged in banking andfinancial services. However, there can beno assurance that the investmentobjective of the Scheme will be realized."
Fund Details
PORTFOLIO CLASSIFICATION BY(%)ASSET ALLOCATION
Financial Services 96.29Others 3.71
•
•
•
•
•
•
•
•
•
•
•
•
•
•
Type of Scheme
Date of Allotment:
Report As On:
AAUM for the Month of January 2018
AUM as on January 31, 2018
Fund Manager: Ms. Sohini AndaniManaging Since:Total Experience:
Benchmark:
Exit Load:
Entry Load:
Plans Available:
Options:
SIP
Minimum Investment
Additional Investment
An Open - Ended Sector Fund
26/02/2015
31/01/2018
504.89 Crores
500.70 Crores
Feb-2015Over 22 years
Nifty Financial Services
For exit within 12 months from the dateof allotment - 1.00%;For exit after 12 months from the date ofallotment - Nil
N.A.
Regular, Direct
Growth, Dividend
Weekly - Minimum 1000 & in multiplesof 1 thereafter for a minimum of 6instalments.Monthly – Minimum 1000 & in multiplesof 1 thereafter for minimum 6monthsor Minimum 500 & in multiples of 1thereafter for minimum 12months
Quarterly - Minimum 1500 & inmultiples of 1 thereafter for minimumone year.
5000 & in multiples of 1
1000 & in multiples of 1
`
`
`
`
`
`
` `
`
`
` `
` `
PORTFOLIO CLASSIFICATION BYINDUSTRY ALLOCATION (%)
^Investors should consult their financial advisers if in doubt about whether the product is suitable for them.
PORTFOLIO
HDFC Bank Ltd. 12.75ICICI Bank Ltd. 8.62Kotak Mahindra Bank Ltd. 8.15Mahindra & Mahindra Financial Services Ltd. 7.75State Bank Of India 6.18AU Small Finance Bank Ltd. 5.26Bajaj Finserv Ltd. 4.51Bajaj Finance Ltd. 4.35SBI Life Insurance Company Ltd. 4.32Bank Of Baroda 3.75HDFC Standard Life Insurance Company Ltd. 3.30Shriram Transport Finance Company Ltd. 3.30ICICI Lombard General Insurance Company Ltd. 3.08Muthoot Capital Services Ltd. 2.99Equitas Holdings Ltd. 2.96Multi Commodity Exchange Of India Ltd. 2.86ICICI Prudential Life Insurance Company Ltd. 2.83Bharat Financial Inclusion Ltd. 2.51Dewan Housing Finance Corporation Ltd. 1.69Muthoot Finance Ltd. 1.64Reliance Nippon Life Asset Management Ltd. 1.01Mas Financial Services Ltd. 0.55
HDFC Ltd.(Warrants) 1.94Equity Shares Total 94.35
Warrants Total 1.94CBLO 4.12Cash & Other Receivables -0.41Grand Total 100.00
Stock Name (%) Of Total AUM
Investors understand that their principal
will be at High risk
Quantitative Data
Portfolio Turnover* : 0.74
*Portfolio Turnover = lower of total sale ortotal purchase for the last 12 monthsupon Avg. AUM of trailing twelve months.
Large Cap Midcap
Cash & Other Current Assets Smallcap
67.06
22.83
6.39 3.72
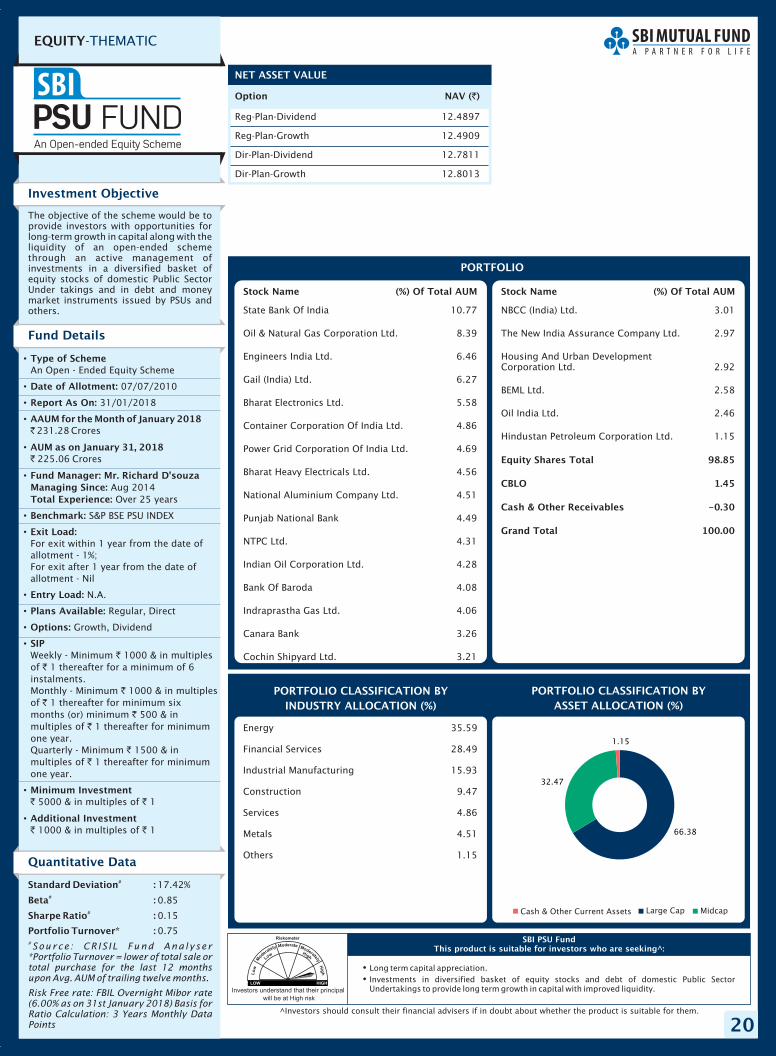
20
EQUITY-THEMATIC
Option NAV ( )`
Reg-Plan-Dividend 12.4897
Reg-Plan-Growth 12.4909
Dir-Plan-Dividend 12.7811
Dir-Plan-Growth 12.8013
NET ASSET VALUE
�
�
Long term capital appreciation.Investments in diversified basket of equity stocks and debt of domestic Public SectorUndertakings to provide long term growth in capital with improved liquidity.
SBI PSU FundThis product is suitable for investors who are seeking^:
Investment Objective
Quantitative Data
The objective of the scheme would be toprovide investors with opportunities forlong-term growth in capital along with theliquidity of an open-ended schemethrough an active management ofinvestments in a diversified basket ofequity stocks of domestic Public SectorUnder takings and in debt and moneymarket instruments issued by PSUs andothers.
Fund Details
Standard Deviation :
Beta :
Sharpe Ratio :
Portfolio Turnover* :
#
#
#
17.42%
0.85
0.15
0.75#Source : CR IS IL Fund Analyser
*Portfolio Turnover = lower of total sale ortotal purchase for the last 12 monthsupon Avg. AUM of trailing twelve months.
Risk Free rate: FBIL Overnight Mibor rate(6.00% as on 31st January 2018) Basis forRatio Calculation: 3 Years Monthly DataPoints
PORTFOLIO CLASSIFICATION BY(%)ASSET ALLOCATION
Energy 35.59
Financial Services 28.49
Industrial Manufacturing 15.93
Construction 9.47
Services 4.86
Metals 4.51
Others 1.15
•
•
•
•
•
•
•
•
•
•
•
•
•
•
Type of Scheme
Date of Allotment:
Report As On:
AAUM for the Month of January 2018
AUM as on January 31, 2018
Fund Manager: Mr. Richard D'souzaManaging Since:Total Experience:
Benchmark:
Exit Load:
Entry Load:
Plans Available:
Options:
SIP
Minimum Investment
Additional Investment
An Open - Ended Equity Scheme
07/07/2010
31/01/2018
231.28 Crores
225.06 Crores
Aug 2014Over 25 years
S&P BSE PSU INDEX
For exit within 1 year from the date ofallotment - 1%;For exit after 1 year from the date ofallotment - Nil
N.A.
Regular, Direct
Growth, Dividend
Weekly - Minimum 1000 & in multiplesof 1 thereafter for a minimum of 6instalments.Monthly - Minimum 1000 & in multiplesof 1 thereafter for minimum sixmonths (or) minimum 500 & inmultiples of 1 thereafter for minimumone year.Quarterly - Minimum 1500 & inmultiples of 1 thereafter for minimumone year.
5000 & in multiples of 1
1000 & in multiples of 1
`
`
`
`
`
`
`
`
`
`
` `
` `
PORTFOLIO CLASSIFICATION BYINDUSTRY ALLOCATION (%)
PORTFOLIO
State Bank Of India 10.77
Oil & Natural Gas Corporation Ltd. 8.39
Engineers India Ltd. 6.46
Gail (India) Ltd. 6.27
Bharat Electronics Ltd. 5.58
Container Corporation Of India Ltd. 4.86
Power Grid Corporation Of India Ltd. 4.69
Bharat Heavy Electricals Ltd. 4.56
National Aluminium Company Ltd. 4.51
Punjab National Bank 4.49
NTPC Ltd. 4.31
Indian Oil Corporation Ltd. 4.28
Bank Of Baroda 4.08
Indraprastha Gas Ltd. 4.06
Canara Bank 3.26
Cochin Shipyard Ltd. 3.21
Stock Name (%) Of Total AUM Stock Name (%) Of Total AUM
NBCC (India) Ltd. 3.01
The New India Assurance Company Ltd. 2.97
Housing And Urban DevelopmentCorporation Ltd. 2.92
BEML Ltd. 2.58
Oil India Ltd. 2.46
Hindustan Petroleum Corporation Ltd. 1.15
Equity Shares Total 98.85
CBLO 1.45
Cash & Other Receivables -0.30
Grand Total 100.00
^Investors should consult their financial advisers if in doubt about whether the product is suitable for them.
Investors understand that their principal
will be at High risk
Large Cap MidcapCash & Other Current Assets
66.38
32.47
1.15
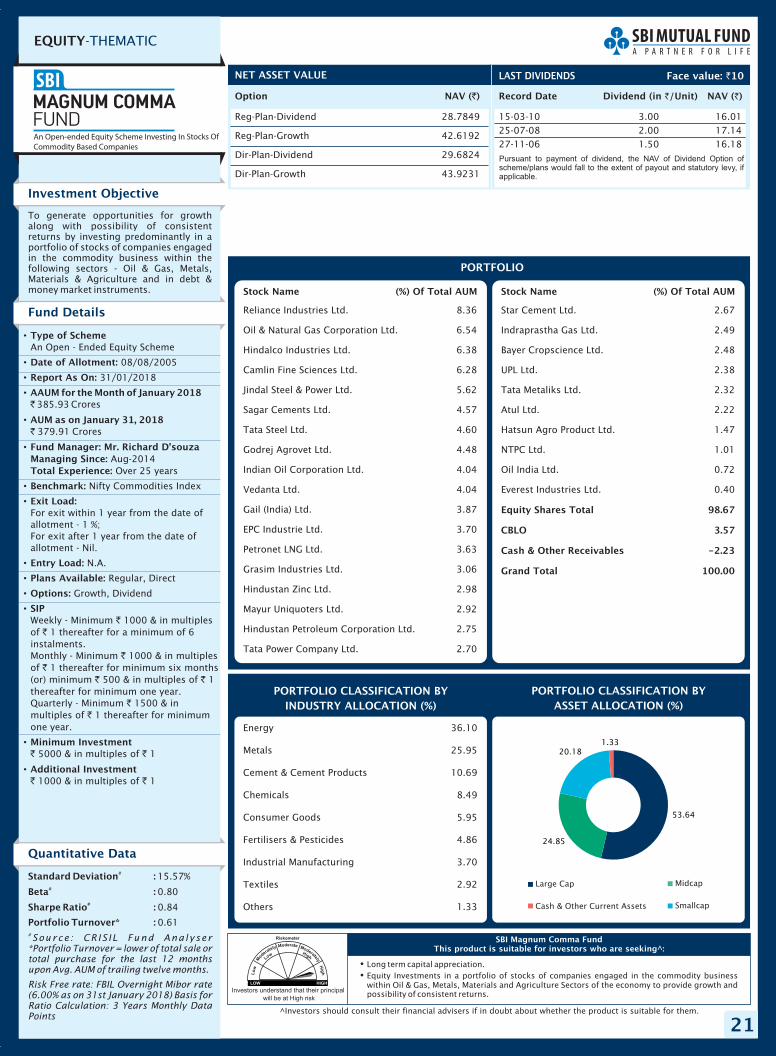
21
EQUITY-THEMATIC
Option NAV ( )`
Reg-Plan-Dividend 28.7849
Reg-Plan-Growth 42.6192
Dir-Plan-Dividend 29.6824
Dir-Plan-Growth 43.9231
NET ASSET VALUE
Record Date Dividend NAV ( )`(in /Unit)`
15-03-10 3.00 16.0125-07-08 2.00 17.1427-11-06 1.50 16.18
LAST DIVIDENDS
Investors understand that their principal
will be at High risk
�
�
Long term capital appreciation.Equity Investments in a portfolio of stocks of companies engaged in the commodity businesswithin Oil & Gas, Metals, Materials and Agriculture Sectors of the economy to provide growth andpossibility of consistent returns.
SBI Magnum Comma FundThis product is suitable for investors who are seeking^:
Face value: 10`
Investment Objective
Quantitative Data
To generate opportunities for growthalong with possibility of consistentreturns by investing predominantly in aportfolio of stocks of companies engagedin the commodity business within thefollowing sectors - Oil & Gas, Metals,Materials & Agriculture and in debt &money market instruments.
Fund Details
Standard Deviation :
Beta :
Sharpe Ratio :
Portfolio Turnover* :
#
#
#
15.57%
0.80
0.84
0.61#Source : CR IS IL Fund Analyser
*Portfolio Turnover = lower of total sale ortotal purchase for the last 12 monthsupon Avg. AUM of trailing twelve months.
Risk Free rate: FBIL Overnight Mibor rate(6.00% as on 31st January 2018) Basis forRatio Calculation: 3 Years Monthly DataPoints
PORTFOLIO CLASSIFICATION BY(%)ASSET ALLOCATION
Energy 36.10
Metals 25.95
Cement & Cement Products 10.69
Chemicals 8.49
Consumer Goods 5.95
Fertilisers & Pesticides 4.86
Industrial Manufacturing 3.70
Textiles 2.92
Others 1.33
Pursuant to payment of dividend, the NAV of Dividend Option ofscheme/plans would fall to the extent of payout and statutory levy, ifapplicable.
•
•
•
•
•
•
•
•
•
•
•
•
•
•
Type of Scheme
Date of Allotment:
Report As On:
AAUM for the Month of January 2018
AUM as on January 31, 2018
Fund Manager: Mr. Richard D'souzaManaging Since:Total Experience:
Benchmark:
Exit Load:
Entry Load:
Plans Available:
Options:
SIP
Minimum Investment
Additional Investment
An Open - Ended Equity Scheme
08/08/2005
31/01/2018
385.93 Crores
379.91 Crores
Aug-2014Over 25 years
Nifty Commodities Index
For exit within 1 year from the date ofallotment - 1 %;For exit after 1 year from the date ofallotment - Nil.
N.A.
Regular, Direct
Growth, Dividend
Weekly - Minimum 1000 & in multiplesof 1 thereafter for a minimum of 6instalments.Monthly - Minimum 1000 & in multiplesof 1 thereafter for minimum six months(or) minimum 500 & in multiples of 1thereafter for minimum one year.Quarterly - Minimum 1500 & inmultiples of 1 thereafter for minimumone year.
5000 & in multiples of 1
1000 & in multiples of 1
`
`
`
`
`
`
` `
`
`
` `
` `
Large Cap Midcap
Cash & Other Current Assets Smallcap
PORTFOLIO CLASSIFICATION BYINDUSTRY ALLOCATION (%)
PORTFOLIO
Reliance Industries Ltd. 8.36
Oil & Natural Gas Corporation Ltd. 6.54
Hindalco Industries Ltd. 6.38
Camlin Fine Sciences Ltd. 6.28
Jindal Steel & Power Ltd. 5.62
Sagar Cements Ltd. 4.57
Tata Steel Ltd. 4.60
Godrej Agrovet Ltd. 4.48
Indian Oil Corporation Ltd. 4.04
Vedanta Ltd. 4.04
Gail (India) Ltd. 3.87
EPC Industrie Ltd. 3.70
Petronet LNG Ltd. 3.63
Grasim Industries Ltd. 3.06
Hindustan Zinc Ltd. 2.98
Mayur Uniquoters Ltd. 2.92
Hindustan Petroleum Corporation Ltd. 2.75
Tata Power Company Ltd. 2.70
Stock Name (%) Of Total AUM Stock Name (%) Of Total AUM
Star Cement Ltd. 2.67
Indraprastha Gas Ltd. 2.49
Bayer Cropscience Ltd. 2.48
UPL Ltd. 2.38
Tata Metaliks Ltd. 2.32
Atul Ltd. 2.22
Hatsun Agro Product Ltd. 1.47
NTPC Ltd. 1.01
Oil India Ltd. 0.72
Everest Industries Ltd. 0.40
Equity Shares Total 98.67
CBLO 3.57
Cash & Other Receivables -2.23
Grand Total 100.00
^Investors should consult their financial advisers if in doubt about whether the product is suitable for them.
53.64
24.85
20.181.33
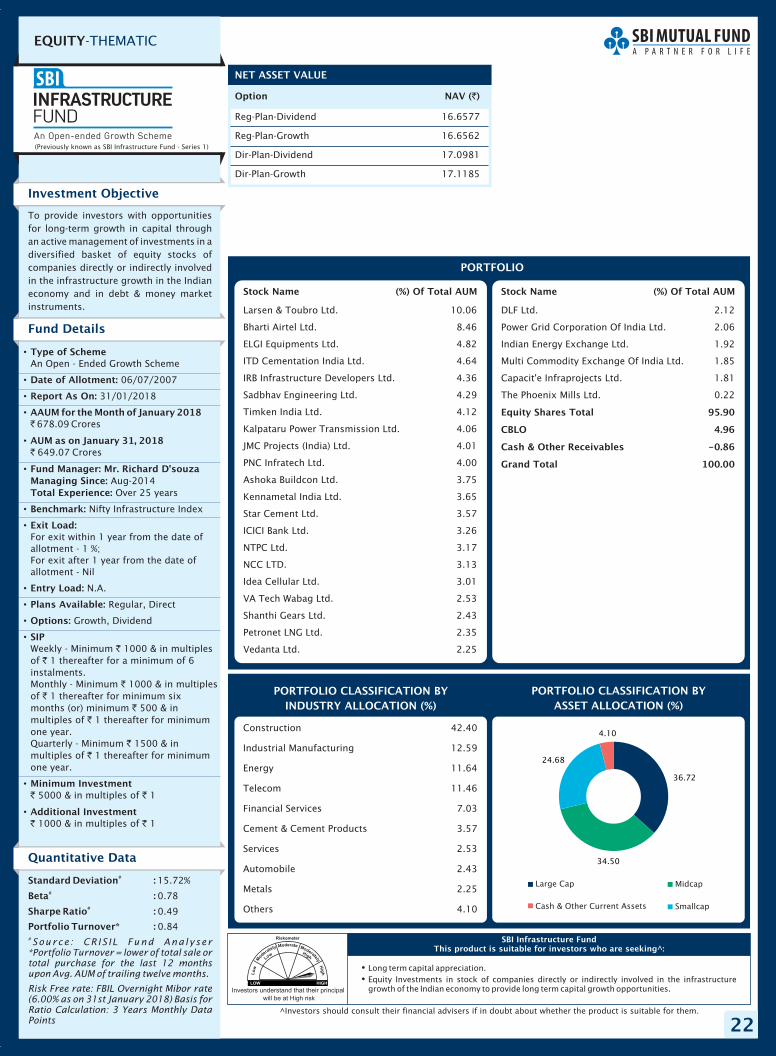
22
EQUITY-THEMATIC
Option NAV ( )`
Reg-Plan-Dividend 16.6577
Reg-Plan-Growth 16.6562
Dir-Plan-Dividend 17.0981
Dir-Plan-Growth 17.1185
NET ASSET VALUE
Investors understand that their principal
will be at High risk
�
�
Long term capital appreciation.Equity Investments in stock of companies directly or indirectly involved in the infrastructuregrowth of the Indian economy to provide long term capital growth opportunities.
SBI Infrastructure FundThis product is suitable for investors who are seeking^:
Investment Objective
Quantitative Data
To provide investors with opportunitiesfor long-term growth in capital throughan active management of investments in adiversified basket of equity stocks ofcompanies directly or indirectly involvedin the infrastructure growth in the Indianeconomy and in debt & money marketinstruments.
Fund Details
Standard Deviation :
Beta :
Sharpe Ratio :
Portfolio Turnover* :
#
#
#
15.72%
0.78
0.49
0.84#Source : CR IS IL Fund Analyser
*Portfolio Turnover = lower of total sale ortotal purchase for the last 12 monthsupon Avg. AUM of trailing twelve months.
Risk Free rate: FBIL Overnight Mibor rate(6.00% as on 31st January 2018) Basis forRatio Calculation: 3 Years Monthly DataPoints
PORTFOLIO CLASSIFICATION BY(%)ASSET ALLOCATION
Construction 42.40
Industrial Manufacturing 12.59
Energy 11.64
Telecom 11.46
Financial Services 7.03
Cement & Cement Products 3.57
Services 2.53
Automobile 2.43
Metals 2.25
Others 4.10
•
•
•
•
•
•
•
•
•
•
•
•
•
•
Type of Scheme
Date of Allotment:
Report As On:
AAUM for the Month of January 2018
AUM as on January 31, 2018
Fund Manager: Mr. Richard D'souzaManaging Since:Total Experience:
Benchmark:
Exit Load:
Entry Load:
Plans Available:
Options:
SIP
Minimum Investment
Additional Investment
An Open - Ended Growth Scheme
06/07/2007
31/01/2018
678.09 Crores
649.07 Crores
Aug-2014Over 25 years
Nifty Infrastructure Index
For exit within 1 year from the date ofallotment - 1 %;For exit after 1 year from the date ofallotment - Nil
N.A.
Regular, Direct
Growth, Dividend
Weekly - Minimum 1000 & in multiplesof 1 thereafter for a minimum of 6instalments.Monthly - Minimum 1000 & in multiplesof 1 thereafter for minimum sixmonths (or) minimum 500 & inmultiples of 1 thereafter for minimumone year.Quarterly - Minimum 1500 & inmultiples of 1 thereafter for minimumone year.
5000 & in multiples of 1
1000 & in multiples of 1
`
`
`
`
`
`
`
`
`
`
` `
` `
Large Cap Midcap
Cash & Other Current Assets
PORTFOLIO CLASSIFICATION BYINDUSTRY ALLOCATION (%)
PORTFOLIO
Larsen & Toubro Ltd. 10.06
Bharti Airtel Ltd. 8.46
ELGI Equipments Ltd. 4.82
ITD Cementation India Ltd. 4.64
IRB Infrastructure Developers Ltd. 4.36
Sadbhav Engineering Ltd. 4.29
Timken India Ltd. 4.12
Kalpataru Power Transmission Ltd. 4.06
JMC Projects (India) Ltd. 4.01
PNC Infratech Ltd. 4.00
Ashoka Buildcon Ltd. 3.75
Kennametal India Ltd. 3.65
Star Cement Ltd. 3.57
ICICI Bank Ltd. 3.26
NTPC Ltd. 3.17
NCC LTD. 3.13
Idea Cellular Ltd. 3.01
VA Tech Wabag Ltd. 2.53
Shanthi Gears Ltd. 2.43
Petronet LNG Ltd. 2.35
Vedanta Ltd. 2.25
Stock Name (%) Of Total AUM Stock Name (%) Of Total AUM
DLF Ltd. 2.12
Power Grid Corporation Of India Ltd. 2.06
Indian Energy Exchange Ltd. 1.92
Multi Commodity Exchange Of India Ltd. 1.85
Capacit'e Infraprojects Ltd. 1.81
The Phoenix Mills Ltd. 0.22
Equity Shares Total 95.90
CBLO 4.96
Cash & Other Receivables -0.86
Grand Total 100.00
(Previously known as SBI Infrastructure Fund - Series 1)
^Investors should consult their financial advisers if in doubt about whether the product is suitable for them.
Smallcap
36.72
34.50
24.68
4.10
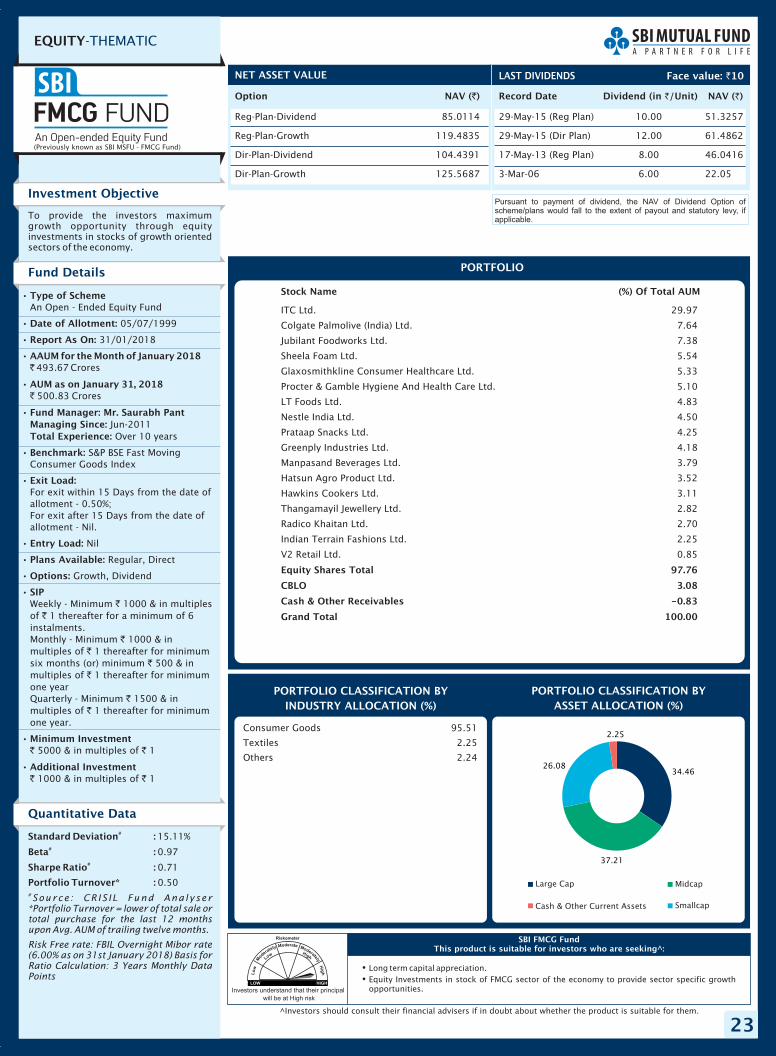
23
EQUITY-THEMATIC
Option NAV ( )`
Reg-Plan-Dividend 85.0114
Reg-Plan-Growth 119.4835
Dir-Plan-Dividend 104.4391
Dir-Plan-Growth 125.5687
NET ASSET VALUE
Record Date Dividend NAV ( )`(in /Unit)`
29-May-15 (Reg Plan) 10.00 51.3257
29-May-15 (Dir Plan) 12.00 61.4862
17-May-13 (Reg Plan) 8.00 46.0416
3-Mar-06 6.00 22.05
LAST DIVIDENDS
�
�
Long term capital appreciation.Equity Investments in stock of FMCG sector of the economy to provide sector specific growthopportunities.
SBI FMCG FundThis product is suitable for investors who are seeking^:
Face value: 10`
Investment Objective
Quantitative Data
To provide the investors maximumgrowth opportunity through equityinvestments in stocks of growth orientedsectors of the economy.
Fund Details
Standard Deviation :
Beta :
Sharpe Ratio :
Portfolio Turnover* :
#
#
#
15.11%
0.97
0.71
0.50#Source : CR IS IL Fund Analyser
*Portfolio Turnover = lower of total sale ortotal purchase for the last 12 monthsupon Avg. AUM of trailing twelve months.
Risk Free rate: FBIL Overnight Mibor rate(6.00% as on 31st January 2018) Basis forRatio Calculation: 3 Years Monthly DataPoints
PORTFOLIO CLASSIFICATION BY(%)ASSET ALLOCATION
Consumer Goods 95.51
Textiles 2.25
Others 2.24
•
•
•
•
•
•
•
•
•
•
•
•
•
•
Type of Scheme
Date of Allotment:
Report As On:
AAUM for the Month of January 2018
AUM as on January 31, 2018
Fund Manager: Mr. Saurabh PantManaging Since:Total Experience:
Benchmark:
Exit Load:
Entry Load:
Plans Available:
Options:
SIP
Minimum Investment
Additional Investment
An Open - Ended Equity Fund
05/07/1999
31/01/2018
493.67 Crores
500.83 Crores
Jun-2011Over 10 years
S&P BSE Fast MovingConsumer Goods Index
For exit within 15 Days from the date ofallotment - 0.50%;For exit after 15 Days from the date ofallotment - Nil.
Nil
Regular, Direct
Growth, Dividend
Weekly - Minimum 1000 & in multiplesof 1 thereafter for a minimum of 6instalments.Monthly - Minimum 1000 & inmultiples of 1 thereafter for minimumsix months (or) minimum 500 & inmultiples of 1 thereafter for minimumone yearQuarterly - Minimum 1500 & inmultiples of 1 thereafter for minimumone year.
5000 & in multiples of 1
1000 & in multiples of 1
`
`
`
`
`
`
`
`
`
`
` `
` `
Large Cap Midcap
Cash & Other Current Assets Smallcap
PORTFOLIO CLASSIFICATION BYINDUSTRY ALLOCATION (%)
PORTFOLIO
ITC Ltd. 29.97
Colgate Palmolive (India) Ltd. 7.64
Jubilant Foodworks Ltd. 7.38
Sheela Foam Ltd. 5.54
Glaxosmithkline Consumer Healthcare Ltd. 5.33
Procter & Gamble Hygiene And Health Care Ltd. 5.10
LT Foods Ltd. 4.83
Nestle India Ltd. 4.50
Prataap Snacks Ltd. 4.25
Greenply Industries Ltd. 4.18
Manpasand Beverages Ltd. 3.79
Hatsun Agro Product Ltd. 3.52
Hawkins Cookers Ltd. 3.11
Thangamayil Jewellery Ltd. 2.82
Radico Khaitan Ltd. 2.70
Indian Terrain Fashions Ltd. 2.25
V2 Retail Ltd. 0.85
Equity Shares Total 97.76
CBLO 3.08
Cash & Other Receivables -0.83
Grand Total 100.00
Stock Name (%) Of Total AUM
(Previously known as SBI MSFU - FMCG Fund)
Investors understand that their principal
will be at High risk
^Investors should consult their financial advisers if in doubt about whether the product is suitable for them.
Pursuant to payment of dividend, the NAV of Dividend Option ofscheme/plans would fall to the extent of payout and statutory levy, ifapplicable.
34.46
37.21
26.08
2.25
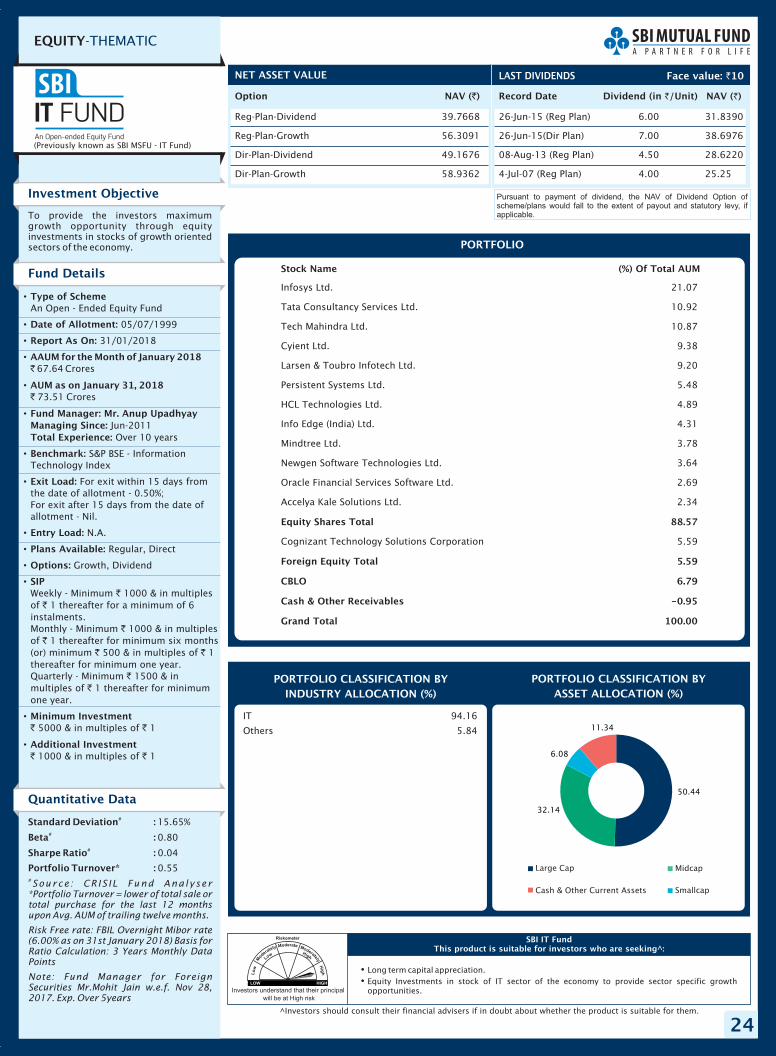
24
EQUITY-THEMATIC
Option NAV ( )`
Reg-Plan-Dividend 39.7668
Reg-Plan-Growth 56.3091
Dir-Plan-Dividend 49.1676
Dir-Plan-Growth 58.9362
NET ASSET VALUE
Record Date Dividend NAV ( )`(in /Unit)`
26-Jun-15 (Reg Plan) 6.00 31.8390
26-Jun-15(Dir Plan) 7.00 38.6976
08-Aug-13 (Reg Plan) 4.50 28.6220
4-Jul-07 (Reg Plan) 4.00 25.25
LAST DIVIDENDS
�
�
Long term capital appreciation.Equity Investments in stock of IT sector of the economy to provide sector specific growthopportunities.
SBI IT FundThis product is suitable for investors who are seeking^:
Face value: 10`
Investment Objective
Quantitative Data
To provide the investors maximumgrowth opportunity through equityinvestments in stocks of growth orientedsectors of the economy.
Fund Details
Standard Deviation :
Beta :
Sharpe Ratio :
Portfolio Turnover* :
#
#
#
15.65%
0.80
0.04
0.55#Source : CR IS IL Fund Analyser
*Portfolio Turnover = lower of total sale ortotal purchase for the last 12 monthsupon Avg. AUM of trailing twelve months.
Risk Free rate: FBIL Overnight Mibor rate(6.00% as on 31st January 2018) Basis forRatio Calculation: 3 Years Monthly DataPoints
Note: Fund Manager for ForeignSecurities Mr.Mohit Jain w.e.f. Nov 28,2017. Exp. Over 5years
PORTFOLIO CLASSIFICATION BY(%)ASSET ALLOCATION
IT 94.16
Others 5.84
Pursuant to payment of dividend, the NAV of Dividend Option ofscheme/plans would fall to the extent of payout and statutory levy, ifapplicable.
•
•
•
•
•
•
•
•
•
•
•
•
•
•
Type of Scheme
Date of Allotment:
Report As On:
AAUM for the Month of January 2018
AUM as on January 31, 2018
Fund Manager: Mr. Anup UpadhyayManaging Since:Total Experience:
Benchmark:
Exit Load:
Entry Load:
Plans Available:
Options:
SIP
Minimum Investment
Additional Investment
An Open - Ended Equity Fund
05/07/1999
31/01/2018
67.64 Crores
73.51 Crores
Jun-2011Over 10 years
S&P BSE - InformationTechnology Index
For exit within 15 days fromthe date of allotment - 0.50%;For exit after 15 days from the date ofallotment - Nil.
N.A.
Regular, Direct
Growth, Dividend
Weekly - Minimum 1000 & in multiplesof 1 thereafter for a minimum of 6instalments.Monthly - Minimum 1000 & in multiplesof 1 thereafter for minimum six months(or) minimum 500 & in multiples of 1thereafter for minimum one year.Quarterly - Minimum 1500 & inmultiples of 1 thereafter for minimumone year.
5000 & in multiples of 1
1000 & in multiples of 1
`
`
`
`
`
`
` `
`
`
` `
` `
PORTFOLIO CLASSIFICATION BYINDUSTRY ALLOCATION (%)
PORTFOLIO
Infosys Ltd. 21.07
Tata Consultancy Services Ltd. 10.92
Tech Mahindra Ltd. 10.87
Cyient Ltd. 9.38
Larsen & Toubro Infotech Ltd. 9.20
Persistent Systems Ltd. 5.48
HCL Technologies Ltd. 4.89
Info Edge (India) Ltd. 4.31
Mindtree Ltd. 3.78
Newgen Software Technologies Ltd. 3.64
Oracle Financial Services Software Ltd. 2.69
Accelya Kale Solutions Ltd. 2.34
Cognizant Technology Solutions Corporation 5.59
Equity Shares Total 88.57
Foreign Equity Total 5.59
CBLO 6.79
Cash & Other Receivables -0.95
Grand Total 100.00
Stock Name (%) Of Total AUM
(Previously known as SBI MSFU - IT Fund)
^Investors should consult their financial advisers if in doubt about whether the product is suitable for them.
Investors understand that their principal
will be at High risk
Large Cap Midcap
Cash & Other Current Assets Smallcap
50.44
32.14
6.08
11.34
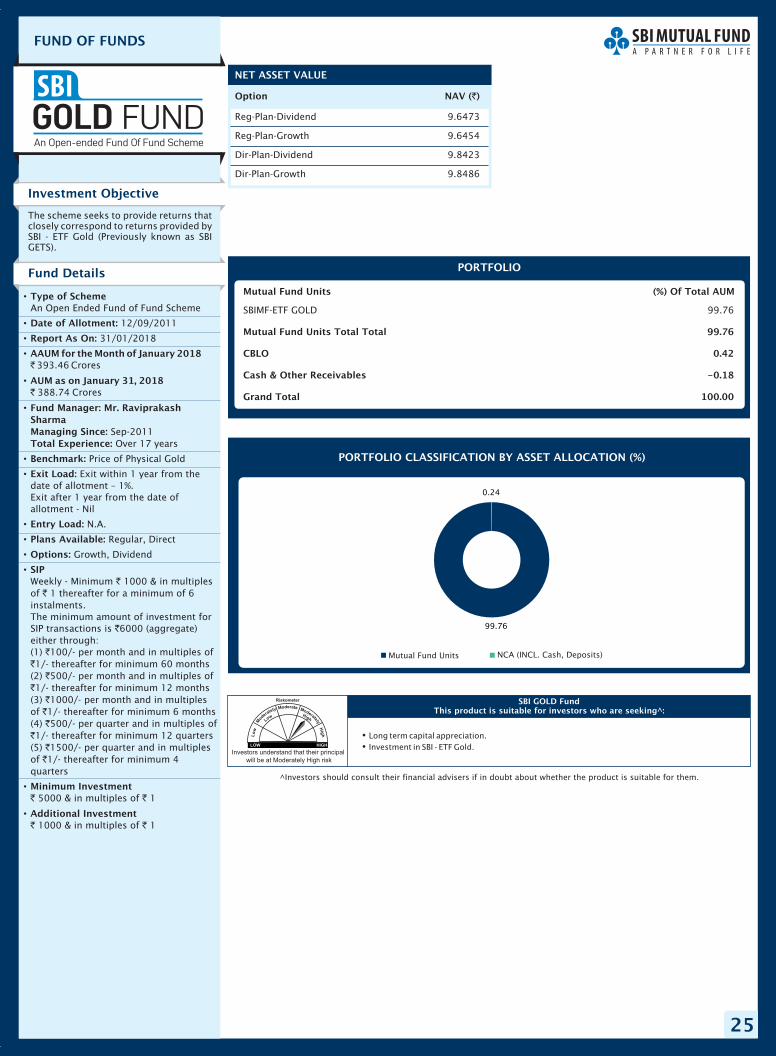
25
Option NAV ( )`
Reg-Plan-Dividend 9.6473
Reg-Plan-Growth 9.6454
Dir-Plan-Dividend 9.8423
Dir-Plan-Growth 9.8486
NET ASSET VALUE
Investors understand that their principal
will be at Moderately High risk
�
�
Long term capital appreciation.Investment in SBI - ETF Gold.
SBI GOLD FundThis product is suitable for investors who are seeking^:
Investment Objective
The scheme seeks to provide returns thatclosely correspond to returns provided bySBI - ETF Gold (Previously known as SBIGETS).
Fund Details
PORTFOLIO CLASSIFICATION BY (%)ASSET ALLOCATION
•
•
•
•
•
•
•
•
•
•
•
•
•
•
Type of Scheme
Date of Allotment:
Report As On:
AAUM for the Month of January 2018
AUM as on January 31, 2018
Fund Manager: Mr. RaviprakashSharmaManaging Since:Total Experience:
Benchmark:
Exit Load:
Entry Load:
Plans Available:
Options:
SIP
Minimum Investment
Additional Investment
An Open Ended Fund of Fund Scheme
12/09/2011
31/01/2018
393.46 Crores
388.74 Crores
Sep-2011Over 17 years
Price of Physical Gold
Exit within 1 year from thedate of allotment – 1%.Exit after 1 year from the date ofallotment - Nil
N.A.
Regular, Direct
Growth, Dividend
Weekly - Minimum 1000 & in multiplesof 1 thereafter for a minimum of 6instalments.The minimum amount of investment forSIP transactions is 6000 (aggregate)either through:(1) 100/- per month and in multiples of1/- thereafter for minimum 60 months
(2) 500/- per month and in multiples of1/- thereafter for minimum 12 months
(3) 1000/- per month and in multiplesof 1/- thereafter for minimum 6 months(4) 500/- per quarter and in multiples of1/- thereafter for minimum 12 quarters
(5) 1500/- per quarter and in multiplesof 1/- thereafter for minimum 4quarters
5000 & in multiples of 1
1000 & in multiples of 1
`
`
`
`
`
`
`
`
`
`
`
`
`
`
`
` `
` `
Mutual Fund Units NCA (INCL. Cash, Deposits)
PORTFOLIO
SBIMF-ETF GOLD 99.76
Mutual Fund Units Total Total 99.76
CBLO 0.42
Cash & Other Receivables -0.18
Grand Total 100.00
Mutual Fund Units (%) Of Total AUM
^Investors should consult their financial advisers if in doubt about whether the product is suitable for them.
FUND OF FUNDS
99.76
0.24
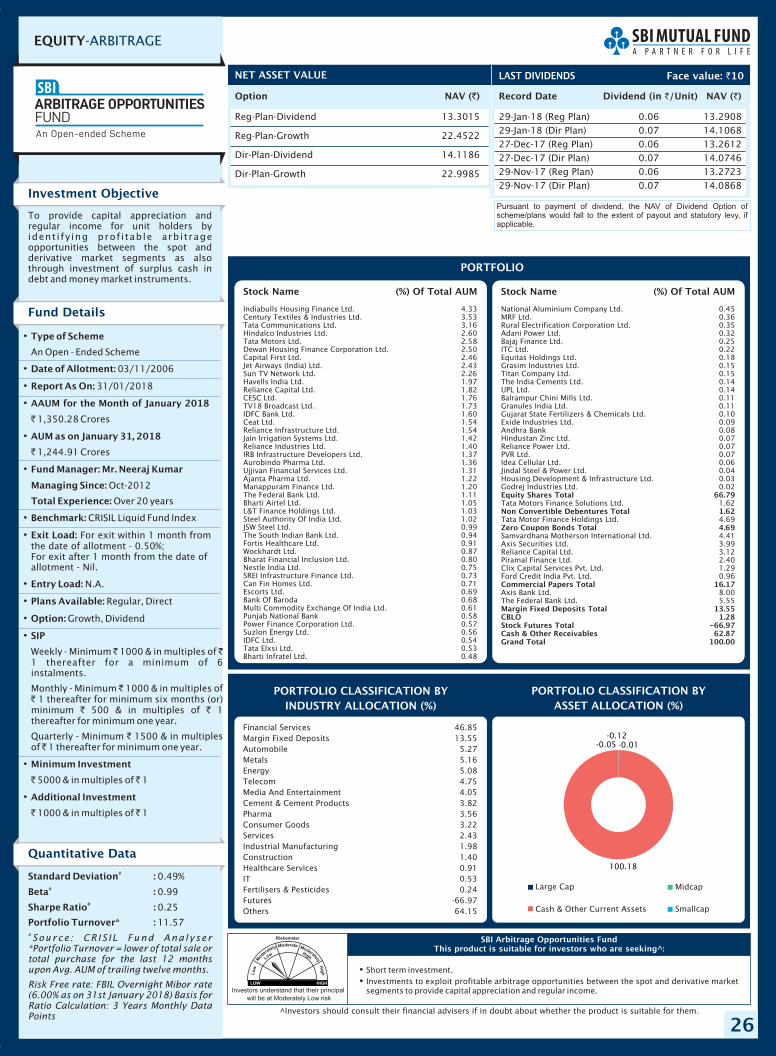
26
EQUITY-ARBITRAGE
Option NAV ( )`
Reg-Plan-Dividend 13.3015
Reg-Plan-Growth 22.4522
Dir-Plan-Dividend 14.1186
Dir-Plan-Growth 22.9985
NET ASSET VALUE
Record Date Dividend NAV ( )`(in /Unit)`
29-Jan-18 (Reg Plan) 0.06 13.290829-Jan-18 (Dir Plan) 0.07 14.106827-Dec-17 (Reg Plan) 0.06 13.261227-Dec-17 (Dir Plan) 0.07 14.074629-Nov-17 (Reg Plan) 0.06 13.272329-Nov-17 (Dir Plan) 0.07 14.0868
LAST DIVIDENDS
Investors understand that their principal
will be at Moderately Low risk
�
�
Short term investment.Investments to exploit profitable arbitrage opportunities between the spot and derivative marketsegments to provide capital appreciation and regular income.
SBI Arbitrage Opportunities FundThis product is suitable for investors who are seeking^:
Face value: 10`
Investment Objective
Quantitative Data
To provide capital appreciation andregular income for unit holders byident i fy ing prof i table arbi t rageopportunities between the spot andderivative market segments as alsothrough investment of surplus cash indebt and money market instruments.
Fund Details
Standard Deviation :
Beta :
Sharpe Ratio :
Portfolio Turnover* :
#
#
#
0.49%
0.99
0.25
11.57#Source : CR IS IL Fund Analyser
*Portfolio Turnover = lower of total sale ortotal purchase for the last 12 monthsupon Avg. AUM of trailing twelve months.
Risk Free rate: FBIL Overnight Mibor rate(6.00% as on 31st January 2018) Basis forRatio Calculation: 3 Years Monthly DataPoints
PORTFOLIO CLASSIFICATION BY(%)ASSET ALLOCATION
Financial Services 46.85Margin Fixed Deposits 13.55Automobile 5.27Metals 5.16Energy 5.08Telecom 4.75Media And Entertainment 4.05Cement & Cement Products 3.82Pharma 3.56Consumer Goods 3.22Services 2.43Industrial Manufacturing 1.98Construction 1.40Healthcare Services 0.91IT 0.53Fertilisers & Pesticides 0.24Futures -66.97Others 64.15
Pursuant to payment of dividend, the NAV of Dividend Option ofscheme/plans would fall to the extent of payout and statutory levy, ifapplicable.
•
•
•
•
•
•
•
•
•
•
•
•
•
•
Type of Scheme
Date of Allotment:
Report As On:
AAUM for the Month of January 2018
AUM as on January 31, 2018
Fund Manager: Mr. Neeraj Kumar
Managing Since:
Total Experience:
Benchmark:
Exit Load:
Entry Load:
Plans Available:
Option:
SIP
Minimum Investment
Additional Investment
An Open - Ended Scheme
03/11/2006
31/01/2018
1,350.28 Crores
1,244.91 Crores
Oct-2012
Over 20 years
CRISIL Liquid Fund Index
For exit within 1 month fromthe date of allotment - 0.50%;For exit after 1 month from the date ofallotment - Nil.
N.A.
Regular, Direct
Growth, Dividend
Weekly - Minimum 1000 & in multiples of1 thereafter for a minimum of 6instalments.
Monthly - Minimum 1000 & in multiples of1 thereafter for minimum six months (or)
minimum 500 & in multiples of 1thereafter for minimum one year.
Quarterly - Minimum 1500 & in multiplesof 1 thereafter for minimum one year.
5000 & in multiples of 1
1000 & in multiples of 1
`
`
` `
`
`
` `
`
`
` `
` `
PORTFOLIO CLASSIFICATION BYINDUSTRY ALLOCATION (%)
PORTFOLIO
Indiabulls Housing Finance Ltd. 4.33Century Textiles & Industries Ltd. 3.53Tata Communications Ltd. 3.16Hindalco Industries Ltd. 2.60Tata Motors Ltd. 2.58Dewan Housing Finance Corporation Ltd. 2.50Capital First Ltd. 2.46Jet Airways (India) Ltd. 2.43Sun TV Network Ltd. 2.26Havells India Ltd. 1.97Reliance Capital Ltd. 1.82CESC Ltd. 1.76TV18 Broadcast Ltd. 1.73IDFC Bank Ltd. 1.60Ceat Ltd. 1.54Reliance Infrastructure Ltd. 1.54Jain Irrigation Systems Ltd. 1.42Reliance Industries Ltd. 1.40IRB Infrastructure Developers Ltd. 1.37Aurobindo Pharma Ltd. 1.36Ujjivan Financial Services Ltd. 1.31Ajanta Pharma Ltd. 1.22Manappuram Finance Ltd. 1.20The Federal Bank Ltd. 1.11Bharti Airtel Ltd. 1.05L&T Finance Holdings Ltd. 1.03Steel Authority Of India Ltd. 1.02JSW Steel Ltd. 0.99The South Indian Bank Ltd. 0.94Fortis Healthcare Ltd. 0.91Wockhardt Ltd. 0.87Bharat Financial Inclusion Ltd. 0.80Nestle India Ltd. 0.75SREI Infrastructure Finance Ltd. 0.73Can Fin Homes Ltd. 0.71Escorts Ltd. 0.69Bank Of Baroda 0.68Multi Commodity Exchange Of India Ltd. 0.61Punjab National Bank 0.58Power Finance Corporation Ltd. 0.57Suzlon Energy Ltd. 0.56IDFC Ltd. 0.54Tata Elxsi Ltd. 0.53Bharti Infratel Ltd. 0.48
Stock Name (%) Of Total AUM Stock Name (%) Of Total AUM
National Aluminium Company Ltd. 0.45MRF Ltd. 0.36Rural Electrification Corporation Ltd. 0.35Adani Power Ltd. 0.32Bajaj Finance Ltd. 0.25ITC Ltd. 0.22Equitas Holdings Ltd. 0.18Grasim Industries Ltd. 0.15Titan Company Ltd. 0.15The India Cements Ltd. 0.14UPL Ltd. 0.14Balrampur Chini Mills Ltd. 0.11Granules India Ltd. 0.11Gujarat State Fertilizers & Chemicals Ltd. 0.10Exide Industries Ltd. 0.09Andhra Bank 0.08Hindustan Zinc Ltd. 0.07Reliance Power Ltd. 0.07PVR Ltd. 0.07Idea Cellular Ltd. 0.06Jindal Steel & Power Ltd. 0.04Housing Development & Infrastructure Ltd. 0.03Godrej Industries Ltd. 0.02
Tata Motors Finance Solutions Ltd. 1.62
Tata Motor Finance Holdings Ltd. 4.69
Samvardhana Motherson International Ltd. 4.41Axis Securities Ltd. 3.99Reliance Capital Ltd. 3.12Piramal Finance Ltd. 2.40Clix Capital Services Pvt. Ltd. 1.29Ford Credit India Pvt. Ltd. 0.96
Axis Bank Ltd. 8.00The Federal Bank Ltd. 5.55
Equity Shares Total 66.79
Non Convertible Debentures Total 1.62
Zero Coupon Bonds Total 4.69
Commercial Papers Total 16.17
Margin Fixed Deposits Total 13.55CBLO 1.28Stock Futures Total -66.97Cash & Other Receivables 62.87Grand Total 100.00
^Investors should consult their financial advisers if in doubt about whether the product is suitable for them.
Large Cap Midcap
Cash & Other Current Assets Smallcap
-0.05-0.12
-0.01
100.18
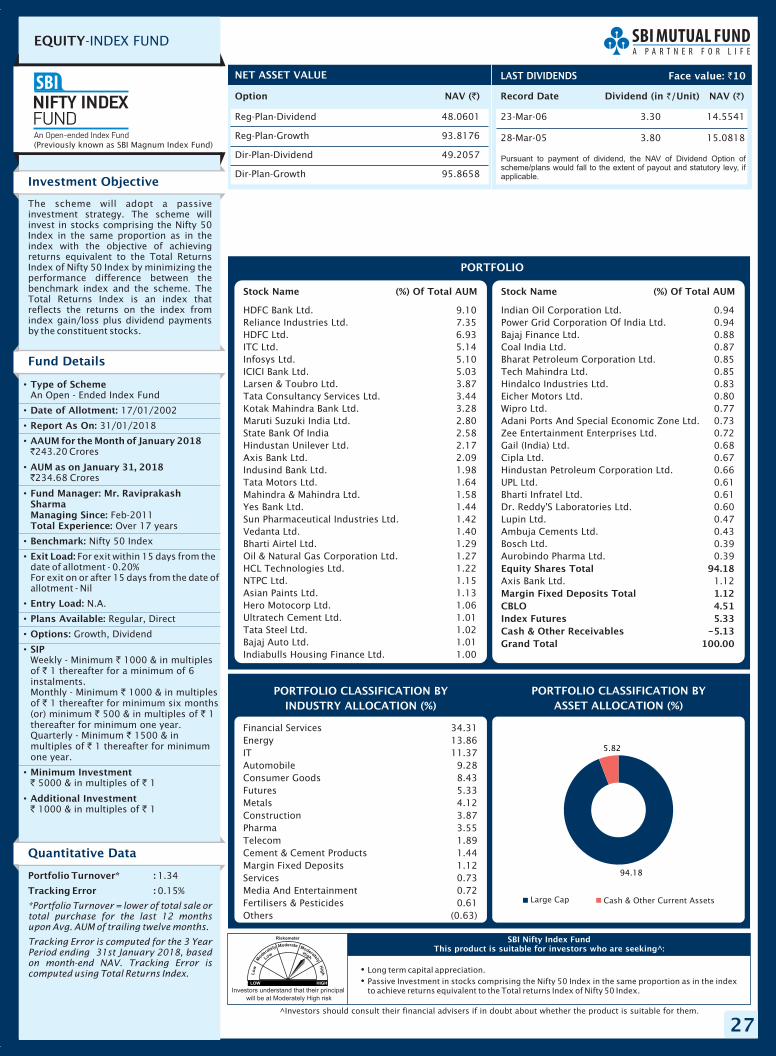
27
EQUITY-INDEX FUND
Option NAV ( )`
Reg-Plan-Dividend 48.0601
Reg-Plan-Growth 93.8176
Dir-Plan-Dividend 49.2057
Dir-Plan-Growth 95.8658
NET ASSET VALUE
Investors understand that their principal
will be at Moderately High risk
�
�
Long term capital appreciation.Passive Investment in stocks comprising the Nifty 50 Index in the same proportion as in the indexto achieve returns equivalent to the Total returns Index of Nifty 50 Index.
SBI Nifty Index FundThis product is suitable for investors who are seeking^:
Investment Objective
Quantitative Data
The scheme will adopt a passiveinvestment strategy. The scheme willinvest in stocks comprising the Nifty 50Index in the same proportion as in theindex with the objective of achievingreturns equivalent to the Total ReturnsIndex of Nifty 50 Index by minimizing theperformance difference between thebenchmark index and the scheme. TheTotal Returns Index is an index thatreflects the returns on the index fromindex gain/loss plus dividend paymentsby the constituent stocks.
Fund Details
Portfolio Turnover* :
Tracking Error :
1.34
0.15%
*Portfolio Turnover = lower of total sale ortotal purchase for the last 12 monthsupon Avg. AUM of trailing twelve months.
Tracking Error is computed for the 3 YearPeriod ending 31st January 2018, basedon month-end NAV. Tracking Error iscomputed using Total Returns Index.
PORTFOLIO CLASSIFICATION BY(%)ASSET ALLOCATION
Financial Services 34.31Energy 13.86IT 11.37Automobile 9.28Consumer Goods 8.43Futures 5.33Metals 4.12Construction 3.87Pharma 3.55Telecom 1.89Cement & Cement Products 1.44Margin Fixed Deposits 1.12Services 0.73Media And Entertainment 0.72Fertilisers & Pesticides 0.61Others (0.63)
•
•
•
•
•
•
•
•
•
•
•
•
•
•
Type of Scheme
Date of Allotment:
Report As On:
AAUM for the Month of January 2018
AUM as on January 31, 2018
Fund Manager: Mr. RaviprakashSharmaManaging Since:Total Experience:
Benchmark:
Exit Load:
Entry Load:
Plans Available:
Options:
SIP
Minimum Investment
Additional Investment
An Open - Ended Index Fund
17/01/2002
31/01/2018
243.20 Crores
234.68 Crores
Feb-2011Over 17 years
Nifty 50 Index
For exit within 15 days from thedate of allotment - 0.20%For exit on or after 15 days from the date ofallotment - Nil
N.A.
Regular, Direct
Growth, Dividend
Weekly - Minimum 1000 & in multiplesof 1 thereafter for a minimum of 6instalments.Monthly - Minimum 1000 & in multiplesof 1 thereafter for minimum six months(or) minimum 500 & in multiples of 1thereafter for minimum one year.Quarterly - Minimum 1500 & inmultiples of 1 thereafter for minimumone year.
5000 & in multiples of 1
1000 & in multiples of 1
`
`
`
`
`
`
` `
`
`
` `
` `
PORTFOLIO CLASSIFICATION BYINDUSTRY ALLOCATION (%)
PORTFOLIO
HDFC Bank Ltd. 9.10Reliance Industries Ltd. 7.35HDFC Ltd. 6.93ITC Ltd. 5.14Infosys Ltd. 5.10ICICI Bank Ltd. 5.03Larsen & Toubro Ltd. 3.87Tata Consultancy Services Ltd. 3.44Kotak Mahindra Bank Ltd. 3.28Maruti Suzuki India Ltd. 2.80State Bank Of India 2.58Hindustan Unilever Ltd. 2.17Axis Bank Ltd. 2.09Indusind Bank Ltd. 1.98Tata Motors Ltd. 1.64Mahindra & Mahindra Ltd. 1.58Yes Bank Ltd. 1.44Sun Pharmaceutical Industries Ltd. 1.42Vedanta Ltd. 1.40Bharti Airtel Ltd. 1.29Oil & Natural Gas Corporation Ltd. 1.27HCL Technologies Ltd. 1.22NTPC Ltd. 1.15Asian Paints Ltd. 1.13Hero Motocorp Ltd. 1.06Ultratech Cement Ltd. 1.01Tata Steel Ltd. 1.02Bajaj Auto Ltd. 1.01Indiabulls Housing Finance Ltd. 1.00
Stock Name (%) Of Total AUM Stock Name (%) Of Total AUM
Indian Oil Corporation Ltd. 0.94Power Grid Corporation Of India Ltd. 0.94Bajaj Finance Ltd. 0.88Coal India Ltd. 0.87Bharat Petroleum Corporation Ltd. 0.85Tech Mahindra Ltd. 0.85Hindalco Industries Ltd. 0.83Eicher Motors Ltd. 0.80Wipro Ltd. 0.77Adani Ports And Special Economic Zone Ltd. 0.73Zee Entertainment Enterprises Ltd. 0.72Gail (India) Ltd. 0.68Cipla Ltd. 0.67Hindustan Petroleum Corporation Ltd. 0.66UPL Ltd. 0.61Bharti Infratel Ltd. 0.61Dr. Reddy'S Laboratories Ltd. 0.60Lupin Ltd. 0.47Ambuja Cements Ltd. 0.43Bosch Ltd. 0.39Aurobindo Pharma Ltd. 0.39
Axis Bank Ltd. 1.12Equity Shares Total 94.18
Margin Fixed Deposits Total 1.12CBLO 4.51Index Futures 5.33Cash & Other Receivables -5.13Grand Total 100.00
(Previously known as SBI Magnum In Fund)dex
^Investors should consult their financial advisers if in doubt about whether the product is suitable for them.
Record Date Dividend NAV ( )`(in /Unit)`
23-Mar-06 3.30 14.5541
28-Mar-05 3.80 15.0818
LAST DIVIDENDS Face value: 10`
Pursuant to payment of dividend, the NAV of Dividend Option ofscheme/plans would fall to the extent of payout and statutory levy, ifapplicable.
Large Cap Cash & Other Current Assets
94.18
5.82
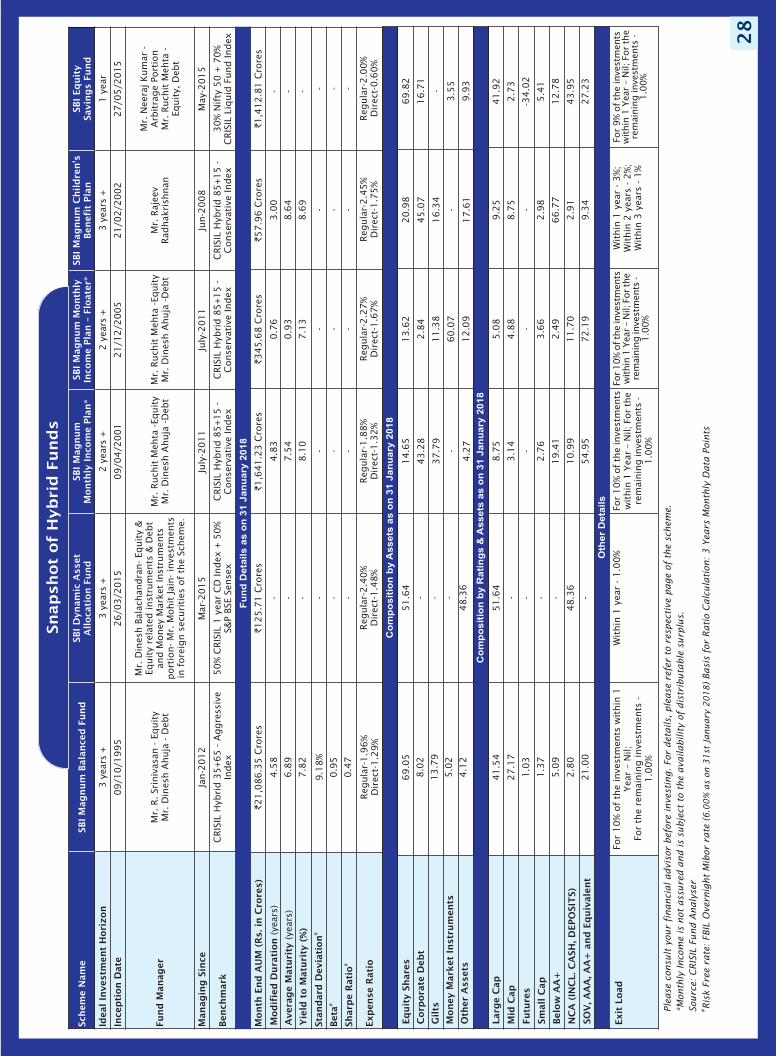
Month
End
AU
M (
Rs.
in C
rore
s)`21,0
86.3
5 C
rore
s`125.7
1 C
rore
s`1,6
41.2
3 C
rore
s`345.6
8 C
rore
s`57.9
6 C
rore
s`1,4
12.8
1 C
rore
s
Stand
ard
Dev
iati
on
#
Bet
a#
Sharp
e R
ati
o#
Exp
ense
Rati
oReg
ula
r-1.9
6%
Dir
ect-
1.2
9%
Reg
ula
r-2.4
0%
Dir
ect-
1.4
8%
Reg
ula
r-1.8
8%
Dir
ect-
1.3
2%
Reg
ula
r-2.2
7%
Dir
ect-
1.6
7%
Reg
ula
r-2.4
5%
Dir
ect-
1.7
5%
Reg
ula
r-2.0
0%
Dir
ect-
0.6
0%
Fu
nd
Deta
ils a
s o
n 3
1 J
an
uary
2018
4.5
8
6.8
9
7.8
2
9.1
8%
0.9
5
0.4
7
- - -
- - -
- - -
- - -
- - -
- - -
4.8
3
7.5
4
8.1
0
0.7
6
0.9
3
7.1
3
3.0
0
8.6
4
8.6
9
- - -
Schem
e N
am
eSB
I M
agnum
Bala
nce
d F
und
SBI
Dyn
am
ic A
sset
Alloca
tion F
und
SBI
Magnum
Month
ly I
nco
me
Pla
n*
SBI
Magnum
Month
lyIn
com
e Pla
n–
Floate
r*SB
I M
agnum
Child
ren's
Ben
efit
Pla
nSB
I Eq
uit
ySa
vin
gs
Fund
Idea
l In
ves
tmen
t H
ori
zon
3ye
ars
+3
year
s+
2ye
ars
+2
year
s+
3ye
ars
+1
year
Ince
pti
on D
ate
09/1
0/1
995
26/0
3/2
015
09/0
4/2
001
21/1
2/2
005
21/0
2/2
002
27/0
5/2
015
Fund
Manager
Mr.
R. Sr
iniv
asan
- E
quit
yM
r. D
ines
h A
huja
- D
ebt
Mr.
Din
esh B
alac
han
dra
n-
Equit
y &
Equit
y re
late
d inst
rum
ents
& D
ebt
and M
oney
Mar
ket
Inst
rum
ents
port
ion-
Mr.
Mohit
Ja i
n-
inve
stm
ents
in f
ore
ign s
ecuri
ties
of
the
Schem
e.
Mr.
Ruch
it M
ehta
-Equit
yM
r. D
ines
h A
huja
-Deb
tM
r. R
uch
it M
ehta
-Equit
yM
r. D
ines
h A
huja
-Deb
tM
r. R
ajee
vR
adhak
rish
nan
Mr.
Nee
raj K
um
ar -
Arb
itra
ge
Port
ion
Mr.
Ruch
it M
ehta
-Eq
uit
y, D
ebt
Managin
g S
ince
Jan-2
012
Mar
-20
15
July
-2011
July
-2011
Jun-2
008
May
-20
15
Ben
chm
ark
CRIS
IL H
ybri
d 3
5+65 -
Aggre
ssiv
eIn
dex
50%
CRIS
IL 1
yea
r C
D Index
+ 5
0%
S&P
BSE
Sense
xC
RIS
IL H
ybri
d 8
5+15 -
Conse
rvat
ive
Index
CRIS
IL H
ybri
d 8
5+15 -
Conse
rvat
ive
Index
CRIS
IL H
ybri
d 8
5+15 -
Conse
rvat
ive
Index
30%
Nif
ty 5
0 +
70%
CRIS
IL L
iquid
Fund Index
Co
mp
osit
ion
by R
ati
ng
s &
Assets
as o
n 3
1 J
an
uary
2018
Exit
Load
For
10%
of
the
inve
stm
ents
wit
hin
1Yea
r–
Nil;
For
the
rem
ainin
g inve
stm
ents
-1.0
0%
Wit
hin
1 y
ear
- 1.0
0%
For
10%
of
the
inve
stm
ents
wit
hin
1Yea
r–
Nil;
For
the
rem
ainin
gin
vest
men
ts-
1.0
0%
For10%
ofth
ein
vest
men
tsw
ithin
1Yea
r–
Nil;
Forth
ere
mai
nin
gin
vest
men
ts-
1.0
0%
Wit
hin
1 y
ear
- 3%
;W
ithin
2 y
ears
- 2
%;
Wit
hin
3 y
ears
- 1
%
For
9%
of
the
inve
stm
ents
wit
hin
1Yea
r–
Nil;
For
the
rem
ainin
gin
vest
men
ts-
1.0
0%
Larg
e C
ap
Mid
Cap
Futu
res
Small C
ap
Bel
ow
AA
+
NC
A (
INC
L. C
ASH
, DEPO
SIT
S)
SOV
, AA
A, A
A+
and
Eq
uiv
ale
nt
Oth
er
Deta
ils
Co
mp
osit
ion
by
Assets
as o
n 3
1 J
an
uary
2018
Eq
uit
y Sh
are
s
Corp
ora
te D
ebt
Gilts
Money
Mark
et I
nst
rum
ents
Oth
er A
sset
s
69.0
5
8.0
2
13.7
9
5.0
2
4.1
2
51.6
4
- - -
48.3
6
14.6
5
43.2
8
37.7
9
-
4.2
7
13.6
2
2.8
4
11.3
8
60.0
7
12.0
9
20.9
8
45.0
7
16.3
4
-
17.6
1
69.8
2
16.7
1
-
3.5
5
9.9
3
41.5
4
27.1
7
1.0
3
1.3
7
5.0
9
2.8
0
21.0
0
51.6
4
- - - -
48.3
6
-
8.7
5
3.1
4
-
2.7
6
19.4
1
10.9
9
54.9
5
5.0
8
4.8
8
-
3.6
6
2.4
9
11.7
0
72.1
9
9.2
5
8.7
5
-
2.9
8
66.7
7
2.9
1
9.3
4
41.9
2
2.7
3
-34.0
2
5.4
1
12.7
8
43.9
5
27.2
3
Ple
ase
consu
lt y
our
financia
l advis
or
befo
re invest
ing. For
deta
ils,
ple
ase
refe
r to
resp
ecti
ve p
age o
f th
e s
chem
e.
*Month
ly Incom
e is
not
ass
ure
d a
nd is
subje
ct
to t
he a
vailabilit
y o
f dis
trib
uta
ble
surp
lus.
Sourc
e: C
RIS
IL F
und A
naly
ser
Ris
k F
ree r
ate
: FBIL
Overn
ight
Mib
or
rate
()
Basi
s fo
r Rati
o C
alc
ula
tion: 3 Y
ears
Month
ly D
ata
Poin
ts#
6.0
0%
as
on 3
1st
January
20
18
Mod
ifie
d D
ura
tion
Aver
age
Matu
rity
Yie
ld t
o M
atu
rity
(%
)(yea
rs)
(yea
rs)
Snap
shot
of
Hyb
rid
Fund
s
28
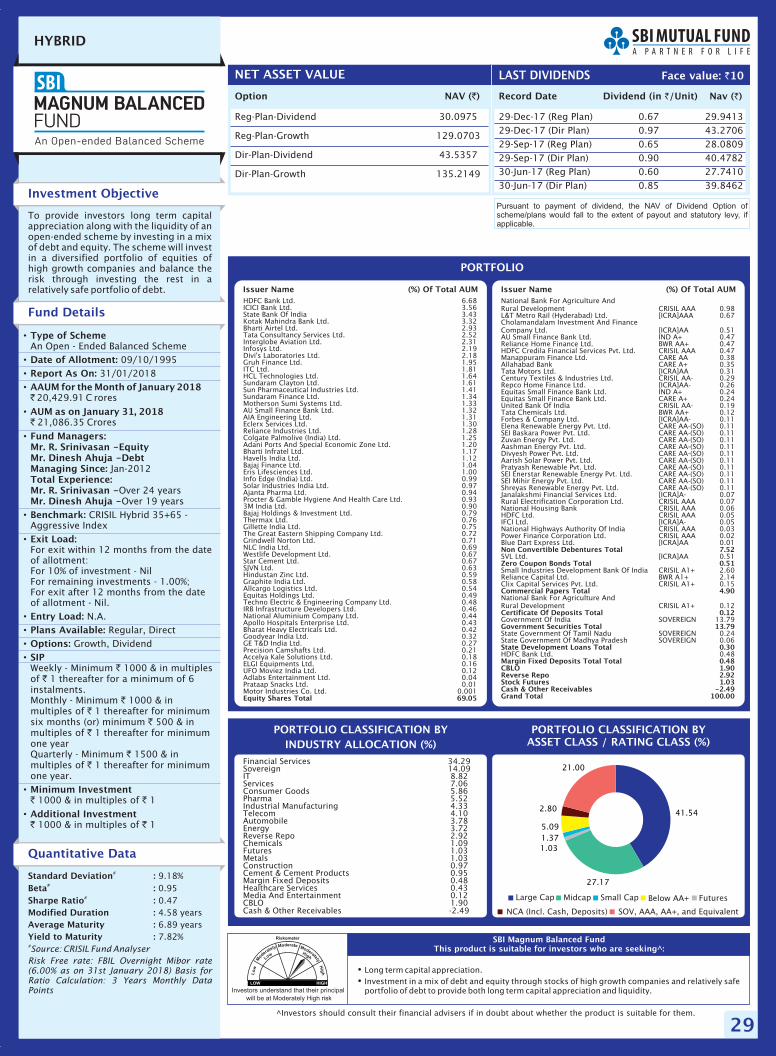
29
HYBRID
Option NAV ( )`
Reg-Plan-Dividend 30.0975
Reg-Plan-Growth 129.0703
Dir-Plan-Dividend 43.5357
Dir-Plan-Growth 135.2149
NET ASSET VALUE
Record Date Dividend Nav ( )`(in /Unit)`
29-Dec-17 (Reg Plan) 0.67 29.941329-Dec-17 (Dir Plan) 0.97 43.270629-Sep-17 (Reg Plan) 0.65 28.080929-Sep-17 (Dir Plan) 0.90 40.478230-Jun-17 (Reg Plan) 0.60 27.741030-Jun-17 (Dir Plan) 0.85 39.8462
LAST DIVIDENDS
Investors understand that their principal
will be at Moderately High risk
�
�
Long term capital appreciation.Investment in a mix of debt and equity through stocks of high growth companies and relatively safeportfolio of debt to provide both long term capital appreciation and liquidity.
SBI Magnum Balanced FundThis product is suitable for investors who are seeking^:
Face value: 10`
Investment Objective
Quantitative Data
To provide investors long term capitalappreciation along with the liquidity of anopen-ended scheme by investing in a mixof debt and equity. The scheme will investin a diversified portfolio of equities ofhigh growth companies and balance therisk through investing the rest in arelatively safe portfolio of debt.
Fund Details
Standard Deviation :Beta :Sharpe Ratio :
#
#
#
9.18%0.950.474.58Modified Duration :
Average Maturity :Yield to Maturity :
years6.89 years7.82%
#Source: CRISIL Fund Analyser
Risk Free rate: FBIL Overnight Mibor rate(6.00% as on 31st January 2018) Basis forRatio Calculation: 3 Years Monthly DataPoints
PORTFOLIO
HDFC Bank Ltd. 6.68ICICI Bank Ltd. 3.56State Bank Of India 3.43Kotak Mahindra Bank Ltd. 3.32Bharti Airtel Ltd. 2.93Tata Consultancy Services Ltd. 2.52Interglobe Aviation Ltd. 2.31Infosys Ltd. 2.19Divi's Laboratories Ltd. 2.18Gruh Finance Ltd. 1.95ITC Ltd. 1.81HCL Technologies Ltd. 1.64Sundaram Clayton Ltd. 1.61Sun Pharmaceutical Industries Ltd. 1.41Sundaram Finance Ltd. 1.34Motherson Sumi Systems Ltd. 1.33AU Small Finance Bank Ltd. 1.32AIA Engineering Ltd. 1.31Eclerx Services Ltd. 1.30Reliance Industries Ltd. 1.28Colgate Palmolive (India) Ltd. 1.25Adani Ports And Special Economic Zone Ltd. 1.20Bharti Infratel Ltd. 1.17Havells India Ltd. 1.12Bajaj Finance Ltd. 1.04Eris Lifesciences Ltd. 1.00Info Edge (India) Ltd. 0.99Solar Industries India Ltd. 0.97Ajanta Pharma Ltd. 0.94Procter & Gamble Hygiene And Health Care Ltd. 0.933M India Ltd. 0.90Bajaj Holdings & Investment Ltd. 0.79Thermax Ltd. 0.76Gillette India Ltd. 0.75The Great Eastern Shipping Company Ltd. 0.72Grindwell Norton Ltd. 0.71NLC India Ltd. 0.69Westlife Development Ltd. 0.67Star Cement Ltd. 0.67SJVN Ltd. 0.63Hindustan Zinc Ltd. 0.59Graphite India Ltd. 0.58Allcargo Logistics Ltd. 0.54Equitas Holdings Ltd. 0.49Techno Electric & Engineering Company Ltd. 0.48IRB Infrastructure Developers Ltd. 0.46National Aluminium Company Ltd. 0.44Apollo Hospitals Enterprise Ltd. 0.43Bharat Heavy Electricals Ltd. 0.42Goodyear India Ltd. 0.32GE T&D India Ltd. 0.27Precision Camshafts Ltd. 0.21Accelya Kale Solutions Ltd. 0.18ELGI Equipments Ltd. 0.16UFO Moviez India Ltd. 0.12Adlabs Entertainment Ltd. 0.04Prataap Snacks Ltd. 0.01Motor Industries Co. Ltd. 0.001Equity Shares Total 69.05
National Bank For Agriculture AndRural Development CRISIL AAA 0.98L&T Metro Rail (Hyderabad) Ltd. [ICRA]AAA 0.67Cholamandalam Investment And FinanceCompany Ltd. [ICRA]AA 0.51AU Small Finance Bank Ltd. IND A+ 0.47Reliance Home Finance Ltd. BWR AA+ 0.47HDFC Credila Financial Services Pvt. Ltd. CRISIL AAA 0.47Manappuram Finance Ltd. CARE AA 0.38Allahabad Bank CARE A+ 0.35Tata Motors Ltd. [ICRA]AA 0.31Century Textiles & Industries Ltd. CRISIL AA- 0.29Repco Home Finance Ltd. [ICRA]AA- 0.26Equitas Small Finance Bank Ltd. IND A+ 0.24Equitas Small Finance Bank Ltd. CARE A+ 0.24United Bank Of India CRISIL AA- 0.19Tata Chemicals Ltd. BWR AA+ 0.12Forbes & Company Ltd. [ICRA]AA- 0.11Elena Renewable Energy Pvt. Ltd. CARE AA-(SO) 0.11SEI Baskara Power Pvt. Ltd. CARE AA-(SO) 0.11Zuvan Energy Pvt. Ltd. CARE AA-(SO) 0.11Aashman Energy Pvt. Ltd. CARE AA-(SO) 0.11Divyesh Power Pvt. Ltd. CARE AA-(SO) 0.11Aarish Solar Power Pvt. Ltd. CARE AA-(SO) 0.11Pratyash Renewable Pvt. Ltd. CARE AA-(SO) 0.11SEI Enerstar Renewable Energy Pvt. Ltd. CARE AA-(SO) 0.11SEI Mihir Energy Pvt. Ltd. CARE AA-(SO) 0.11Shreyas Renewable Energy Pvt. Ltd. CARE AA-(SO) 0.11Janalakshmi Financial Services Ltd. [ICRA]A- 0.07Rural Electrification Corporation Ltd. CRISIL AAA 0.07National Housing Bank CRISIL AAA 0.06HDFC Ltd. CRISIL AAA 0.05IFCI Ltd. [ICRA]A- 0.05National Highways Authority Of India CRISIL AAA 0.03Power Finance Corporation Ltd. CRISIL AAA 0.02Blue Dart Express Ltd. [ICRA]AA 0.01
SVL Ltd. [ICRA]AA 0.51
Small Industries Development Bank Of India CRISIL A1+ 2.60Reliance Capital Ltd. BWR A1+ 2.14Clix Capital Services Pvt. Ltd. CRISIL A1+ 0.15
National Bank For Agriculture AndRural Development CRISIL A1+ 0.12
Government Of India SOVEREIGN 13.79
State Government Of Tamil Nadu SOVEREIGN 0.24State Government Of Madhya Pradesh SOVEREIGN 0.06
HDFC Bank Ltd. 0.48
Non Convertible Debentures Total 7.52
Zero Coupon Bonds Total 0.51
Commercial Papers Total 4.90
Certificate Of Deposits Total 0.12
Government Securities Total 13.79
State Development Loans Total 0.30
Margin Fixed Deposits Total Total 0.48CBLO 1.90Reverse Repo 2.92Stock Futures 1.03Cash & Other Receivables -2.49Grand Total 100.00
PORTFOLIO CLASSIFICATION BYASSET CLASS / RATING CLASS (%)
Financial Services 34.29Sovereign 14.09IT 8.82Services 7.06Consumer Goods 5.86Pharma 5.52Industrial Manufacturing 4.33Telecom 4.10Automobile 3.78Energy 3.72Reverse Repo 2.92Chemicals 1.09Futures 1.03Metals 1.03Construction 0.97Cement & Cement Products 0.95Margin Fixed Deposits 0.48Healthcare Services 0.43Media And Entertainment 0.12CBLO 1.90Cash & Other Receivables -2.49
Pursuant to payment of dividend, the NAV of Dividend Option ofscheme/plans would fall to the extent of payout and statutory levy, ifapplicable.
•
•
•
•
•
•
•
•
•
•
•
•
•
•
Type of Scheme
Date of Allotment:Report As On:AAUM for the Month of January 2018
AUM as on January 31, 2018
Fund Managers:Mr. R. Srinivasan -EquityMr. Dinesh Ahuja -DebtManaging Since:Total Experience:Mr. R. Srinivasan -Mr. Dinesh Ahuja -Benchmark:
Exit Load:
Entry Load:Plans Available:Options:SIP
Minimum Investment
Additional Investment
An Open - Ended Balanced Scheme09/10/1995
31/01/2018
20,429.91 C rores
21,086.35 Crores
Jan-2012
Over 24 yearsOver 19 years
CRISIL Hybrid 35+65 -Aggressive Index
For exit within 12 months from the dateof allotment:For 10% of investment - NilFor remaining investments - 1.00%;For exit after 12 months from the dateof allotment - Nil.
N.A.Regular, Direct
Growth, Dividend
Weekly - Minimum 1000 & in multiplesof 1 thereafter for a minimum of 6instalments.Monthly - Minimum 1000 & inmultiples of 1 thereafter for minimumsix months (or) minimum 500 & inmultiples of 1 thereafter for minimumone yearQuarterly - Minimum 1500 & inmultiples of 1 thereafter for minimumone year.
1000 & in multiples of 1
1000 & in multiples of 1
`
`
`
`
`
`
`
`
`
`
` `
` `
PORTFOLIO CLASSIFICATION BYINDUSTRY ALLOCATION (%)
Issuer Name (%) Of Total AUM Issuer Name (%) Of Total AUM
^Investors should consult their financial advisers if in doubt about whether the product is suitable for them.
NCA (Incl. Cash, Deposits) SOV, AAA, and EquivalentAA+,
Large Cap Midcap Small Cap Below AA+ Futures
41.54
27.17
1.031.375.09
2.80
21.00
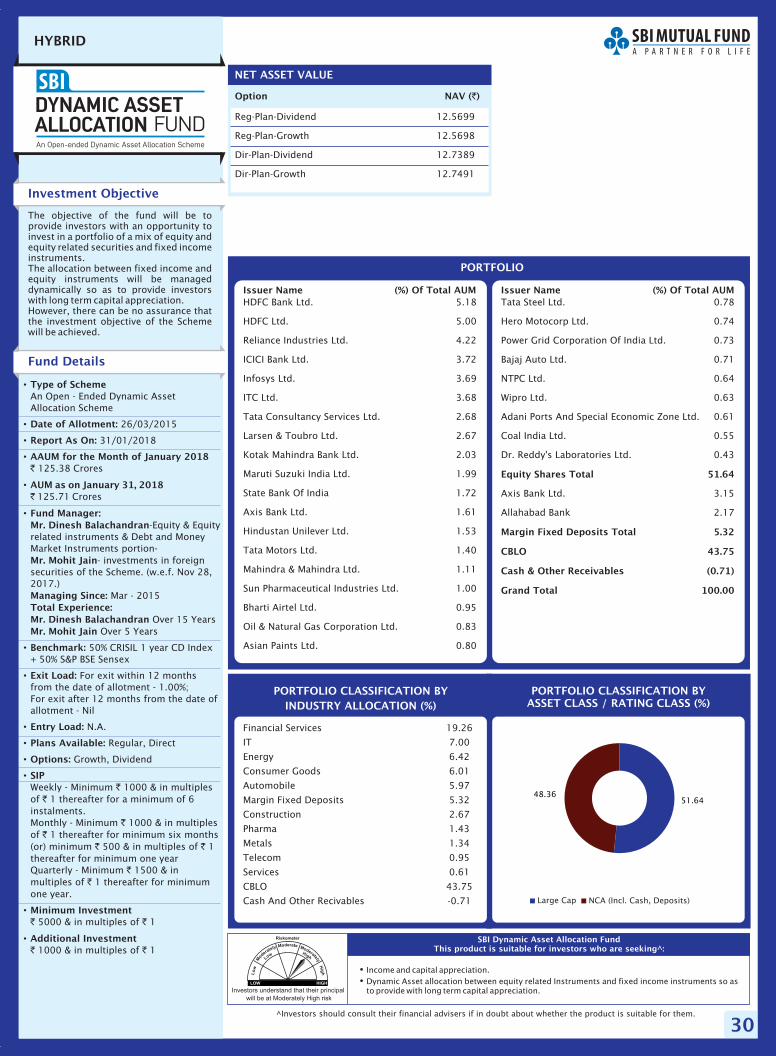
30
HYBRID
Option NAV ( )`
Reg-Plan-Dividend 12.5699
Reg-Plan-Growth 12.5698
Dir-Plan-Dividend 12.7389
Dir-Plan-Growth 12.7491
NET ASSET VALUE
Investors understand that their principal
will be at Moderately High risk
�
�
Income and capital appreciation.Dynamic Asset allocation between equity related Instruments and fixed income instruments so asto provide with long term capital appreciation.
SBI Dynamic Asset Allocation FundThis product is suitable for investors who are seeking^:
Investment Objective
The objective of the fund will be toprovide investors with an opportunity toinvest in a portfolio of a mix of equity andequity related securities and fixed incomeinstruments.The allocation between fixed income andequity instruments will be manageddynamically so as to provide investorswith long term capital appreciation.However, there can be no assurance thatthe investment objective of the Schemewill be achieved.
Fund Details
PORTFOLIO
HDFC Bank Ltd. 5.18
HDFC Ltd. 5.00
Reliance Industries Ltd. 4.22
ICICI Bank Ltd. 3.72
Infosys Ltd. 3.69
ITC Ltd. 3.68
Tata Consultancy Services Ltd. 2.68
Larsen & Toubro Ltd. 2.67
Kotak Mahindra Bank Ltd. 2.03
Maruti Suzuki India Ltd. 1.99
State Bank Of India 1.72
Axis Bank Ltd. 1.61
Hindustan Unilever Ltd. 1.53
Tata Motors Ltd. 1.40
Mahindra & Mahindra Ltd. 1.11
Sun Pharmaceutical Industries Ltd. 1.00
Bharti Airtel Ltd. 0.95
Oil & Natural Gas Corporation Ltd. 0.83
Asian Paints Ltd. 0.80
Tata Steel Ltd. 0.78
Hero Motocorp Ltd. 0.74
Power Grid Corporation Of India Ltd. 0.73
Bajaj Auto Ltd. 0.71
NTPC Ltd. 0.64
Wipro Ltd. 0.63
Adani Ports And Special Economic Zone Ltd. 0.61
Coal India Ltd. 0.55
Dr. Reddy's Laboratories Ltd. 0.43
Axis Bank Ltd. 3.15
Allahabad Bank 2.17
Equity Shares Total 51.64
Margin Fixed Deposits Total 5.32
CBLO 43.75
Cash & Other Receivables (0.71)
Grand Total 100.00
PORTFOLIO CLASSIFICATION BYASSET CLASS / RATING CLASS (%)
Financial Services 19.26
IT 7.00
Energy 6.42
Consumer Goods 6.01
Automobile 5.97
Margin Fixed Deposits 5.32
Construction 2.67
Pharma 1.43
Metals 1.34
Telecom 0.95
Services 0.61
CBLO 43.75
Cash And Other Recivables -0.71
•
•
•
•
•
•
•
•
•
•
•
•
•
•
Type of Scheme
Date of Allotment:
Report As On:
AAUM for the Month of January 2018
AUM as on January 31, 2018
Fund Manager:Mr. Dinesh Balachandran
Mr. Mohit Jain
Managing Since:Total Experience:Mr. Dinesh BalachandranMr. Mohit Jain
Benchmark:
Exit Load:
Entry Load:
Plans Available:
Options:
SIP
Minimum Investment
Additional Investment
An Open - Ended Dynamic AssetAllocation Scheme
26/03/2015
31/01/2018
125.38 Crores
125.71 Crores
-Equity & Equityrelated instruments & Debt and MoneyMarket Instruments portion-
- investments in foreignsecurities of the Scheme. (w.e.f. Nov 28,2017.)
Mar - 2015
Over 15 YearsOver 5 Years
50% CRISIL 1 year CD Index+ 50% S&P BSE Sensex
For exit within 12 monthsfrom the date of allotment - 1.00%;For exit after 12 months from the date ofallotment - Nil
N.A.
Regular, Direct
Growth, Dividend
Weekly - Minimum 1000 & in multiplesof 1 thereafter for a minimum of 6instalments.Monthly - Minimum 1000 & in multiplesof 1 thereafter for minimum six months(or) minimum 500 & in multiples of 1thereafter for minimum one yearQuarterly - Minimum 1500 & inmultiples of 1 thereafter for minimumone year.
5000 & in multiples of 1
1000 & in multiples of 1
`
`
`
`
`
`
` `
`
`
` `
` `
PORTFOLIO CLASSIFICATION BYINDUSTRY ALLOCATION (%)
Issuer Name (%) Of Total AUMIssuer Name (%) Of Total AUM
^Investors should consult their financial advisers if in doubt about whether the product is suitable for them.
Large Cap NCA (Incl. Cash, Deposits)
51.6448.36
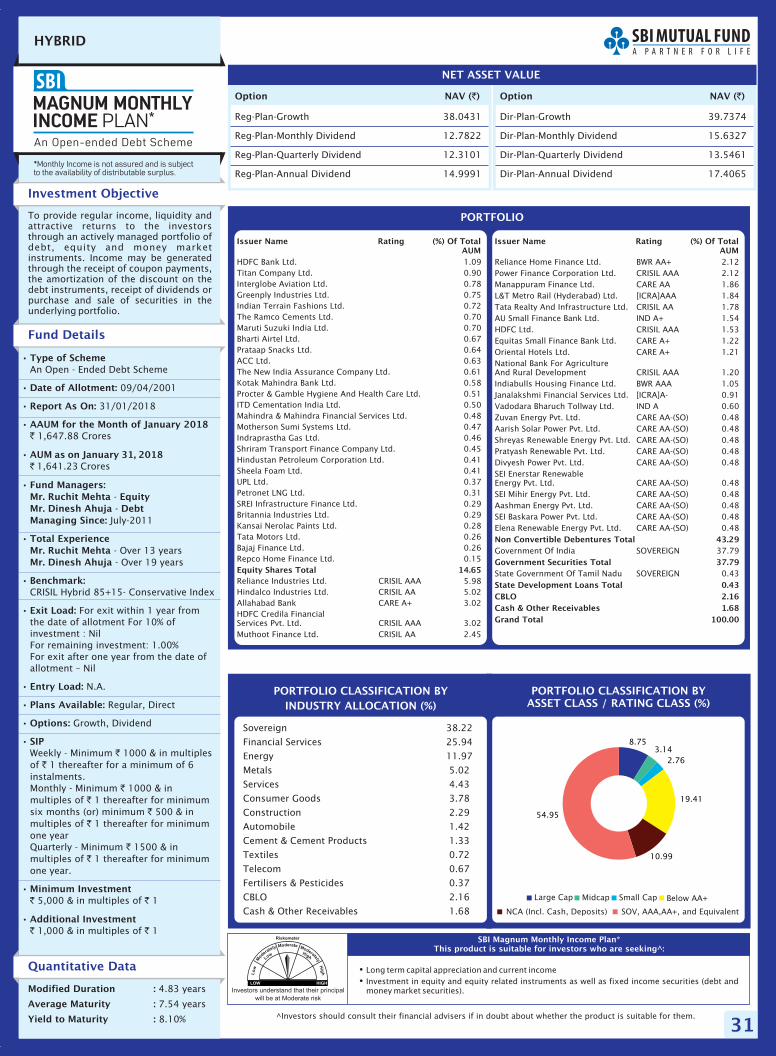
31
HYBRID
Option NAV ( )` Option NAV ( )`
Reg-Plan-Growth 38.0431
Reg-Plan-Monthly Dividend 12.7822
Reg-Plan-Quarterly Dividend 12.3101
Reg-Plan-Annual Dividend 14.9991
Dir-Plan-Growth 39.7374
Dir-Plan-Monthly Dividend 15.6327
Dir-Plan-Quarterly Dividend 13.5461
Dir-Plan-Annual Dividend 17.4065
NET ASSET VALUE
Investors understand that their principal
will be at Moderate risk
�
�
Long term capital appreciation and current incomeInvestment in equity and equity related instruments as well as fixed income securities (debt andmoney market securities).
SBI Magnum Monthly Income Plan*This product is suitable for investors who are seeking^:
Investment Objective
Quantitative Data
To provide regular income, liquidity andattractive returns to the investorsthrough an actively managed portfolio ofdebt, equity and money marketinstruments. Income may be generatedthrough the receipt of coupon payments,the amortization of the discount on thedebt instruments, receipt of dividends orpurchase and sale of securities in theunderlying portfolio.
Fund Details
Modified Duration :
Average Maturity :
Yield to Maturity :
4.83
7.54 years
8.10%
years
PORTFOLIO CLASSIFICATION BYASSET CLASS / RATING CLASS (%)
Sovereign 38.22
Financial Services 25.94
Energy 11.97
Metals 5.02
Services 4.43
Consumer Goods 3.78
Construction 2.29
Automobile 1.42
Cement & Cement Products 1.33
Textiles 0.72
Telecom 0.67
Fertilisers & Pesticides 0.37
CBLO 2.16
Cash & Other Receivables 1.68
•
•
•
•
•
•
•
•
•
•
•
•
•
•
•
Type of Scheme
Date of Allotment:
Report As On:
AAUM for the Month of January 2018
AUM as on January 31, 2018
Fund Managers:Mr. Ruchit Mehta EquityMr. Dinesh Ahuja DebtManaging Since:
Total ExperienceMr. Ruchit MehtaMr. Dinesh Ahuja
Benchmark:
Exit Load:
Entry Load:
Plans Available:
Options:
SIP
Minimum Investment
Additional Investment
An Open - Ended Debt Scheme
09/04/2001
31/01/2018
1,647.88 Crores
1,641.23 Crores
--
July-2011
- Over 13 years- Over 19 years
CRISIL Hybrid 85+15- Conservative Index
For exit within 1 year fromthe date of allotment For 10% ofinvestment : NilFor remaining investment: 1.00%For exit after one year from the date ofallotment – Nil
N.A.
Regular, Direct
Growth, Dividend
Weekly - Minimum 1000 & in multiplesof 1 thereafter for a minimum of 6instalments.Monthly - Minimum 1000 & inmultiples of 1 thereafter for minimumsix months (or) minimum 500 & inmultiples of 1 thereafter for minimumone yearQuarterly - Minimum 1500 & inmultiples of 1 thereafter for minimumone year.
5,000 & in multiples of 1
1,000 & in multiples of 1
`
`
`
`
`
`
`
`
`
`
` `
` `
PORTFOLIO CLASSIFICATION BYINDUSTRY ALLOCATION (%)
PORTFOLIO
HDFC Bank Ltd. 1.09Titan Company Ltd. 0.90Interglobe Aviation Ltd. 0.78Greenply Industries Ltd. 0.75Indian Terrain Fashions Ltd. 0.72The Ramco Cements Ltd. 0.70Maruti Suzuki India Ltd. 0.70Bharti Airtel Ltd. 0.67Prataap Snacks Ltd. 0.64ACC Ltd. 0.63The New India Assurance Company Ltd. 0.61Kotak Mahindra Bank Ltd. 0.58Procter & Gamble Hygiene And Health Care Ltd. 0.51ITD Cementation India Ltd. 0.50Mahindra & Mahindra Financial Services Ltd. 0.48Motherson Sumi Systems Ltd. 0.47Indraprastha Gas Ltd. 0.46Shriram Transport Finance Company Ltd. 0.45Hindustan Petroleum Corporation Ltd. 0.41Sheela Foam Ltd. 0.41UPL Ltd. 0.37Petronet LNG Ltd. 0.31SREI Infrastructure Finance Ltd. 0.29Britannia Industries Ltd. 0.29Kansai Nerolac Paints Ltd. 0.28Tata Motors Ltd. 0.26Bajaj Finance Ltd. 0.26Repco Home Finance Ltd. 0.15
Reliance Industries Ltd. CRISIL AAA 5.98Hindalco Industries Ltd. CRISIL AA 5.02Allahabad Bank CARE A+ 3.02HDFC Credila FinancialServices Pvt. Ltd. CRISIL AAA 3.02Muthoot Finance Ltd. CRISIL AA 2.45
Equity Shares Total 14.65
Reliance Home Finance Ltd. BWR AA+ 2.12Power Finance Corporation Ltd. CRISIL AAA 2.12Manappuram Finance Ltd. CARE AA 1.86L&T Metro Rail (Hyderabad) Ltd. [ICRA]AAA 1.84Tata Realty And Infrastructure Ltd. CRISIL AA 1.78AU Small Finance Bank Ltd. IND A+ 1.54HDFC Ltd. CRISIL AAA 1.53Equitas Small Finance Bank Ltd. CARE A+ 1.22Oriental Hotels Ltd. CARE A+ 1.21National Bank For AgricultureAnd Rural Development CRISIL AAA 1.20Indiabulls Housing Finance Ltd. BWR AAA 1.05Janalakshmi Financial Services Ltd. [ICRA]A- 0.91Vadodara Bharuch Tollway Ltd. IND A 0.60Zuvan Energy Pvt. Ltd. CARE AA-(SO) 0.48Aarish Solar Power Pvt. Ltd. CARE AA-(SO) 0.48Shreyas Renewable Energy Pvt. Ltd. CARE AA-(SO) 0.48Pratyash Renewable Pvt. Ltd. CARE AA-(SO) 0.48Divyesh Power Pvt. Ltd. CARE AA-(SO) 0.48SEI Enerstar RenewableEnergy Pvt. Ltd. CARE AA-(SO) 0.48SEI Mihir Energy Pvt. Ltd. CARE AA-(SO) 0.48Aashman Energy Pvt. Ltd. CARE AA-(SO) 0.48SEI Baskara Power Pvt. Ltd. CARE AA-(SO) 0.48Elena Renewable Energy Pvt. Ltd. CARE AA-(SO) 0.48
Government Of India SOVEREIGN 37.79
State Government Of Tamil Nadu SOVEREIGN 0.43
Non Convertible Debentures Total 43.29
Government Securities Total 37.79
State Development Loans Total 0.43CBLO 2.16Cash & Other Receivables 1.68Grand Total 100.00
Issuer Name Rating (%) Of TotalAUM
Issuer Name Rating (%) Of TotalAUM
^Investors should consult their financial advisers if in doubt about whether the product is suitable for them.
NCA (Incl. Cash, Deposits) SOV, AAA, and EquivalentAA+,
Large Cap Midcap Small Cap Below AA+
8.753.14
2.76
19.41
10.99
54.95
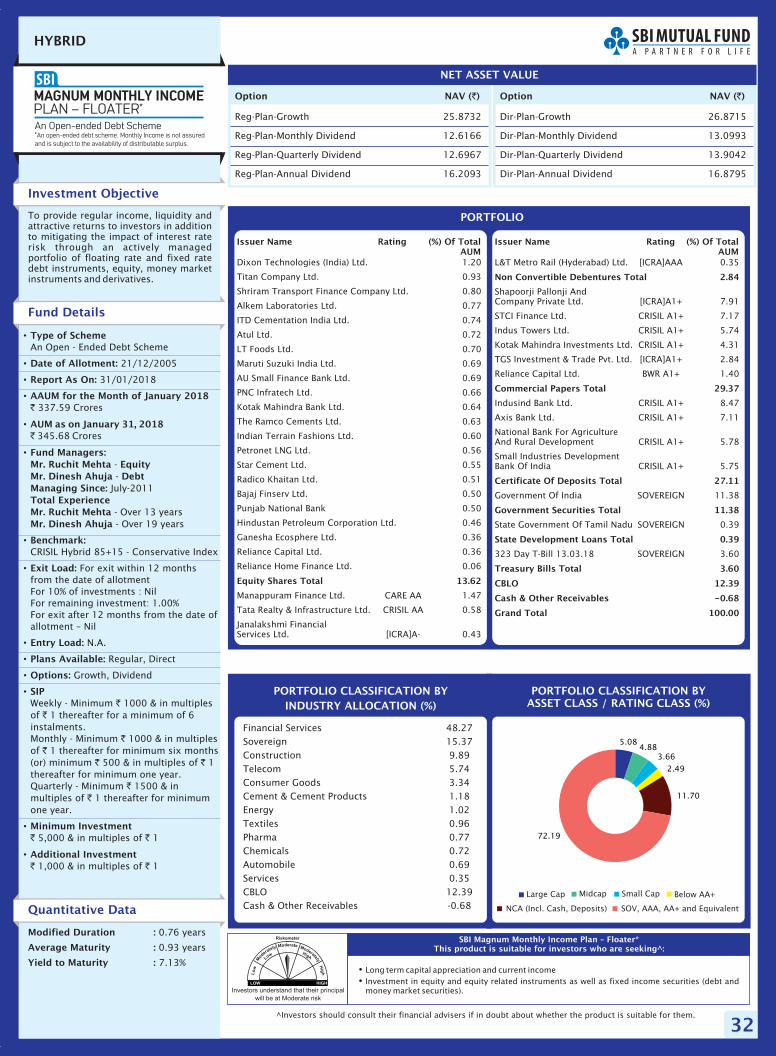
23.15
14.16
29.09
17.75
15.86
32
HYBRID
Option NAV ( )` Option NAV ( )`
Reg-Plan-Growth 25.8732
Reg-Plan-Monthly Dividend 12.6166
Reg-Plan-Quarterly Dividend 12.6967
Reg-Plan-Annual Dividend 16.2093
Dir-Plan-Growth 26.8715
Dir-Plan-Monthly Dividend 13.0993
Dir-Plan-Quarterly Dividend 13.9042
Dir-Plan-Annual Dividend 16.8795
NET ASSET VALUE
�
�
Long term capital appreciation and current incomeInvestment in equity and equity related instruments as well as fixed income securities (debt andmoney market securities).
SBI Magnum Monthly Income Plan – Floater*This product is suitable for investors who are seeking^:
Investment Objective
Quantitative Data
To provide regular income, liquidity andattractive returns to investors in additionto mitigating the impact of interest raterisk through an actively managedportfolio of floating rate and fixed ratedebt instruments, equity, money marketinstruments and derivatives.
Fund Details
Modified Duration :
Average Maturity :
Yield to Maturity :
0.76
0.93 years
7.13%
years
PORTFOLIO CLASSIFICATION BYASSET CLASS / RATING CLASS (%)
Financial Services 48.27Sovereign 15.37Construction 9.89Telecom 5.74Consumer Goods 3.34Cement & Cement Products 1.18Energy 1.02Textiles 0.96Pharma 0.77Chemicals 0.72Automobile 0.69Services 0.35CBLO 12.39Cash & Other Receivables -0.68
•
•
•
•
•
•
•
•
•
•
•
•
•
•
Type of Scheme
Date of Allotment:
Report As On:
AAUM for the Month of January 2018
AUM as on January 31, 2018
Fund Managers:Mr. Ruchit Mehta EquityMr. Dinesh Ahuja DebtManaging Since:Total ExperienceMr. Ruchit MehtaMr. Dinesh Ahuja
Benchmark:
Exit Load:
Entry Load:
Plans Available:
Options:
SIP
Minimum Investment
Additional Investment
An Open - Ended Debt Scheme
21/12/2005
31/01/2018
337.59 Crores
345.68 Crores
--
July-2011
- Over 13 years- Over 19 years
CRISIL Hybrid 85+15 - Conservative Index
For exit within 12 monthsfrom the date of allotmentFor 10% of investments : NilFor remaining investment: 1.00%For exit after 12 months from the date ofallotment – Nil
N.A.
Regular, Direct
Growth, Dividend
Weekly - Minimum 1000 & in multiplesof 1 thereafter for a minimum of 6instalments.Monthly - Minimum 1000 & in multiplesof 1 thereafter for minimum six months(or) minimum 500 & in multiples of 1thereafter for minimum one year.Quarterly - Minimum 1500 & inmultiples of 1 thereafter for minimumone year.
5,000 & in multiples of 1
1,000 & in multiples of 1
`
`
`
`
`
`
` `
`
`
` `
` `
PORTFOLIO CLASSIFICATION BYINDUSTRY ALLOCATION (%)
PORTFOLIO
Dixon Technologies (India) Ltd. 1.20
Titan Company Ltd. 0.93
Shriram Transport Finance Company Ltd. 0.80
Alkem Laboratories Ltd. 0.77
ITD Cementation India Ltd. 0.74
Atul Ltd. 0.72
LT Foods Ltd. 0.70
Maruti Suzuki India Ltd. 0.69
AU Small Finance Bank Ltd. 0.69
PNC Infratech Ltd. 0.66
Kotak Mahindra Bank Ltd. 0.64
The Ramco Cements Ltd. 0.63
Indian Terrain Fashions Ltd. 0.60
Petronet LNG Ltd. 0.56
Star Cement Ltd. 0.55
Radico Khaitan Ltd. 0.51
Bajaj Finserv Ltd. 0.50
Punjab National Bank 0.50
Hindustan Petroleum Corporation Ltd. 0.46
Ganesha Ecosphere Ltd. 0.36
Reliance Capital Ltd. 0.36
Reliance Home Finance Ltd. 0.06
Manappuram Finance Ltd. CARE AA 1.47
Tata Realty & Infrastructure Ltd. CRISIL AA 0.58
Janalakshmi FinancialServices Ltd. [ICRA]A- 0.43
Equity Shares Total 13.62
L&T Metro Rail (Hyderabad) Ltd. [ICRA]AAA 0.35
Shapoorji Pallonji AndCompany Private Ltd. [ICRA]A1+ 7.91
STCI Finance Ltd. CRISIL A1+ 7.17
Indus Towers Ltd. CRISIL A1+ 5.74
Kotak Mahindra Investments Ltd. CRISIL A1+ 4.31
TGS Investment & Trade Pvt. Ltd. [ICRA]A1+ 2.84
Reliance Capital Ltd. BWR A1+ 1.40
Indusind Bank Ltd. CRISIL A1+ 8.47
Axis Bank Ltd. CRISIL A1+ 7.11
National Bank For AgricultureAnd Rural Development CRISIL A1+ 5.78
Small Industries DevelopmentBank Of India CRISIL A1+ 5.75
Government Of India SOVEREIGN 11.38
State Government Of Tamil Nadu SOVEREIGN 0.39
323 Day T-Bill 13.03.18 SOVEREIGN 3.60
Non Convertible Debentures Total 2.84
Commercial Papers Total 29.37
Certificate Of Deposits Total 27.11
Government Securities Total 11.38
State Development Loans Total 0.39
Treasury Bills Total 3.60
CBLO 12.39
Cash & Other Receivables -0.68
Grand Total 100.00
Issuer Name Rating (%) Of TotalAUM
Issuer Name Rating (%) Of TotalAUM
^Investors should consult their financial advisers if in doubt about whether the product is suitable for them.
Investors understand that their principal
will be at Moderate risk
NCA (Incl. Cash, Deposits) SOV, AAA, AA+ and Equivalent
Large Cap Midcap Small Cap Below AA+
5.084.88
3.66
2.49
11.70
72.19
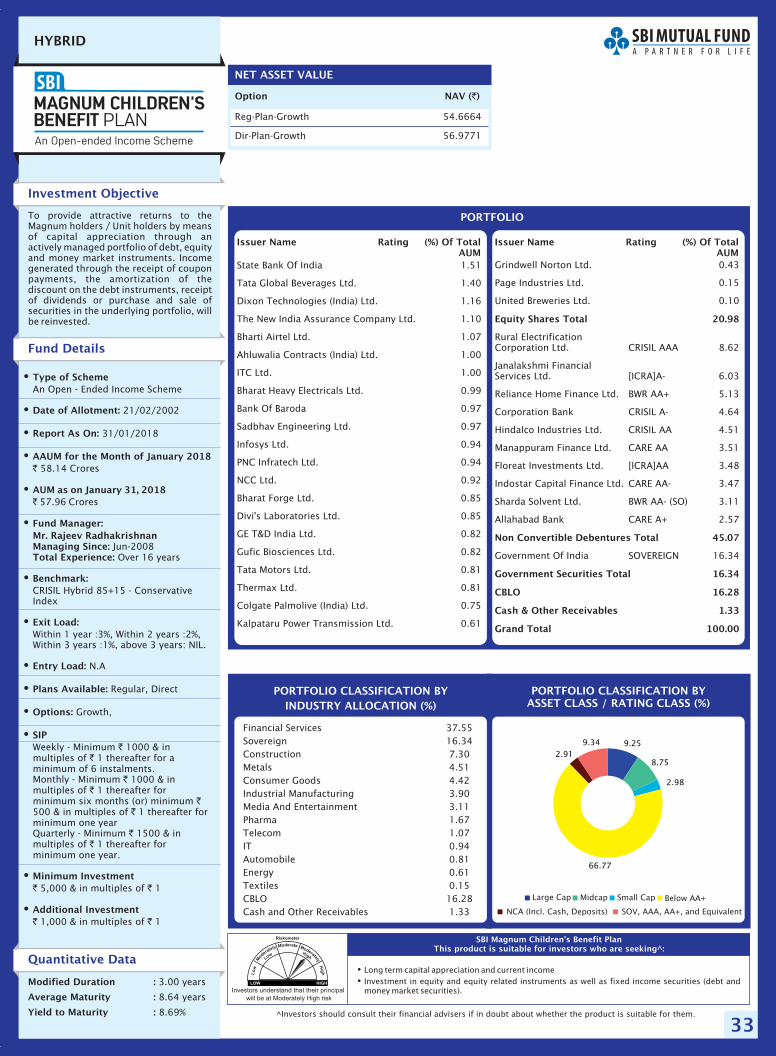
33
HYBRID
Option NAV ( )`
Reg-Plan-Growth 54.6664
Dir-Plan-Growth 56.9771
NET ASSET VALUE
Investors understand that their principal
will be at Moderately High risk
�
�
Long term capital appreciation and current incomeInvestment in equity and equity related instruments as well as fixed income securities (debt andmoney market securities).
SBI Magnum Children's Benefit PlanThis product is suitable for investors who are seeking^:
Investment Objective
Quantitative Data
To provide attractive returns to theMagnum holders / Unit holders by meansof capital appreciation through anactively managed portfolio of debt, equityand money market instruments. Incomegenerated through the receipt of couponpayments, the amortization of thediscount on the debt instruments, receiptof dividends or purchase and sale ofsecurities in the underlying portfolio, willbe reinvested.
Fund Details
Modified Duration :
Average Maturity :
Yield to Maturity :
3.00
8.64 years
8.69%
years
PORTFOLIO CLASSIFICATION BYASSET CLASS / RATING CLASS (%)
Financial Services 37.55Sovereign 16.34Construction 7.30Metals 4.51Consumer Goods 4.42Industrial Manufacturing 3.90Media And Entertainment 3.11Pharma 1.67Telecom 1.07IT 0.94Automobile 0.81Energy 0.61Textiles 0.15CBLO 16.28Cash and Other Receivables 1.33
•
•
•
•
•
•
•
•
•
•
•
•
•
•
Type of Scheme
Date of Allotment:
Report As On:
AAUM for the Month of January 2018
AUM as on January 31, 2018
Fund Manager:Mr. Rajeev RadhakrishnanManaging Since:Total Experience:
Benchmark:
Exit Load:
Entry Load:
Plans Available:
Options:
SIP
Minimum Investment
Additional Investment
An Open - Ended Income Scheme
21/02/2002
31/01/2018
58.14 Crores
57.96 Crores
Jun-2008Over 16 years
CRISIL Hybrid 85+15 - ConservativeIndex
Within 1 year :3%, Within 2 years :2%,Within 3 years :1%, above 3 years: NIL.
N.A
Regular, Direct
Growth,
Weekly - Minimum 1000 & inmultiples of 1 thereafter for aminimum of 6 instalments.Monthly - Minimum 1000 & inmultiples of 1 thereafter forminimum six months (or) minimum500 & in multiples of 1 thereafter forminimum one yearQuarterly - Minimum 1500 & inmultiples of 1 thereafter forminimum one year.
5,000 & in multiples of 1
1,000 & in multiples of 1
`
`
`
`
`
`
`
`
`
`
` `
` `
PORTFOLIO CLASSIFICATION BYINDUSTRY ALLOCATION (%)
PORTFOLIO
State Bank Of India 1.51
Tata Global Beverages Ltd. 1.40
Dixon Technologies (India) Ltd. 1.16
The New India Assurance Company Ltd. 1.10
Bharti Airtel Ltd. 1.07
Ahluwalia Contracts (India) Ltd. 1.00
ITC Ltd. 1.00
Bharat Heavy Electricals Ltd. 0.99
Bank Of Baroda 0.97
Sadbhav Engineering Ltd. 0.97
Infosys Ltd. 0.94
PNC Infratech Ltd. 0.94
NCC Ltd. 0.92
Bharat Forge Ltd. 0.85
Divi's Laboratories Ltd. 0.85
GE T&D India Ltd. 0.82
Gufic Biosciences Ltd. 0.82
Tata Motors Ltd. 0.81
Thermax Ltd. 0.81
Colgate Palmolive (India) Ltd. 0.75
Kalpataru Power Transmission Ltd. 0.61
Issuer Name Rating (%) Of TotalAUM
Issuer Name Rating (%) Of TotalAUM
Grindwell Norton Ltd. 0.43
Page Industries Ltd. 0.15
United Breweries Ltd. 0.10
Rural ElectrificationCorporation Ltd. CRISIL AAA 8.62
Janalakshmi FinancialServices Ltd. [ICRA]A- 6.03
Reliance Home Finance Ltd. BWR AA+ 5.13
Corporation Bank CRISIL A- 4.64
Hindalco Industries Ltd. CRISIL AA 4.51
Manappuram Finance Ltd. CARE AA 3.51
Floreat Investments Ltd. [ICRA]AA 3.48
Indostar Capital Finance Ltd. CARE AA- 3.47
Sharda Solvent Ltd. BWR AA- (SO) 3.11
Allahabad Bank CARE A+ 2.57
Government Of India SOVEREIGN 16.34
Equity Shares Total 20.98
Non Convertible Debentures Total 45.07
Government Securities Total 16.34
CBLO 16.28
Cash & Other Receivables 1.33
Grand Total 100.00
^Investors should consult their financial advisers if in doubt about whether the product is suitable for them.
NCA (Incl. Cash, Deposits) SOV, AAA, and EquivalentAA+,
Large Cap Midcap Small Cap Below AA+
9.25
8.75
2.98
66.77
2.919.34
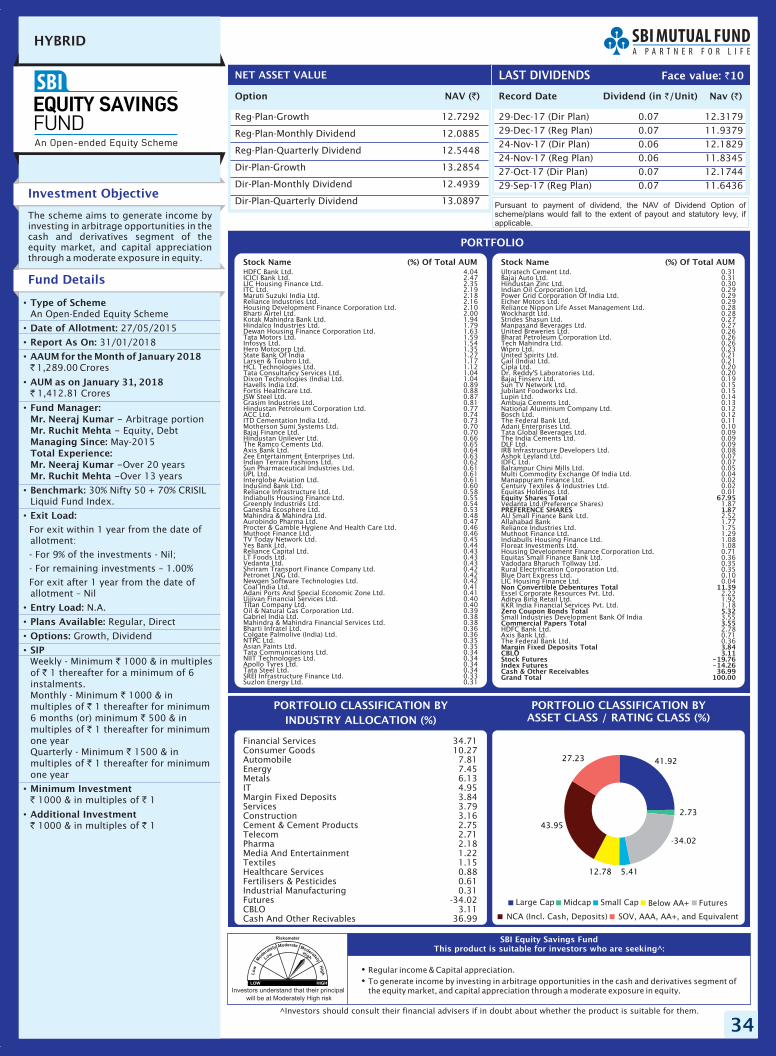
34
HYBRID
Investors understand that their principal
will be at Moderately High risk
�
�
Regular income & Capital appreciation.To generate income by investing in arbitrage opportunities in the cash and derivatives segment ofthe equity market, and capital appreciation through a moderate exposure in equity.
SBI Equity Savings FundThis product is suitable for investors who are seeking^:
Investment Objective
The scheme aims to generate income byinvesting in arbitrage opportunities in thecash and derivatives segment of theequity market, and capital appreciationthrough a moderate exposure in equity.
Fund Details
PORTFOLIO CLASSIFICATION BYASSET CLASS / RATING CLASS (%)
Financial Services 34.71Consumer Goods 10.27Automobile 7.81Energy 7.45Metals 6.13IT 4.95Margin Fixed Deposits 3.84Services 3.79Construction 3.16Cement & Cement Products 2.75Telecom 2.71Pharma 2.18Media And Entertainment 1.22Textiles 1.15Healthcare Services 0.88Fertilisers & Pesticides 0.61Industrial Manufacturing 0.31Futures -34.02CBLO 3.11Cash And Other Recivables 36.99
•
•
•
•
•
•
•
•
•
•
•
•
•
•
Type of Scheme
Date of Allotment:
Report As On:
AAUM for the Month of January 2018
AUM as on January 31, 2018
Fund Manager:Mr. Neeraj Kumar -Mr. Ruchit Mehta -Managing Since:Total Experience:Mr. Neeraj Kumar -Mr. Ruchit Mehta -
Benchmark:
Exit Load:
Entry Load:
Plans Available:
Options:
SIP
Minimum Investment
Additional Investment
An Open-Ended Equity Scheme
27/05/2015
31/01/2018
1,289.00 Crores
1,412.81 Crores
Arbitrage portionEquity, Debt
May-2015
Over 20 yearsOver 13 years
30% Nifty 50 + 70% CRISILLiquid Fund Index.
For exit within 1 year from the date ofallotment:
- For 9% of the investments - Nil;
- For remaining investments – 1.00%
For exit after 1 year from the date ofallotment – Nil
N.A.
Regular, Direct
Growth, Dividend
Weekly - Minimum 1000 & in multiplesof 1 thereafter for a minimum of 6instalments.Monthly - Minimum 1000 & inmultiples of 1 thereafter for minimum6 months (or) minimum 500 & inmultiples of 1 thereafter for minimumone yearQuarterly - Minimum 1500 & inmultiples of 1 thereafter for minimumone year
1000 & in multiples of 1
1000 & in multiples of 1
`
`
`
`
`
`
`
`
`
`
` `
` `
PORTFOLIO CLASSIFICATION BYINDUSTRY ALLOCATION (%)
PORTFOLIO
HDFC Bank Ltd. 4.04ICICI Bank Ltd. 2.47LIC Housing Finance Ltd. 2.35ITC Ltd. 2.19Maruti Suzuki India Ltd. 2.18Reliance Industries Ltd. 2.16Housing Development Finance Corporation Ltd. 2.10Bharti Airtel Ltd. 2.00Kotak Mahindra Bank Ltd. 1.94Hindalco Industries Ltd. 1.79Dewan Housing Finance Corporation Ltd. 1.63Tata Motors Ltd. 1.59Infosys Ltd. 1.54Hero Motocorp Ltd. 1.35State Bank Of India 1.27Larsen & Toubro Ltd. 1.17HCL Technologies Ltd. 1.12Tata Consultancy Services Ltd. 1.04Dixon Technologies (India) Ltd. 1.04Havells India Ltd. 0.89Fortis Healthcare Ltd. 0.88JSW Steel Ltd. 0.87Grasim Industries Ltd. 0.81Hindustan Petroleum Corporation Ltd. 0.77ACC Ltd. 0.74ITD Cementation India Ltd. 0.73Motherson Sumi Systems Ltd. 0.70Bajaj Finance Ltd. 0.70Hindustan Unilever Ltd. 0.66The Ramco Cements Ltd. 0.65Axis Bank Ltd. 0.64Zee Entertainment Enterprises Ltd. 0.63Indian Terrain Fashions Ltd. 0.62Sun Pharmaceutical Industries Ltd. 0.61UPL Ltd. 0.61Interglobe Aviation Ltd. 0.61Indusind Bank Ltd. 0.60Reliance Infrastructure Ltd. 0.58Indiabulls Housing Finance Ltd. 0.55Greenply Industries Ltd. 0.54Ganesha Ecosphere Ltd. 0.53Mahindra & Mahindra Ltd. 0.48Aurobindo Pharma Ltd. 0.47Procter & Gamble Hygiene And Health Care Ltd. 0.46Muthoot Finance Ltd. 0.46TV Today Network Ltd. 0.45Yes Bank Ltd. 0.44Reliance Capital Ltd. 0.43LT Foods Ltd. 0.43Vedanta Ltd. 0.43Shriram Transport Finance Company Ltd. 0.42Petronet LNG Ltd. 0.42Newgen Software Technologies Ltd. 0.42Coal India Ltd. 0.41Adani Ports And Special Economic Zone Ltd. 0.41Ujjivan Financial Services Ltd. 0.40Titan Company Ltd. 0.40Oil & Natural Gas Corporation Ltd. 0.39Gabriel India Ltd. 0.38Mahindra & Mahindra Financial Services Ltd. 0.38Bharti Infratel Ltd. 0.36Colgate Palmolive (India) Ltd. 0.36NTPC Ltd. 0.35Asian Paints Ltd. 0.35Tata Communications Ltd. 0.34NIIT Technologies Ltd. 0.34Apollo Tyres Ltd. 0.34Tata Steel Ltd. 0.34SREI Infrastructure Finance Ltd. 0.33Suzlon Energy Ltd. 0.31
Stock Name (%) Of Total AUM Stock Name (%) Of Total AUMUltratech Cement Ltd. 0.31Bajaj Auto Ltd. 0.31Hindustan Zinc Ltd. 0.30Indian Oil Corporation Ltd. 0.29Power Grid Corporation Of India Ltd. 0.29Eicher Motors Ltd. 0.29Reliance Nippon Life Asset Management Ltd. 0.28Wockhardt Ltd. 0.28Strides Shasun Ltd. 0.27Manpasand Beverages Ltd. 0.27United Breweries Ltd. 0.26Bharat Petroleum Corporation Ltd. 0.26Tech Mahindra Ltd. 0.26Wipro Ltd. 0.23United Spirits Ltd. 0.21Gail (India) Ltd. 0.21Cipla Ltd. 0.20Dr. Reddy'S Laboratories Ltd. 0.20Bajaj Finserv Ltd. 0.19Sun TV Network Ltd. 0.15Jubilant Foodworks Ltd. 0.15Lupin Ltd. 0.14Ambuja Cements Ltd. 0.13National Aluminium Company Ltd. 0.12Bosch Ltd. 0.12The Federal Bank Ltd. 0.11Adani Enterprises Ltd. 0.10Tata Global Beverages Ltd. 0.09The India Cements Ltd. 0.09DLF Ltd. 0.09IRB Infrastructure Developers Ltd. 0.08Ashok Leyland Ltd. 0.07IDFC Ltd. 0.07Balrampur Chini Mills Ltd. 0.05Multi Commodity Exchange Of India Ltd. 0.04Manappuram Finance Ltd. 0.02Century Textiles & Industries Ltd. 0.02Equitas Holdings Ltd. 0.01
Vedanta Ltd.(Preference Shares) 1.87
AU Small Finance Bank Ltd. 2.52Allahabad Bank 1.77Reliance Industries Ltd. 1.75Muthoot Finance Ltd. 1.29Indiabulls Housing Finance Ltd. 1.08Floreat Investments Ltd. 1.08Housing Development Finance Corporation Ltd. 0.71Equitas Small Finance Bank Ltd. 0.36Vadodara Bharuch Tollway Ltd. 0.35Rural Electrification Corporation Ltd. 0.35Blue Dart Express Ltd. 0.10LIC Housing Finance Ltd. 0.04
Essel Corporate Resources Pvt. Ltd. 2.22Aditya Birla Retail Ltd. 1.92KKR India Financial Services Pvt. Ltd. 1.18
Small Industries Development Bank Of India 3.55
HDFC Bank Ltd. 2.78Axis Bank Ltd. 0.71The Federal Bank Ltd. 0.36
Equity Shares Total 67.95
PREFERENCE SHARES 1.87
Non Convertible Debentures Total 11.39
Zero Coupon Bonds Total 5.32
Commercial Papers Total 3.55
Margin Fixed Deposits Total 3.84CBLO 3.11Stock Futures -19.76Index Futures -14.26Cash & Other Receivables 36.99Grand Total 100.00
Option NAV ( )`
Reg-Plan-Growth 12.7292
Reg-Plan-Monthly Dividend 12.0885
Reg-Plan-Quarterly Dividend 12.5448
Dir-Plan-Growth 13.2854
Dir-Plan-Monthly Dividend 12.4939
Dir-Plan-Quarterly Dividend 13.0897
NET ASSET VALUE
^Investors should consult their financial advisers if in doubt about whether the product is suitable for them.
Record Date Dividend Nav ( )`(in /Unit)`
29-Dec-17 (Dir Plan) 0.07 12.317929-Dec-17 (Reg Plan) 0.07 11.937924-Nov-17 (Dir Plan) 0.06 12.182924-Nov-17 (Reg Plan) 0.06 11.834527-Oct-17 (Dir Plan) 0.07 12.174429-Sep-17 (Reg Plan) 0.07 11.6436
LAST DIVIDENDS Face value: 10`
Pursuant to payment of dividend, the NAV of Dividend Option ofscheme/plans would fall to the extent of payout and statutory levy, ifapplicable.
41.92
2.73
-34.02
5.4112.78
43.95
27.23
NCA (Incl. Cash, Deposits) SOV, AAA, and EquivalentAA+,
Large Cap Midcap Small Cap Below AA+ Futures
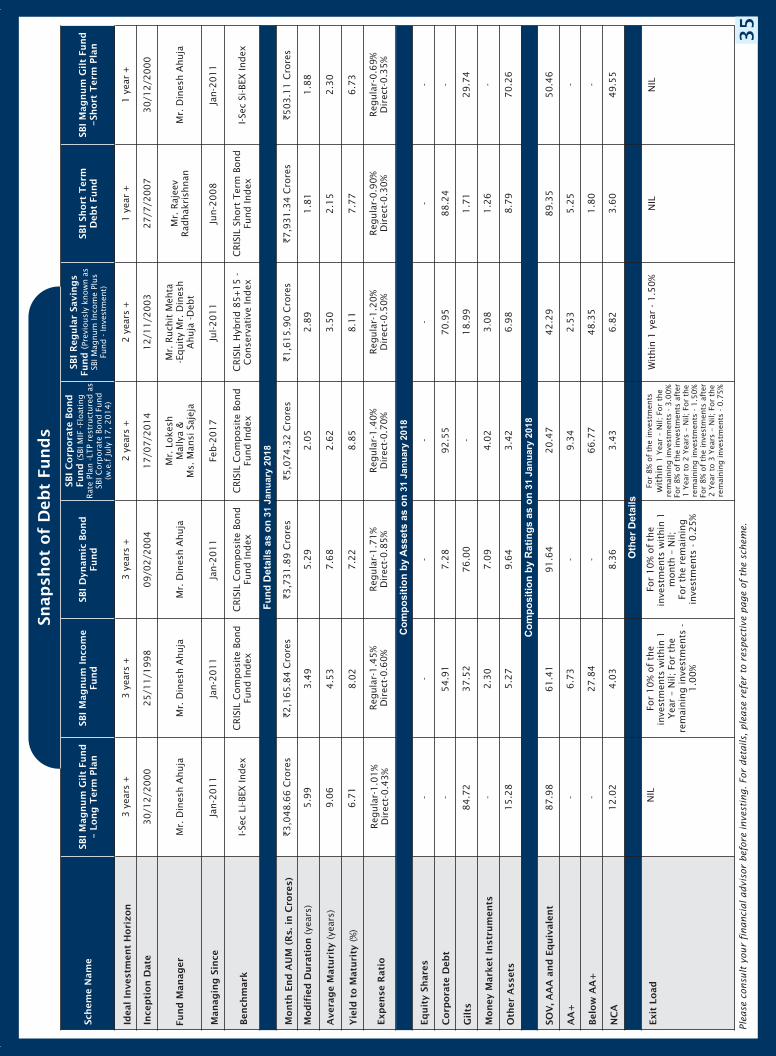
Co
mp
osit
ion
by R
ati
ng
s a
s o
n31 J
an
uary
2018
Wit
hin
1 y
ear
- 1.5
0%
NIL
NIL
SOV
, AA
A a
nd
Eq
uiv
ale
nt
AA
+
Bel
ow
AA
+
NC
A
Oth
er
Deta
ils
Exit
Load
NIL
Fu
nd
Deta
ils a
s o
n31 J
an
uary
2018
Month
End
AU
M (
Rs.
in C
rore
s)`3,0
48.6
6 C
rore
s`2,1
65.8
4 C
rore
s`3,7
31.8
9 C
rore
s`5,0
74.3
2 C
rore
s`1,6
15.9
0 C
rore
s`7,9
31.3
4 C
rore
s`503.1
1 C
rore
s
Exp
ense
Rati
oReg
ula
r-1.0
1%
Dir
ect-
0.4
3%
Reg
ula
r-1.4
5%
Dir
ect-
0.6
0%
Reg
ula
r-1.7
1%
Dir
ect-
0.8
5%
Reg
ula
r-1.4
0%
Dir
ect-
0.7
0%
Reg
ula
r-1.2
0%
Dir
ect-
0.5
0%
Reg
ula
r-0.9
0%
Dir
ect-
0.3
0%
Reg
ula
r-0.6
9%
Dir
ect-
0.3
5%
Mod
ifie
d D
ura
tion
Aver
age
Matu
rity
(yea
rs)
(yea
rs)
Yie
ld t
o M
atu
rity
(%)
5.9
9
9.0
6
6.7
1
3.4
9
4.5
3
8.0
2
5.2
9
7.6
8
7.2
2
2.0
5
2.6
2
8.8
5
2.8
9
3.5
0
8.1
1
1.8
1
2.1
5
7.7
7
1.8
8
2.3
0
6.7
3
Snap
shot
of
Fund
sD
ebt
Schem
e N
am
eSB
I M
agnum
Gilt
Fund
–Lo
ng T
erm
Pla
nSB
I M
agnum
Inco
me
Fund
SBI
Dyn
am
ic B
ond
Fund
SBI
Corp
ora
te B
ond
Fund
(SBI
MIF
-Fl
oat
ing
Rat
e Pl
an -
LTP
rest
ruct
ure
d a
sSB
I C
orp
ora
te B
ond F
und
(w.e
.f July
17, 2014)
SBI
Reg
ula
r Sa
vin
gs
Fund
( Pre
viousl
y kn
ow
n a
sSB
I M
agnum
Inco
me
Plus
Fund -
Inve
stm
ent)
SBI
Short
Ter
mD
ebt
Fund
SBI
Magnum
Gilt
Fund
-Sh
ort
Ter
m P
lan
Idea
l In
ves
tmen
t H
ori
zon
3ye
ars
+3
year
s+
3ye
ars
+2
year
s+
2ye
ars
+1
year
+1
year
+
Ince
pti
on D
ate
30/1
2/2
000
25/1
1/1
998
09/0
2/2
004
17/0
7/2
014
12/1
1/2
003
27/7
/2007
30/1
2/2
000
Fund
Manager
Mr.
Din
esh A
huja
Mr.
Din
esh A
huja
Mr.
Din
esh A
huja
Mr.
Loke
shM
ally
a&
Ms.
Man
si S
ajej
a
Mr.
Ruch
it M
ehta
-Equit
y M
r. D
ines
hA
huja
-Deb
t
Mr.
Raj
eev
Rad
hak
rish
nan
Mr.
Din
esh A
huja
Managin
g S
ince
Jan-2
011
Jan-2
011
Jan-2
011
Feb-2
017
Jul-2011
Jun-2
008
Jan-2
011
Ben
chm
ark
I-Se
c Li
-BEX
Index
CRIS
IL C
om
posi
te B
ond
Fund Index
CRIS
IL C
om
posi
te B
ond
Fund Index
CRIS
IL C
om
posi
te B
ond
Fund Index
CRIS
IL H
ybri
d 8
5+15 -
Conse
rvat
ive
Index
CRIS
IL S
hort
Ter
m B
ond
Fund Index
I-Se
c Si
-BEX
Index
Co
mp
osit
ion
by
Assets
as o
n31 J
an
uary
2018
Eq
uit
y Sh
are
s
Corp
ora
te D
ebt
Gilts
Money
Mark
et I
nst
rum
ents
Oth
er A
sset
s
- -
84.7
2
-
15.2
8
-
54.9
1
37.5
2
2.3
0
5.2
7
-
7.2
8
76.0
0
7.0
9
9.6
4
-
92.5
5
-
4.0
2
3.4
2
-
70.9
5
18.9
9
3.0
8
6.9
8
-
88.2
4
1.7
1
1.2
6
8.7
9
- -
29.7
4
-
70.2
6
87.9
8
- -
12.0
2
61.4
1
6.7
3
27.8
4
4.0
3
91.6
4
- -
8.3
6
20.4
7
9.3
4
66.7
7
3.4
3
42.2
9
2.5
3
48.3
5
6.8
2
89.3
5
5.2
5
1.8
0
3.6
0
50.4
6
- -
49.5
5
For
10%
of
the
inve
stm
ents
wit
hin
1Yea
r–
Nil;
For
the
rem
ainin
g inve
stm
ents
-1.0
0%
For
10%
of
the
inve
stm
ents
1m
onth
–N
il;Fo
r th
e re
mai
nin
gin
vest
men
ts -
0.2
5%
wit
hin
For
8%
of
the
inve
stm
ents
1 Y
ear
–N
il; F
or
the
rem
ainin
g inve
stm
ents
- 3
.00%
For
8%
of
the
inve
stm
ents
aft
er1 Y
ear
to 2
Yea
rs–
Nil;
For
the
rem
ainin
g inve
stm
ents
- 1
.50%
For
8%
of
the
inve
stm
ents
aft
er2 Y
ear
to 3
Yea
rs–
Nil;
For
the
rem
ainin
g inve
stm
ents
- 0
.75%
wit
hin
Ple
ase
consu
lt y
our
financia
l advis
or
befo
re invest
ing. For
deta
ils,
ple
ase
refe
r to
resp
ecti
ve p
age o
f th
e s
chem
e.
35
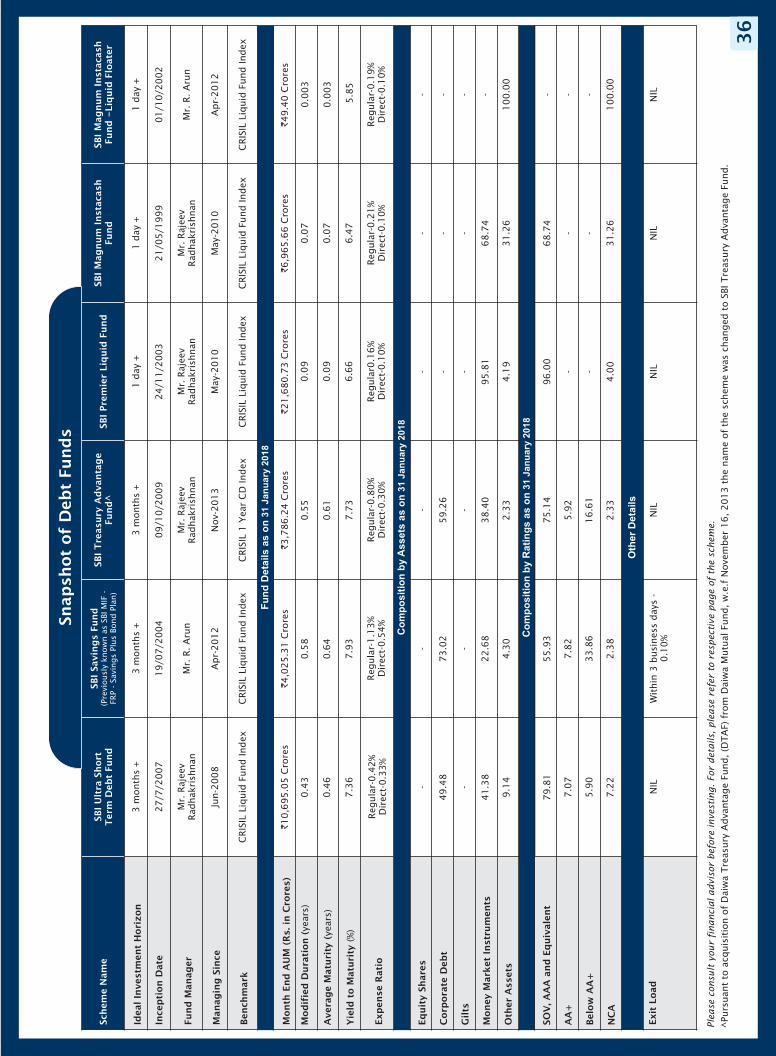
Co
mp
osit
ion
by R
ati
ng
s a
s o
n31 J
an
uary
2018
Exit
Load
NIL
Wit
hin
3 b
usi
nes
s day
s -
0.1
0%
NIL
NIL
NIL
NIL
SOV
, AA
A a
nd
Eq
uiv
ale
nt
AA
+
Bel
ow
AA
+
NC
A
Oth
er
Deta
ils
Fu
nd
Deta
ils a
s o
n31 J
an
uary
2018
Month
End
AU
M (
Rs.
in C
rore
s)`10,6
95.0
5 C
rore
s`4,0
25.3
1 C
rore
s`3,7
86.2
4 C
rore
s`21,6
80.7
3 C
rore
s`6,9
65.6
6 C
rore
s`49.4
0 C
rore
s
Exp
ense
Rati
oReg
ula
r-0.4
2%
Dir
ect-
0.3
3%
Reg
ula
r-1.1
3%
Dir
ect-
0.5
4%
Reg
ula
r-0.8
0%
Dir
ect-
0.3
0%
Reg
ula
r0.1
6%
Dir
ect-
0.1
0%
Reg
ula
r-0.2
1%
Dir
ect-
0.1
0%
Reg
ula
r-0.1
9%
Dir
ect-
0.1
0%
Mod
ifie
d D
ura
tion (
Aver
age
Matu
rity
Yie
ld t
o M
atu
rity
year
s)
year
s)
(%)
(
0.4
3
0.4
6
7.3
6
0.5
8
0.6
4
7.9
3
0.5
5
0.6
1
7.7
3
0.0
9
0.0
9
6.6
6
0.0
7
0.0
7
6.4
7
0.0
03
0.0
03
5.8
5
Schem
e N
am
eSB
I U
ltra
Short
Ter
m D
ebt
Fund
SBI
Savin
gs
Fund
( Pre
viousl
y kn
ow
n a
s SB
I M
IF -
FRP
- Sa
vings
Plus
Bond P
lan)
SBI
Tre
asu
ry A
dvanta
ge
Fund
^SB
I Pre
mie
r Li
quid
Fund
SBI
Magnum
Inst
aca
shFu
nd
SBI
Magnum
Inst
aca
shFu
nd
-Li
quid
Flo
ate
r
Idea
l In
ves
tmen
t H
ori
zon
3m
onth
s+
3m
onth
s+
3m
onth
s+
1day
+1
day
+1
day
+
Ince
pti
on D
ate
27/7
/2007
19/0
7/2
004
09/1
0/2
009
24/1
1/2
003
21/0
5/1
999
01/1
0/2
002
Fund
Manager
Mr.
Raj
eev
Rad
hak
rish
nan
Mr.
R. A
run
Mr.
Raj
eev
Rad
hak
rish
nan
Mr.
Raj
eev
Rad
hak
rish
nan
Mr.
Raj
eev
Rad
hak
rish
nan
Mr.
R. A
run
Managin
g S
ince
Jun-2
008
Apr-
2012
Nov-
2013
May
-20
10
May
-20
10
Apr-
2012
Ben
chm
ark
CRIS
IL L
iquid
Fund Index
CRIS
IL L
iquid
Fund Index
CRIS
IL 1
Yea
r C
D Index
CRIS
IL L
iquid
Fund Index
CRIS
IL L
iquid
Fund Index
CRIS
IL L
iquid
Fund Index
Co
mp
osit
ion
by
Assets
as o
n31 J
an
uary
2018
Eq
uit
y Sh
are
s
Corp
ora
te D
ebt
Gilts
Money
Mark
et I
nst
rum
ents
Oth
er A
sset
s
-
49.4
8
-
41.3
8
9.1
4
-
73.0
2
-
22.6
8
4.3
0
-
59.2
6
-
38.4
0
2.3
3
- - -
95.8
1
4.1
9
- - -
68.7
4
31.2
6
- - - -
100.0
0
79.8
1
7.0
7
5.9
0
7.2
2
55.9
3
7.8
2
33.8
6
2.3
8
75.1
4
5.9
2
16.6
1
2.3
3
96.0
0
- -
4.0
0
68.7
4
- -
31.2
6
- - -
100.0
0
Snap
shot
of
Deb
t Fu
nd
s
^Pu
rsuan
t to
acq
uis
itio
n o
f D
aiw
aTre
asury
Adva
nta
ge
Fund, (D
TA
F) f
rom
Dai
wa
Mutu
al F
und, w
.e.f
Nove
mber
16, 2013 t
he
nam
e of
the
schem
e w
as c
han
ged
to S
BI T
reas
ury
Adva
nta
ge
Fund.
Ple
ase
consu
lt y
our
financia
l advis
or
befo
re invest
ing. For
deta
ils,
ple
ase
refe
r to
resp
ecti
ve p
age o
f th
e s
chem
e.
35
36
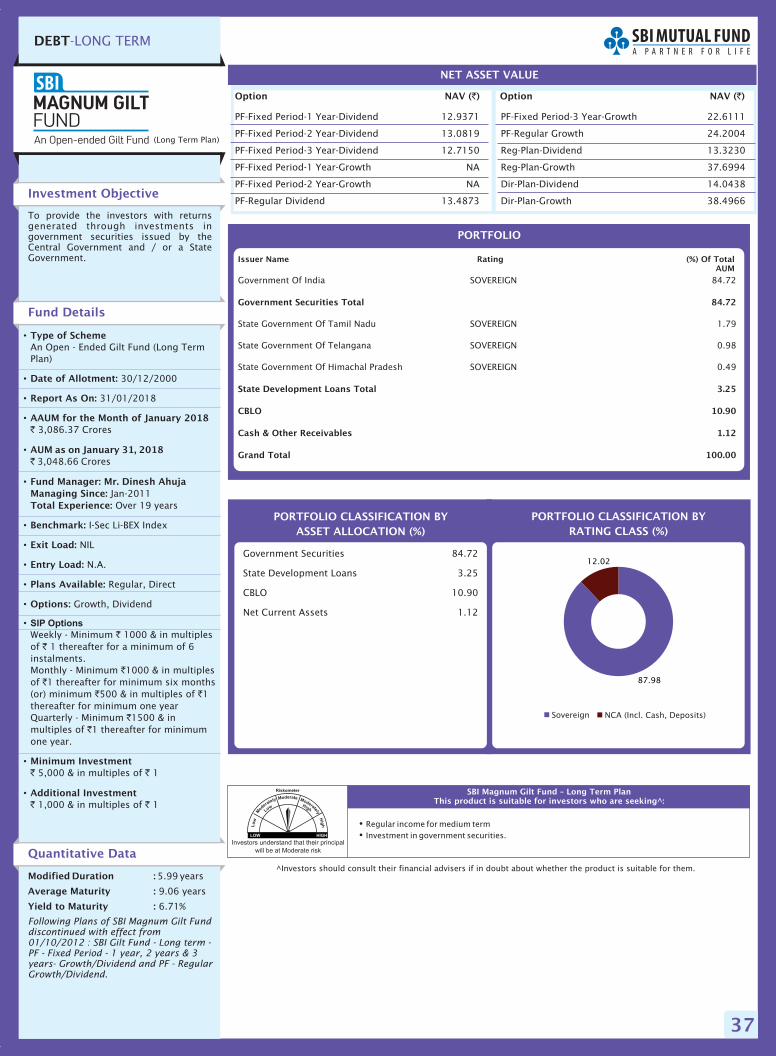
37
DEBT-LONG TERM
Investment Objective
Quantitative Data
To provide the investors with returnsgenerated through investments ingovernment securities issued by theCentral Government and / or a StateGovernment.
Fund Details
Modified Duration :
Average Maturity :
Yield to Maturity :
5.99
9.06 years
6.71%
years
Following Plans of SBI Magnum Gilt Funddiscontinued with effect from01/10/2012 : SBI Gilt Fund - Long term -PF - Fixed Period - 1 year, 2 years & 3years- Growth/Dividend and PF - RegularGrowth/Dividend.
•
•
•
•
•
•
•
•
•
•
•
•
•
•
Type of Scheme
Date of Allotment:
Report As On:
AAUM for the Month of January 2018
AUM as on January 31, 2018
Fund Manager: Mr. Dinesh AhujaManaging Since:Total Experience:
Benchmark:
Exit Load:
Entry Load:
Plans Available:
Options:
Minimum Investment
Additional Investment
An Open - Ended Gilt Fund (Long TermPlan)
30/12/2000
31/01/2018
3,086.37 Crores
3,048.66 Crores
Jan-2011Over 19 years
I-Sec Li-BEX Index
NIL
N.A.
Regular, Direct
Growth, Dividend
Weekly - Minimum 1000 & in multiplesof 1 thereafter for a minimum of 6instalments.Monthly - Minimum 1000 & in multiplesof 1 thereafter for minimum six months(or) minimum 500 & in multiples of 1thereafter for minimum one yearQuarterly - Minimum 1500 & inmultiples of 1 thereafter for minimumone year.
5,000 & in multiples of 1
1,000 & in multiples of 1
`
`
`
`
`
`
` `
`
`
` `
` `
SIP Options
Option NAV ( )`
PF-Fixed Period-1 Year-Dividend 12.9371
PF-Fixed Period-2 Year-Dividend 13.0819
PF-Fixed Period-3 Year-Dividend 12.7150
PF-Fixed Period-1 Year-Growth NA
PF-Fixed Period-2 Year-Growth NA
PF-Regular Dividend 13.4873
NET ASSET VALUE
Option NAV ( )`
PF-Fixed Period-3 Year-Growth 22.6111
PF-Regular Growth 24.2004
Reg-Plan-Dividend 13.3230
Reg-Plan-Growth 37.6994
Dir-Plan-Dividend 14.0438
Dir-Plan-Growth 38.4966
PORTFOLIO CLASSIFICATION BYRATING CLASS (%)
Government Securities 84.72
State Development Loans 3.25
CBLO 10.90
Net Current Assets 1.12
PORTFOLIO CLASSIFICATION BYASSET ALLOCATION (%)
(Long Term Plan)
Investors understand that their principal
will be at Moderate risk
�
�
Regular income for medium termInvestment in government securities.
SBI Magnum Gilt Fund – Long Term PlanThis product is suitable for investors who are seeking^:
^Investors should consult their financial advisers if in doubt about whether the product is suitable for them.
PORTFOLIO
Government Of India SOVEREIGN 84.72
State Government Of Tamil Nadu SOVEREIGN 1.79
State Government Of Telangana SOVEREIGN 0.98
State Government Of Himachal Pradesh SOVEREIGN 0.49
Government Securities Total 84.72
State Development Loans Total 3.25
CBLO 10.90
Cash & Other Receivables 1.12
Grand Total 100.00
Issuer Name Rating (%) Of TotalAUM
Sovereign NCA (Incl. Cash, Deposits)
87.98
12.02
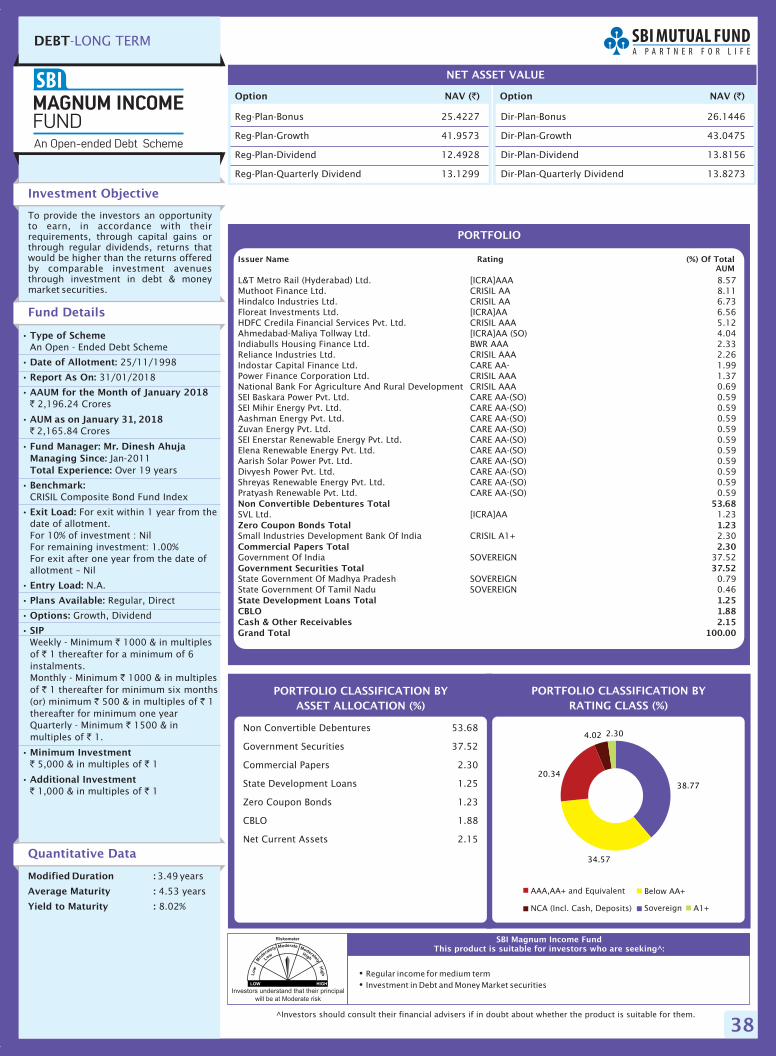
38
DEBT-LONG TERM
Option NAV ( )`
Reg-Plan-Bonus 25.4227
Reg-Plan-Growth 41.9573
Reg-Plan-Dividend 12.4928
Reg-Plan-Quarterly Dividend 13.1299
NET ASSET VALUE
Option NAV ( )`
�
�
Regular income for medium termInvestment in Debt and Money Market securities
SBI Magnum Income FundThis product is suitable for investors who are seeking^:
Investment Objective
Quantitative Data
To provide the investors an opportunityto earn, in accordance with theirrequirements, through capital gains orthrough regular dividends, returns thatwould be higher than the returns offeredby comparable investment avenuesthrough investment in debt & moneymarket securities.
Fund Details
Modified Duration :
Average Maturity :
Yield to Maturity :
3.49
4.53 years
8.02%
years
PORTFOLIO CLASSIFICATION BYRATING CLASS (%)
Non Convertible Debentures 53.68
Government Securities 37.52
Commercial Papers 2.30
State Development Loans 1.25
Zero Coupon Bonds 1.23
CBLO 1.88
Net Current Assets 2.15
•
•
•
•
•
•
•
•
•
•
•
•
•
•
Type of Scheme
Date of Allotment:
Report As On:
AAUM for the Month of January 2018
AUM as on January 31, 2018
Fund Manager: Mr. Dinesh AhujaManaging Since:Total Experience:
Benchmark:
Exit Load:
Entry Load:
Plans Available:
Options:
SIP
Minimum Investment
Additional Investment
An Open - Ended Debt Scheme
25/11/1998
31/01/2018
2,196.24 Crores
2,165.84 Crores
Jan-2011Over 19 years
CRISIL Composite Bond Fund Index
For exit within 1 year from thedate of allotment.For 10% of investment : NilFor remaining investment: 1.00%For exit after one year from the date ofallotment – Nil
N.A.
Regular, Direct
Growth, Dividend
Weekly - Minimum 1000 & in multiplesof 1 thereafter for a minimum of 6instalments.Monthly - Minimum 1000 & in multiplesof 1 thereafter for minimum six months(or) minimum 500 & in multiples of 1thereafter for minimum one yearQuarterly - Minimum 1500 & inmultiples of 1.
5,000 & in multiples of 1
1,000 & in multiples of 1
`
`
`
`
`
`
` `
`
`
` `
` `
PORTFOLIO CLASSIFICATION BYASSET ALLOCATION (%)
Dir-Plan-Bonus 26.1446
Dir-Plan-Growth 43.0475
Dir-Plan-Dividend 13.8156
Dir-Plan-Quarterly Dividend 13.8273
^Investors should consult their financial advisers if in doubt about whether the product is suitable for them.
Investors understand that their principal
will be at Moderate risk
PORTFOLIO
L&T Metro Rail (Hyderabad) Ltd. [ICRA]AAA 8.57Muthoot Finance Ltd. CRISIL AA 8.11Hindalco Industries Ltd. CRISIL AA 6.73Floreat Investments Ltd. [ICRA]AA 6.56HDFC Credila Financial Services Pvt. Ltd. CRISIL AAA 5.12Ahmedabad-Maliya Tollway Ltd. [ICRA]AA (SO) 4.04Indiabulls Housing Finance Ltd. BWR AAA 2.33Reliance Industries Ltd. CRISIL AAA 2.26Indostar Capital Finance Ltd. CARE AA- 1.99Power Finance Corporation Ltd. CRISIL AAA 1.37National Bank For Agriculture And Rural Development CRISIL AAA 0.69SEI Baskara Power Pvt. Ltd. CARE AA-(SO) 0.59SEI Mihir Energy Pvt. Ltd. CARE AA-(SO) 0.59Aashman Energy Pvt. Ltd. CARE AA-(SO) 0.59Zuvan Energy Pvt. Ltd. CARE AA-(SO) 0.59SEI Enerstar Renewable Energy Pvt. Ltd. CARE AA-(SO) 0.59Elena Renewable Energy Pvt. Ltd. CARE AA-(SO) 0.59Aarish Solar Power Pvt. Ltd. CARE AA-(SO) 0.59Divyesh Power Pvt. Ltd. CARE AA-(SO) 0.59Shreyas Renewable Energy Pvt. Ltd. CARE AA-(SO) 0.59Pratyash Renewable Pvt. Ltd. CARE AA-(SO) 0.59
SVL Ltd. [ICRA]AA 1.23
Small Industries Development Bank Of India CRISIL A1+ 2.30
Government Of India SOVEREIGN 37.52
State Government Of Madhya Pradesh SOVEREIGN 0.79State Government Of Tamil Nadu SOVEREIGN 0.46
Non Convertible Debentures Total 53.68
Zero Coupon Bonds Total 1.23
Commercial Papers Total 2.30
Government Securities Total 37.52
State Development Loans Total 1.25CBLO 1.88Cash & Other Receivables 2.15Grand Total 100.00
Issuer Name Rating (%) Of TotalAUM
38.77
34.57
20.34
4.02 2.30
AAA,AA+ and Equivalent Below AA+
A1+SovereignNCA (Incl. Cash, Deposits)
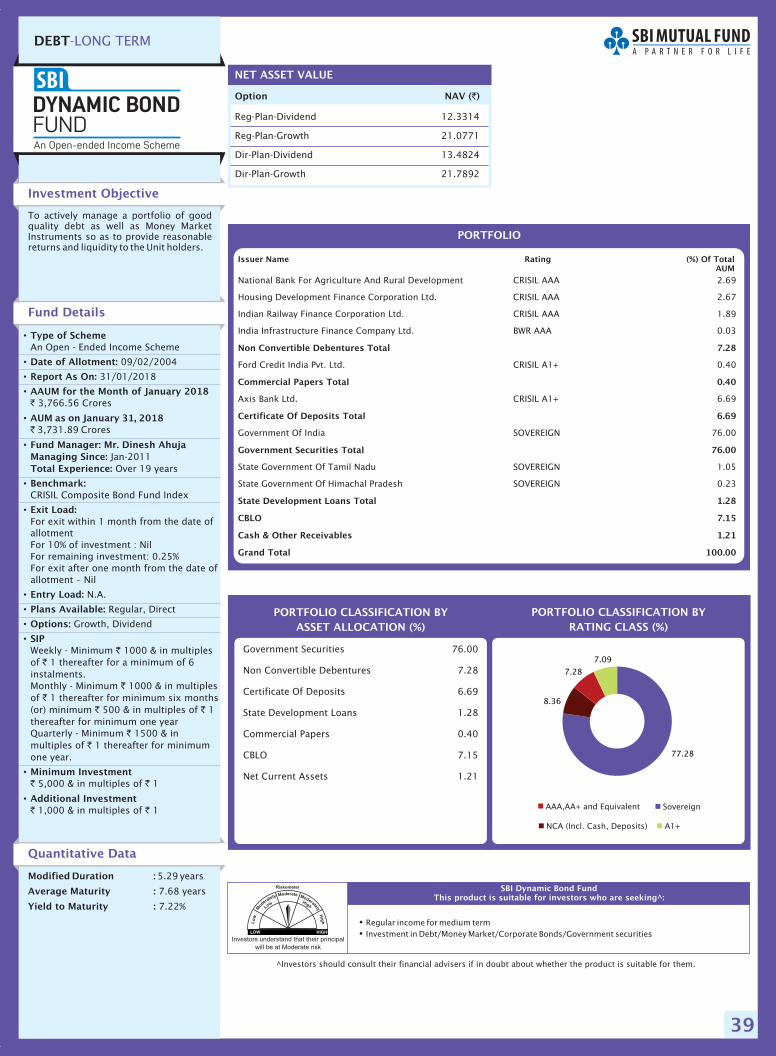
39
DEBT-LONG TERM
Option NAV ( )`
Reg-Plan-Dividend 12.3314
Reg-Plan-Growth 21.0771
Dir-Plan-Dividend 13.4824
Dir-Plan-Growth 21.7892
NET ASSET VALUE
Investors understand that their principal
will be at Moderate risk
�
�
Regular income for medium termInvestment in Debt/Money Market/Corporate Bonds/Government securities
SBI Dynamic Bond FundThis product is suitable for investors who are seeking^:
Investment Objective
Quantitative Data
To actively manage a portfolio of goodquality debt as well as Money MarketInstruments so as to provide reasonablereturns and liquidity to the Unit holders.
Fund Details
Modified Duration :
Average Maturity :
Yield to Maturity :
5.29
7.68 years
7.22%
years
PORTFOLIO CLASSIFICATION BYRATING CLASS (%)
Government Securities 76.00
Non Convertible Debentures 7.28
Certificate Of Deposits 6.69
State Development Loans 1.28
Commercial Papers 0.40
CBLO 7.15
Net Current Assets 1.21
•
•
•
•
•
•
•
•
•
•
•
•
•
•
Type of Scheme
Date of Allotment:
Report As On:
AAUM for the Month of January 2018
AUM as on January 31, 2018
Fund Manager: Mr. Dinesh AhujaManaging Since:Total Experience:
Benchmark:
Exit Load:
Entry Load:
Plans Available:
Options:
SIP
Minimum Investment
Additional Investment
An Open - Ended Income Scheme
09/02/2004
31/01/2018
3,766.56 Crores
3,731.89 Crores
Jan-2011Over 19 years
CRISIL Composite Bond Fund Index
For exit within 1 month from the date ofallotmentFor 10% of investment : NilFor remaining investment: 0.25%For exit after one month from the date ofallotment – Nil
N.A.
Regular, Direct
Growth, Dividend
Weekly - Minimum 1000 & in multiplesof 1 thereafter for a minimum of 6instalments.Monthly - Minimum 1000 & in multiplesof 1 thereafter for minimum six months(or) minimum 500 & in multiples of 1thereafter for minimum one yearQuarterly - Minimum 1500 & inmultiples of 1 thereafter for minimumone year.
5,000 & in multiples of 1
1,000 & in multiples of 1
`
`
`
`
`
`
` `
`
`
` `
` `
PORTFOLIO CLASSIFICATION BYASSET ALLOCATION (%)
^Investors should consult their financial advisers if in doubt about whether the product is suitable for them.
PORTFOLIO
National Bank For Agriculture And Rural Development CRISIL AAA 2.69
Housing Development Finance Corporation Ltd. CRISIL AAA 2.67
Indian Railway Finance Corporation Ltd. CRISIL AAA 1.89
India Infrastructure Finance Company Ltd. BWR AAA 0.03
Ford Credit India Pvt. Ltd. CRISIL A1+ 0.40
Axis Bank Ltd. CRISIL A1+ 6.69
Government Of India SOVEREIGN 76.00
State Government Of Tamil Nadu SOVEREIGN 1.05
State Government Of Himachal Pradesh SOVEREIGN 0.23
Non Convertible Debentures Total 7.28
Commercial Papers Total 0.40
Certificate Of Deposits Total 6.69
Government Securities Total 76.00
State Development Loans Total 1.28
CBLO 7.15
Cash & Other Receivables 1.21
Grand Total 100.00
Issuer Name Rating (%) Of TotalAUM
AAA,AA+ and Equivalent Sovereign
NCA (Incl. Cash, Deposits) A1+
77.28
8.36
7.28
7.09
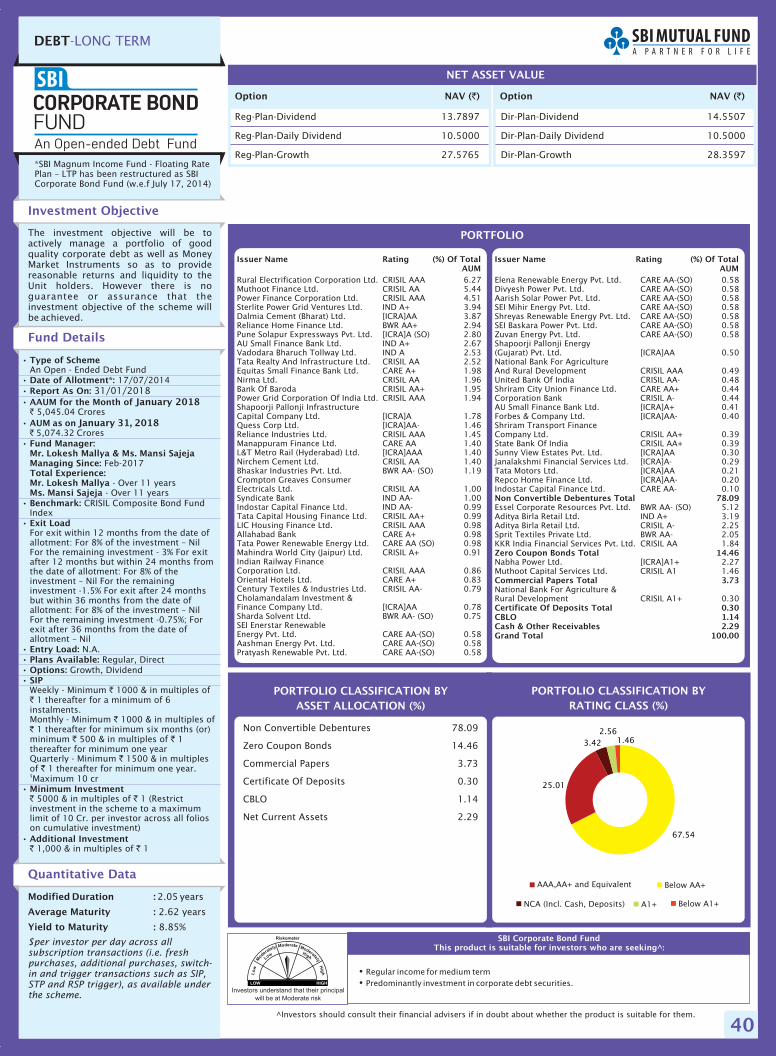
40
DEBT-LONG TERM
Option NAV ( )`
Reg-Plan-Dividend 13.7897
Reg-Plan-Daily Dividend 10.5000
Reg-Plan-Growth 27.5765
NET ASSET VALUE
Option NAV ( )`
Investors understand that their principal
will be at Moderate risk
�
�
Regular income for medium termPredominantly investment in corporate debt securities.
SBI Corporate Bond FundThis product is suitable for investors who are seeking^:
Investment Objective
Quantitative Data
The investment objective will be toactively manage a portfolio of goodquality corporate debt as well as MoneyMarket Instruments so as to providereasonable returns and liquidity to theUnit holders. However there is noguarantee or assurance that theinvestment objective of the scheme willbe achieved.
Fund Details
Modified Duration :
Average Maturity :
Yield to Maturity :
2.05
2.62 years
8.85%
years
$per investor per day across allsubscription transactions (i.e. freshpurchases, additional purchases, switch-in and trigger transactions such as SIP,STP and RSP trigger), as available underthe scheme.
PORTFOLIO CLASSIFICATION BYRATING CLASS (%)
Non Convertible Debentures 78.09
Zero Coupon Bonds 14.46
Commercial Papers 3.73
Certificate Of Deposits 0.30
CBLO 1.14
Net Current Assets 2.29
•
•
•
•
•
•
•
•
•
•
•
•
•
•
Type of Scheme
Date of Allotment*:Report As On:AAUM for the Month of
AUM as on
Fund Manager:Mr. Lokesh Mallya & Ms. Mansi SajejaManaging Since:Total Experience:Mr. Lokesh MallyaMs. Mansi SajejaBenchmark:
Exit Load
Entry Load:Plans Available:Options:SIP
Minimum Investment
Additional Investment
An Open - Ended Debt Fund17/07/2014
5,045.04 Crores
5,074.32 Crores
Feb-2017
- Over 11 years- Over 11 years
CRISIL Composite Bond FundIndex
For exit within 12 months from the date ofallotment: For 8% of the investment – NilFor the remaining investment - 3% For exitafter 12 months but within 24 months fromthe date of allotment: For 8% of theinvestment – Nil For the remaininginvestment -1.5% For exit after 24 monthsbut within 36 months from the date ofallotment: For 8% of the investment – NilFor the remaining investment -0.75%; Forexit after 36 months from the date ofallotment – Nil
N.A.Regular, Direct
Growth, Dividend
Weekly - Minimum 1000 & in multiples of1 thereafter for a minimum of 6
instalments.Monthly - Minimum 1000 & in multiples of
1 thereafter for minimum six months (or)minimum 500 & in multiples of 1thereafter for minimum one yearQuarterly - Minimum 1500 & in multiplesof 1 thereafter for minimum one year.Maximum 10 cr
5000 & in multiples of 1 (Restrictinvestment in the scheme to a maximumlimit of 10 Cr. per investor across all folioson cumulative investment)
1,000 & in multiples of 1
31/01/2018January 2018
January 31, 2018`
`
`
`
`
`
` `
`
`
` `
` `
$
PORTFOLIO CLASSIFICATION BYASSET ALLOCATION (%)
Dir-Plan-Dividend 14.5507
Dir-Plan-Daily Dividend 10.5000
Dir-Plan-Growth 28.3597
PORTFOLIO
Rural Electrification Corporation Ltd. CRISIL AAA 6.27Muthoot Finance Ltd. CRISIL AA 5.44Power Finance Corporation Ltd. CRISIL AAA 4.51Sterlite Power Grid Ventures Ltd. IND A+ 3.94Dalmia Cement (Bharat) Ltd. [ICRA]AA 3.87Reliance Home Finance Ltd. BWR AA+ 2.94Pune Solapur Expressways Pvt. Ltd. [ICRA]A (SO) 2.80AU Small Finance Bank Ltd. IND A+ 2.67Vadodara Bharuch Tollway Ltd. IND A 2.53Tata Realty And Infrastructure Ltd. CRISIL AA 2.52Equitas Small Finance Bank Ltd. CARE A+ 1.98Nirma Ltd. CRISIL AA 1.96Bank Of Baroda CRISIL AA+ 1.95Power Grid Corporation Of India Ltd. CRISIL AAA 1.94Shapoorji Pallonji InfrastructureCapital Company Ltd. [ICRA]A 1.78Quess Corp Ltd. [ICRA]AA- 1.46Reliance Industries Ltd. CRISIL AAA 1.45Manappuram Finance Ltd. CARE AA 1.40L&T Metro Rail (Hyderabad) Ltd. [ICRA]AAA 1.40Nirchem Cement Ltd. CRISIL AA 1.40Bhaskar Industries Pvt. Ltd. BWR AA- (SO) 1.19Crompton Greaves ConsumerElectricals Ltd. CRISIL AA 1.00Syndicate Bank IND AA- 1.00Indostar Capital Finance Ltd. IND AA- 0.99Tata Capital Housing Finance Ltd. CRISIL AA+ 0.99LIC Housing Finance Ltd. CRISIL AAA 0.98Allahabad Bank CARE A+ 0.98Tata Power Renewable Energy Ltd. CARE AA (SO) 0.98Mahindra World City (Jaipur) Ltd. CRISIL A+ 0.91Indian Railway FinanceCorporation Ltd. CRISIL AAA 0.86Oriental Hotels Ltd. CARE A+ 0.83Century Textiles & Industries Ltd. CRISIL AA- 0.79Cholamandalam Investment &Finance Company Ltd. [ICRA]AA 0.78Sharda Solvent Ltd. BWR AA- (SO) 0.75SEI Enerstar RenewableEnergy Pvt. Ltd. CARE AA-(SO) 0.58Aashman Energy Pvt. Ltd. CARE AA-(SO) 0.58Pratyash Renewable Pvt. Ltd. CARE AA-(SO) 0.58
Elena Renewable Energy Pvt. Ltd. CARE AA-(SO) 0.58Divyesh Power Pvt. Ltd. CARE AA-(SO) 0.58Aarish Solar Power Pvt. Ltd. CARE AA-(SO) 0.58SEI Mihir Energy Pvt. Ltd. CARE AA-(SO) 0.58Shreyas Renewable Energy Pvt. Ltd. CARE AA-(SO) 0.58SEI Baskara Power Pvt. Ltd. CARE AA-(SO) 0.58Zuvan Energy Pvt. Ltd. CARE AA-(SO) 0.58Shapoorji Pallonji Energy(Gujarat) Pvt. Ltd. [ICRA]AA 0.50National Bank For AgricultureAnd Rural Development CRISIL AAA 0.49United Bank Of India CRISIL AA- 0.48Shriram City Union Finance Ltd. CARE AA+ 0.44Corporation Bank CRISIL A- 0.44AU Small Finance Bank Ltd. [ICRA]A+ 0.41Forbes & Company Ltd. [ICRA]AA- 0.40Shriram Transport FinanceCompany Ltd. CRISIL AA+ 0.39State Bank Of India CRISIL AA+ 0.39Sunny View Estates Pvt. Ltd. [ICRA]AA 0.30Janalakshmi Financial Services Ltd. [ICRA]A- 0.29Tata Motors Ltd. [ICRA]AA 0.21Repco Home Finance Ltd. [ICRA]AA- 0.20Indostar Capital Finance Ltd. CARE AA- 0.10
Essel Corporate Resources Pvt. Ltd. BWR AA- (SO) 5.12Aditya Birla Retail Ltd. IND A+ 3.19Aditya Birla Retail Ltd. CRISIL A- 2.25Sprit Textiles Private Ltd. BWR AA- 2.05KKR India Financial Services Pvt. Ltd. CRISIL AA 1.84
Nabha Power Ltd. [ICRA]A1+ 2.27Muthoot Capital Services Ltd. CRISIL A1 1.46
National Bank For Agriculture &Rural Development CRISIL A1+ 0.30
Non Convertible Debentures Total 78.09
Zero Coupon Bonds Total 14.46
Commercial Papers Total 3.73
Certificate Of Deposits Total 0.30CBLO 1.14Cash & Other Receivables 2.29Grand Total 100.00
Issuer Name Rating (%) Of TotalAUM
Issuer Name Rating (%) Of TotalAUM
*SBI Magnum Income Fund - Floating RatePlan – LTP has been restructured as SBICorporate Bond Fund (w.e.f July 17, 2014)
^Investors should consult their financial advisers if in doubt about whether the product is suitable for them.
AAA,AA+ and Equivalent Below AA+
Below A1+A1+NCA (Incl. Cash, Deposits)
67.54
25.01
3.422.56
1.46
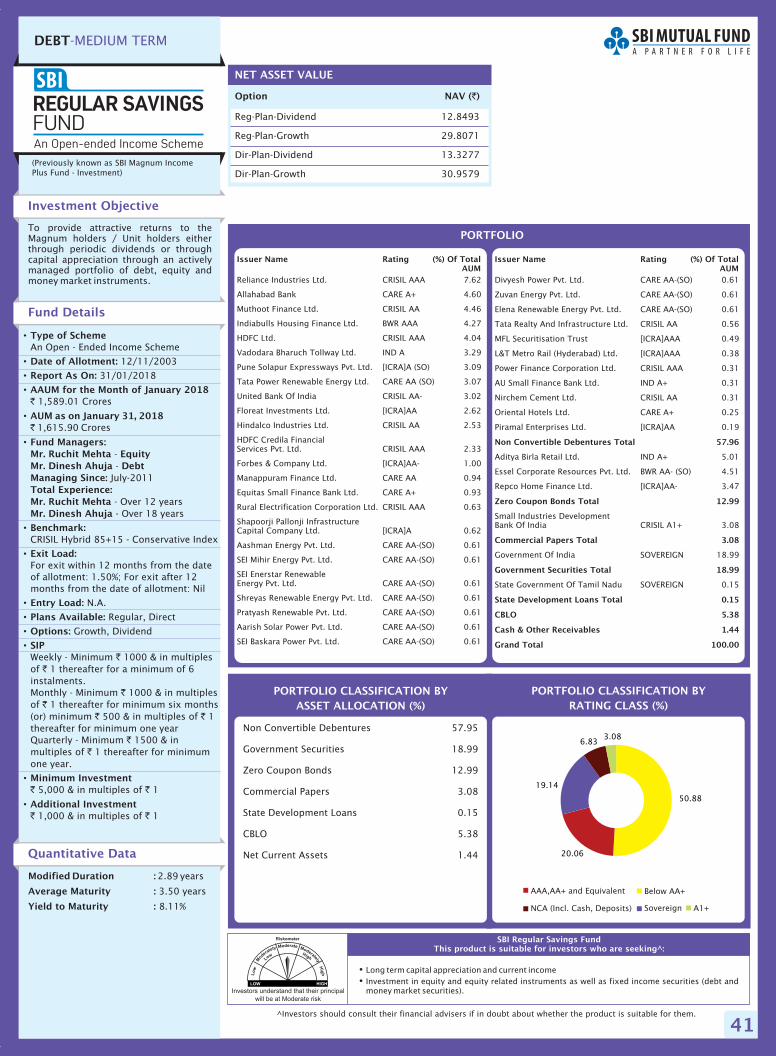
41
DEBT-MEDIUM TERM
Option NAV ( )`
Reg-Plan-Dividend 12.8493
Reg-Plan-Growth 29.8071
Dir-Plan-Dividend 13.3277
Dir-Plan-Growth 30.9579
NET ASSET VALUE
�
�
Long term capital appreciation and current incomeInvestment in equity and equity related instruments as well as fixed income securities (debt andmoney market securities).
SBI Regular Savings FundThis product is suitable for investors who are seeking^:
Investment Objective
Quantitative Data
To provide attractive returns to theMagnum holders / Unit holders eitherthrough periodic dividends or throughcapital appreciation through an activelymanaged portfolio of debt, equity andmoney market instruments.
Fund Details
Modified Duration :
Average Maturity :
Yield to Maturity :
2.89
3.50 years
8.11%
years
PORTFOLIO CLASSIFICATION BYRATING CLASS (%)
Non Convertible Debentures 57.95
Government Securities 18.99
Zero Coupon Bonds 12.99
Commercial Papers 3.08
State Development Loans 0.15
CBLO 5.38
Net Current Assets 1.44
•
•
•
•
•
•
•
•
•
•
•
•
•
•
Type of Scheme
Date of Allotment:
Report As On:
AAUM for the Month of January 2018
AUM as on January 31, 2018
Fund Managers:Mr. Ruchit Mehta EquityMr. Dinesh Ahuja DebtManaging Since:Total Experience:Mr. Ruchit MehtaMr. Dinesh Ahuja
Benchmark:
Exit Load:
Entry Load:
Plans Available:
Options:
SIP
Minimum Investment
Additional Investment
An Open - Ended Income Scheme
12/11/2003
31/01/2018
1,589.01 Crores
1,615.90 Crores
--
July-2011
- Over 12 years- Over 18 years
CRISIL Hybrid 85+15 - Conservative Index
For exit within 12 months from the dateof allotment: 1.50%; For exit after 12months from the date of allotment: Nil
N.A.
Regular, Direct
Growth, Dividend
Weekly - Minimum 1000 & in multiplesof 1 thereafter for a minimum of 6instalments.Monthly - Minimum 1000 & in multiplesof 1 thereafter for minimum six months(or) minimum 500 & in multiples of 1thereafter for minimum one yearQuarterly - Minimum 1500 & inmultiples of 1 thereafter for minimumone year.
5,000 & in multiples of 1
1,000 & in multiples of 1
`
`
`
`
`
`
` `
`
`
` `
` `
PORTFOLIO CLASSIFICATION BYASSET ALLOCATION (%)
PORTFOLIO
Reliance Industries Ltd. CRISIL AAA 7.62
Allahabad Bank CARE A+ 4.60
Muthoot Finance Ltd. CRISIL AA 4.46
Indiabulls Housing Finance Ltd. BWR AAA 4.27
HDFC Ltd. CRISIL AAA 4.04
Vadodara Bharuch Tollway Ltd. IND A 3.29
Pune Solapur Expressways Pvt. Ltd. [ICRA]A (SO) 3.09
Tata Power Renewable Energy Ltd. CARE AA (SO) 3.07
United Bank Of India CRISIL AA- 3.02
Floreat Investments Ltd. [ICRA]AA 2.62
Hindalco Industries Ltd. CRISIL AA 2.53
HDFC Credila FinancialServices Pvt. Ltd. CRISIL AAA 2.33
Forbes & Company Ltd. [ICRA]AA- 1.00
Manappuram Finance Ltd. CARE AA 0.94
Equitas Small Finance Bank Ltd. CARE A+ 0.93
Rural Electrification Corporation Ltd. CRISIL AAA 0.63
Shapoorji Pallonji InfrastructureCapital Company Ltd. [ICRA]A 0.62
Aashman Energy Pvt. Ltd. CARE AA-(SO) 0.61
SEI Mihir Energy Pvt. Ltd. CARE AA-(SO) 0.61
SEI Enerstar RenewableEnergy Pvt. Ltd. CARE AA-(SO) 0.61
Shreyas Renewable Energy Pvt. Ltd. CARE AA-(SO) 0.61
Pratyash Renewable Pvt. Ltd. CARE AA-(SO) 0.61
Aarish Solar Power Pvt. Ltd. CARE AA-(SO) 0.61
SEI Baskara Power Pvt. Ltd. CARE AA-(SO) 0.61
Divyesh Power Pvt. Ltd. CARE AA-(SO) 0.61
Zuvan Energy Pvt. Ltd. CARE AA-(SO) 0.61
Elena Renewable Energy Pvt. Ltd. CARE AA-(SO) 0.61
Tata Realty And Infrastructure Ltd. CRISIL AA 0.56
MFL Securitisation Trust [ICRA]AAA 0.49
L&T Metro Rail (Hyderabad) Ltd. [ICRA]AAA 0.38
Power Finance Corporation Ltd. CRISIL AAA 0.31
AU Small Finance Bank Ltd. IND A+ 0.31
Nirchem Cement Ltd. CRISIL AA 0.31
Oriental Hotels Ltd. CARE A+ 0.25
Piramal Enterprises Ltd. [ICRA]AA 0.19
Aditya Birla Retail Ltd. IND A+ 5.01
Essel Corporate Resources Pvt. Ltd. BWR AA- (SO) 4.51
Repco Home Finance Ltd. [ICRA]AA- 3.47
Small Industries DevelopmentBank Of India CRISIL A1+ 3.08
Government Of India SOVEREIGN 18.99
State Government Of Tamil Nadu SOVEREIGN 0.15
Non Convertible Debentures Total 57.96
Zero Coupon Bonds Total 12.99
Commercial Papers Total 3.08
Government Securities Total 18.99
State Development Loans Total 0.15
CBLO 5.38
Cash & Other Receivables 1.44
Grand Total 100.00
Issuer Name Rating (%) Of TotalAUM
Issuer Name Rating (%) Of TotalAUM
(Previously known as SBI Magnum IncomePlus Fund - Investment)
^Investors should consult their financial advisers if in doubt about whether the product is suitable for them.
Investors understand that their principal
will be at Moderate risk
AAA,AA+ and Equivalent Below AA+
A1+SovereignNCA (Incl. Cash, Deposits)
50.88
20.06
19.14
6.833.08
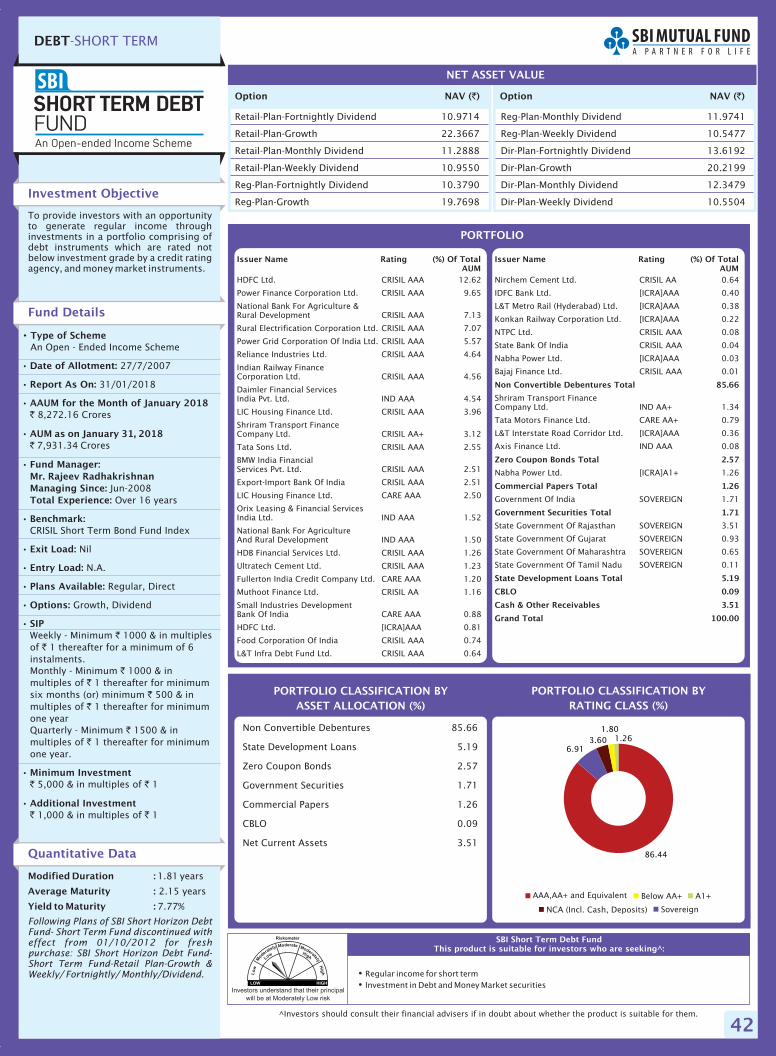
42
DEBT-SHORT TERM
�
�
Regular income for short termInvestment in Debt and Money Market securities
SBI Short Term Debt FundThis product is suitable for investors who are seeking^:
Investment Objective
Quantitative Data
To provide investors with an opportunityto generate regular income throughinvestments in a portfolio comprising ofdebt instruments which are rated notbelow investment grade by a credit ratingagency, and money market instruments.
Fund Details
Modified Duration :
Average Maturity :
Yield to Maturity :
1.81
2.15 years
7.77%
years
Following Plans of SBI Short Horizon DebtFund- Short Term Fund discontinued witheffect from 01/10/2012 for freshpurchase: SBI Short Horizon Debt Fund-Short Term Fund-Retail Plan-Growth &Weekly/ Fortnightly/ Monthly/Dividend.
PORTFOLIO CLASSIFICATION BYRATING CLASS (%)
Non Convertible Debentures 85.66
State Development Loans 5.19
Zero Coupon Bonds 2.57
Government Securities 1.71
Commercial Papers 1.26
CBLO 0.09
Net Current Assets 3.51
• Type of Scheme
Date of Allotment:
Report As On:
AAUM for the Month of January 2018
AUM as on January 31, 2018
Fund Manager:Mr. Rajeev RadhakrishnanManaging Since:Total Experience:
Benchmark:
Exit Load:
Entry Load:
Plans Available:
Options:
SIP
Minimum Investment
Additional Investment
An Open - Ended Income Scheme
27/7/2007
31/01/2018
8,272.16 Crores
7,931.34 Crores
Jun-2008Over 16 years
CRISIL Short Term Bond Fund Index
Nil
N.A.
Regular, Direct
Growth, Dividend
Weekly - Minimum 1000 & in multiplesof 1 thereafter for a minimum of 6instalments.Monthly - Minimum 1000 & inmultiples of 1 thereafter for minimumsix months (or) minimum 500 & inmultiples of 1 thereafter for minimumone yearQuarterly - Minimum 1500 & inmultiples of 1 thereafter for minimumone year.
5,000 & in multiples of 1
1,000 & in multiples of 1
•
•
•
•
•
•
•
•
•
•
•
•
•
`
`
`
`
`
`
`
`
`
`
` `
` `
PORTFOLIO CLASSIFICATION BYASSET ALLOCATION (%)
Option NAV ( )`
Retail-Plan-Fortnightly Dividend 10.9714
Retail-Plan-Growth 22.3667
Retail-Plan-Monthly Dividend 11.2888
Retail-Plan-Weekly Dividend 10.9550
Reg-Plan-Fortnightly Dividend 10.3790
Reg-Plan-Growth 19.7698
NET ASSET VALUE
Option NAV ( )`
Reg-Plan-Monthly Dividend 11.9741
Reg-Plan-Weekly Dividend 10.5477
Dir-Plan-Fortnightly Dividend 13.6192
Dir-Plan-Growth 20.2199
Dir-Plan-Monthly Dividend 12.3479
Dir-Plan-Weekly Dividend 10.5504
PORTFOLIO
HDFC Ltd. CRISIL AAA 12.62
Power Finance Corporation Ltd. CRISIL AAA 9.65
National Bank For Agriculture &Rural Development CRISIL AAA 7.13
Rural Electrification Corporation Ltd. CRISIL AAA 7.07
Power Grid Corporation Of India Ltd. CRISIL AAA 5.57
Reliance Industries Ltd. CRISIL AAA 4.64
Indian Railway FinanceCorporation Ltd. CRISIL AAA 4.56
Daimler Financial ServicesIndia Pvt. Ltd. IND AAA 4.54
LIC Housing Finance Ltd. CRISIL AAA 3.96
Shriram Transport FinanceCompany Ltd. CRISIL AA+ 3.12
Tata Sons Ltd. CRISIL AAA 2.55
BMW India FinancialServices Pvt. Ltd. CRISIL AAA 2.51
Export-Import Bank Of India CRISIL AAA 2.51
LIC Housing Finance Ltd. CARE AAA 2.50
Orix Leasing & Financial ServicesIndia Ltd. IND AAA 1.52
National Bank For AgricultureAnd Rural Development IND AAA 1.50
HDB Financial Services Ltd. CRISIL AAA 1.26
Ultratech Cement Ltd. CRISIL AAA 1.23
Fullerton India Credit Company Ltd. CARE AAA 1.20
Muthoot Finance Ltd. CRISIL AA 1.16
Small Industries DevelopmentBank Of India CARE AAA 0.88
HDFC Ltd. [ICRA]AAA 0.81
Food Corporation Of India CRISIL AAA 0.74
L&T Infra Debt Fund Ltd. CRISIL AAA 0.64
Nirchem Cement Ltd. CRISIL AA 0.64
IDFC Bank Ltd. [ICRA]AAA 0.40
L&T Metro Rail (Hyderabad) Ltd. [ICRA]AAA 0.38
Konkan Railway Corporation Ltd. [ICRA]AAA 0.22
NTPC Ltd. CRISIL AAA 0.08
State Bank Of India CRISIL AAA 0.04
Nabha Power Ltd. [ICRA]AAA 0.03
Bajaj Finance Ltd. CRISIL AAA 0.01
Shriram Transport FinanceCompany Ltd. IND AA+ 1.34
Tata Motors Finance Ltd. CARE AA+ 0.79
L&T Interstate Road Corridor Ltd. [ICRA]AAA 0.36
Axis Finance Ltd. IND AAA 0.08
Nabha Power Ltd. [ICRA]A1+ 1.26
Government Of India SOVEREIGN 1.71
State Government Of Rajasthan SOVEREIGN 3.51
State Government Of Gujarat SOVEREIGN 0.93
State Government Of Maharashtra SOVEREIGN 0.65
State Government Of Tamil Nadu SOVEREIGN 0.11
Non Convertible Debentures Total 85.66
Zero Coupon Bonds Total 2.57
Commercial Papers Total 1.26
Government Securities Total 1.71
State Development Loans Total 5.19
CBLO 0.09
Cash & Other Receivables 3.51
Grand Total 100.00
Issuer Name Rating (%) Of TotalAUM
Issuer Name Rating (%) Of TotalAUM
Investors understand that their principal
will be at Moderately Low risk
^Investors should consult their financial advisers if in doubt about whether the product is suitable for them.
SovereignNCA (Incl. Cash, Deposits)
AAA,AA+ and Equivalent Below AA+ A1+
86.44
6.913.60
1.801.26
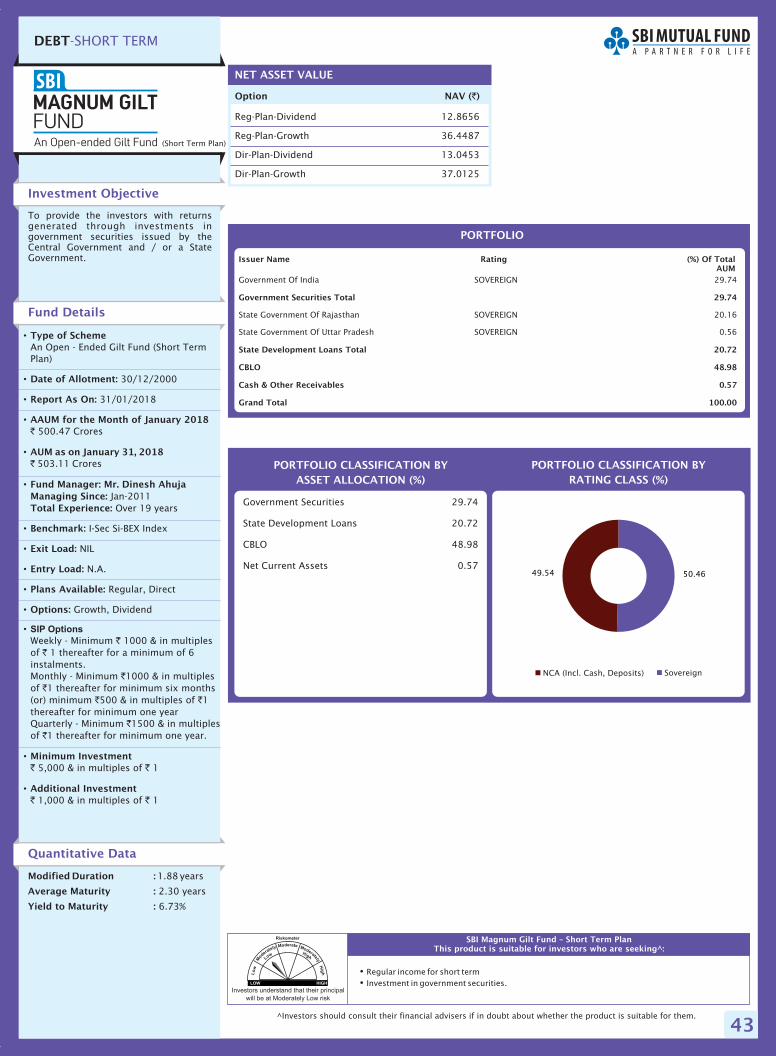
43
Option NAV ( )`
Reg-Plan-Dividend 12.8656
Reg-Plan-Growth 36.4487
Dir-Plan-Dividend 13.0453
Dir-Plan-Growth 37.0125
NET ASSET VALUE
�
�
Regular income for short termInvestment in government securities.
SBI Magnum Gilt Fund – Short Term PlanThis product is suitable for investors who are seeking^:
Investment Objective
Quantitative Data
To provide the investors with returnsgenerated through investments ingovernment securities issued by theCentral Government and / or a StateGovernment.
Fund Details
Modified Duration :
Average Maturity :
Yield to Maturity :
1.88
2.30 years
6.73%
years
PORTFOLIO CLASSIFICATION BYRATING CLASS (%)
Government Securities 29.74
State Development Loans 20.72
CBLO 48.98
Net Current Assets 0.57
•
•
•
•
•
•
•
•
•
•
•
•
•
•
Type of Scheme
Date of Allotment:
Report As On:
AAUM for the Month of January 2018
AUM as on January 31, 2018
Fund Manager: Mr. Dinesh AhujaManaging Since:Total Experience:
Benchmark:
Exit Load:
Entry Load:
Plans Available:
Options:
Minimum Investment
Additional Investment
An Open - Ended Gilt Fund (Short TermPlan)
30/12/2000
31/01/2018
500.47 Crores
503.11 Crores
Jan-2011Over 19 years
I-Sec Si-BEX Index
NIL
N.A.
Regular, Direct
Growth, Dividend
Weekly - Minimum 1000 & in multiplesof 1 thereafter for a minimum of 6instalments.Monthly - Minimum 1000 & in multiplesof 1 thereafter for minimum six months(or) minimum 500 & in multiples of 1thereafter for minimum one yearQuarterly - Minimum 1500 & in multiplesof 1 thereafter for minimum one year.
5,000 & in multiples of 1
1,000 & in multiples of 1
`
`
`
`
`
`
` `
`
`
` `
` `
SIP Options
PORTFOLIO CLASSIFICATION BYASSET ALLOCATION (%)
DEBT-SHORT TERM
PORTFOLIO
Government Of India SOVEREIGN 29.74
State Government Of Rajasthan SOVEREIGN 20.16
State Government Of Uttar Pradesh SOVEREIGN 0.56
Government Securities Total 29.74
State Development Loans Total 20.72
CBLO 48.98
Cash & Other Receivables 0.57
Grand Total 100.00
Issuer Name Rating (%) Of TotalAUM
(Short Term Plan)
Investors understand that their principal
will be at Moderately Low risk
^Investors should consult their financial advisers if in doubt about whether the product is suitable for them.
SovereignNCA (Incl. Cash, Deposits)
50.4649.54
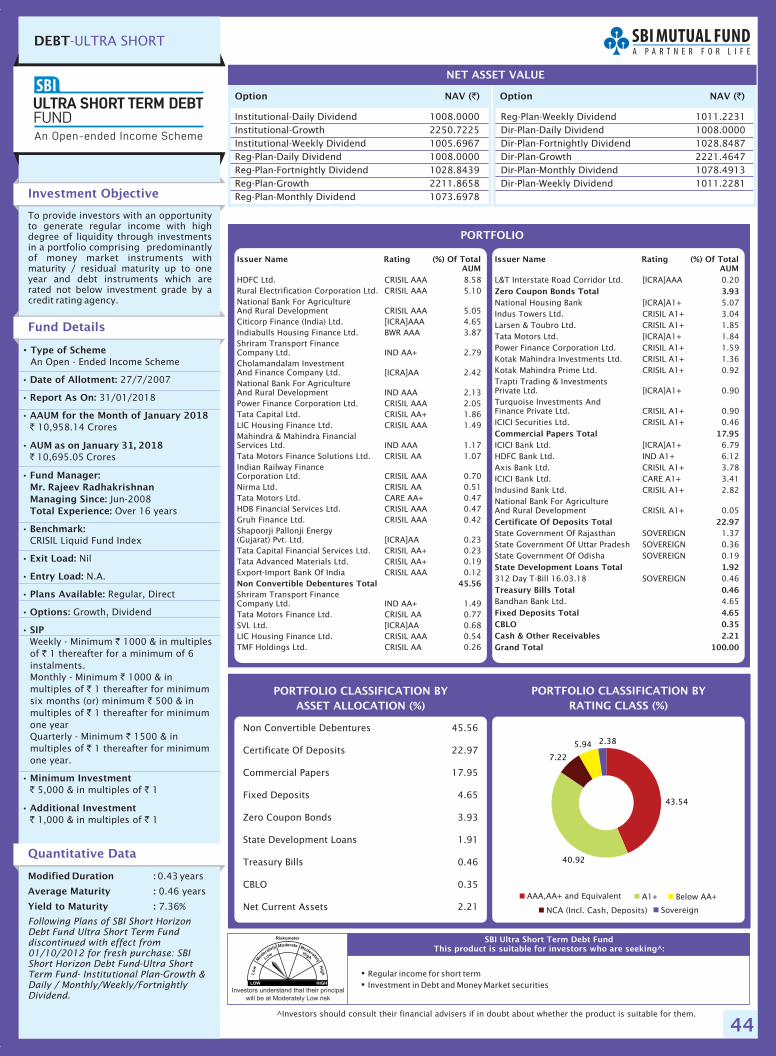
44
Option NAV ( )`
Institutional-Daily Dividend 1008.0000Institutional-Growth 2250.7225Institutional-Weekly Dividend 1005.6967Reg-Plan-Daily Dividend 1008.0000Reg-Plan-Fortnightly Dividend 1028.8439Reg-Plan-Growth 2211.8658Reg-Plan-Monthly Dividend 1073.6978
NET ASSET VALUE
Option NAV ( )`
�
�
Regular income for short termInvestment in Debt and Money Market securities
SBI Ultra Short Term Debt FundThis product is suitable for investors who are seeking^:
Investment Objective
Quantitative Data
To provide investors with an opportunityto generate regular income with highdegree of liquidity through investmentsin a portfolio comprising predominantlyof money market instruments withmaturity / residual maturity up to oneyear and debt instruments which arerated not below investment grade by acredit rating agency.
Fund Details
Modified Duration :
Average Maturity :
Yield to Maturity :
0.43
0.46 years
7.36%
years
Following Plans of SBI Short HorizonDebt Fund Ultra Short Term Funddiscontinued with effect from01/10/2012 for fresh purchase: SBIShort Horizon Debt Fund-Ultra ShortTerm Fund- Institutional Plan-Growth &Daily / Monthly/Weekly/FortnightlyDividend.
PORTFOLIO CLASSIFICATION BYRATING CLASS (%)
Non Convertible Debentures 45.56
Certificate Of Deposits 22.97
Commercial Papers 17.95
Fixed Deposits 4.65
Zero Coupon Bonds 3.93
State Development Loans 1.91
Treasury Bills 0.46
CBLO 0.35
Net Current Assets 2.21
• Type of Scheme
Date of Allotment:
Report As On:
AAUM for the Month of January 2018
AUM as on January 31, 2018
Fund Manager:Mr. Rajeev RadhakrishnanManaging Since:Total Experience:
Benchmark:
Exit Load:
Entry Load:
Plans Available:
Options:
SIP
Minimum Investment
Additional Investment
An Open - Ended Income Scheme
27/7/2007
31/01/2018
10,958.14 Crores
10,695.05 Crores
Jun-2008Over 16 years
CRISIL Liquid Fund Index
Nil
N.A.
Regular, Direct
Growth, Dividend
Weekly - Minimum 1000 & in multiplesof 1 thereafter for a minimum of 6instalments.Monthly - Minimum 1000 & inmultiples of 1 thereafter for minimumsix months (or) minimum 500 & inmultiples of 1 thereafter for minimumone yearQuarterly - Minimum 1500 & inmultiples of 1 thereafter for minimumone year.
5,000 & in multiples of 1
1,000 & in multiples of 1
•
•
•
•
•
•
•
•
•
•
•
•
•
`
`
`
`
`
`
`
`
`
`
` `
` `
PORTFOLIO CLASSIFICATION BYASSET ALLOCATION (%)
Reg-Plan-Weekly Dividend 1011.2231Dir-Plan-Daily Dividend 1008.0000Dir-Plan-Fortnightly Dividend 1028.8487Dir-Plan-Growth 2221.4647Dir-Plan-Monthly Dividend 1078.4913Dir-Plan-Weekly Dividend 1011.2281
DEBT-ULTRA SHORT
PORTFOLIO
HDFC Ltd. CRISIL AAA 8.58Rural Electrification Corporation Ltd. CRISIL AAA 5.10National Bank For AgricultureAnd Rural Development CRISIL AAA 5.05Citicorp Finance (India) Ltd. [ICRA]AAA 4.65Indiabulls Housing Finance Ltd. BWR AAA 3.87Shriram Transport FinanceCompany Ltd. IND AA+ 2.79Cholamandalam InvestmentAnd Finance Company Ltd. [ICRA]AA 2.42National Bank For AgricultureAnd Rural Development IND AAA 2.13Power Finance Corporation Ltd. CRISIL AAA 2.05Tata Capital Ltd. CRISIL AA+ 1.86LIC Housing Finance Ltd. CRISIL AAA 1.49Mahindra & Mahindra FinancialServices Ltd. IND AAA 1.17Tata Motors Finance Solutions Ltd. CRISIL AA 1.07Indian Railway FinanceCorporation Ltd. CRISIL AAA 0.70Nirma Ltd. CRISIL AA 0.51Tata Motors Ltd. CARE AA+ 0.47HDB Financial Services Ltd. CRISIL AAA 0.47Gruh Finance Ltd. CRISIL AAA 0.42Shapoorji Pallonji Energy(Gujarat) Pvt. Ltd. [ICRA]AA 0.23Tata Capital Financial Services Ltd. CRISIL AA+ 0.23Tata Advanced Materials Ltd. CRISIL AA+ 0.19Export-Import Bank Of India CRISIL AAA 0.12
Shriram Transport FinanceCompany Ltd. IND AA+ 1.49Tata Motors Finance Ltd. CRISIL AA 0.77SVL Ltd. [ICRA]AA 0.68LIC Housing Finance Ltd. CRISIL AAA 0.54TMF Holdings Ltd. CRISIL AA 0.26
Non Convertible Debentures Total 45.56
L&T Interstate Road Corridor Ltd. [ICRA]AAA 0.20
National Housing Bank [ICRA]A1+ 5.07Indus Towers Ltd. CRISIL A1+ 3.04Larsen & Toubro Ltd. CRISIL A1+ 1.85Tata Motors Ltd. [ICRA]A1+ 1.84Power Finance Corporation Ltd. CRISIL A1+ 1.59Kotak Mahindra Investments Ltd. CRISIL A1+ 1.36Kotak Mahindra Prime Ltd. CRISIL A1+ 0.92Trapti Trading & InvestmentsPrivate Ltd. [ICRA]A1+ 0.90Turquoise Investments AndFinance Private Ltd. CRISIL A1+ 0.90ICICI Securities Ltd. CRISIL A1+ 0.46
ICICI Bank Ltd. [ICRA]A1+ 6.79HDFC Bank Ltd. IND A1+ 6.12Axis Bank Ltd. CRISIL A1+ 3.78ICICI Bank Ltd. CARE A1+ 3.41Indusind Bank Ltd. CRISIL A1+ 2.82National Bank For AgricultureAnd Rural Development CRISIL A1+ 0.05
State Government Of Rajasthan SOVEREIGN 1.37State Government Of Uttar Pradesh SOVEREIGN 0.36State Government Of Odisha SOVEREIGN 0.19
312 Day T-Bill 16.03.18 SOVEREIGN 0.46
Bandhan Bank Ltd. 4.65
Zero Coupon Bonds Total 3.93
Commercial Papers Total 17.95
Certificate Of Deposits Total 22.97
State Development Loans Total 1.92
Treasury Bills Total 0.46
Fixed Deposits Total 4.65CBLO 0.35Cash & Other Receivables 2.21Grand Total 100.00
Issuer Name Rating (%) Of TotalAUM
Issuer Name Rating (%) Of TotalAUM
Investors understand that their principal
will be at Moderately Low risk
^Investors should consult their financial advisers if in doubt about whether the product is suitable for them.
AAA,AA+ and Equivalent A1+
SovereignNCA (Incl. Cash, Deposits)
Below AA+
43.54
40.92
7.22
5.94 2.38
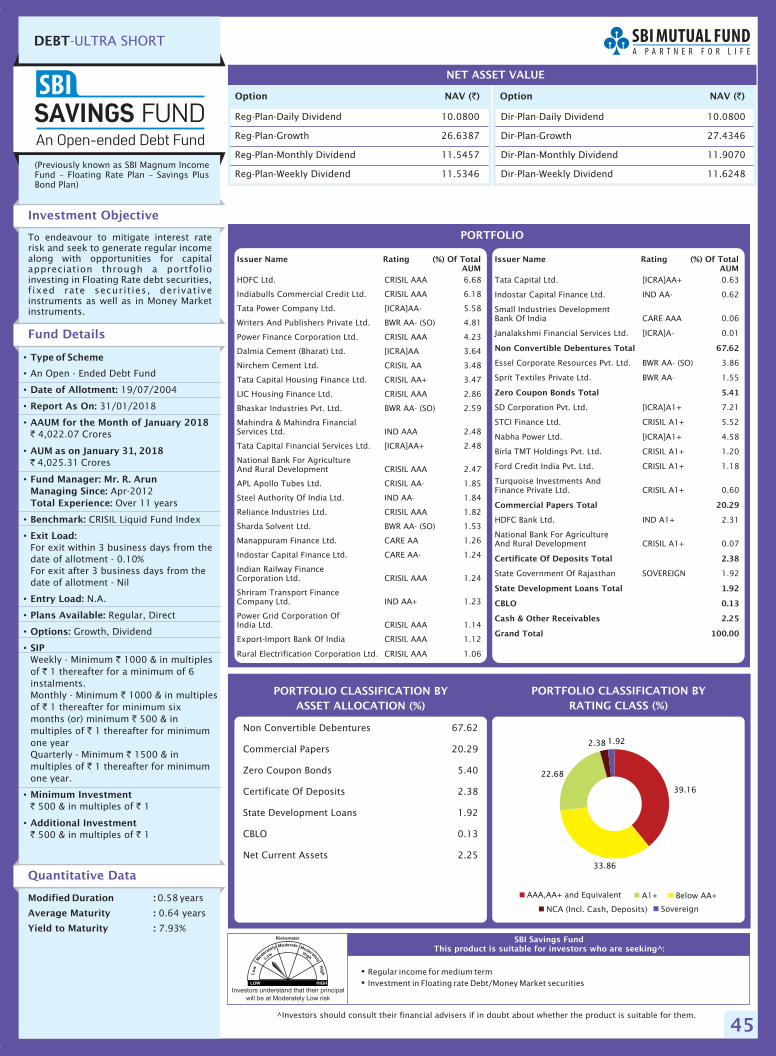
45
Option NAV ( )`
Reg-Plan-Daily Dividend 10.0800
Reg-Plan-Growth 26.6387
Reg-Plan-Monthly Dividend 11.5457
Reg-Plan-Weekly Dividend 11.5346
NET ASSET VALUE
Option NAV ( )`
�
�
Regular income for medium termInvestment in Floating rate Debt/Money Market securities
SBI Savings FundThis product is suitable for investors who are seeking^:
Investment Objective
Quantitative Data
To endeavour to mitigate interest raterisk and seek to generate regular incomealong with opportunities for capitalappreciation through a portfolioinvesting in Floating Rate debt securities,f ixed rate securit ies, derivativeinstruments as well as in Money Marketinstruments.
Fund Details
Modified Duration :
Average Maturity :
Yield to Maturity :
0.58
0.64 years
7.93%
years
PORTFOLIO CLASSIFICATION BYRATING CLASS (%)
Non Convertible Debentures 67.62
Commercial Papers 20.29
Zero Coupon Bonds 5.40
Certificate Of Deposits 2.38
State Development Loans 1.92
CBLO 0.13
Net Current Assets 2.25
•
•
•
•
•
•
•
•
•
•
•
•
•
•
•
Type of Scheme
Date of Allotment:
Report As On:
AAUM for the Month of January 2018
AUM as on January 31, 2018
Fund Manager: Mr. R. ArunManaging Since:Total Experience:
Benchmark:
Exit Load:
Entry Load:
Plans Available:
Options:
SIP
Minimum Investment
Additional Investment
An Open - Ended Debt Fund
19/07/2004
31/01/2018
4,022.07 Crores
4,025.31 Crores
Apr-2012Over 11 years
CRISIL Liquid Fund Index
For exit within 3 business days from thedate of allotment - 0.10%For exit after 3 business days from thedate of allotment - Nil
N.A.
Regular, Direct
Growth, Dividend
Weekly - Minimum 1000 & in multiplesof 1 thereafter for a minimum of 6instalments.Monthly - Minimum 1000 & in multiplesof 1 thereafter for minimum sixmonths (or) minimum 500 & inmultiples of 1 thereafter for minimumone yearQuarterly - Minimum 1500 & inmultiples of 1 thereafter for minimumone year.
500 & in multiples of 1
500 & in multiples of 1
`
`
`
`
`
`
`
`
`
`
` `
` `
PORTFOLIO CLASSIFICATION BYASSET ALLOCATION (%)
Dir-Plan-Daily Dividend 10.0800
Dir-Plan-Growth 27.4346
Dir-Plan-Monthly Dividend 11.9070
Dir-Plan-Weekly Dividend 11.6248
DEBT-ULTRA SHORT
PORTFOLIO
HDFC Ltd. CRISIL AAA 6.68
Indiabulls Commercial Credit Ltd. CRISIL AAA 6.18
Tata Power Company Ltd. [ICRA]AA- 5.58
Writers And Publishers Private Ltd. BWR AA- (SO) 4.81
Power Finance Corporation Ltd. CRISIL AAA 4.23
Dalmia Cement (Bharat) Ltd. [ICRA]AA 3.64
Nirchem Cement Ltd. CRISIL AA 3.48
Tata Capital Housing Finance Ltd. CRISIL AA+ 3.47
LIC Housing Finance Ltd. CRISIL AAA 2.86
Bhaskar Industries Pvt. Ltd. BWR AA- (SO) 2.59
Mahindra & Mahindra FinancialServices Ltd. IND AAA 2.48
Tata Capital Financial Services Ltd. [ICRA]AA+ 2.48
National Bank For AgricultureAnd Rural Development CRISIL AAA 2.47
APL Apollo Tubes Ltd. CRISIL AA- 1.85
Steel Authority Of India Ltd. IND AA- 1.84
Reliance Industries Ltd. CRISIL AAA 1.82
Sharda Solvent Ltd. BWR AA- (SO) 1.53
Manappuram Finance Ltd. CARE AA 1.26
Indostar Capital Finance Ltd. CARE AA- 1.24
Indian Railway FinanceCorporation Ltd. CRISIL AAA 1.24
Shriram Transport FinanceCompany Ltd. IND AA+ 1.23
Power Grid Corporation OfIndia Ltd. CRISIL AAA 1.14
Export-Import Bank Of India CRISIL AAA 1.12
Rural Electrification Corporation Ltd. CRISIL AAA 1.06
Tata Capital Ltd. [ICRA]AA+ 0.63
Indostar Capital Finance Ltd. IND AA- 0.62
Small Industries DevelopmentBank Of India CARE AAA 0.06
Janalakshmi Financial Services Ltd. [ICRA]A- 0.01
Essel Corporate Resources Pvt. Ltd. BWR AA- (SO) 3.86
Sprit Textiles Private Ltd. BWR AA- 1.55
SD Corporation Pvt. Ltd. [ICRA]A1+ 7.21
STCI Finance Ltd. CRISIL A1+ 5.52
Nabha Power Ltd. [ICRA]A1+ 4.58
Birla TMT Holdings Pvt. Ltd. CRISIL A1+ 1.20
Ford Credit India Pvt. Ltd. CRISIL A1+ 1.18
Turquoise Investments AndFinance Private Ltd. CRISIL A1+ 0.60
HDFC Bank Ltd. IND A1+ 2.31
National Bank For AgricultureAnd Rural Development CRISIL A1+ 0.07
State Government Of Rajasthan SOVEREIGN 1.92
Non Convertible Debentures Total 67.62
Zero Coupon Bonds Total 5.41
Commercial Papers Total 20.29
Certificate Of Deposits Total 2.38
State Development Loans Total 1.92
CBLO 0.13
Cash & Other Receivables 2.25
Grand Total 100.00
Issuer Name Rating (%) Of TotalAUM
Issuer Name Rating (%) Of TotalAUM
(Previously known as SBI Magnum IncomeFund – Floating Rate Plan – Savings PlusBond Plan)
Investors understand that their principal
will be at Moderately Low risk
^Investors should consult their financial advisers if in doubt about whether the product is suitable for them.
SovereignNCA (Incl. Cash, Deposits)
AAA,AA+ and Equivalent A1+ Below AA+
39.16
33.86
22.68
2.38 1.92
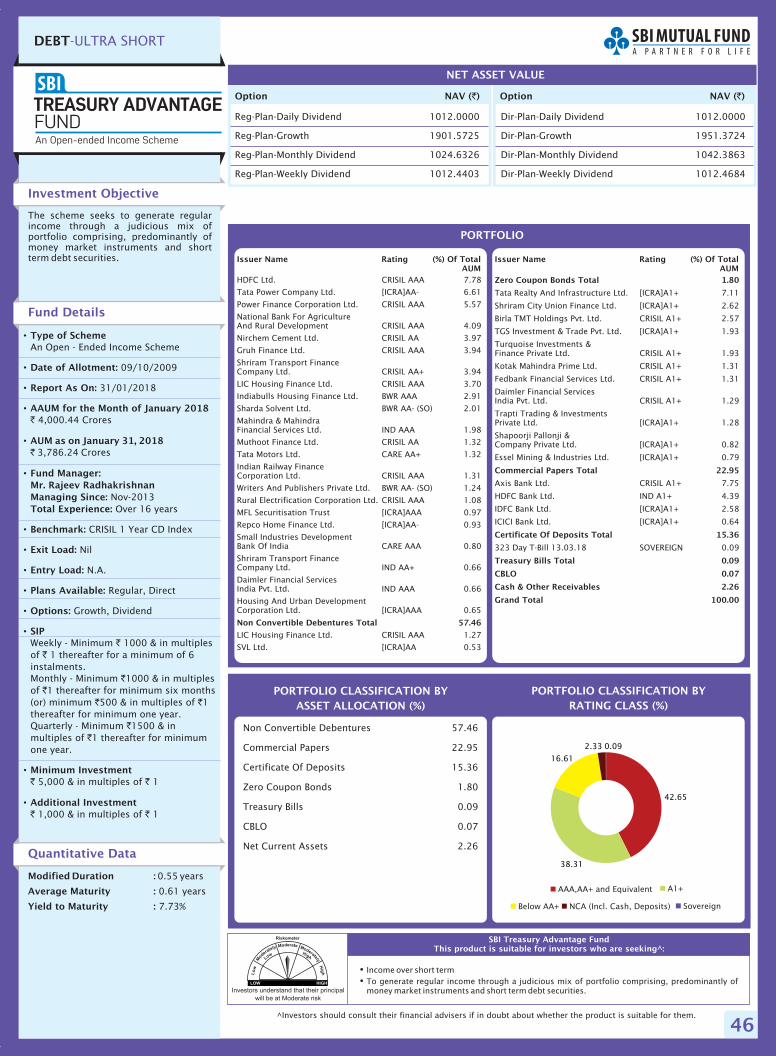
46
Option NAV ( )`
Reg-Plan-Daily Dividend 1012.0000
Reg-Plan-Growth 1901.5725
Reg-Plan-Monthly Dividend 1024.6326
Reg-Plan-Weekly Dividend 1012.4403
NET ASSET VALUE
Option NAV ( )`
�
�
Income over short termTo generate regular income through a judicious mix of portfolio comprising, predominantly ofmoney market instruments and short term debt securities.
SBI Treasury Advantage FundThis product is suitable for investors who are seeking^:
Investment Objective
Quantitative Data
The scheme seeks to generate regularincome through a judicious mix ofportfolio comprising, predominantly ofmoney market instruments and shortterm debt securities.
Fund Details
Modified Duration :
Average Maturity :
Yield to Maturity :
0.55
0.61 years
7.73%
years
PORTFOLIO CLASSIFICATION BYRATING CLASS (%)
Non Convertible Debentures 57.46
Commercial Papers 22.95
Certificate Of Deposits 15.36
Zero Coupon Bonds 1.80
Treasury Bills 0.09
CBLO 0.07
Net Current Assets 2.26
•
•
•
•
•
•
•
•
•
•
•
•
•
•
Type of Scheme
Date of Allotment:
Report As On:
AAUM for the Month of January 2018
AUM as on January 31, 2018
Fund Manager:Mr. Rajeev RadhakrishnanManaging Since:Total Experience:
Benchmark:
Exit Load:
Entry Load:
Plans Available:
Options:
SIP
Minimum Investment
Additional Investment
An Open - Ended Income Scheme
09/10/2009
31/01/2018
4,000.44 Crores
3,786.24 Crores
Nov-2013Over 16 years
CRISIL 1 Year CD Index
Nil
N.A.
Regular, Direct
Growth, Dividend
Weekly - Minimum 1000 & in multiplesof 1 thereafter for a minimum of 6instalments.Monthly - Minimum 1000 & in multiplesof 1 thereafter for minimum six months(or) minimum 500 & in multiples of 1thereafter for minimum one year.Quarterly - Minimum 1500 & inmultiples of 1 thereafter for minimumone year.
5,000 & in multiples of 1
1,000 & in multiples of 1
`
`
`
`
`
`
` `
`
`
` `
` `
AAA,AA+ and Equivalent A1+
Below AA+ SovereignNCA (Incl. Cash, Deposits)
PORTFOLIO CLASSIFICATION BYASSET ALLOCATION (%)
Dir-Plan-Daily Dividend 1012.0000
Dir-Plan-Growth 1951.3724
Dir-Plan-Monthly Dividend 1042.3863
Dir-Plan-Weekly Dividend 1012.4684
DEBT-ULTRA SHORT
PORTFOLIO
HDFC Ltd. CRISIL AAA 7.78
Tata Power Company Ltd. [ICRA]AA- 6.61
Power Finance Corporation Ltd. CRISIL AAA 5.57
National Bank For AgricultureAnd Rural Development CRISIL AAA 4.09
Nirchem Cement Ltd. CRISIL AA 3.97
Gruh Finance Ltd. CRISIL AAA 3.94
Shriram Transport FinanceCompany Ltd. CRISIL AA+ 3.94
LIC Housing Finance Ltd. CRISIL AAA 3.70
Indiabulls Housing Finance Ltd. BWR AAA 2.91
Sharda Solvent Ltd. BWR AA- (SO) 2.01
Mahindra & MahindraFinancial Services Ltd. IND AAA 1.98
Muthoot Finance Ltd. CRISIL AA 1.32
Tata Motors Ltd. CARE AA+ 1.32
Indian Railway FinanceCorporation Ltd. CRISIL AAA 1.31
Writers And Publishers Private Ltd. BWR AA- (SO) 1.24
Rural Electrification Corporation Ltd. CRISIL AAA 1.08
MFL Securitisation Trust [ICRA]AAA 0.97
Repco Home Finance Ltd. [ICRA]AA- 0.93
Small Industries DevelopmentBank Of India CARE AAA 0.80
Shriram Transport FinanceCompany Ltd. IND AA+ 0.66
Daimler Financial ServicesIndia Pvt. Ltd. IND AAA 0.66
Housing And Urban DevelopmentCorporation Ltd. [ICRA]AAA 0.65
LIC Housing Finance Ltd. CRISIL AAA 1.27
SVL Ltd. [ICRA]AA 0.53
Non Convertible Debentures Total 57.46
Zero Coupon Bonds Total 1.80
Commercial Papers Total 22.95
Certificate Of Deposits Total 15.36
Treasury Bills Total 0.09
CBLO 0.07
Cash & Other Receivables 2.26
Grand Total 100.00
Tata Realty And Infrastructure Ltd. [ICRA]A1+ 7.11
Shriram City Union Finance Ltd. [ICRA]A1+ 2.62
Birla TMT Holdings Pvt. Ltd. CRISIL A1+ 2.57
TGS Investment & Trade Pvt. Ltd. [ICRA]A1+ 1.93
Turquoise Investments &Finance Private Ltd. CRISIL A1+ 1.93
Kotak Mahindra Prime Ltd. CRISIL A1+ 1.31
Fedbank Financial Services Ltd. CRISIL A1+ 1.31
Daimler Financial ServicesIndia Pvt. Ltd. CRISIL A1+ 1.29
Trapti Trading & InvestmentsPrivate Ltd. [ICRA]A1+ 1.28
Shapoorji Pallonji &Company Private Ltd. [ICRA]A1+ 0.82
Essel Mining & Industries Ltd. [ICRA]A1+ 0.79
Axis Bank Ltd. CRISIL A1+ 7.75
HDFC Bank Ltd. IND A1+ 4.39
IDFC Bank Ltd. [ICRA]A1+ 2.58
ICICI Bank Ltd. [ICRA]A1+ 0.64
323 Day T-Bill 13.03.18 SOVEREIGN 0.09
Issuer Name Rating (%) Of TotalAUM
Issuer Name Rating (%) Of TotalAUM
Investors understand that their principal
will be at Moderate risk
^Investors should consult their financial advisers if in doubt about whether the product is suitable for them.
42.65
38.31
16.61
2.33 0.09
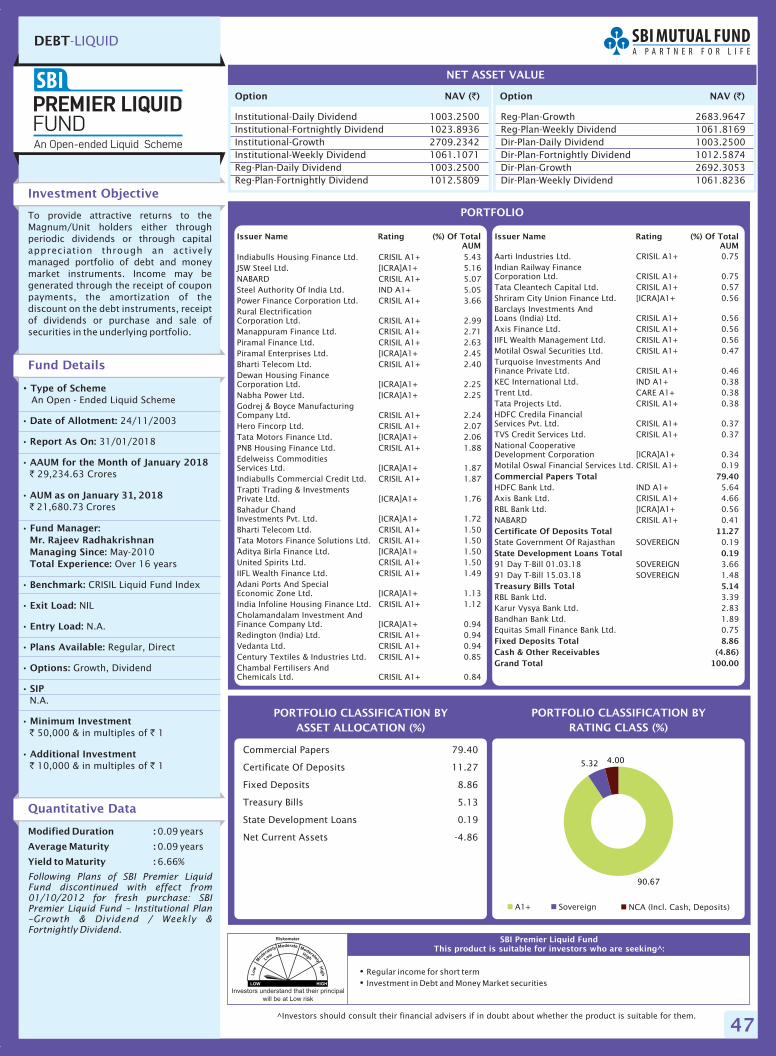
47
DEBT-LIQUID
�
�
Regular income for short termInvestment in Debt and Money Market securities
SBI Premier Liquid FundThis product is suitable for investors who are seeking^:
Investment Objective
Quantitative Data
To provide attractive returns to theMagnum/Unit holders either throughperiodic dividends or through capitalappreciation through an activelymanaged portfolio of debt and moneymarket instruments. Income may begenerated through the receipt of couponpayments, the amortization of thediscount on the debt instruments, receiptof dividends or purchase and sale ofsecurities in the underlying portfolio.
Fund Details
Modified Duration :
Average Maturity :
Yield to Maturity :
0.09
0.09 years
6.66%
years
Following Plans of SBI Premier LiquidFund discontinued with effect from01/10/2012 for fresh purchase: SBIPremier Liquid Fund – Institutional Plan–Growth & Dividend / Weekly &Fortnightly Dividend.
PORTFOLIO CLASSIFICATION BYRATING CLASS (%)
Commercial Papers 79.40
Certificate Of Deposits 11.27
Fixed Deposits 8.86
Treasury Bills 5.13
State Development Loans 0.19
Net Current Assets -4.86
• Type of Scheme
Date of Allotment:
Report As On:
AAUM for the Month of January 2018
AUM as on January 31, 2018
Fund Manager:Mr. Rajeev RadhakrishnanManaging Since:Total Experience:
Benchmark:
Exit Load:
Entry Load:
Plans Available:
Options:
SIP
Minimum Investment
Additional Investment
An Open - Ended Liquid Scheme
24/11/2003
31/01/2018
29,234.63 Crores
21,680.73 Crores
May-2010Over 16 years
CRISIL Liquid Fund Index
NIL
N.A.
Regular, Direct
Growth, Dividend
N.A.
50,000 & in multiples of 1
10,000 & in multiples of 1
•
•
•
•
•
•
•
•
•
•
•
•
•
`
`
` `
` `
PORTFOLIO CLASSIFICATION BYASSET ALLOCATION (%)
Option NAV ( )`
Institutional-Daily Dividend 1003.2500Institutional-Fortnightly Dividend 1023.8936Institutional-Growth 2709.2342Institutional-Weekly Dividend 1061.1071Reg-Plan-Daily Dividend 1003.2500Reg-Plan-Fortnightly Dividend 1012.5809
NET ASSET VALUE
Option NAV ( )`
Reg-Plan-Growth 2683.9647Reg-Plan-Weekly Dividend 1061.8169Dir-Plan-Daily Dividend 1003.2500Dir-Plan-Fortnightly Dividend 1012.5874Dir-Plan-Growth 2692.3053Dir-Plan-Weekly Dividend 1061.8236
PORTFOLIO
Indiabulls Housing Finance Ltd. CRISIL A1+ 5.43JSW Steel Ltd. [ICRA]A1+ 5.16NABARD CRISIL A1+ 5.07Steel Authority Of India Ltd. IND A1+ 5.05Power Finance Corporation Ltd. CRISIL A1+ 3.66Rural ElectrificationCorporation Ltd. CRISIL A1+ 2.99Manappuram Finance Ltd. CRISIL A1+ 2.71Piramal Finance Ltd. CRISIL A1+ 2.63Piramal Enterprises Ltd. [ICRA]A1+ 2.45Bharti Telecom Ltd. CRISIL A1+ 2.40Dewan Housing FinanceCorporation Ltd. [ICRA]A1+ 2.25Nabha Power Ltd. [ICRA]A1+ 2.25Godrej & Boyce ManufacturingCompany Ltd. CRISIL A1+ 2.24Hero Fincorp Ltd. CRISIL A1+ 2.07Tata Motors Finance Ltd. [ICRA]A1+ 2.06PNB Housing Finance Ltd. CRISIL A1+ 1.88Edelweiss CommoditiesServices Ltd. [ICRA]A1+ 1.87Indiabulls Commercial Credit Ltd. CRISIL A1+ 1.87Trapti Trading & InvestmentsPrivate Ltd. [ICRA]A1+ 1.76Bahadur ChandInvestments Pvt. Ltd. [ICRA]A1+ 1.72Bharti Telecom Ltd. CRISIL A1+ 1.50Tata Motors Finance Solutions Ltd. CRISIL A1+ 1.50Aditya Birla Finance Ltd. [ICRA]A1+ 1.50United Spirits Ltd. CRISIL A1+ 1.50IIFL Wealth Finance Ltd. CRISIL A1+ 1.49Adani Ports And SpecialEconomic Zone Ltd. [ICRA]A1+ 1.13India Infoline Housing Finance Ltd. CRISIL A1+ 1.12Cholamandalam Investment AndFinance Company Ltd. [ICRA]A1+ 0.94Redington (India) Ltd. CRISIL A1+ 0.94Vedanta Ltd. CRISIL A1+ 0.94Century Textiles & Industries Ltd. CRISIL A1+ 0.85Chambal Fertilisers AndChemicals Ltd. CRISIL A1+ 0.84
Aarti Industries Ltd. CRISIL A1+ 0.75Indian Railway FinanceCorporation Ltd. CRISIL A1+ 0.75Tata Cleantech Capital Ltd. CRISIL A1+ 0.57Shriram City Union Finance Ltd. [ICRA]A1+ 0.56Barclays Investments AndLoans (India) Ltd. CRISIL A1+ 0.56Axis Finance Ltd. CRISIL A1+ 0.56IIFL Wealth Management Ltd. CRISIL A1+ 0.56Motilal Oswal Securities Ltd. CRISIL A1+ 0.47Turquoise Investments AndFinance Private Ltd. CRISIL A1+ 0.46KEC International Ltd. IND A1+ 0.38Trent Ltd. CARE A1+ 0.38Tata Projects Ltd. CRISIL A1+ 0.38HDFC Credila FinancialServices Pvt. Ltd. CRISIL A1+ 0.37TVS Credit Services Ltd. CRISIL A1+ 0.37National CooperativeDevelopment Corporation [ICRA]A1+ 0.34Motilal Oswal Financial Services Ltd. CRISIL A1+ 0.19
HDFC Bank Ltd. IND A1+ 5.64Axis Bank Ltd. CRISIL A1+ 4.66RBL Bank Ltd. [ICRA]A1+ 0.56NABARD CRISIL A1+ 0.41
State Government Of Rajasthan SOVEREIGN 0.19
91 Day T-Bill 01.03.18 SOVEREIGN 3.6691 Day T-Bill 15.03.18 SOVEREIGN 1.48
RBL Bank Ltd. 3.39Karur Vysya Bank Ltd. 2.83Bandhan Bank Ltd. 1.89Equitas Small Finance Bank Ltd. 0.75
Commercial Papers Total 79.40
Certificate Of Deposits Total 11.27
State Development Loans Total 0.19
Treasury Bills Total 5.14
Fixed Deposits Total 8.86Cash & Other Receivables (4.86)Grand Total 100.00
Issuer Name Rating (%) Of TotalAUM
Issuer Name Rating (%) Of TotalAUM
Investors understand that their principal
will be at Low risk
^Investors should consult their financial advisers if in doubt about whether the product is suitable for them.
A1+ Sovereign NCA (Incl. Cash, Deposits)
90.67
5.32 4.00
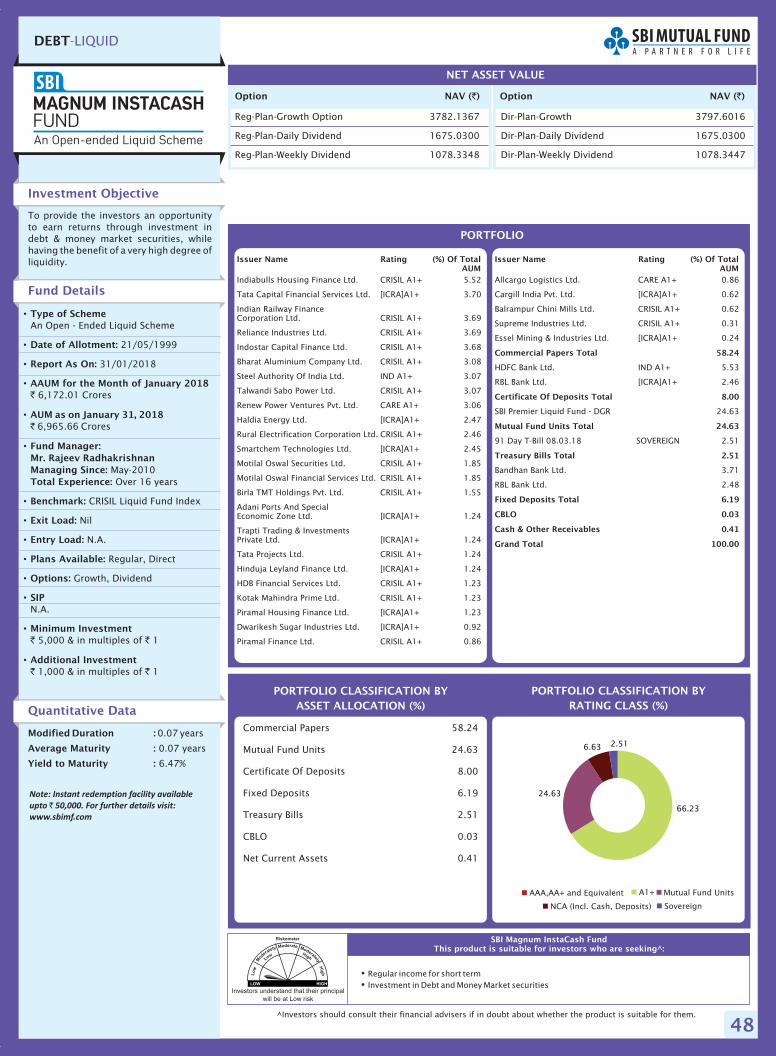
48
�
�
Regular income for short termInvestment in Debt and Money Market securities
SBI Magnum InstaCash FundThis product is suitable for investors who are seeking^:
Investment Objective
Quantitative Data
To provide the investors an opportunityto earn returns through investment indebt & money market securities, whilehaving the benefit of a very high degree ofliquidity.
Fund Details
Modified Duration :
Average Maturity :
Yield to Maturity :
0.07
0.07 years
6.47%
years
PORTFOLIO CLASSIFICATION BYRATING CLASS (%)
Commercial Papers 58.24
Mutual Fund Units 24.63
Certificate Of Deposits 8.00
Fixed Deposits 6.19
Treasury Bills 2.51
CBLO 0.03
Net Current Assets 0.41
•
•
•
•
•
•
•
•
•
•
•
•
•
•
Type of Scheme
Date of Allotment:
Report As On:
AAUM for the Month of January 2018
AUM as on January 31, 2018
Fund Manager:Mr. Rajeev RadhakrishnanManaging Since:Total Experience:
Benchmark:
Exit Load:
Entry Load:
Plans Available:
Options:
SIP
Minimum Investment
Additional Investment
An Open - Ended Liquid Scheme
21/05/1999
31/01/2018
6,172.01 Crores
6,965.66 Crores
May-2010Over 16 years
CRISIL Liquid Fund Index
Nil
N.A.
Regular, Direct
Growth, Dividend
N.A.
5,000 & in multiples of 1
1,000 & in multiples of 1
`
`
` `
` `
PORTFOLIO CLASSIFICATION BYASSET ALLOCATION (%)
DEBT-LIQUID
Option NAV ( )`
Reg-Plan-Growth Option 3782.1367
Reg-Plan-Daily Dividend 1675.0300
Reg-Plan-Weekly Dividend 1078.3348
NET ASSET VALUE
Option NAV ( )`
Dir-Plan-Growth 3797.6016
Dir-Plan-Daily Dividend 1675.0300
Dir-Plan-Weekly Dividend 1078.3447
PORTFOLIO
Indiabulls Housing Finance Ltd. CRISIL A1+ 5.52
Tata Capital Financial Services Ltd. [ICRA]A1+ 3.70
Indian Railway FinanceCorporation Ltd. CRISIL A1+ 3.69
Reliance Industries Ltd. CRISIL A1+ 3.69
Indostar Capital Finance Ltd. CRISIL A1+ 3.68
Bharat Aluminium Company Ltd. CRISIL A1+ 3.08
Steel Authority Of India Ltd. IND A1+ 3.07
Talwandi Sabo Power Ltd. CRISIL A1+ 3.07
Renew Power Ventures Pvt. Ltd. CARE A1+ 3.06
Haldia Energy Ltd. [ICRA]A1+ 2.47
Rural Electrification Corporation Ltd. CRISIL A1+ 2.46
Smartchem Technologies Ltd. [ICRA]A1+ 2.45
Motilal Oswal Securities Ltd. CRISIL A1+ 1.85
Motilal Oswal Financial Services Ltd. CRISIL A1+ 1.85
Birla TMT Holdings Pvt. Ltd. CRISIL A1+ 1.55
Adani Ports And SpecialEconomic Zone Ltd. [ICRA]A1+ 1.24
Trapti Trading & InvestmentsPrivate Ltd. [ICRA]A1+ 1.24
Tata Projects Ltd. CRISIL A1+ 1.24
Hinduja Leyland Finance Ltd. [ICRA]A1+ 1.24
HDB Financial Services Ltd. CRISIL A1+ 1.23
Kotak Mahindra Prime Ltd. CRISIL A1+ 1.23
Piramal Housing Finance Ltd. [ICRA]A1+ 1.23
Dwarikesh Sugar Industries Ltd. [ICRA]A1+ 0.92
Piramal Finance Ltd. CRISIL A1+ 0.86
Allcargo Logistics Ltd. CARE A1+ 0.86
Cargill India Pvt. Ltd. [ICRA]A1+ 0.62
Balrampur Chini Mills Ltd. CRISIL A1+ 0.62
Supreme Industries Ltd. CRISIL A1+ 0.31
Essel Mining & Industries Ltd. [ICRA]A1+ 0.24
HDFC Bank Ltd. IND A1+ 5.53
RBL Bank Ltd. [ICRA]A1+ 2.46
SBI Premier Liquid Fund - DGR 24.63
91 Day T-Bill 08.03.18 SOVEREIGN 2.51
Bandhan Bank Ltd. 3.71
RBL Bank Ltd. 2.48
Commercial Papers Total 58.24
Certificate Of Deposits Total 8.00
Mutual Fund Units Total 24.63
Treasury Bills Total 2.51
Fixed Deposits Total 6.19
CBLO 0.03
Cash & Other Receivables 0.41
Grand Total 100.00
Issuer Name Rating (%) Of TotalAUM
Issuer Name Rating (%) Of TotalAUM
Investors understand that their principal
will be at Low risk
^Investors should consult their financial advisers if in doubt about whether the product is suitable for them.
Note: Instant redemption facility available
upto 50,000. For further details visit:
www.sbimf.com
`
AAA,AA+ and Equivalent A1+
SovereignNCA (Incl. Cash, Deposits)
Mutual Fund Units
66.23
24.63
6.63 2.51
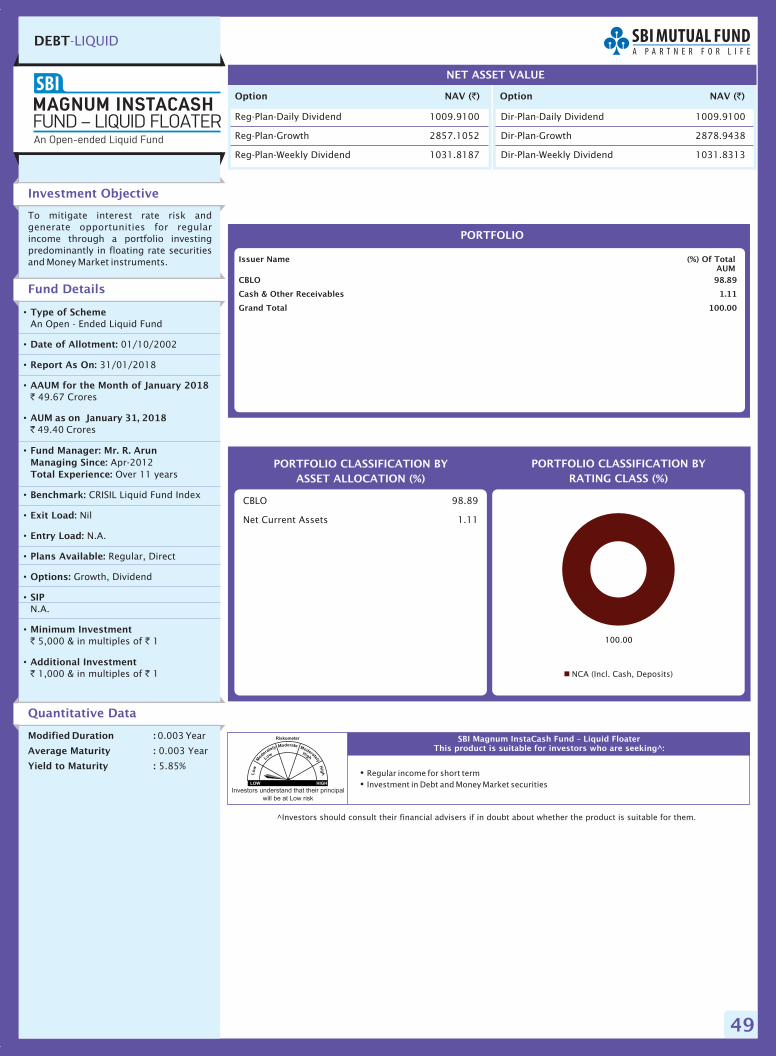
49
�
�
Regular income for short termInvestment in Debt and Money Market securities
SBI Magnum InstaCash Fund – Liquid FloaterThis product is suitable for investors who are seeking^:
Investment Objective
Quantitative Data
To mitigate interest rate risk andgenerate opportunities for regularincome through a portfolio investingpredominantly in floating rate securitiesand Money Market instruments.
Fund Details
Modified Duration :
Average Maturity :
Yield to Maturity :
0.003 Year
0.003 Year
5.85%
PORTFOLIO CLASSIFICATION BYRATING CLASS (%)
CBLO 98.89
Net Current Assets 1.11
•
•
•
•
•
•
•
•
•
•
•
•
•
•
Type of Scheme
Date of Allotment:
Report As On:
AAUM for the Month of January 2018
AUM as on January 31, 2018
Fund Manager: Mr. R. ArunManaging Since:Total Experience:
Benchmark:
Exit Load:
Entry Load:
Plans Available:
Options:
SIP
Minimum Investment
Additional Investment
An Open - Ended Liquid Fund
01/10/2002
31/01/2018
49.67 Crores
49.40 Crores
Apr-2012Over 11 years
CRISIL Liquid Fund Index
Nil
N.A.
Regular, Direct
Growth, Dividend
N.A.
5,000 & in multiples of 1
1,000 & in multiples of 1
`
`
` `
` `
PORTFOLIO CLASSIFICATION BYASSET ALLOCATION (%)
DEBT-LIQUID
Option NAV ( )`
Reg-Plan-Daily Dividend 1009.9100
Reg-Plan-Growth 2857.1052
Reg-Plan-Weekly Dividend 1031.8187
NET ASSET VALUE
Option NAV ( )`
Dir-Plan-Daily Dividend 1009.9100
Dir-Plan-Growth 2878.9438
Dir-Plan-Weekly Dividend 1031.8313
PORTFOLIO
CBLO 98.89
Cash & Other Receivables 1.11
Grand Total 100.00
Issuer Name (%) Of TotalAUM
Investors understand that their principal
will be at Low risk
^Investors should consult their financial advisers if in doubt about whether the product is suitable for them.
NCA (Incl. Cash, Deposits)
100.00
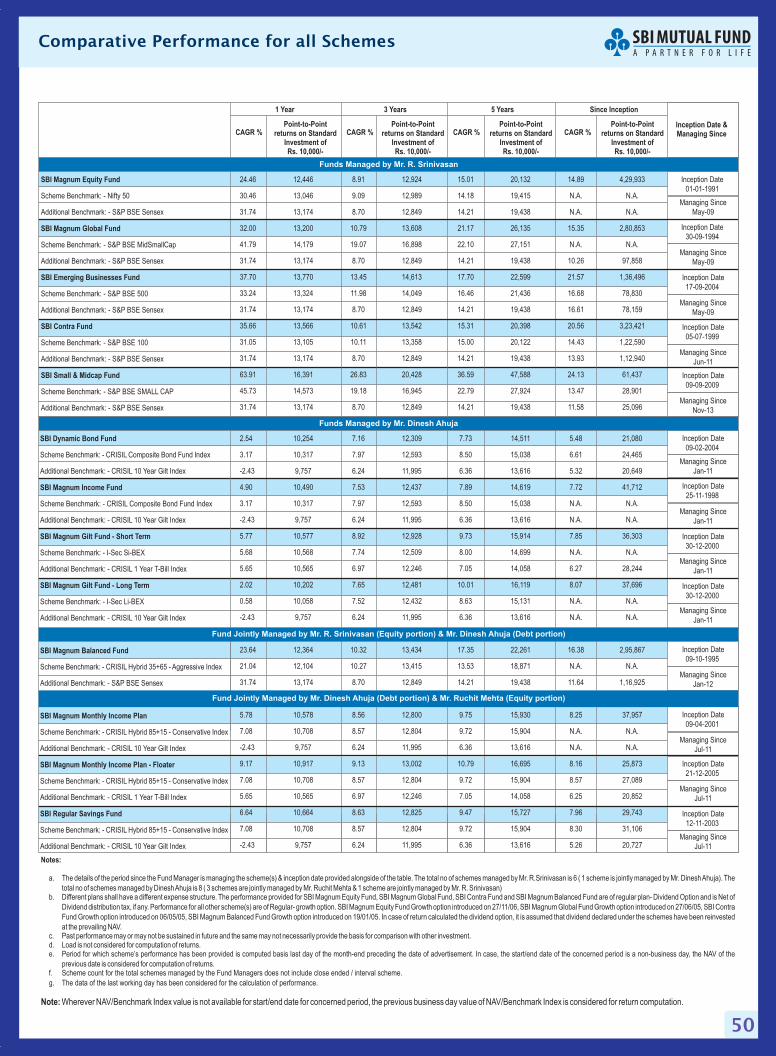
50
Comparative Performance for all Schemes
Note: Wherever NAV/Benchmark Index value is not available for start/end date for concerned period, the previous business day value of NAV/Benchmark Index is considered for return computation.
Managing Since
Jan-11
Inception Date
09-02-2004
Managing Since
Jan-11
Inception Date
25-11-1998
Managing Since
Jan-11
Inception Date
30-12-2000
Inception Date
30-12-2000
Managing Since
Jan-11
Inception Date
09-10-1995
Inception Date
09-04-2001
Inception Date
12-11-2003
Inception Date
21-12-2005
Managing Since
Jan-12
Managing Since
Jul-11
Managing Since
Jul-11
Managing Since
Jul-11
2.54 10,254 7.16 12,309 7.73 14,511 5.48 21,080
3.17 10,317 7.97 12,593 8.50 15,038 6.61 24,465
-2.43 9,757 6.24 11,995 6.36 13,616 5.32 20,649
4.90 10,490 7.53 12,437 7.89 14,619 7.72 41,712
3.17 10,317 7.97 12,593 8.50 15,038 N.A. N.A.
-2.43 9,757 6.24 11,995 6.36 13,616 N.A. N.A.
5.77 10,577 8.92 12,928 9.73 15,914 7.85 36,303
5.68 10,568 7.74 12,509 8.00 14,699 N.A. N.A.
5.65 10,565 6.97 12,246 7.05 14,058 6.27 28,244
2.02 10,202 7.65 12,481 10.01 16,119 8.07 37,696
0.58 10,058 7.52 12,432 8.63 15,131 N.A. N.A.
-2.43 9,757 6.24 11,995 6.36 13,616 N.A. N.A.
23.64 12,364 10.32 13,434 17.35 22,261 16.38 2,95,867
21.04 12,104 10.27 13,415 13.53 18,871 N.A. N.A.
31.74 13,174 8.70 12,849 14.21 19,438 11.64 1,16,925
5.78 10,578 8.56 12,800 9.75 15,930 8.25 37,957
7.08 10,708 8.57 12,804 9.72 15,904 N.A. N.A.
-2.43 9,757 6.24 11,995 6.36 13,616 N.A. N.A.
9.17 10,917 9.13 13,002 10.79 16,695 8.16 25,873
7.08 10,708 8.57 12,804 9.72 15,904 8.57 27,089
5.65 10,565 6.97 12,246 7.05 14,058 6.25 20,852
6.64 10,664 8.63 12,825 9.47 15,727 7.96 29,743
7.08 10,708 8.57 12,804 9.72 15,904 8.30 31,106
-2.43 9,757 6.24 11,995 6.36 13,616 5.26 20,727
SBI Dynamic Bond Fund
SBI Magnum Income Fund
SBI Magnum Gilt Fund - Short Term
SBI Magnum Gilt Fund - Long Term
SBI Magnum Balanced Fund
SBI Magnum Monthly Income Plan
SBI Magnum Monthly Income Plan - Floater
SBI Regular Savings Fund
Scheme Benchmark: - CRISIL Composite Bond Fund Index
Additional Benchmark: - CRISIL 10 Year Gilt Index
Scheme Benchmark: - CRISIL Composite Bond Fund Index
Additional Benchmark: - CRISIL 10 Year Gilt Index
Scheme Benchmark: - I-Sec Si-BEX
Additional Benchmark: - CRISIL 1 Year T-Bill Index
Scheme Benchmark: - I-Sec Li-BEX
Additional Benchmark: - CRISIL 10 Year Gilt Index
Scheme Benchmark: - CRISIL Hybrid 35+65 - Aggressive Index
Additional Benchmark: - S&P BSE Sensex
Scheme Benchmark: - CRISIL Hybrid 85+15 - Conservative Index
Additional Benchmark: - CRISIL 10 Year Gilt Index
Scheme Benchmark: - CRISIL Hybrid 85+15 - Conservative Index
Additional Benchmark: - CRISIL 1 Year T-Bill Index
Scheme Benchmark: - CRISIL Hybrid 85+15 - Conservative Index
Additional Benchmark: - CRISIL 10 Year Gilt Index
Funds Managed by Mr. Dinesh Ahuja
CAGR %Point-to-Point
returns on StandardInvestment ofRs. 10,000/-
CAGR %Point-to-Point
returns on StandardInvestment ofRs. 10,000/-
CAGR %Point-to-Point
returns on StandardInvestment ofRs. 10,000/-
3 Years 5 Years
CAGR %Point-to-Point
returns on StandardInvestment ofRs. 10,000/-
Since Inception
Inception Date &Managing Since
Managing Since
May-09
Inception Date
01-01-1991
1 Year
Managing Since
May-09
Inception Date
30-09-1994
Managing Since
May-09
Inception Date
17-09-2004
Inception Date
05-07-1999
Managing Since
Jun-11
Inception Date
09-09-2009
Managing Since
Nov-13
24.46 12,446 8.91 12,924 15.01 20,132 14.89 4,29,933
30.46 13,046 9.09 12,989 14.18 19,415 N.A. N.A.
31.74 13,174 8.70 12,849 14.21 19,438 N.A. N.A.
32.00 13,200 10.79 13,608 21.17 26,135 15.35 2,80,853
41.79 14,179 19.07 16,898 22.10 27,151 N.A. N.A.
31.74 13,174 8.70 12,849 14.21 19,438 10.26 97,858
37.70 13,770 13.45 14,613 17.70 22,599 21.57 1,36,496
33.24 13,324 11.98 14,049 16.46 21,436 16.68 78,830
31.74 13,174 8.70 12,849 14.21 19,438 16.61 78,159
35.66 13,566 10.61 13,542 15.31 20,398 20.56 3,23,421
31.05 13,105 10.11 13,358 15.00 20,122 14.43 1,22,590
31.74 13,174 8.70 12,849 14.21 19,438 13.93 1,12,940
63.91 16,391 26.83 20,428 36.59 47,588 24.13 61,437
45.73 14,573 19.18 16,945 22.79 27,924 13.47 28,901
31.74 13,174 8.70 12,849 14.21 19,438 11.58 25,096
SBI Magnum Equity Fund
SBI Magnum Global Fund
SBI Emerging Businesses Fund
SBI Contra Fund
SBI Small & Midcap Fund
Scheme Benchmark: - Nifty 50
Additional Benchmark: - S&P BSE Sensex
Scheme Benchmark: - S&P BSE MidSmallCap
Additional Benchmark: - S&P BSE Sensex
Scheme Benchmark: - S&P BSE 500
Additional Benchmark: - S&P BSE Sensex
Scheme Benchmark: - S&P BSE 100
Additional Benchmark: - S&P BSE Sensex
Scheme Benchmark: - S&P BSE SMALL CAP
Additional Benchmark: - S&P BSE Sensex
Funds Managed by Mr. R. Srinivasan
Notes:
a.
c. Past performance may or may not be sustained in future and the same may not necessarily provide the basis for comparison with other investment.d. Load is not considered for computation of returns.e. Period for which scheme’s performance has been provided is computed basis last day of the month-end preceding the date of advertisement. In case, the start/end date of the concerned period is a non-business day, the NAV of the
previous date is considered for computation of returns.
The details of the period since the Fund Manager is managing the scheme(s) & inception date provided alongside of the table. The total no of schemes managed by Mr. R.Srinivasan is 6 ( 1 scheme is jointly managed by Mr. DineshAhuja). The
total no of schemes managed by DineshAhuja is 8 ( 3 schemes are jointly managed by Mr. Ruchit Mehta & 1 scheme are jointly managed by Mr. R. Srinivasan)b. Different plans shall have a different expense structure. The performance provided for SBI Magnum Equity Fund, SBI Magnum Global Fund, SBI Contra Fund and SBI Magnum Balanced Fund are of regular plan- Dividend Option and is Net of
Dividend distribution tax, if any. Performance for all other scheme(s) are of Regular- growth option. SBI Magnum Equity Fund Growth option introduced on 27/11/06, SBI Magnum Global Fund Growth option introduced on 27/06/05, SBI Contra
Fund Growth option introduced on 06/05/05, SBI Magnum Balanced Fund Growth option introduced on 19/01/05. In case of return calculated the dividend option, it is assumed that dividend declared under the schemes have been reinvested
at the prevailing NAV.
f. Scheme count for the total schemes managed by the Fund Managers does not include close ended / interval scheme.
g. The data of the last working day has been considered for the calculation of performance.
Fund Jointly Managed by Mr. R. Srinivasan (Equity portion) & Mr. Dinesh Ahuja (Debt portion)
Fund Jointly Managed by Mr. Dinesh Ahuja (Debt portion) & Mr. Ruchit Mehta (Equity portion)
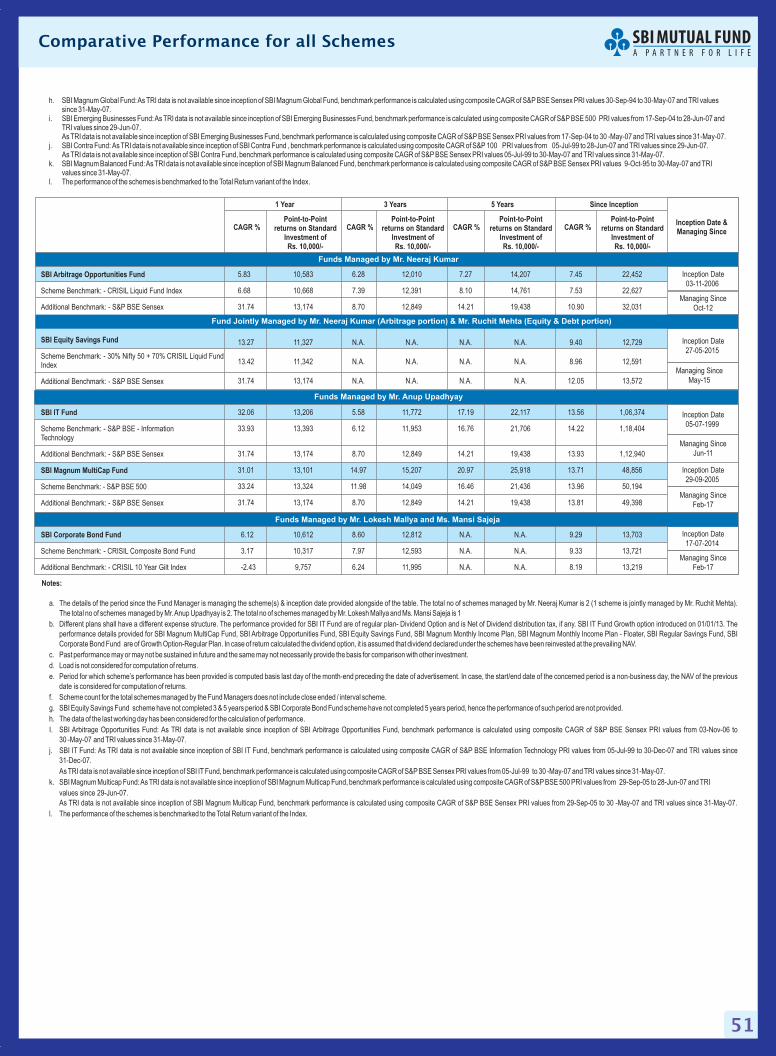
51
Comparative Performance for all Schemes
Notes:
a.
b.
c. Past performance may or may not be sustained in future and the same may not necessarily provide the basis for comparison with other investment.
d. Load is not considered for computation of returns.
e. Period for which scheme’s performance has been provided is computed basis last day of the month-end preceding the date of advertisement. In case, the start/end date of the concerned period is a non-business day, the NAV of the previous
date is considered for computation of returns.
f. Scheme count for the total schemes managed by the Fund Managers does not include ended / interval scheme.
The details of the period since the Fund Manager is managing the scheme(s) & inception date provided alongside of the table. The total no of schemes managed by Mr. Neeraj Kumar is 2 (1 scheme is jointly managed by Mr. Ruchit Mehta).
The total no of schemes managed by Mr.Anup Upadhyay is 2. The total no of schemes managed by Mr. Lokesh Mallya and Ms. Mansi Sajeja is 1
Different plans shall have a different expense structure. The performance provided for SBI IT Fund are of regular plan- Dividend Option and is Net of Dividend distribution tax, if any. SBI IT Fund Growth option introduced on 01/01/13. The
performance details provided for SBI Magnum MultiCap Fund, SBI Arbitrage Opportunities Fund, SBI Equity Savings Fund, SBI Magnum Monthly Income Plan, SBI Magnum Monthly Income Plan - Floater, SBI Regular Savings Fund, SBI
Corporate Bond Fund are of Growth Option-Regular Plan. In case of return calculated the dividend option, it is assumed that dividend declared under the schemes have been reinvested at the prevailing NAV.
close
g. SBI Equity Savings Fund scheme have not completed 3 & 5 years period & SBI Corporate Bond Fund scheme have not completed 5 years period, hence the performance of such period are not provided.
h. The data of the last working day has been considered for the calculation of performance.
I. SBI Arbitrage Opportunities Fund: As TRI data is not available since inception of SBI Arbitrage Opportunities Fund, benchmark performance is calculated using composite CAGR of S&P BSE Sensex PRI values from 03-Nov-06 to
30 -May-07 and TRI values since 31-May-07.
j. SBI IT Fund: As TRI data is not available since inception of SBI IT Fund, benchmark performance is calculated using composite CAGR of S&P BSE Information Technology PRI values from 05-Jul-99 to 30-Dec-07 and TRI values since
31-Dec-07.
As TRI data is not available since inception of SBI IT Fund, benchmark performance is calculated using composite CAGR of S&P BSE Sensex PRI values from 05-Jul-99 to 30 -May-07 and TRI values since 31-May-07.
k. SBI Magnum Multicap Fund:As TRI data is not available since inception of SBI Magnum Multicap Fund, benchmark performance is calculated using composite CAGR of S&P BSE 500 PRI values from 29-Sep-05 to 28-Jun-07 and TRI
values since 29-Jun-07.
As TRI data is not available since inception of SBI Magnum Multicap Fund, benchmark performance is calculated using composite CAGR of S&P BSE Sensex PRI values from 29-Sep-05 to 30 -May-07 and TRI values since 31-May-07.
l. The performance of the schemes is benchmarked to the Total Return variant of the Index.
CAGR %Point-to-Point
returns on StandardInvestment ofRs. 10,000/-
CAGR %Point-to-Point
returns on StandardInvestment ofRs. 10,000/-
CAGR %Point-to-Point
returns on StandardInvestment ofRs. 10,000/-
3 Years 5 Years
CAGR %Point-to-Point
returns on StandardInvestment ofRs. 10,000/-
Since Inception
Inception Date &Managing Since
Managing Since
Oct-12
Inception Date
03-11-2006SBI Arbitrage Opportunities Fund
SBI Equity Savings Fund
Scheme Benchmark: - CRISIL Liquid Fund Index
Additional Benchmark: - S&P BSE Sensex
Scheme Benchmark: - 30% Nifty 50 + 70% CRISIL Liquid FundIndex
Additional Benchmark: - S&P BSE Sensex
5.83 10,583 6.28 12,010 7.27 14,207 7.45 22,452
6.68 10,668 7.39 12,391 8.10 14,761 7.53 22,627
31.74 13,174 8.70 12,849 14.21 19,438 10.90 32,031
13.27 11,327 N.A. N.A. N.A. N.A. 9.40 12,729
13.42 11,342 N.A. N.A. N.A. N.A. 8.96 12,591
31.74 13,174 N.A. N.A. N.A. N.A. 12.05 13,572
1 Year
Managing Since
May-15
Inception Date
27-05-2015
Fund Jointly Managed by Mr. Neeraj Kumar (Arbitrage portion) & Mr. Ruchit Mehta (Equity & Debt portion)
Funds Managed by Mr. Neeraj Kumar
Managing Since
Jun-11
Inception Date
05-07-1999
SBI IT Fund
SBI Magnum MultiCap Fund
Scheme Benchmark: - S&P BSE - InformationTechnology
Additional Benchmark: - S&P BSE Sensex
Scheme Benchmark: - S&P BSE 500
Additional Benchmark: - S&P BSE Sensex
32.06 13,206 5.58 11,772 17.19 22,117 13.56 1,06,374
33.93 13,393 6.12 11,953 16.76 21,706 14.22 1,18,404
31.74 13,174 8.70 12,849 14.21 19,438 13.93 1,12,940
31.01 13,101 14.97 15,207 20.97 25,918 13.71 48,856
33.24 13,324 11.98 14,049 16.46 21,436 13.96 50,194
31.74 13,174 8.70 12,849 14.21 19,438 13.81 49,398Managing Since
Feb-17
Inception Date
29-09-2005
Managing Since
Feb-17
Inception Date
17-07-2014SBI Corporate Bond Fund
Scheme Benchmark: - CRISIL Composite Bond Fund
Additional Benchmark: - CRISIL 10 Year Gilt Index
6.12 10,612 8.60 12,812 N.A. N.A. 9.29 13,703
3.17 10,317 7.97 12,593 N.A. N.A. 9.33 13,721
-2.43 9,757 6.24 11,995 N.A. N.A. 8.19 13,219
Funds Managed by Mr. Lokesh Mallya and Ms. Mansi Sajeja
Funds Managed by Mr. Anup Upadhyay
h.
j. SBI Contra Fund: As TRI data is not available since inception of SBI Contra Fund , benchmark performance is calculated using composite CAGR of S&P 100 PRI values from 05-Jul-99 to 28-Jun-07 and TRI values since 29-Jun-07.As TRI data is not available since inception of SBI Contra Fund, benchmark performance is calculated using composite CAGR of S&P BSE Sensex PRI values 05-Jul-99 to 30-May-07 and TRI values since 31-May-07.
k. SBI Magnum Balanced Fund:As TRI data is not available since inception of SBI Magnum Balanced Fund, benchmark performance is calculated using composite CAGR of S&P BSE Sensex PRI values 9-Oct-95 to 30-May-07 and TRIvalues since 31-May-07.
SBI Magnum Global Fund:As TRI data is not available since inception of SBI Magnum Global Fund, benchmark performance is calculated using composite CAGR of S&P BSE Sensex PRI values 30-Sep-94 to 30-May-07 and TRI valuessince 31-May-07.
i. SBI Emerging Businesses Fund:As TRI data is not available since inception of SBI Emerging Businesses Fund, benchmark performance is calculated using composite CAGR of S&P BSE 500 PRI values from 17-Sep-04 to 28-Jun-07 andTRI values since 29-Jun-07.As TRI data is not available since inception of SBI Emerging Businesses Fund, benchmark performance is calculated using composite CAGR of S&P BSE Sensex PRI values from 17-Sep-04 to 30 -May-07 and TRI values since 31-May-07.
l. The performance of the schemes is benchmarked to the Total Return variant of the Index.
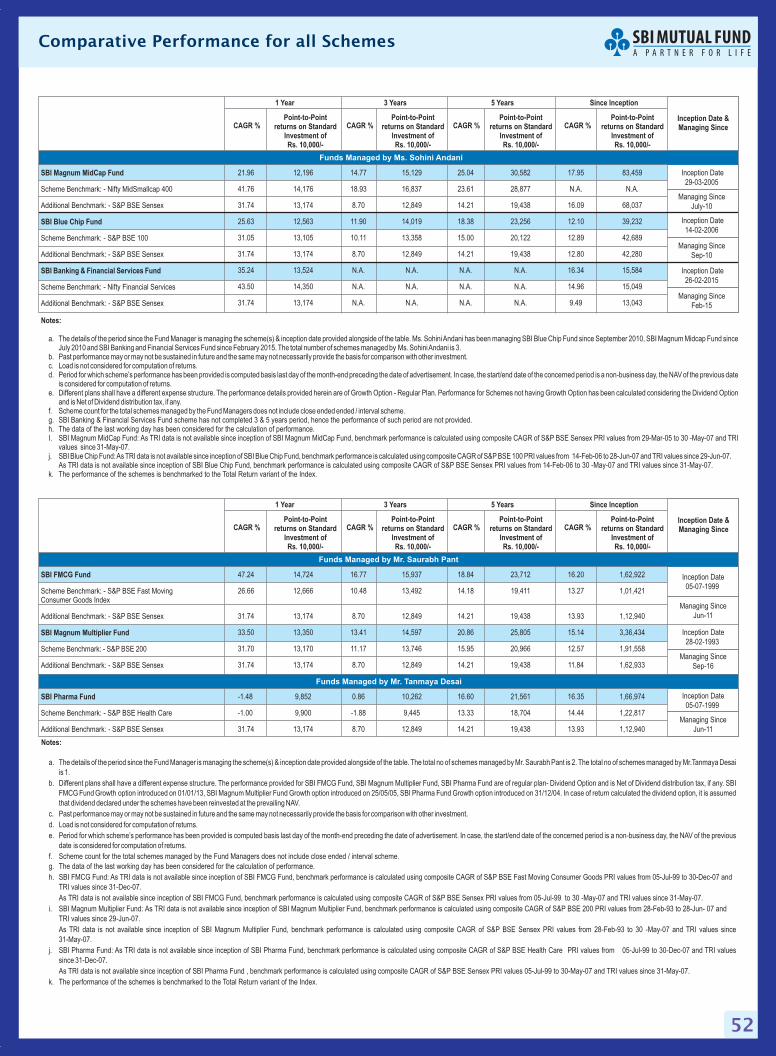
52
Comparative Performance for all Schemes
Notes:
a.
b.
c. Past performance may or may not be sustained in future and the same may not necessarily provide the basis for comparison with other investment.
d. Load is not considered for computation of returns.
e. Period for which scheme’s performance has been provided is computed basis last day of the month-end preceding the date of advertisement. In case, the start/end date of the concerned period is a non-business day, the NAV of the previous
date is considered for computation of returns.
f. Scheme count for the total schemes managed by the Fund Managers does not include ended / interval scheme.
The details of the period since the Fund Manager is managing the scheme(s) & inception date provided alongside of the table. The total no of schemes managed by Mr. Saurabh Pant is 2. The total no of schemes managed by Mr.Tanmaya Desai
is 1.
Different plans shall have a different expense structure. The performance provided for SBI FMCG Fund, SBI Magnum Multiplier Fund, SBI Pharma Fund are of regular plan- Dividend Option and is Net of Dividend distribution tax, if any. SBI
FMCG Fund Growth option introduced on 01/01/13, SBI Magnum Multiplier Fund Growth option introduced on 25/05/05, SBI Pharma Fund Growth option introduced on 31/12/04. In case of return calculated the dividend option, it is assumed
that dividend declared under the schemes have been reinvested at the prevailing NAV.
close
g. The data of the last working day has been considered for the calculation of performance.
h. SBI FMCG Fund: As TRI data is not available since inception of SBI FMCG Fund, benchmark performance is calculated using composite CAGR of S&P BSE Fast Moving Consumer Goods PRI values from 05-Jul-99 to 30-Dec-07 and
TRI values since 31-Dec-07.
As TRI data is not available since inception of SBI FMCG Fund, benchmark performance is calculated using composite CAGR of S&P BSE Sensex PRI values from 05-Jul-99 to 30 -May-07 and TRI values since 31-May-07.
i. SBI Magnum Multiplier Fund: As TRI data is not available since inception of SBI Magnum Multiplier Fund, benchmark performance is calculated using composite CAGR of S&P BSE 200 PRI values from 28-Feb-93 to 28-Jun- 07 and
TRI values since 29-Jun-07.
As TRI data is not available since inception of SBI Magnum Multiplier Fund, benchmark performance is calculated using composite CAGR of S&P BSE Sensex PRI values from 28-Feb-93 to 30 -May-07 and TRI values since
31-May-07.
j. SBI Pharma Fund: As TRI data is not available since inception of SBI Pharma Fund, benchmark performance is calculated using composite CAGR of S&P BSE Health Care PRI values from 05-Jul-99 to 30-Dec-07 and TRI values
since 31-Dec-07.
As TRI data is not available since inception of SBI Pharma Fund , benchmark performance is calculated using composite CAGR of S&P BSE Sensex PRI values 05-Jul-99 to 30-May-07 and TRI values since 31-May-07.
k. The performance of the schemes is benchmarked to the Total Return variant of the Index.
CAGR %Point-to-Point
returns on StandardInvestment ofRs. 10,000/-
CAGR %Point-to-Point
returns on StandardInvestment ofRs. 10,000/-
CAGR %Point-to-Point
returns on StandardInvestment ofRs. 10,000/-
3 Years 5 Years
CAGR %Point-to-Point
returns on StandardInvestment ofRs. 10,000/-
Since Inception
Inception Date &Managing Since
Managing Since
Jun-11
Inception Date
05-07-1999
SBI FMCG Fund
SBI Magnum Multiplier Fund
Scheme Benchmark: - S&P BSE Fast MovingConsumer Goods Index
Additional Benchmark: - S&P BSE Sensex
Scheme Benchmark: - S&P BSE 200
Additional Benchmark: - S&P BSE Sensex
47.24 14,724 16.77 15,937 18.84 23,712 16.20 1,62,922
26.66 12,666 10.48 13,492 14.18 19,411 13.27 1,01,421
31.74 13,174 8.70 12,849 14.21 19,438 13.93 1,12,940
33.50 13,350 13.41 14,597 20.86 25,805 15.14 3,36,434
31.70 13,170 11.17 13,746 15.95 20,966 12.57 1,91,558
31.74 13,174 8.70 12,849 14.21 19,438 11.84 1,62,933Managing Since
Sep-16
Inception Date
28-02-1993
1 Year
Funds Managed by Mr. Saurabh Pant
Managing Since
Jun-11
Inception Date
05-07-1999SBI Pharma Fund
Scheme Benchmark: - S&P BSE Health Care
Additional Benchmark: - S&P BSE Sensex
-1.48 9,852 0.86 10,262 16.60 21,561 16.35 1,66,974
-1.00 9,900 -1.88 9,445 13.33 18,704 14.44 1,22,817
31.74 13,174 8.70 12,849 14.21 19,438 13.93 1,12,940
Funds Managed by Mr. Tanmaya Desai
Notes:
a. Ms. SohiniAndani has been managing SBI Blue Chip Fund since September 2010, SBI Magnum Midcap Fund sinceJuly 2010 and SBI Banking and Financial Services Fund since February 2015. The total number of schemes managed by Ms. SohiniAndani is 3.
b. Past performance may or may not be sustained in future and the same may not necessarily provide the basis for comparison with other investment.c. Load is not considered for computation of returns.d. Period for which scheme’s performance has been provided is computed basis last day of the month-end preceding the date of advertisement. In case, the start/end date of the concerned period is a non-business day, the NAV of the previous date
is considered for computation of returns.e. Different plans shall have a different expense structure. The performance details provided herein are of Growth Option - Regular Plan. Performance for Schemes not having Growth Option has been calculated considering the Dividend Option
and is Net of Dividend distribution tax, if any.f. Scheme count for the total schemes managed by the Fund Managers does not include ended / interval scheme.close endedg. SBI Banking & Financial Services Fund scheme has not completed 3 & 5 years period, hence the performance of such period are not provided.h. The data of the last working day has been considered for the calculation of performance.I. SBI Magnum MidCap Fund: As TRI data is not available since inception of SBI Magnum MidCap Fund, benchmark performance is calculated using composite CAGR of S&P BSE Sensex PRI values from 29-Mar-05 to 30 -May-07 and TRI
values since 31-May-07.j. SBI Blue Chip Fund:As TRI data is not available since inception of SBI Blue Chip Fund, benchmark performance is calculated using composite CAGR of S&P BSE 100 PRI values from 14-Feb-06 to 28-Jun-07 and TRI values since 29-Jun-07.
As TRI data is not available since inception of SBI Blue Chip Fund, benchmark performance is calculated using composite CAGR of S&P BSE Sensex PRI values from 14-Feb-06 to 30 -May-07 and TRI values since 31-May-07.k. The performance of the schemes is benchmarked to the Total Return variant of the Index.
The details of the period since the Fund Manager is managing the scheme(s) & inception date provided alongside of the table.
CAGR %Point-to-Point
returns on StandardInvestment ofRs. 10,000/-
CAGR %Point-to-Point
returns on StandardInvestment ofRs. 10,000/-
CAGR %Point-to-Point
returns on StandardInvestment ofRs. 10,000/-
3 Years 5 Years
CAGR %Point-to-Point
returns on StandardInvestment ofRs. 10,000/-
Since Inception
Inception Date &Managing Since
Managing Since
July-10
Inception Date
29-03-2005
SBI Magnum MidCap Fund
SBI Blue Chip Fund
SBI Banking & Financial Services Fund
Scheme Benchmark: - Nifty MidSmallcap 400
Additional Benchmark: - S&P BSE Sensex
Scheme Benchmark: - S&P BSE 100
Additional Benchmark: - S&P BSE Sensex
Scheme Benchmark: - Nifty Financial Services
Additional Benchmark: - S&P BSE Sensex
21.96 12,196 14.77 15,129 25.04 30,582 17.95 83,459
41.76 14,176 18.93 16,837 23.61 28,877 N.A. N.A.
31.74 13,174 8.70 12,849 14.21 19,438 16.09 68,037
25.63 12,563 11.90 14,019 18.38 23,256 12.10 39,232
31.05 13,105 10.11 13,358 15.00 20,122 12.89 42,689
31.74 13,174 8.70 12,849 14.21 19,438 12.80 42,280
35.24 13,524 N.A. N.A. N.A. N.A. 16.34 15,584
43.50 14,350 N.A. N.A. N.A. N.A. 14.96 15,049
31.74 13,174 N.A. N.A. N.A. N.A. 9.49 13,043
1 Year
Managing Since
Sep-10
Inception Date
14-02-2006
Managing Since
Feb-15
Inception Date
26-02-2015
Funds Managed by Ms. Sohini Andani
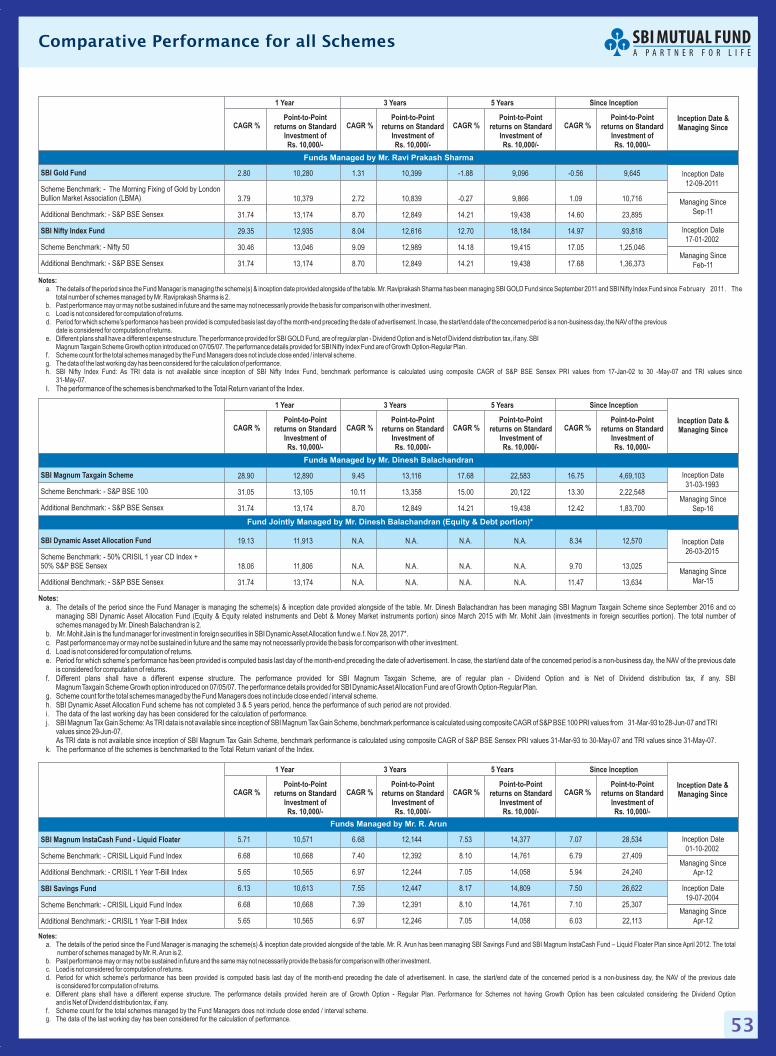
53
Comparative Performance for all Schemes
Notes:a. Mr. R. Arun has been managing SBI Savings Fund and SBI Magnum InstaCash Fund – Liquid Floater Plan since April 2012. The total
number of schemes managed by Mr. R.Arun is 2.b. Past performance may or may not be sustained in future and the same may not necessarily provide the basis for comparison with other investment.c. Load is not considered for computation of returns.d. Period for which scheme’s performance has been provided is computed basis last day of the month-end preceding the date of advertisement. In case, the start/end date of the concerned period is a non-business day, the NAV of the previous date
is considered for computation of returns.e. Different plans shall have a different expense structure. The performance details provided herein are of Growth Option - Regular Plan. Performance for Schemes not having Growth Option has been calculated considering the Dividend Option
and is Net of Dividend distribution tax, if any.f. Scheme count for the total schemes managed by the Fund Managers does not include ended / interval scheme.closeg. The data of the last working day has been considered for the calculation of performance.
The details of the period since the Fund Manager is managing the scheme(s) & inception date provided alongside of the table.
CAGR %Point-to-Point
returns on StandardInvestment ofRs. 10,000/-
CAGR %Point-to-Point
returns on StandardInvestment ofRs. 10,000/-
CAGR %Point-to-Point
returns on StandardInvestment ofRs. 10,000/-
3 Years 5 Years
CAGR %Point-to-Point
returns on StandardInvestment ofRs. 10,000/-
Since Inception
Inception Date &Managing Since
Managing Since
Apr-12
Inception Date
01-10-2002SBI Magnum InstaCash Fund - Liquid Floater
SBI Savings Fund
Scheme Benchmark: - CRISIL Liquid Fund Index
Additional Benchmark: - CRISIL 1 Year T-Bill Index
Scheme Benchmark: - CRISIL Liquid Fund Index
Additional Benchmark: - CRISIL 1 Year T-Bill Index
5.71 10,571 6.68 12,144 7.53 14,377 7.07 28,534
6.68 10,668 7.40 12,392 8.10 14,761 6.79 27,409
5.65 10,565 6.97 12,244 7.05 14,058 5.94 24,240
6.13 10,613 7.55 12,447 8.17 14,809 7.50 26,622
6.68 10,668 7.39 12,391 8.10 14,761 7.10 25,307
5.65 10,565 6.97 12,246 7.05 14,058 6.03 22,113
Managing Since
Apr-12
Inception Date
19-07-2004
1 Year
Funds Managed by Mr. R. Arun
Notes:a. Mr. Dinesh Balachandran has been managing SBI Magnum Taxgain Scheme since September 2016 and co
managing SBI Dynamic Asset Allocation Fund (Equity & Equity related instruments and Debt & Money Market instruments portion) since March 2015 with Mr. Mohit Jain (investments in foreign securities portion). The total number ofschemes managed by Mr. Dinesh Balachandran is 2.
b. Mr. Mohit Jain is the fund manager for investment in foreign securities in SBI DynamicAssetAllocation fund w.e.f. Nov 28, 2017*.c. Past performance may or may not be sustained in future and the same may not necessarily provide the basis for comparison with other investment.d. Load is not considered for computation of returns.e. Period for which scheme’s performance has been provided is computed basis last day of the month-end preceding the date of advertisement. In case, the start/end date of the concerned period is a non-business day, the NAV of the previous date
is considered for computation of returns.f. Different plans shall have a different expense structure. The performance provided for SBI Magnum Taxgain Scheme, are of regular plan - Dividend Option and is Net of Dividend distribution tax, if any. SBI
Magnum Taxgain Scheme Growth option introduced on 07/05/07. The performance details provided for SBI DynamicAssetAllocation Fund are of Growth Option-Regular Plan.g. Scheme count for the total schemes managed by the Fund Managers does not include ended / interval scheme.closeh. SBI Dynamic Asset Allocation Fund scheme has not completed 3 & 5 years period, hence the performance of such period are not provided.i. The data of the last working day has been considered for the calculation of performance.j. SBI Magnum Tax Gain Scheme: As TRI data is not available since inception of SBI Magnum Tax Gain Scheme, benchmark performance is calculated using composite CAGR of S&P BSE 100 PRI values from 31-Mar-93 to 28-Jun-07 and TRI
values since 29-Jun-07.As TRI data is not available since inception of SBI Magnum Tax Gain Scheme, benchmark performance is calculated using composite CAGR of S&P BSE Sensex PRI values 31-Mar-93 to 30-May-07 and TRI values since 31-May-07.
k. The performance of the schemes is benchmarked to the Total Return variant of the Index.
The details of the period since the Fund Manager is managing the scheme(s) & inception date provided alongside of the table.
CAGR %Point-to-Point
returns on StandardInvestment ofRs. 10,000/-
CAGR %Point-to-Point
returns on StandardInvestment ofRs. 10,000/-
CAGR %Point-to-Point
returns on StandardInvestment ofRs. 10,000/-
3 Years 5 Years
CAGR %Point-to-Point
returns on StandardInvestment ofRs. 10,000/-
Since Inception
Inception Date &Managing Since
Managing Since
Sep-16
Inception Date
31-03-1993
SBI Magnum Taxgain Scheme
SBI Dynamic Asset Allocation Fund
Scheme Benchmark: - S&P BSE 100
Additional Benchmark: - S&P BSE Sensex
Scheme Benchmark: - 50% CRISIL 1 year CD Index +50% S&P BSE Sensex
Additional Benchmark: - S&P BSE Sensex
28.90 12,890 9.45 13,116 17.68 22,583 16.75 4,69,103
31.05 13,105 10.11 13,358 15.00 20,122 13.30 2,22,548
31.74 13,174 8.70 12,849 14.21 19,438 12.42 1,83,700
19.13 11,913 N.A. N.A. N.A. N.A. 8.34 12,570
18.06 11,806 N.A. N.A. N.A. N.A. 9.70 13,025
31.74 13,174 N.A. N.A. N.A. N.A. 11.47 13,634
1 Year
Managing Since
Mar-15
Inception Date
26-03-2015
Fund Jointly Managed by Mr. Dinesh Balachandran (Equity & Debt portion)*
Funds Managed by Mr. Dinesh Balachandran
Notes:a.
I. The performance of the schemes is benchmarked to the Total Return variant of the Index.
The details of the period since the Fund Manager is managing the scheme(s) & inception date provided alongside of the table. Mr. Raviprakash Sharma has been managing SBI GOLD Fund since September 2011 and SBI Nifty Index Fund since February 2011. Thetotal number of schemes managed by Mr. Raviprakash Sharma is 2.
b. Past performance may or may not be sustained in future and the same may not necessarily provide the basis for comparison with other investment.c. Load is not considered for computation of returns.d. Period for which scheme’s performance has been provided is computed basis last day of the month-end preceding the date of advertisement. In case, the start/end date of the concerned period is a non-business day, the NAV of the previous
date is considered for computation of returns.e. Different plans shall have a different expense structure. The performance provided for SBI GOLD Fund, are of regular plan - Dividend Option and is Net of Dividend distribution tax, if any. SBI
Magnum Taxgain Scheme Growth option introduced on 07/05/07. The performance details provided for SBI Nifty Index Fund are of Growth Option-Regular Plan.f. Scheme count for the total schemes managed by the Fund Managers does not include close ended / interval scheme.g. The data of the last working day has been considered for the calculation of performance.h. SBI Nifty Index Fund: As TRI data is not available since inception of SBI Nifty Index Fund, benchmark performance is calculated using composite CAGR of S&P BSE Sensex PRI values from 17-Jan-02 to 30 -May-07 and TRI values since
31-May-07.
CAGR %Point-to-Point
returns on StandardInvestment ofRs. 10,000/-
CAGR %Point-to-Point
returns on StandardInvestment ofRs. 10,000/-
CAGR %Point-to-Point
returns on StandardInvestment ofRs. 10,000/-
3 Years 5 Years
CAGR %Point-to-Point
returns on StandardInvestment ofRs. 10,000/-
Since Inception
Inception Date &Managing Since
Managing Since
Sep-11
Inception Date
12-09-2011
SBI Gold Fund
SBI Nifty Index Fund
Scheme Benchmark: - The Morning Fixing of Gold by LondonBullion Market Association (LBMA)
Additional Benchmark: - S&P BSE Sensex
Scheme Benchmark: - Nifty 50
Additional Benchmark: - S&P BSE Sensex
2.80 10,280 1.31 10,399 -1.88 9,096 -0.56 9,645
3.79 10,379 2.72 10,839 -0.27 9,866 1.09 10,716
31.74 13,174 8.70 12,849 14.21 19,438 14.60 23,895
29.35 12,935 8.04 12,616 12.70 18,184 14.97 93,818
30.46 13,046 9.09 12,989 14.18 19,415 17.05 1,25,046
31.74 13,174 8.70 12,849 14.21 19,438 17.68 1,36,373
1 Year
Managing Since
Feb-11
Inception Date
17-01-2002
Funds Managed by Mr. Ravi Prakash Sharma
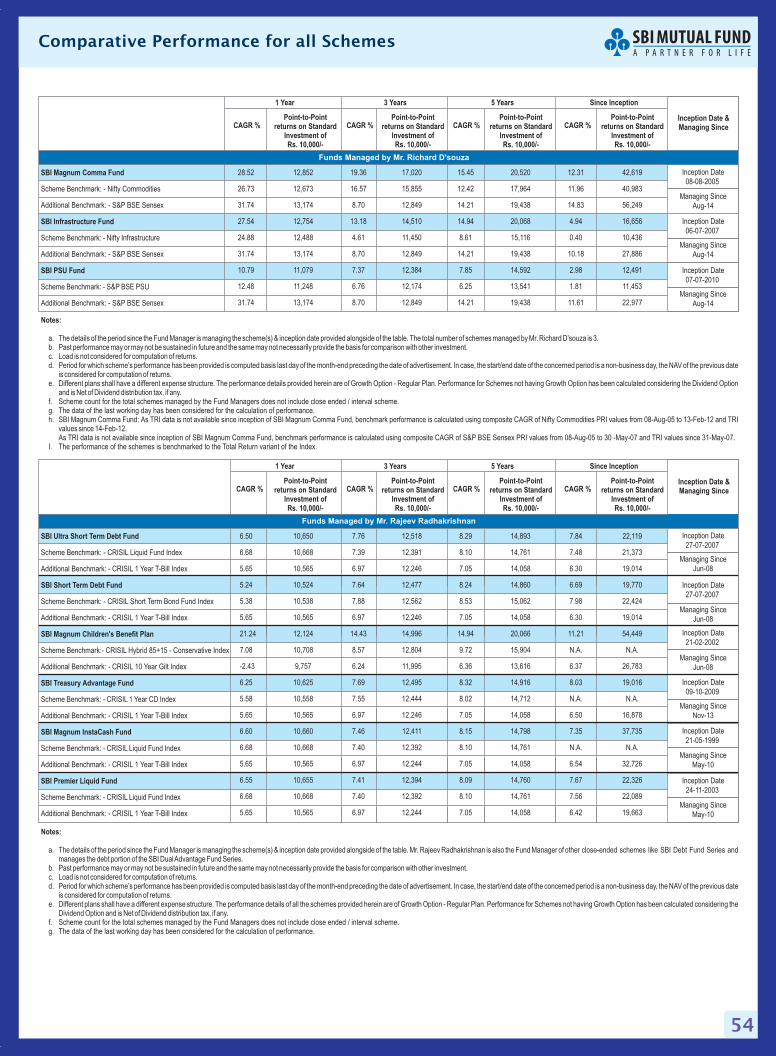
54
Comparative Performance for all Schemes
Notes:
a. Mr. Rajeev Radhakrishnan is also the Fund Manager of other close-ended schemes like SBI Debt Fund Series andmanages the debt portion of the SBI DualAdvantage Fund Series.
b. Past performance may or may not be sustained in future and the same may not necessarily provide the basis for comparison with other investment.c. Load is not considered for computation of returns.d. Period for which scheme’s performance has been provided is computed basis last day of the month-end preceding the date of advertisement. In case, the start/end date of the concerned period is a non-business day, the NAV of the previous date
is considered for computation of returns.e. Different plans shall have a different expense structure. The performance details of all the schemes provided herein are of Growth Option - Regular Plan. Performance for Schemes not having Growth Option has been calculated considering the
Dividend Option and is Net of Dividend distribution tax, if any.f. Scheme count for the total schemes managed by the Fund Managers does not include ended / interval scheme.closeg. The data of the last working day has been considered for the calculation of performance.
The details of the period since the Fund Manager is managing the scheme(s) & inception date provided alongside of the table.
CAGR %Point-to-Point
returns on StandardInvestment ofRs. 10,000/-
CAGR %Point-to-Point
returns on StandardInvestment ofRs. 10,000/-
CAGR %Point-to-Point
returns on StandardInvestment ofRs. 10,000/-
3 Years 5 Years
CAGR %Point-to-Point
returns on StandardInvestment ofRs. 10,000/-
Since Inception
Inception Date &Managing Since
Managing Since
Jun-08
Inception Date
27-07-2007
1 Year
Managing Since
Jun-08
Inception Date
27-07-2007
Managing Since
Jun-08
Inception Date
21-02-2002
Inception Date
09-10-2009
Inception Date
21-05-1999
Inception Date
24-11-2003
Managing Since
Nov-13
Managing Since
May-10
Managing Since
May-10
6.50 10,650 7.76 12,518 8.29 14,893 7.84 22,119
6.68 10,668 7.39 12,391 8.10 14,761 7.48 21,373
5.65 10,565 6.97 12,246 7.05 14,058 6.30 19,014
5.24 10,524 7.64 12,477 8.24 14,860 6.69 19,770
5.38 10,538 7.88 12,562 8.53 15,062 7.98 22,424
5.65 10,565 6.97 12,246 7.05 14,058 6.30 19,014
21.24 12,124 14.43 14,996 14.94 20,066 11.21 54,449
7.08 10,708 8.57 12,804 9.72 15,904 N.A. N.A.
-2.43 9,757 6.24 11,995 6.36 13,616 6.37 26,783
6.25 10,625 7.69 12,495 8.32 14,916 8.03 19,016
5.58 10,558 7.55 12,444 8.02 14,712 N.A. N.A.
5.65 10,565 6.97 12,246 7.05 14,058 6.50 16,878
6.60 10,660 7.46 12,411 8.15 14,798 7.35 37,735
6.68 10,668 7.40 12,392 8.10 14,761 N.A. N.A.
5.65 10,565 6.97 12,244 7.05 14,058 6.54 32,726
6.55 10,655 7.41 12,394 8.09 14,760 7.67 22,326
6.68 10,668 7.40 12,392 8.10 14,761 7.56 22,089
5.65 10,565 6.97 12,244 7.05 14,058 6.42 19,663
SBI Ultra Short Term Debt Fund
SBI Short Term Debt Fund
SBI Magnum Children's Benefit Plan
SBI Treasury Advantage Fund
SBI Magnum InstaCash Fund
SBI Premier Liquid Fund
Scheme Benchmark: - CRISIL Liquid Fund Index
Additional Benchmark: - CRISIL 1 Year T-Bill Index
Scheme Benchmark: - CRISIL Short Term Bond Fund Index
Additional Benchmark: - CRISIL 1 Year T-Bill Index
Scheme Benchmark:- CRISIL Hybrid 85+15 - Conservative Index
Additional Benchmark: - CRISIL 10 Year Gilt Index
Scheme Benchmark: - CRISIL 1 Year CD Index
Additional Benchmark: - CRISIL 1 Year T-Bill Index
Scheme Benchmark: - CRISIL Liquid Fund Index
Additional Benchmark: - CRISIL 1 Year T-Bill Index
Scheme Benchmark: - CRISIL Liquid Fund Index
Additional Benchmark: - CRISIL 1 Year T-Bill Index
Funds Managed by Mr. Rajeev Radhakrishnan
Notes:
a. The total number of schemes managed by Mr. Richard D’souza is 3.b. Past performance may or may not be sustained in future and the same may not necessarily provide the basis for comparison with other investment.c. Load is not considered for computation of returns.d. Period for which scheme’s performance has been provided is computed basis last day of the month-end preceding the date of advertisement. In case, the start/end date of the concerned period is a non-business day, the NAV of the previous date
is considered for computation of returns.e. Different plans shall have a different expense structure. The performance details provided herein are of Growth Option - Regular Plan. Performance for Schemes not having Growth Option has been calculated considering the Dividend Option
and is Net of Dividend distribution tax, if any.f. Scheme count for the total schemes managed by the Fund Managers does not include ended / interval scheme.closeg. The data of the last working day has been considered for the calculation of performance.h. SBI Magnum Comma Fund: As TRI data is not available since inception of SBI Magnum Comma Fund, benchmark performance is calculated using composite CAGR of Nifty Commodities PRI values from 08-Aug-05 to 13-Feb-12 and TRI
values since 14-Feb-12.As TRI data is not available since inception of SBI Magnum Comma Fund, benchmark performance is calculated using composite CAGR of S&P BSE Sensex PRI values from 08-Aug-05 to 30 -May-07 and TRI values since 31-May-07.
I. The performance of the schemes is benchmarked to the Total Return variant of the Index.
The details of the period since the Fund Manager is managing the scheme(s) & inception date provided alongside of the table.
CAGR %Point-to-Point
returns on StandardInvestment ofRs. 10,000/-
CAGR %Point-to-Point
returns on StandardInvestment ofRs. 10,000/-
CAGR %Point-to-Point
returns on StandardInvestment ofRs. 10,000/-
3 Years 5 Years
CAGR %Point-to-Point
returns on StandardInvestment ofRs. 10,000/-
Since Inception
Inception Date &Managing Since
Managing Since
Aug-14
Inception Date
08-08-2005SBI Magnum Comma Fund
SBI Infrastructure Fund
SBI PSU Fund
Scheme Benchmark: - Nifty Commodities
Additional Benchmark: - S&P BSE Sensex
Scheme Benchmark: - Nifty Infrastructure
Additional Benchmark: - S&P BSE Sensex
Scheme Benchmark: - S&P BSE PSU
Additional Benchmark: - S&P BSE Sensex
28.52 12,852 19.36 17,020 15.45 20,520 12.31 42,619
26.73 12,673 16.57 15,855 12.42 17,964 11.96 40,983
31.74 13,174 8.70 12,849 14.21 19,438 14.83 56,249
27.54 12,754 13.18 14,510 14.94 20,068 4.94 16,656
24.88 12,488 4.61 11,450 8.61 15,116 0.40 10,436
31.74 13,174 8.70 12,849 14.21 19,438 10.18 27,886
10.79 11,079 7.37 12,384 7.85 14,592 2.98 12,491
12.48 11,248 6.76 12,174 6.25 13,541 1.81 11,453
31.74 13,174 8.70 12,849 14.21 19,438 11.61 22,977
Managing Since
Aug-14
Inception Date
06-07-2007
1 Year
Funds Managed by Mr. Richard D'souza
Managing Since
Aug-14
Inception Date
07-07-2010
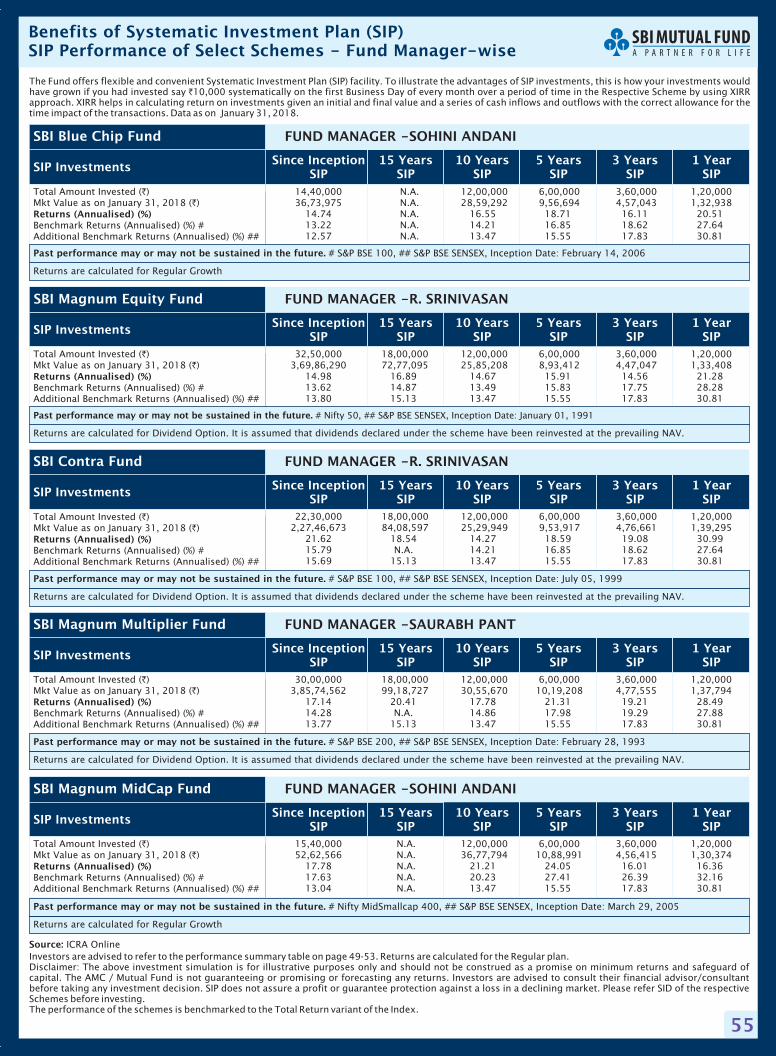
55
The Fund offers flexible and convenient Systematic Investment Plan (SIP) facility. To illustrate the advantages of SIP investments, this is how your investments wouldhave grown if you had invested say 10,000 systematically on the first Business Day of every month over a period of time in the Respective Scheme by using XIRRapproach. XIRR helps in calculating return on investments given an initial and final value and a series of cash inflows and outflows with the correct allowance for thetime impact of the transactions. Data as on January 31, 2018.
`
Investors are advised to refer to the performance summary table on page 49-53. Returns are calculated for the Regular plan.Disclaimer: The above investment simulation is for illustrative purposes only and should not be construed as a promise on minimum returns and safeguard ofcapital. The AMC / Mutual Fund is not guaranteeing or promising or forecasting any returns. Investors are advised to consult their financial advisor/consultantbefore taking any investment decision. SIP does not assure a profit or guarantee protection against a loss in a declining market. Please refer SID of the respectiveSchemes before investing.The performance of the schemes is benchmarked to the Total Return variant of the Index.
Source: ICRA Online
Benefits of Systematic Investment Plan (SIP)SIP Performance of Select Schemes - Fund Manager-wise
32,50,000 18,00,000 12,00,000 6,00,000 3,60,000 1,20,0003,69,86,290 72,77,095 25,85,208 8,93,412 4,47,047 1,33,408
14.98 16.89 14.67 15.91 14.56 21.2813.62 14.87 13.49 15.83 17.75 28.2813.80 15.13 13.47 15.55 17.83 30.81
Total Amount Invested ( )Mkt Value as on January 31, 2018 ( )
Benchmark Returns (Annualised) (%) #Additional Benchmark Returns (Annualised) (%) ##
`
`
Returns (Annualised) (%)
SIP Investments
Past performance may or may not be sustained in the future. # Nifty 50, ## S&P BSE SENSEX, Inception Date: January 01, 1991
Returns are calculated for Dividend Option. It is assumed that dividends declared under the scheme have been reinvested at the prevailing NAV.
SBI Magnum Equity Fund FUND MANAGER -R. SRINIVASAN
22,30,000 18,00,000 12,00,000 6,00,000 3,60,000 1,20,0002,27,46,673 84,08,597 25,29,949 9,53,917 4,76,661 1,39,295
21.62 18.54 14.27 18.59 19.08 30.9915.79 N.A. 14.21 16.85 18.62 27.6415.69 15.13 13.47 15.55 17.83 30.81
Total Amount Invested ( )Mkt Value as on January 31, 2018 ( )
Benchmark Returns (Annualised) (%) #Additional Benchmark Returns (Annualised) (%) ##
`
`
Returns (Annualised) (%)
SIP Investments
Past performance may or may not be sustained in the future. # S&P BSE 100, ## S&P BSE SENSEX, Inception Date: July 05, 1999
Returns are calculated for Dividend Option. It is assumed that dividends declared under the scheme have been reinvested at the prevailing NAV.
SBI Contra Fund FUND MANAGER -R. SRINIVASAN
14,40,000 N.A. 12,00,000 6,00,000 3,60,000 1,20,00036,73,975 N.A. 28,59,292 9,56,694 4,57,043 1,32,938
14.74 N.A. 16.55 18.71 16.11 20.5113.22 N.A. 14.21 16.85 18.62 27.6412.57 N.A. 13.47 15.55 17.83 30.81
Total Amount Invested ( )Mkt Value as on January 31, 2018 ( )
Benchmark Returns (Annualised) (%) #Additional Benchmark Returns (Annualised) (%) ##
`
`
Returns (Annualised) (%)
SIP Investments
Past performance may or may not be sustained in the future. # S&P BSE 100, ## S&P BSE SENSEX, Inception Date: February 14, 2006
Returns are calculated for Regular Growth
SBI Blue Chip Fund FUND MANAGER -SOHINI ANDANI
30,00,000 18,00,000 12,00,000 6,00,000 3,60,000 1,20,0003,85,74,562 99,18,727 30,55,670 10,19,208 4,77,555 1,37,794
17.14 20.41 17.78 21.31 19.21 28.4914.28 N.A. 14.86 17.98 19.29 27.8813.77 15.13 13.47 15.55 17.83 30.81
Total Amount Invested ( )Mkt Value as on January 31, 2018 ( )
Benchmark Returns (Annualised) (%) #Additional Benchmark Returns (Annualised) (%) ##
`
`
Returns (Annualised) (%)
SIP Investments
Past performance may or may not be sustained in the future. # S&P BSE 200, ## S&P BSE SENSEX, Inception Date: February 28, 1993
Returns are calculated for Dividend Option. It is assumed that dividends declared under the scheme have been reinvested at the prevailing NAV.
SBI Magnum Multiplier Fund FUND MANAGER -SAURABH PANT
15,40,000 N.A. 12,00,000 6,00,000 3,60,000 1,20,00052,62,566 N.A. 36,77,794 10,88,991 4,56,415 1,30,374
17.78 N.A. 21.21 24.05 16.01 16.3617.63 N.A. 20.23 27.41 26.39 32.1613.04 N.A. 13.47 15.55 17.83 30.81
Total Amount Invested ( )Mkt Value as on January 31, 2018 ( )
Benchmark Returns (Annualised) (%) #Additional Benchmark Returns (Annualised) (%) ##
`
`
Returns (Annualised) (%)
SIP Investments
Past performance may or may not be sustained in the future. # Nifty MidSmallcap 400, ## S&P BSE SENSEX, Inception Date: March 29, 2005
Returns are calculated for Regular Growth
SBI Magnum MidCap Fund FUND MANAGER -SOHINI ANDANI
Since InceptionSIP
15 YearsSIP
10 YearsSIP
5 YearsSIP
3 YearsSIP
1 YearSIP
Since InceptionSIP
15 YearsSIP
10 YearsSIP
5 YearsSIP
3 YearsSIP
1 YearSIP
Since InceptionSIP
15 YearsSIP
10 YearsSIP
5 YearsSIP
3 YearsSIP
1 YearSIP
Since InceptionSIP
15 YearsSIP
10 YearsSIP
5 YearsSIP
3 YearsSIP
1 YearSIP
Since InceptionSIP
15 YearsSIP
10 YearsSIP
5 YearsSIP
3 YearsSIP
1 YearSIP
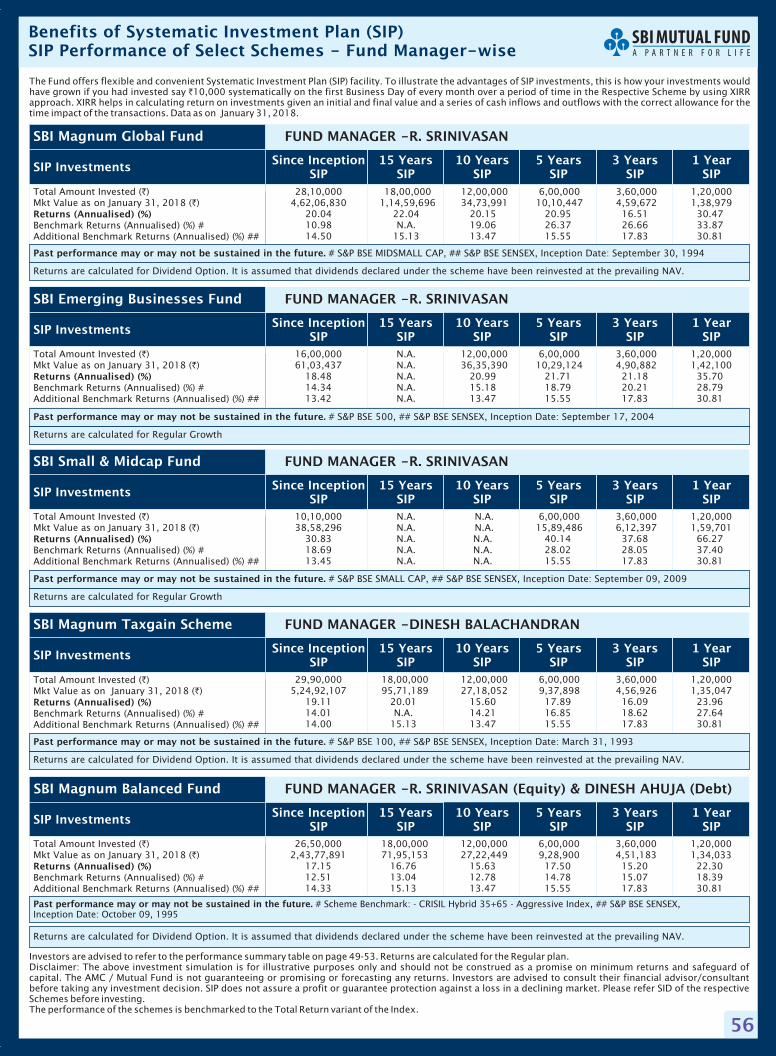
56
The Fund offers flexible and convenient Systematic Investment Plan (SIP) facility. To illustrate the advantages of SIP investments, this is how your investments wouldhave grown if you had invested say 10,000 systematically on the first Business Day of every month over a period of time in the Respective Scheme by using XIRRapproach. XIRR helps in calculating return on investments given an initial and final value and a series of cash inflows and outflows with the correct allowance for thetime impact of the transactions. Data as on January 31, 2018.
`
Investors are advised to refer to the performance summary table on page 49-53. Returns are calculated for the Regular plan.Disclaimer: The above investment simulation is for illustrative purposes only and should not be construed as a promise on minimum returns and safeguard ofcapital. The AMC / Mutual Fund is not guaranteeing or promising or forecasting any returns. Investors are advised to consult their financial advisor/consultantbefore taking any investment decision. SIP does not assure a profit or guarantee protection against a loss in a declining market. Please refer SID of the respectiveSchemes before investing.The performance of the schemes is benchmarked to the Total Return variant of the Index.
Benefits of Systematic Investment Plan (SIP)SIP Performance of Select Schemes - Fund Manager-wise
26,50,000 18,00,000 12,00,000 6,00,000 3,60,000 1,20,0002,43,77,891 71,95,153 27,22,449 9,28,900 4,51,183 1,34,033
17.15 16.76 15.63 17.50 15.20 22.3012.51 13.04 12.78 14.78 15.07 18.3914.33 15.13 13.47 15.55 17.83 30.81
Total Amount Invested ( )Mkt Value as on January 31, 2018 ( )
Benchmark Returns (Annualised) (%) #Additional Benchmark Returns (Annualised) (%) ##
`
`
Returns (Annualised) (%)
SIP Investments
Past performance may or may not be sustained in the future. # Scheme Benchmark: - CRISIL Hybrid 35+65 - Aggressive Index, ## S&P BSE SENSEX,Inception Date: October 09, 1995
Returns are calculated for Dividend Option. It is assumed that dividends declared under the scheme have been reinvested at the prevailing NAV.
SBI Magnum Balanced Fund FUND MANAGER -R. SRINIVASAN (Equity) & DINESH AHUJA (Debt)
29,90,000 18,00,000 12,00,000 6,00,000 3,60,000 1,20,0005,24,92,107 95,71,189 27,18,052 9,37,898 4,56,926 1,35,047
19.11 20.01 15.60 17.89 16.09 23.9614.01 N.A. 14.21 16.85 18.62 27.6414.00 15.13 13.47 15.55 17.83 30.81
Total Amount Invested ( )Mkt Value as on January 31, 2018 ( )
Benchmark Returns (Annualised) (%) #Additional Benchmark Returns (Annualised) (%) ##
`
`
Returns (Annualised) (%)
SIP Investments
Past performance may or may not be sustained in the future. # S&P BSE 100, ## S&P BSE SENSEX, Inception Date: March 31, 1993
Returns are calculated for Dividend Option. It is assumed that dividends declared under the scheme have been reinvested at the prevailing NAV.
SBI Magnum Taxgain Scheme FUND MANAGER -DINESH BALACHANDRAN
28,10,000 18,00,000 12,00,000 6,00,000 3,60,000 1,20,0004,62,06,830 1,14,59,696 34,73,991 10,10,447 4,59,672 1,38,979
20.04 22.04 20.15 20.95 16.51 30.4710.98 N.A. 19.06 26.37 26.66 33.8714.50 15.13 13.47 15.55 17.83 30.81
Total Amount Invested ( )Mkt Value as on January 31, 2018 ( )
Benchmark Returns (Annualised) (%) #Additional Benchmark Returns (Annualised) (%) ##
`
`
Returns (Annualised) (%)
Since InceptionSIP
15 YearsSIP
10 YearsSIP
5 YearsSIP
3 YearsSIP
1 YearSIPSIP Investments
Past performance may or may not be sustained in the future. # S&P BSE MIDSMALL CAP, ## S&P BSE SENSEX, Inception Date: September 30, 1994
Returns are calculated for Dividend Option. It is assumed that dividends declared under the scheme have been reinvested at the prevailing NAV.
SBI Magnum Global Fund FUND MANAGER -R. SRINIVASAN
16,00,000 N.A. 12,00,000 6,00,000 3,60,000 1,20,00061,03,437 N.A. 36,35,390 10,29,124 4,90,882 1,42,100
18.48 N.A. 20.99 21.71 21.18 35.7014.34 N.A. 15.18 18.79 20.21 28.7913.42 N.A. 13.47 15.55 17.83 30.81
Total Amount Invested ( )Mkt Value as on January 31, 2018 ( )
Benchmark Returns (Annualised) (%) #Additional Benchmark Returns (Annualised) (%) ##
`
`
Returns (Annualised) (%)
Since InceptionSIP
15 YearsSIP
10 YearsSIP
5 YearsSIP
3 YearsSIP
1 YearSIPSIP Investments
Past performance may or may not be sustained in the future. # S&P BSE 500, ## S&P BSE SENSEX, Inception Date: September 17, 2004
Returns are calculated for Regular Growth
SBI Emerging Businesses Fund FUND MANAGER -R. SRINIVASAN
10,10,000 N.A. N.A. 6,00,000 3,60,000 1,20,00038,58,296 N.A. N.A. 15,89,486 6,12,397 1,59,701
30.83 N.A. N.A. 40.14 37.68 66.2718.69 N.A. N.A. 28.02 28.05 37.4013.45 N.A. N.A. 15.55 17.83 30.81
Total Amount Invested ( )Mkt Value as on January 31, 2018 ( )
Benchmark Returns (Annualised) (%) #Additional Benchmark Returns (Annualised) (%) ##
`
`
Returns (Annualised) (%)
SIP Investments
Past performance may or may not be sustained in the future. # S&P BSE SMALL CAP, ## S&P BSE SENSEX, Inception Date: September 09, 2009
Returns are calculated for Regular Growth
SBI Small & Midcap Fund FUND MANAGER -R. SRINIVASAN
Since InceptionSIP
15 YearsSIP
10 YearsSIP
5 YearsSIP
3 YearsSIP
1 YearSIP
Since InceptionSIP
15 YearsSIP
10 YearsSIP
5 YearsSIP
3 YearsSIP
1 YearSIP
Since InceptionSIP
15 YearsSIP
10 YearsSIP
5 YearsSIP
3 YearsSIP
1 YearSIP
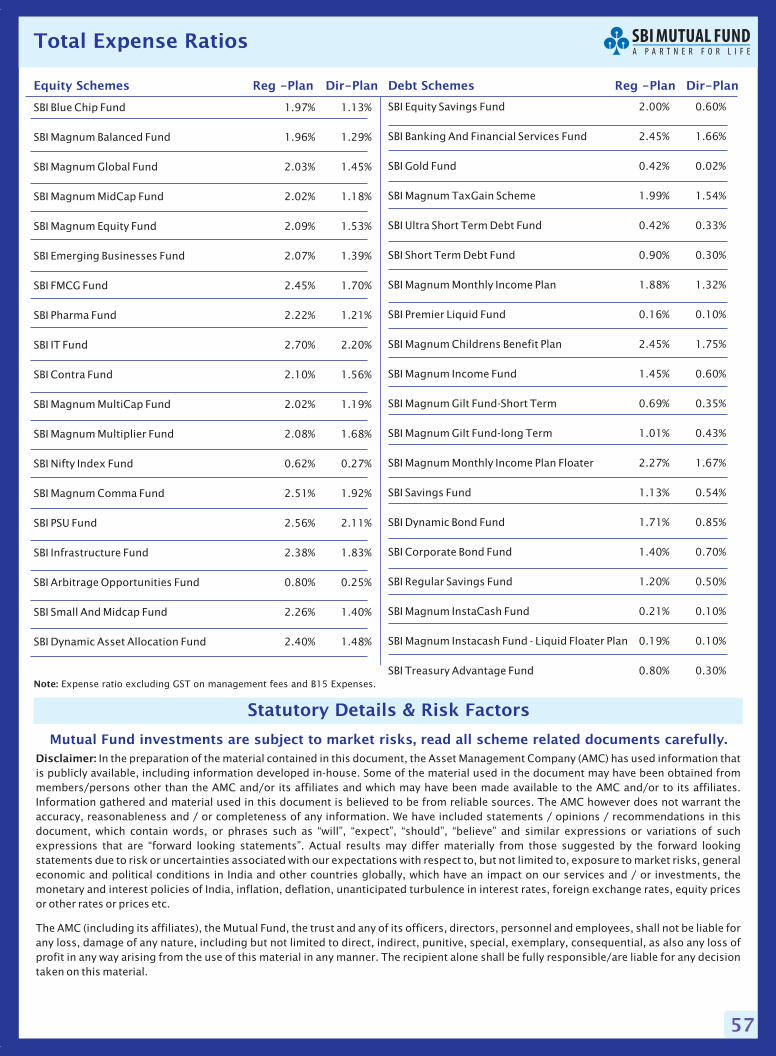
57
Statutory Details & Risk Factors
Mutual Fund investments are subject to market risks, read all scheme related documents carefully.Disclaimer: In the preparation of the material contained in this document, the Asset Management Company (AMC) has used information thatis publicly available, including information developed in-house. Some of the material used in the document may have been obtained frommembers/persons other than the AMC and/or its affiliates and which may have been made available to the AMC and/or to its affiliates.Information gathered and material used in this document is believed to be from reliable sources. The AMC however does not warrant theaccuracy, reasonableness and / or completeness of any information. We have included statements / opinions / recommendations in thisdocument, which contain words, or phrases such as “will”, “expect”, “should”, “believe” and similar expressions or variations of suchexpressions that are “forward looking statements”. Actual results may differ materially from those suggested by the forward lookingstatements due to risk or uncertainties associated with our expectations with respect to, but not limited to, exposure to market risks, generaleconomic and political conditions in India and other countries globally, which have an impact on our services and / or investments, themonetary and interest policies of India, inflation, deflation, unanticipated turbulence in interest rates, foreign exchange rates, equity pricesor other rates or prices etc.
The AMC (including its affiliates), the Mutual Fund, the trust and any of its officers, directors, personnel and employees, shall not be liable forany loss, damage of any nature, including but not limited to direct, indirect, punitive, special, exemplary, consequential, as also any loss ofprofit in any way arising from the use of this material in any manner. The recipient alone shall be fully responsible/are liable for any decisiontaken on this material.
SBI Blue Chip Fund 1.97% 1.13%
SBI Magnum Balanced Fund 1.96% 1.29%
SBI Magnum Global Fund 2.03% 1.45%
SBI Magnum MidCap Fund 2.02% 1.18%
SBI Magnum Equity Fund 2.09% 1.53%
SBI Emerging Businesses Fund 2.07% 1.39%
SBI FMCG Fund 2.45% 1.70%
SBI Pharma Fund 2.22% 1.21%
SBI IT Fund 2.70% 2.20%
SBI Contra Fund 2.10% 1.56%
SBI Magnum MultiCap Fund 2.02% 1.19%
SBI Magnum Multiplier Fund 2.08% 1.68%
SBI Nifty Index Fund 0.62% 0.27%
SBI Magnum Comma Fund 2.51% 1.92%
SBI PSU Fund 2.56% 2.11%
SBI Infrastructure Fund 2.38% 1.83%
SBI Arbitrage Opportunities Fund 0.80% 0.25%
SBI Small And Midcap Fund 2.26% 1.40%
SBI Dynamic Asset Allocation Fund 2.40% 1.48%
SBI Equity Savings Fund 2.00% 0.60%
SBI Banking And Financial Services Fund 2.45% 1.66%
SBI Gold Fund 0.42% 0.02%
SBI Magnum TaxGain Scheme 1.99% 1.54%
SBI Ultra Short Term Debt Fund 0.42% 0.33%
SBI Short Term Debt Fund 0.90% 0.30%
SBI Magnum Monthly Income Plan 1.88% 1.32%
SBI Premier Liquid Fund 0.16% 0.10%
SBI Magnum Childrens Benefit Plan 2.45% 1.75%
SBI Magnum Income Fund 1.45% 0.60%
SBI Magnum Gilt Fund-Short Term 0.69% 0.35%
SBI Magnum Gilt Fund-long Term 1.01% 0.43%
SBI Magnum Monthly Income Plan Floater 2.27% 1.67%
SBI Savings Fund 1.13% 0.54%
SBI Dynamic Bond Fund 1.71% 0.85%
SBI Corporate Bond Fund 1.40% 0.70%
SBI Regular Savings Fund 1.20% 0.50%
SBI Magnum InstaCash Fund 0.21% 0.10%
SBI Magnum Instacash Fund - Liquid Floater Plan 0.19% 0.10%
SBI Treasury Advantage Fund 0.80% 0.30%
Equity Schemes Reg -Plan Dir-Plan Debt Schemes Reg -Plan Dir-Plan
Note: Expense ratio excluding GST on management fees and B15 Expenses.
Total Expense Ratios
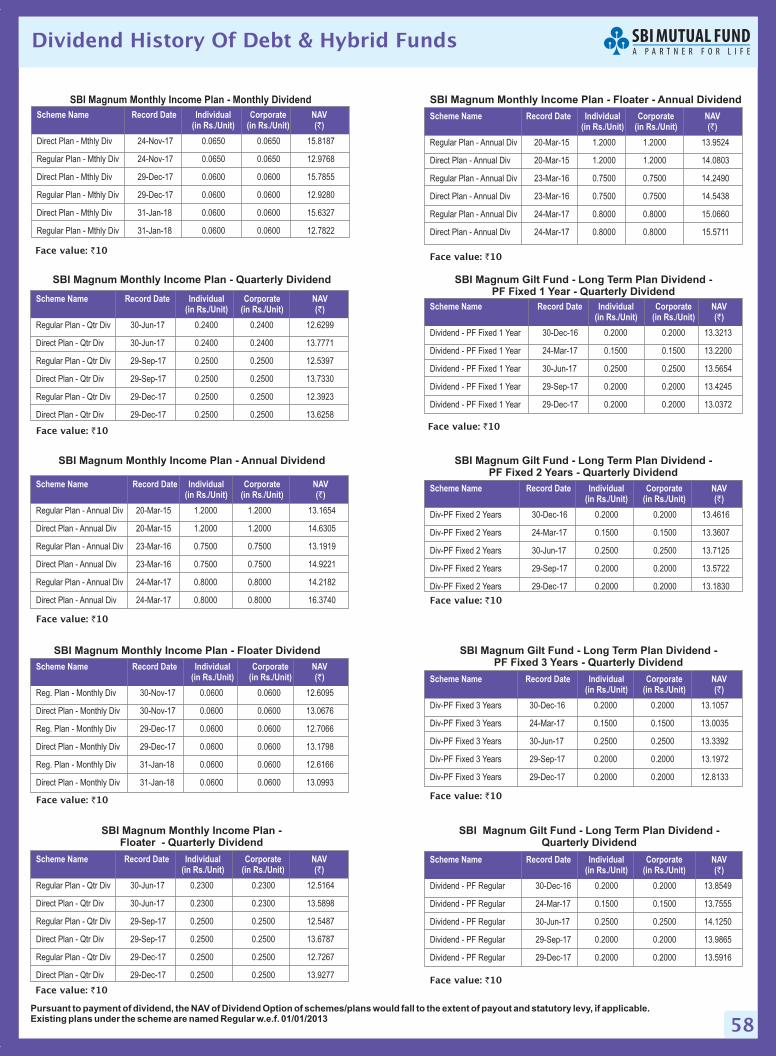
58
SBI Magnum Monthly Income Plan - Monthly Dividend
24-Nov-17 0.0650 0.0650 15.8187
24-Nov-17 0.0650 0.0650 12.9768
29-Dec-17 0.0600 0.0600 15.7855
29-Dec-17 0.0600 0.0600 12.9280
31-Jan-18 0.0600 0.0600 15.6327
31-Jan-18 0.0600 0.0600 12.7822
Scheme Name Record Date Individual Corporate NAV(in Rs./Unit) (in Rs./Unit) ( )`
Direct Plan - Mthly Div
Regular Plan - Mthly Div
Direct Plan - Mthly Div
Regular Plan - Mthly Div
Regular Plan - Mthly Div
Direct Plan - Mthly Div
Face value: 10`
SBI Magnum Monthly Income Plan - Quarterly Dividend
Scheme Name Record Date Individual Corporate NAV(in Rs./Unit) (in Rs./Unit) ( )`
Regular Plan - Qtr Div
Direct Plan - Qtr Div
Regular Plan - Qtr Div
Direct Plan - Qtr Div
Regular Plan - Qtr Div
Direct Plan - Qtr Div
Face value: 10`
30-Jun-17 0.2400 0.2400 12.6299
30-Jun-17 0.2400 0.2400 13.7771
29-Sep-17 0.2500 0.2500 12.5397
29-Sep-17 0.2500 0.2500 13.7330
29-Dec-17 0.2500 0.2500 12.3923
29-Dec-17 0.2500 0.2500 13.6258
SBI Magnum Monthly Income Plan - Annual Dividend
20-Mar-15 1.2000 1.2000 13.1654
20-Mar-15 1.2000 1.2000 14.6305
23-Mar-16 0.7500 0.7500 13.1919
23-Mar-16 0.7500 0.7500 14.9221
24-Mar-17 0.8000 0.8000 14.2182
24-Mar-17 0.8000 0.8000 16.3740
Scheme Name Record Date Individual Corporate NAV(in Rs./Unit) (in Rs./Unit) ( )`
Regular Plan - Annual Div
Direct Plan - Annual Div
Regular Plan - Annual Div
Direct Plan - Annual Div
Regular Plan - Annual Div
Direct Plan - Annual Div
Face value: 10`
SBI Magnum Monthly Income Plan - Floater Dividend
30-Nov-17 0.0600 0.0600 12.6095
30-Nov-17 0.0600 0.0600 13.0676
29-Dec-17 0.0600 0.0600 12.7066
29-Dec-17 0.0600 0.0600 13.1798
31-Jan-18 0.0600 0.0600 12.6166
31-Jan-18 0.0600 0.0600 13.0993
Scheme Name Record Date Individual Corporate NAV(in Rs./Unit) (in Rs./Unit) ( )`
Reg. Plan - Monthly Div
Direct Plan - Monthly Div
Reg. Plan - Monthly Div
Direct Plan - Monthly Div
Reg. Plan - Monthly Div
Direct Plan - Monthly Div
Face value: 10`
SBI Magnum Monthly Income Plan -Floater - Quarterly Dividend
30-Jun-17 0.2300 0.2300 12.5164
30-Jun-17 0.2300 0.2300 13.5898
29-Sep-17 0.2500 0.2500 12.5487
29-Sep-17 0.2500 0.2500 13.6787
29-Dec-17 0.2500 0.2500 12.7267
29-Dec-17 0.2500 0.2500 13.9277
Scheme Name Record Date Individual Corporate NAV(in Rs./Unit) (in Rs./Unit) ( )`
Regular Plan - Qtr Div
Direct Plan - Qtr Div
Regular Plan - Qtr Div
Direct Plan - Qtr Div
Regular Plan - Qtr Div
Direct Plan - Qtr Div
Face value: 10`
Pursuant to payment of dividend, the NAV of Dividend Option of schemes/plans would fall to the extent of payout and statutory levy, if applicable.Existing plans under the scheme are named Regular w.e.f. 01/01/2013
SBI Magnum Monthly Income Plan - Floater - Annual Dividend
20-Mar-15 1.2000 1.2000 13.9524
20-Mar-15 1.2000 1.2000 14.0803
23-Mar-16 0.7500 0.7500 14.2490
23-Mar-16 0.7500 0.7500 14.5438
24-Mar-17 0.8000 0.8000 15.0660
24-Mar-17 0.8000 0.8000 15.5711
Scheme Name Record Date Individual Corporate NAV(in Rs./Unit) (in Rs./Unit) ( )`
Regular Plan - Annual Div
Direct Plan - Annual Div
Regular Plan - Annual Div
Direct Plan - Annual Div
Regular Plan - Annual Div
Direct Plan - Annual Div
Face value: 10`
SBI Magnum Gilt Fund - Long Term Plan Dividend -PF Fixed 1 Year - Quarterly Dividend
30-Dec-16 0.2000 0.2000 13.3213
24-Mar-17 0.1500 0.1500 13.2200
30-Jun-17 0.2500 0.2500 13.5654
29-Sep-17 0.2000 0.2000 13.4245
29-Dec-17 0.2000 0.2000 13.0372
Scheme Name Record Date Individual Corporate NAV(in Rs./Unit) (in Rs./Unit) ( )`
Dividend - PF Fixed 1 Year
Dividend - PF Fixed 1 Year
Dividend - PF Fixed 1 Year
Dividend - PF Fixed 1 Year
Dividend - PF Fixed 1 Year
Face value: 10`
30-Dec-16 0.2000 0.2000 13.4616
24-Mar-17 0.1500 0.1500 13.3607
30-Jun-17 0.2500 0.2500 13.7125
29-Sep-17 0.2000 0.2000 13.5722
29-Dec-17 0.2000 0.2000 13.1830
Scheme Name Record Date Individual Corporate NAV(in Rs./Unit) (in Rs./Unit) ( )`
Div-PF Fixed 2 Years
Div-PF Fixed 2 Years
Div-PF Fixed 2 Years
Div-PF Fixed 2 Years
Div-PF Fixed 2 Years
SBI Magnum Gilt Fund - Long Term Plan Dividend -PF Fixed 2 Years - Quarterly Dividend
Face value: 10`
SBI Magnum Gilt Fund - -PF Fixed 3 Years -
Long Term Plan DividendQuarterly Dividend
30-Dec-16 0.2000 0.2000 13.1057
24-Mar-17 0.1500 0.1500 13.0035
30-Jun-17 0.2500 0.2500 13.3392
29-Sep-17 0.2000 0.2000 13.1972
29-Dec-17 0.2000 0.2000 12.8133
Scheme Name Record Date Individual Corporate NAV(in Rs./Unit) (in Rs./Unit) ( )`
Div-PF Fixed 3 Years
Div-PF Fixed 3 Years
Div-PF Fixed 3 Years
Div-PF Fixed 3 Years
Div-PF Fixed 3 Years
Face value: 10`
30-Dec-16 0.2000 0.2000 13.8549
24-Mar-17 0.1500 0.1500 13.7555
30-Jun-17 0.2500 0.2500 14.1250
29-Sep-17 0.2000 0.2000 13.9865
29-Dec-17 0.2000 0.2000 13.5916
Scheme Name Record Date Individual Corporate NAV(in Rs./Unit) (in Rs./Unit) ( )`
Dividend - PF Regular
Dividend - PF Regular
Dividend - PF Regular
Dividend - PF Regular
Dividend - PF Regular
SBI Magnum Gilt Fund - -Long Term Plan DividendQuarterly Dividend
Face value: 10`
Dividend History Of Debt & Hybrid Funds
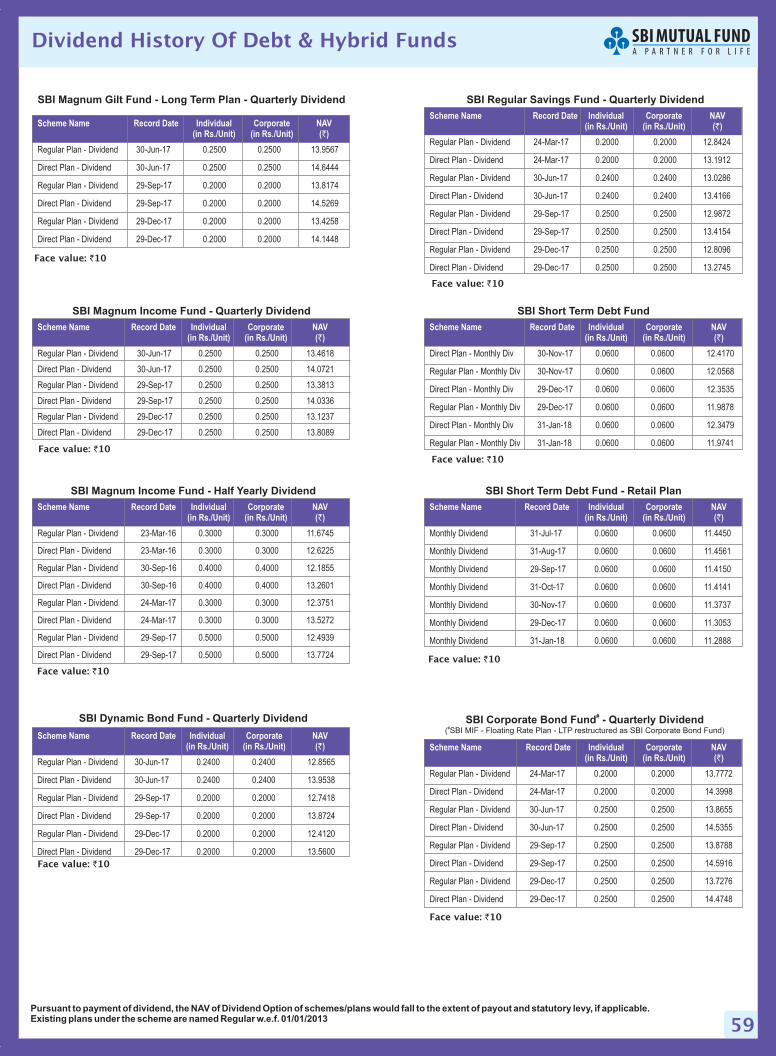
59Pursuant to payment of dividend, the NAV of Dividend Option of schemes/plans would fall to the extent of payout and statutory levy, if applicable.Existing plans under the scheme are named Regular w.e.f. 01/01/2013
SBI Magnum Income Fund - Quarterly Dividend
30-Jun-17 0.2500 0.2500 13.4618
30-Jun-17 0.2500 0.2500 14.0721
29-Sep-17 0.2500 0.2500 13.3813
29-Sep-17 0.2500 0.2500 14.0336
29-Dec-17 0.2500 0.2500 13.1237
29-Dec-17 0.2500 0.2500 13.8089
Scheme Name Record Date Individual Corporate NAV(in Rs./Unit) (in Rs./Unit) ( )`
Regular Plan - Dividend
Direct Plan - Dividend
Regular Plan - Dividend
Direct Plan - Dividend
Regular Plan - Dividend
Direct Plan - Dividend
Face value: 10`
SBI Magnum Income Fund - Half Yearly Dividend
23-Mar-16 0.3000 0.3000 11.6745
23-Mar-16 0.3000 0.3000 12.6225
30-Sep-16 0.4000 0.4000 12.1855
30-Sep-16 0.4000 0.4000 13.2601
24-Mar-17 0.3000 0.3000 12.3751
24-Mar-17 0.3000 0.3000 13.5272
29-Sep-17 0.5000 0.5000 12.4939
29-Sep-17 0.5000 0.5000 13.7724
Scheme Name Record Date Individual Corporate NAV(in Rs./Unit) (in Rs./Unit) ( )`
Regular Plan - Dividend
Direct Plan - Dividend
Regular Plan - Dividend
Direct Plan - Dividend
Regular Plan - Dividend
Direct Plan - Dividend
Regular Plan - Dividend
Direct Plan - Dividend
Face value: 10`
30-Jun-17 0.2400 0.2400 12.8565
30-Jun-17 0.2400 0.2400 13.9538
29-Sep-17 0.2000 0.2000 12.7418
29-Sep-17 0.2000 0.2000 13.8724
29-Dec-17 0.2000 0.2000 12.4120
29-Dec-17 0.2000 0.2000 13.5600
Scheme Name Record Date Individual Corporate NAV(in Rs./Unit) (in Rs./Unit) ( )`
Regular Plan - Dividend
Direct Plan - Dividend
Regular Plan - Dividend
Direct Plan - Dividend
Regular Plan - Dividend
Direct Plan - Dividend
SBI Dynamic Bond Fund - Quarterly Dividend
Face value: 10`
SBI Regular Savings Fund - Quarterly Dividend
24-Mar-17 0.2000 0.2000 12.8424
24-Mar-17 0.2000 0.2000 13.1912
30-Jun-17 0.2400 0.2400 13.0286
30-Jun-17 0.2400 0.2400 13.4166
29-Sep-17 0.2500 0.2500 12.9872
29-Sep-17 0.2500 0.2500 13.4154
29-Dec-17 0.2500 0.2500 12.8096
29-Dec-17 0.2500 0.2500 13.2745
Scheme Name Record Date Individual Corporate NAV(in Rs./Unit) (in Rs./Unit) ( )`
Regular Plan - Dividend
Direct Plan - Dividend
Regular Plan - Dividend
Direct Plan - Dividend
Regular Plan - Dividend
Direct Plan - Dividend
Regular Plan - Dividend
Direct Plan - Dividend
Face value: 10`
SBI Short Term Debt Fund
30-Nov-17 0.0600 0.0600 12.4170
30-Nov-17 0.0600 0.0600 12.0568
29-Dec-17 0.0600 0.0600 12.3535
29-Dec-17 0.0600 0.0600 11.9878
31-Jan-18 0.0600 0.0600 12.3479
31-Jan-18 0.0600 0.0600 11.9741
Scheme Name Record Date Individual Corporate NAV(in Rs./Unit) (in Rs./Unit) ( )`
Direct Plan - Monthly Div
Regular Plan - Monthly Div
Direct Plan - Monthly Div
Regular Plan - Monthly Div
Direct Plan - Monthly Div
Regular Plan - Monthly Div
Face value: 10`
SBI Short Term Debt Fund - Retail Plan
31-Jul-17 0.0600 0.0600 11.4450
31-Aug-17 0.0600 0.0600 11.4561
29-Sep-17 0.0600 0.0600 11.4150
31-Oct-17 0.0600 0.0600 11.4141
30-Nov-17 0.0600 0.0600 11.3737
29-Dec-17 0.0600 0.0600 11.3053
31-Jan-18 0.0600 0.0600 11.2888
Scheme Name Record Date Individual Corporate NAV(in Rs./Unit) (in Rs./Unit) ( )`
Monthly Dividend
Monthly Dividend
Monthly Dividend
Monthly Dividend
Monthly Dividend
Monthly Dividend
Monthly Dividend
Face value: 10`
SBI Magnum Gilt Fund - Long Term Plan - Quarterly Dividend
Scheme Name Record Date Individual Corporate NAV(in Rs./Unit) (in Rs./Unit) ( )`
30-Jun-17 0.2500 0.2500 13.9567
30-Jun-17 0.2500 0.2500 14.6444
29-Sep-17 0.2000 0.2000 13.8174
29-Sep-17 0.2000 0.2000 14.5269
29-Dec-17 0.2000 0.2000 13.4258
29-Dec-17 0.2000 0.2000 14.1448
Face value: 10`
Regular Plan - Dividend
Direct Plan - Dividend
Regular Plan - Dividend
Direct Plan - Dividend
Regular Plan - Dividend
Direct Plan - Dividend
24-Mar-17 0.2000 0.2000 13.7772
24-Mar-17 0.2000 0.2000 14.3998
30-Jun-17 0.2500 0.2500 13.8655
30-Jun-17 0.2500 0.2500 14.5355
29-Sep-17 0.2500 0.2500 13.8788
29-Sep-17 0.2500 0.2500 14.5916
29-Dec-17 0.2500 0.2500 13.7276
29-Dec-17 0.2500 0.2500 14.4748
Scheme Name Record Date Individual Corporate NAV(in Rs./Unit) (in Rs./Unit) ( )`
Regular Plan - Dividend
Direct Plan - Dividend
Regular Plan - Dividend
Direct Plan - Dividend
Regular Plan - Dividend
Direct Plan - Dividend
Regular Plan - Dividend
Direct Plan - Dividend
SBI Corporate Bond Fund - Quarterly Dividend#
(#SBI MIF - Floating Rate Plan - LTP restructured as SBI Corporate Bond Fund)
Face value: 10`
Dividend History Of Debt & Hybrid Funds
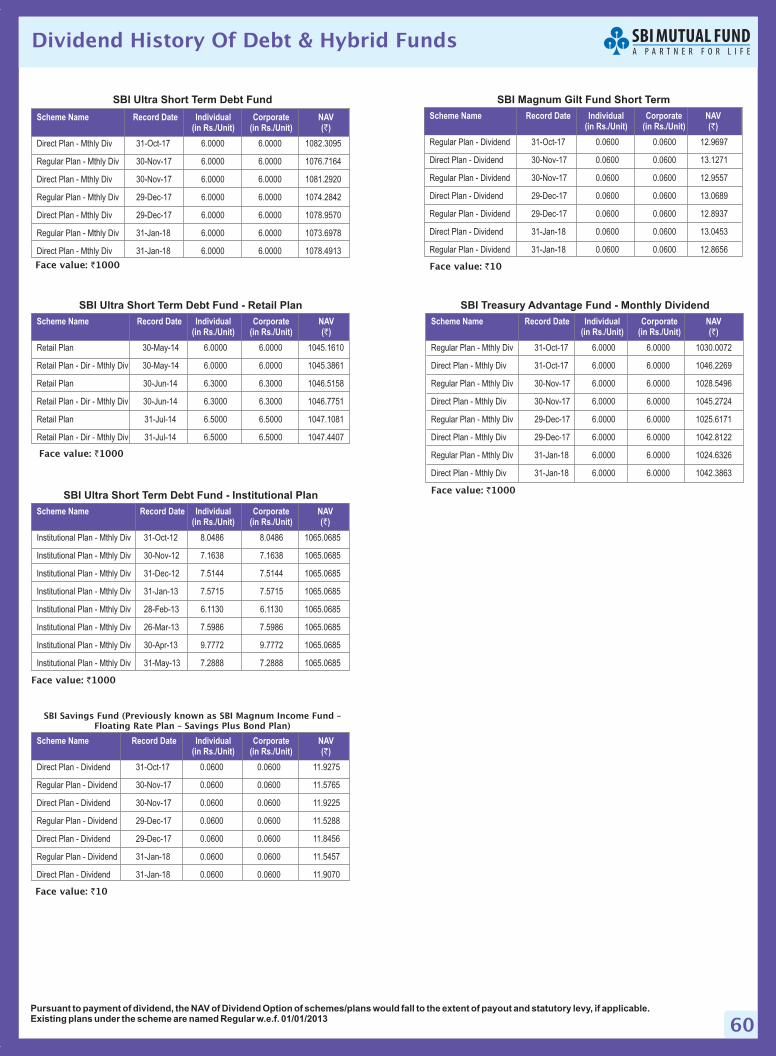
60Pursuant to payment of dividend, the NAV of Dividend Option of schemes/plans would fall to the extent of payout and statutory levy, if applicable.Existing plans under the scheme are named Regular w.e.f. 01/01/2013
31-Oct-17 6.0000 6.0000 1082.3095
30-Nov-17 6.0000 6.0000 1076.7164
30-Nov-17 6.0000 6.0000 1081.2920
29-Dec-17 6.0000 6.0000 1074.2842
29-Dec-17 6.0000 6.0000 1078.9570
31-Jan-18 6.0000 6.0000 1073.6978
31-Jan-18 6.0000 6.0000 1078.4913
Scheme Name Record Date Individual Corporate NAV(in Rs./Unit) (in Rs./Unit) ( )`
Direct Plan - Mthly Div
Regular Plan - Mthly Div
Direct Plan - Mthly Div
Regular Plan - Mthly Div
Direct Plan - Mthly Div
Mthly Div
Mthly Div
Regular Plan -
Direct Plan -
SBI Ultra Short Term Debt Fund
Face value: 1000`
SBI Ultra Short Term Debt Fund - Retail Plan
31-Jul-14 6.5000 6.5000 1047.1081
31-Jul-14 6.5000 6.5000 1047.4407
30-May-14 6.0000 6.0000 1045.1610
30-May-14 6.0000 6.0000 1045.3861
30-Jun-14 6.3000 6.3000 1046.5158
30-Jun-14 6.3000 6.3000 1046.7751
Scheme Name Record Date Individual Corporate NAV(in Rs./Unit) (in Rs./Unit) ( )`
Retail Plan
Retail Plan - Dir - Mthly Div
Retail Plan
Retail Plan - Dir - Mthly Div
Retail Plan
Retail Plan - Dir - Mthly Div
Face value: 1000`
SBI Ultra Short Term Debt Fund - Institutional Plan
31-Oct-12 8.0486 8.0486 1065.0685
30-Nov-12 7.1638 7.1638 1065.0685
31-Dec-12 7.5144 7.5144 1065.0685
31-Jan-13 7.5715 7.5715 1065.0685
28-Feb-13 6.1130 6.1130 1065.0685
26-Mar-13 7.5986 7.5986 1065.0685
30-Apr-13 9.7772 9.7772 1065.0685
31-May-13 7.2888 7.2888 1065.0685
Scheme Name Record Date Individual Corporate NAV(in Rs./Unit) (in Rs./Unit) ( )`
Institutional Plan - Mthly Div
Institutional Plan - Mthly Div
Institutional Plan - Mthly Div
Institutional Plan - Mthly Div
Institutional Plan - Mthly Div
Institutional Plan - Mthly Div
Institutional Plan - Mthly Div
Institutional Plan - Mthly Div
Face value: 1000`
SBI Treasury Advantage Fund - Monthly Dividend
31-Oct-17 6.0000 6.0000 1030.0072
31-Oct-17 6.0000 6.0000 1046.2269
30-Nov-17 6.0000 6.0000 1028.5496
30-Nov-17 6.0000 6.0000 1045.2724
29-Dec-17 6.0000 6.0000 1025.6171
29-Dec-17 6.0000 6.0000 1042.8122
31-Jan-18 6.0000 6.0000 1024.6326
31-Jan-18 6.0000 6.0000 1042.3863
Scheme Name Record Date Individual Corporate NAV(in Rs./Unit) (in Rs./Unit) ( )`
Regular Plan - Mthly Div
Direct Plan - Mthly Div
Regular Plan - Mthly Div
Direct Plan - Mthly Div
Regular Plan - Mthly Div
Direct Plan - Mthly Div
Regular Plan - Mthly Div
Direct Plan - Mthly Div
Face value: 1000`
SBI Magnum Gilt Fund Short Term
31-Oct-17 0.0600 0.0600 12.9697
30-Nov-17 0.0600 0.0600 13.1271
30-Nov-17 0.0600 0.0600 12.9557
29-Dec-17 0.0600 0.0600 13.0689
29-Dec-17 0.0600 0.0600 12.8937
31-Jan-18 0.0600 0.0600 13.0453
31-Jan-18 0.0600 0.0600 12.8656
Scheme Name Record Date Individual Corporate NAV(in Rs./Unit) (in Rs./Unit) ( )`
Regular Plan - Dividend
Direct Plan - Dividend
Regular Plan - Dividend
Direct Plan - Dividend
Regular Plan - Dividend
Direct Plan - Dividend
Regular Plan - Dividend
Face value: 10`
SBI Savings Fund (Previously known as SBI Magnum Income Fund –Floating Rate Plan – Savings Plus Bond Plan)
31-Oct-17 0.0600 0.0600 11.9275
30-Nov-17 0.0600 0.0600 11.5765
30-Nov-17 0.0600 0.0600 11.9225
29-Dec-17 0.0600 0.0600 11.5288
29-Dec-17 0.0600 0.0600 11.8456
31-Jan-18 0.0600 0.0600 11.5457
31-Jan-18 0.0600 0.0600 11.9070
Scheme Name Record Date Individual Corporate NAV(in Rs./Unit) (in Rs./Unit) ( )`
Direct Plan - Dividend
Regular Plan - Dividend
Direct Plan - Dividend
Regular Plan - Dividend
Direct Plan - Dividend
Regular Plan - Dividend
Direct Plan - Dividend
Face value: 10`
Dividend History Of Debt & Hybrid Funds
61
Disclaimer for data from CRISIL'S FUND ANALYSER:
Disclaimer:
Disclaimer of SBI Nifty Index Fund:
Mutual Fund Investments are subject to market risks, read all scheme related documents carefully.
Asset Management Company:
Trustee Company:
Registered Office:
CRISIL has taken due care and caution in compilation of the
Data contained in the CRISIL'S FUNDANALYSER. The Data in the CRISIL'S FUNDANALYSER has been obtained by
CRISIL from sources, which it considers reliable. However, CRISIL does not guarantee the accuracy, adequacy or
completeness of any Data in the CRISIL'S FUND ANALYSER and is not responsible for any errors or omissions or for
the results obtained from the use of such Data. CRISIL especially states that it has no financial liability whatsoever to
the users of CRISIL'S FUND ANALYSER. CRISIL or any of its directors/ employees/ representatives does not accept
any liability for any direct or consequential loss arising from the use of the Data contained in the CRISIL'S FUND
ANALYSER or any data generated from the CRISIL'S FUNDANALYSER.
This investment update is for information purpose only and is not an offer to sell or a solicitation to buy any
mutual fund units/securities. These views alone are not sufficient and should not be used for the development or
implementation of an investment strategy. It should not be construed as investment advice to any party.All opinions and
estimates included in this schemes guide constitute our view as of this date and are subject to change without notice.
Neither SBI Funds Management Private Limited, nor any person connected with it, accepts any liability arising from the
use of this information. The recipient of this material should rely on their own investigations and take professional
advice on their own.
In the preparation of the material contained in this document, the AMC has used information that is publicly available,
including information developed in-house. Information gathered and material used in this document is believed to be
from reliable sources published by third parties. While such publications are believed to be reliable, however, neither
theAMC, its officers, the trustees, the Fund nor any of their affiliates or representatives assume any responsibility of the
accuracy, reasonableness and/or completeness of any information. For data referred to of any third party in this
material no such party will assume any liability for the same. Further, all opinion included in this newsletter are as of date
and are subject to change without any notice.All recipients of this material should seek appropriate professional advice
and carefully read the scheme information document/ statement of additional information and before dealing and or
transacting in any of the products referred to in this material make their own investigation.The Fund, the AMC and
Trustees and any of its directors, officers, employees and other personnel shall not liable for any loss, damage of any
nature, including but not limited to direct, indirect, punitive, special, exemplary, consequential, as also any loss of profit
in any way arising from the use of this material in any manner whatsoever. The recipient alone shall be fully
responsible/are liable for any decision taken on the basis of this material.
“The “SBI Nifty Index Fund” offered by “SBI Funds Management Private Limited”
is not sponsored, endorsed, sold or promoted by India Index Services & Products Limited (IISL) and its affiliates. IISLdo
not make any representation or warranty, express or implied (including warranties of merchantability or fitness for
particular purpose or use) and disclaims all liability to the owners of “SBI Nifty Index Fund” or any member of the public
regarding the advisability of investing in securities generally or in the “SBI Nifty Index Fund” linked to Nifty 50 Index or
particularly in the ability of the Nifty 50 Index to track general stock market performance in India. Please read the full
Disclaimers in relation to the Nifty 50 Index in the Scheme Information Document.”
SBI Funds Management Private Limited (A joint venture between SBI & AMUNDI)
CIN: U65990MH1992PTC065289. SBI Mutual Fund Trustee Company Private Limited
9th Floor, Crescenzo, C-38 & 39, G Block, Bandra-Kurla Complex,
Bandra (East), Mumbai 400 051. Tel.: 022-61793000 E-mail : [email protected] • www. sbimf.com
CIN:
U65991MH2003PTC138496.
Disclaimer
62
NORTH
SOUTH
EAST
WEST
Chandigarh: 0172-2703380 • Gurgaon: 0124-4200828/ 0124-4083769 • Jaipur: 0141-2740061/2740023• Kanpur: 0512-6900314/15 • Lucknow: 0522-2286742 • Ludhiana: 0161-2449849 • New Delhi: (011) 23466666Aligarh: 0571-2402017 • Ambala: (0171) 2653400 • Bathinda: (0164) 2218415 • Dehradun: 0135-2651719• Dhanbad: 0326-2301545 • Dharamshala: 01892-225814 • Faizabad: 919999029351/ 919811607620• Faridabad: 0129 - 4030661 • Ferozepur: 01632-236167 • Ghaziabad: 0120-2797582 Gorakhpur:0551-2203378 • Haldwani: 0594-6220526 • Hissar: 01662 238415 Hosiharpur: 0188-2228415 • Jabalpur:0761-2410042 • Jalandhar: 0181-2238415 • Jammu: 0191-2474975 • Jhansi: 0510-2330298 • Jodhpur:0291-2611929/ 28 • Leh: 09469468778 • Meerut: 0121-2667877 • Moradabad: 0591-2411411 • Panchakula:9592008415 • Panipat: 0180-2648415 • Pathankot: 8872008415 • Patiala: 0175-2300058 • Rohtak:(0126) 2258415 • Saharanpur: 0132-2720789 • Shimla: 0177-2807608 • Sonepat: 011- 23466666 • Udaipur: -• Varanasi: 0542-2222492 • Nehru Place (Delhi): (011) 26224606 • Noida: 0120-4232214 • Pitam Pura (Delhi):(011) 23751974
Bangalore: 080-25580014/51 • Chennai : 044 2854 3382/83 • Coimbatore: 0422 - 2541666 • Ernakulam:0484-2323489 2318886 • Hyderabad: 040-69000541/42 • Thrivanthapuram: 0471-4011590 / 4011591 / 4011592• Vijayawada: 0866-2436113/2438217 Bareilly: 7830111140 • Belgaum: 0831-2422463 • Bellary: 0839-2271775• Calicut: 0495-2768270/4020079 • Cuttack: 0671-2422792 • Davangere: 08192-231463
• Guntur: 0863-2211022 • Hubli: 0836-2368477 • Kannur: 0497-2708180 • Kollam: 0474-2752760• Kottayam: 0481-2570816 • Kurnool: 08518-227776 • Madurai: 0452 4374242 • Mangalore: 0824-2222463• Mysore: 0821-2424919 • Nellore: 0861-2338688 • Pondichery: 9445196934 • Rajahmundry:0883-2434002/2432306 • Salem: 0427 - 4552289 • Shimoga: 08182-222463 • Thiruchirapalli: 0431-4000667• Thrissur: 8129354324 • Thrissur: 0487-2445700 • Tinsukia: - • Tirunelveli: 0462 4220023 • Tirupati(0877)6450828 • Vellore: 0416- 2225005 • Vishakapatnam: 0891-3293018/2511853 • Warangal: 0870-2430307
Bhubaneshwar: (0674) 2392401/501 • Guwahati: 0361-2463747/2130366 • Kolkata: 22882342 / 22883767 /22883768 • Patna: 0612-3242047 • Raipur: (0771) 2543355 / 4263256 • Ranchi:0651-2213212/3205026 Agartala: 0381-2384107 • Asansol: 8170037270 • Balasore: 0678-2262646• Bhagalpur: 0641-2420661 • Bhilai: 0788-6940012/6940011-6940010/6940014/6940013 • Bokaro: 9304823011• Bokaro: 06542-232561 • Burdwan: 8335844461 • Darbhanga: 06272-245004 • Dimapur: 0386-2224267• Durgapur: 2544191 / 192 • Gaya: 0631-2222405 • Hazaribagh: 06546-270415 • Imphal: 0386-2224267• Itanagar: 0360-2292416 • Jamshedpur: 0657-2440446 • Jorhat: 0367-2304396 • Kalyani: 033-25827700• Kharagpur: (03222) 225592 • Malda: (03512)266128 • Port Blair: (03192)235552 • Rourkela: 0661-2400299• Sambalpur: 0663-2410001 • Shillong: 9436704232 • Silchar: 0384-2221109 • Siliguri: (0353) 2537065• Sriganganagar: 9829067384
Ahmedabad: 079-26423060/70; 26463090 • Bhopal: 0755-2557341 • Goa: (0832) 2235283 / 6642475 • Indore:0731-2541141/6900080/85 • Mumbai: (022) 66532800 • Nagpur: 0712 - 6458368 • Pune: 020 25670961/25671524/ 25653398 / 99 • Surat: 0261-3994800/6646555/2462764 • Vadodara: 0265-2323010 Agra: 0562-2850239 • Ajmer: 0145-2426284 • Allahabad: 0532-2261028 • Alwar: (0144) 2332035 • Amravati: - • Amritsar:0183-2221755 • Anand: 02692-246210 • Aurangabad: 0240 3244781 • Bavnagar: (0278) 2523788 • Bharuch:02642-247550 • Bhilwara: 01482-240144 • Bhuj: (02832) 250900 • Bilaspur: 07752-415300 • Gandhidham:02836-233615 • Gwalior: 0751-2447272 • Jalgaon: 9545025850 • Jamnagar: (0288) 2660104 • Junagadh: 0285-2670350 • Kolhapur: 0231 2680880 • Korba: 07759-230082 • Kota: 0744 – 2390631 • Margao: 0832-6578283• Mehsana: 02762-233872 • Nadiad: 0268-2560110 • Nashik: 0253 - 6575888, 2232553 • Navsari: 02637-242266• Raipur: (0771) 2543355 / 4263256 • Rajkot: 0281-2466740/41 • Ratlam: 07412-409492 • Sagar: 07582-241367• Solapur: 09226389292 • Srinagar: 0194-2474864 • Valsad: 02632-245440 • Vapi: 0260-2400480 • Borivali(Mumbai): 022-28927551 • Chinchwad: 020 27355721 • Kalyan: (0251) 2311850 / 2311980 • Thane:022-25414594 • Vashi: 022-27810368
•
• Gulbarga:9980872463
• Muzzaffarpur: 9473199059
•
SBI Funds Management Pvt Ltd Branches
63
Fund Manager :
Application Amount for Fresh Subscription :
Minimum Additional Amount :
Yield to Maturity :
SIP :
NAV :
Benchmark :
Entry Load :
Note:
Exit Load :
Modified Duration :
Standard Deviation :
Sharpe Ratio :
Beta :
AUM :
Holdings :
Nature of Scheme :
Rating Profile :
Tracking Error :
An employee of the asset management company such as a mutual fund or life insurer, who managesinvestments of the scheme. He is usually part of a larger team of fund managers and research analysts.
This is the minimum investment amount for a new investor in a mutual fundscheme.
This is the minimum investment amount for an existing investor in a mutual fund scheme.
The Yield to Maturity or the YTM is the rate of return anticipated on a bond if held until maturity. YTM isexpressed as an annual rate. The YTM factors in the bond's current market price, par value, coupon interest rate and time tomaturity.
SIP or systematic investment plan works on the principle of making periodic investments of a fixed sum. It works similarto a recurring bank deposit. For instance, an investor may opt for an SIP that invests Rs 500 every 15th of the month in anequity fund for a period of three years.
The NAV or the net asset value is the total asset value per unit of the mutual fund after deducting all related andpermissible expenses. The NAV is calculated at the end of every business day. It is the value at which the investor enters orexits the mutual fund.
A group of securities, usually a market index, whose performance is used as a standard or benchmark tomeasure investment performance of mutual funds, among other investments. Some typical benchmarks include the Nifty 50,S&P BSE Sensex, BSE 200, BSE 500, 10-Year Gsec.
A mutual fund may have a sales charge or load at the time of entry and/or exit to compensate thedistributor/agent. Entry load is charged at the time an investor purchases the units of a mutual fund. The entry load is added tothe prevailing NAV at the time of investment. For instance, if the NAV is Rs. 100 and the entry load is 1%, the investor will enterthe fund at Rs 101.
SEBI, vide circular dated June 30, 2009 has abolished entry load and mandated that the upfront commission todistributors will be paid by the investor directly to the distributor, based on his assessment of various factors including theservice rendered by the distributor
Exit load is charged at the time an investor redeems the units of a mutual fund. The exit load is deducted from theprevailing NAV at the time of redemption. For instance, if the NAV is Rs 100 and the exit load is 1%, the redemption price wouldbe Rs 99 Per Unit.
Modified duration is the price sensitivity and the percentage change in price for a unit change in yield
Standard deviation is a statistical measure of the range of an investment's performance. When a mutualfund has a high standard deviation, its means its range of performance is wide, implying greater volatility.
The Sharpe Ratio, named after its founder, the Nobel Laureate William Sharpe, is a measure of risk-adjustedreturns. It is calculated using standard deviation and excess return to determine reward per unit of risk.
Beta is a measure of an investment's volatility vis-à-vis the market. Beta of less than 1 means that the security will be lessvolatile than the market. A beta of greater than 1 implies that the security's price will be more volatile than the market.
AUM or assets under management refers to the recent / updated cumulative market value of investments managed by amutual fund or any investment firm.
The holdings or the portfolio is a mutual fund's latest or updated reported statement of investments/securities.These are usually displayed in terms of percentage to net assets or the rupee value or both. The objective is to give investors anidea of where their money is being invested by the fund manager.
The investment objective and underlying investments determine the nature of the mutual fund scheme.For instance, a mutual fund that aims at generating capital appreciation by investing in stock markets is an equity fund orgrowth fund. Likewise, a mutual fund that aims at capital preservation by investing in debt markets is a debt fund or incomefund. Each of these categories may have sub-categories.
Mutual funds invest in securities after evaluating their creditworthiness as disclosed by the ratings. Adepiction of the mutual fund in various investments based on their ratings becomes the rating profile of the fund. Typically,this is a feature of debt funds.
Measure that indicates how closely the portfolio return tracks the benchmark return. Tracking error is thestandard deviation of the difference of returns between a portfolio and the benchmark over a specified holding period.
S&P S&P
How to read the Factsheet?