numerical and experimental investigation of buoyant gas
TRANSCRIPT

1
NUMERICAL AND EXPERIMENTAL INVESTIGATION OF BUOYANT GAS RELEASE
Chernyavsky, B., Wu, T.-C., Oshkai, P. and Djilali, N.
Institute for Integrated Energy Systems, and Department of Mechanical Engineering, University of Victoria, Victoria, BC, V8W 3P6, Canada, [email protected]
ABSTRACT Buoyant round vertical jet had been investigated using Large Eddy Simulations at low Mach number. For the purpose of comparison with in-house experimental data, in the present work helium has been used as a substitute for hydrogen. The influence of the transient concentration fields on the volume of gas with concentration within flammability limits has been investigated, and their evolution and relation with average fields ad been characterized. Transient concentration fields created during initial jet development had been considered. Numerical results have been compared with in-house experiments and data published in the literature.
1.0 INTRODUCTION
A growing concern regarding human induced-climate change, including the effects of the greenhouse emissions on the global warming strengthen the case for the concerted efforts at emission reduction. It is particularly important in the field of transportation. One of the advanced concepts under the consideration is implementation of hydrogen as a primary power source for the road vehicles. One of the problems which need to be resolved before the wide scale commercial introduction of the fuel cell powered vehicles becomes possible is the problem of hydrogen storage and associated safety issues. Safe industrial utilization of hydrogen requires the development of guidelines dealing with emergency release of hydrogen from the vehicle tank or refuelling and storage facility. One of the most important issues in formulating such guidelines is the understanding of an evolution of hydrogen concentration field, resulting from the controlled or uncontrolled release of hydrogen [1]. In order to guide the formulation of industrial codes and standards addressing hydrogen storage and transport, it is necessary to achieve better understanding of the physics associated with the development and behaviour of the hydrogen jets.
Over the years, an extensive body of knowledge describing evolution of a round jet has been compiled on the basis of both numerical and experimental studies ([2] – [5], among others). Physical problems requiring further investigation include jet behavior and evolution in transient regimes over a wide range of both subsonic and supersonic initial release velocities; the effects of various (and potentially variable) exhaust nozzle geometries; the effects of turbulence on the jet breakups, the effects of buoyancy, and the influence of adjacent solid surfaces. Computational challenges include validation of numerical models over a wide range of initial conditions.
Present work has been a part of the numerical and experimental study concentrating on investigation of the momentum dominated region of the moderately subsonic buoyant round jet. It has been aimed at improving understanding of the interaction between turbulence, buoyancy and entrainment, and the impact of these phenomena on jet spreading, mixing and therefore concentration fields, and concentrated on the validation of the numerical model against a set of in-house experiments, investigation of the buoyancy influence on the binary jet development, investigation of the initial exhaust condition influence on the initial jet development and transition to self-similar mode, and investigation of the importance of the transient concentration field.
Present work investigated jet release through a round opening, corresponding to a case of a controlled release with fixed inflow boundary conditions. It addressed moderately subsonic (M ~ 0.3) gas release,

primarily within momentum-dominated regime. It therefore occupied a less explored area between a large body of works, concentrating on the supersonic regimes (cf. [6], [7] etc.), and investigations covering a very low speed releases, where the gas can be considered essentially incompressible, and the concentration field evolution is governed primarily by the mixing with small or non-existent momentum-dominated area ( cf. [3], [8]). While the emphasis on the high speed gas releases is justified since it has been shown [1], [7] that the supersonic regime would be dominant during most of the venting from the compressed vessels used in automotive applications, subsonic regime remains important for a number of problems, since it can significantly alter the concentration fields at the later stages of gas release and in the far field of the jet, e.g., through the increased importance of buoyancy relative to momentum effects. Subsonic cases are also important for consideration of the leak scenarios (when compressed vessel structural integrity is preserved), as well as for more violent releases from storage facilities, caused by the breach of thermal insulation and associated vaporization and subsequent escape of the stored hydrogen, with vaporization rates driving the exhaust conditions.
Present work had been focused on the investigation of the evolution of concentration field regions with gas concentration within flammability threshold, with particular emphasize on the evolution of the transient concentration fields; other results obtained in the course of resent project (e.g., buoyancy effects, influence of the initial exhaust conditions, etc., had been reported elsewhere). Evolution of regions with flammable conditions had been previously explored in [9] (primarily for supersonic flows), and [10], with the latter in particular indicating the importance of transient fields. In order to validate numerical results by comparison with experiment, hydrogen was substituted in the present work by helium, with the flammability thresholds being retained at the values corresponding to hydrogen (0.04 - 0.75 by volume fraction [11]). Regions with instantaneous gas concentration within flammability limits had been monitored, and the cumulative volume of such transient flammable regions was compared with the volume of time-averaged concentrations within flammability limits and with volume of regions of persistent gas concentration within flammability limits.
The inherent danger of hydrogen/air mixture in terms of flammability makes experimental study of hydrogen release difficult and expensive. Thus, numerical simulations became a tool of choice for the investigation of physical phenomena associated with such release. Numerical simulation tools must however be validated against suitable experiments; the use of helium jet discharging in air is particularly useful for this purpose as it allows observation of buoyancy effects. Large Eddy Simulation (LES) methodology, previously used for jet simulations had been used for numerical modelling. It had been previously successfully applied to the jet release problems in, among other, [6], [12]. Smagorinsky subgrid scale (SGS) model, used in the present work had been previously successfully applied to a (non-buoyant) jet exhaust problem by [12] for a wide range of Reynolds numbers and exhaust velocities. The simulations were performed using the commercial CFD code FLUENT 6.3 [13], using the finite volume explicit numerical solver (steady state helium jet cases), and Structured PArallel Research Code (SPARC) [14] (early stage of hydrogen jet development cases). The numerical simulations were validated against in-house experiments with helium jet using Particle Image Velocimetry measurements.
2.0 GOVERNING EQUATIONS AND NUMERICAL SOLVER
Numerical algorithm solves system of Navier Stokes equations in the form of: Conservation of mass:
( ) 0=vρ+tρ r
⋅∇∂∂
, (1)
where ρ is the density and v is the velocity vector; Conservation of momentum: r
( ) ( ) ( ) gρ+Ivv+vμ+p=vvρ+vρt
T rrrrrrr⎥⎦⎤
⎢⎣⎡ ⋅∇−∇∇⋅∇−∇⋅∇
∂∂
32
, (2)
2

where p is the static pressure, μ is the molecular viscosity, I is the unit tensor, and gρr is a gravity force vector; and Conservation of species:
( ) ( ) iii J=Yvρ+ρYt
rr⋅−∇⋅∇
∂∂
, (3)
where Yi is i-th species mass fraction, and iJr
is the diffusion flux of species i
it
tmi,i Y
Scμ
+ρD=J ∇⎟⎟⎠
⎞⎜⎜⎝
⎛−
r, (4)
where Di,m is the diffusion coefficient for species i in the mixture, and Sct is the turbulent Schmidt number tt Dρμ / , where tμ is the turbulent viscosity, and Dt is the turbulent diffusivity.
Governing equations for Large Eddy Simulation (LES) approach are obtained through filtered Navier Stokes equations:
∫ ′′′=D
xdxxGxx ),()()( φφ , (5)
where D is the fluid domain and G is the filter function that determines the scale of resolved eddies.
A third-order Monotone Upstream-centered Schemes for Conservation Laws (MUSCL) scheme and a Courant number of unity is used to solve momentum and continuity equations. The convective fluxes are calculated using Roe's Flux Difference Splitting method. The jet is considered to be pure Helium, with pressure, density and temperature coupled through the application of the ideal gas law.
To close the equation system produced by the filtering operations it is necessary to model subgrid scale stresses. In this work we employ Smagorinsky-Lilly subgrid-scale (SGS) model with the eddy-viscosity modeled by:
| |SρL=μ st2 , (6)
where Ls is the mixing length for subgrid scales and | | ijij SSS 2≡ . Ls is computed as
( )3/1VCκd,min=L ss , (7)
where κ is the von Karman constant, d is the distance to the closest wall, Cs is the Smagorinsky constant, and V is the volume of the computational cell.
3.0 SETUP OF THE COMPUTATIONAL DOMAIN
Numerical simulations have been performed for a helium jet with initial release velocity of 280 m/s (M ~ 0.3), Re = 11881 and Fr = 509, corresponding to the conditions investigated in the experiments. The computations were performed using a multiblock grid consisting of a cylinder representing an internal part of the injection nozzle and a frustum shaped external region. The cylinder simulates the outer portion of the nozzle and serves to generate a realistic flowfield at the nozzle exit. It has a diameter (D) of 5 mm and a similar length, with the pressure inlet boundary condition at the open exit and no slip boundaries on the walls. The inlet pressure and initial turbulence and velocity conditions are chosen to generate the desired velocity and turbulence profiles at the nozzle exit (Fig. 1).
3

4
Figure 1. Schematic of the computational domain and grid cross section at x=0. Unshaded central area corresponds to the inflow boundary, shaded to the wall boundary condition
The main computation domain consists of a frustum with a base diameter of 10 D, an outer diameter of 60 D, and a height of 30 D. The base of the frustum is set to a no-slip condition, while the sides are set to the pressure inlet condition to allow for entrainment. Outer boundary of the frustum is set to a pressure outlet condition. The cross section and general configuration of the grid are shown in Fig. 1. O-type grid is employed to avoid singularity at the jet axis, with transition between internal square and external radial grids well within inlet core. The flow was allowed to develop until it reached quasi-steady state, after which simulations were performed over approximately 8 x 10⁻² s (or ~ 150 flow-through times based on the exhaust velocity) to obtain the turbulence statistics.
4.0 EXPERIMENTAL SYSTEM AND TECHNIQUE
In order to validate numerical simulation a series of the experiments were performed on the jet facility which consists of a honeycomb settling chamber and a contraction section. The contraction section is a fifth-order polynomial profile [15], satisfying the condition of zero first and second derivatives at the inlet and outlet. The exit nozzle diameter is 5 mm (D) where air and helium were supplied by a compressor and T-cylinder, respectively, and transmitted through the mass flow controllers (Teledyne Hastings, HFC-303) then exhausts vertically to the quiescent room air.
Quantitative flow visualization was accomplished by employing a digital particle image velocimetry (DPIV). The air flow was seeded with olive oil (LaVision Aerosol Generator), with the typical diameter of approximately 1 μm, which served as tracer particles for the flow. Images of the particles, which were illuminated by a dual-head Nd: YAG laser with light sheet optics, were captured by a high-resolution digital camera. The thickness of the laser sheet was about 1mm. The charged-coupled device (CCD) camera was positioned perpendicular to the plane of the light. The CCD camera had a total of 1376 × 1040 pixels. A Nikon Micro-NIKKOR 60mm was used for image acquisition. The lens aperture was opened at f#=4 and the magnification of the camera is 1:2.8. The field of view of the camera was 22 by 16 mm, thus the corresponding scaling factor is about 16 um per pixel. The maximum framing rate of the camera is 15 frames per second, which provides 7.5 cross-correlated images pair per second, however the rate of velocity vector acquisition was further reduced to 4.9Hz due to data transfer rate limitations.
Flow images were captured along different downstream locations, where the appropriate time delay between the two laser pulses was optimized based on the characteristic flow velocity at a given downstream location. These images were then processed using LaVision DaVis 7.2 software to yield the global instantaneous flow velocity measurements. Multi-pass processing with incremental decrease of the interrogation window size from 32 × 32 pixels to 16 × 16 pixels with 50% overlap was used to improve spatial resolution of the resulting vector field. This process resulted in the final spatial resolution of 256 × 256 µm. The PIV images were acquired at a time interval of 0.204 sec, which provided appropriate spacing in time for acquisition of random samples for averaged turbulence statistics. A total of 200 images had been acquired.

5.0 RESULTS AND DISCUSSION
5.1 Validation
The first task of the present work was to compare the velocity fields and turbulence characteristics with experimental results in order to validate numerical model. Figure 2 illustrates the inverse centerline velocity decay uj/uc, as a function of the downstream distance x/D for the air and helium jets. Its shape suggests the presence of a short (~ 2 - 3 x/D) potential core followed by the transition to the self-similarity region. The variation of uc in the expansion region appears to be linear, conforming to uc
-1 ~ x relationship, at x/D > 5 with different slopes for the different density jets. The virtual origin for the numerical simulation xvo = -0.3 x/D, which is close to the typical values reported in the literature for helium jets. For comparison, the virtual origin in the experiment is approximately xvo = -0.2 x/D. The difference can be explained by the differences in the inflow conditions between the simulation and the experiment as well as disturbances present in the inflow ([16], [17]). The coefficient C1 from the relation Lu/d=C1(x-xv01)/d was calculated to be 0.105, which is in agreement with published data (e.g., 0.095 [17]). The coefficient of the axial velocity decay A calculated from the expression ujj/uc=2A((x-xvo)/Def) was 0.099, compared with a value of 0.063 obtained in the experiment. This value lies close to the upper range of values reported in the literature (e.g., [2]). This is consistent with the jet spread rate calculated by the half-velocity width Lu.
Figure 2. Jet spread rate uj/<uc> versus x/D, LES and PIV.
Further evidence of self-similarity can be obtained through analysis of the radial mean longitudinal velocity profiles at various distances from the jet origin. As can be seen in Fig. 3a, although it has been shown that an exact similarity cannot be achieved in buoyant flows [18], the radial profiles of the mean velocity normalized by the centerline mean velocity at x/D = 2, 5, 10, 15 and 20 collapse well and can be reasonably approximated by Gaussian distribution <u>/<uc> = e-(r/Lu)^2ln2. Both numerical simulation and experimental data show good collapse, with the exception of the first curve, corresponding to the x/D = 2, where the influence of the initial jet profile is still significant. The axial evolution of the rms (u'=<u2>1/2 and v'=<v2>1/2) values of axial and radial velocity fluctuation are shown in Fig. 3b. The turbulent intensity u'/<uc> of the helium jet reaches a maximum of approximately 0.38 at x/D = 5 and approach the asymptotic value of ~ 0.28 at x/D ~ 15, which confirms rapid convergence of the helium jet to a self-similar mode. The location of the peak is in a good agreement with experiment. v'/uc component becomes constant farther downstream than u'/uc, reaching asymptotic value of ~ 0.22 at x/D ~ 25. These numbers, along with asymptotic ratio v'/u' ~ 0.78, lie within the range of values cited in the literature for jets ejected from contraction nozzle [17].
5

Figure 3. a) Normalized mean velocity profiles <u>/<uc> versus y/Lu at various distances from the nozzle x/D, LES and PIV; b) RMS to mean velocity ratio u'/<uc> and v'/<u_c> versus x/D at jet
centerline. PIV and LES.
5.2 Averaged Concentration Fields
Figure 4a shows the inverse helium mass and molar fractions at the centerline as a function of a distance from the jet origin. Jet concentration along the centerline obeys the relation [19]
e
voyccj r
xxK>=Y<Y
−/ , (8)
where ( ) 2/1/ ∞ρρr=r je is the effective radius of the jet and xvoy is the virtual origin calculated from mass fraction centerline evolution. An extension of this relation for the flows with global density variations can be written as ( )[ ]Kρρ+rxK>=Y<Y jeccj 1/// −∞ [5], with constant K being negative. Analysis of the data shown in Fig. 6 provides values Kc=0.121 and K=-0.08, which is in good agreement with published data (e.g., Kc=0.107 – Kc=0.156 [8], [20]). The jet growth as determined by half-width Ly is linear, with growth rate somewhat higher for the scalar field compared with velocity field.
Figure 4b illustrates the ratio of the helium mass fraction RMS to the centerline mean mass fraction value Y'/<Yc>. It reaches the peak of ~ 0.45 at approximately 3 nozzle diameters and then decline toward the asymptotic value of ~ 0.29 - 0.30, although it appears to recommence decrease at the end of the computational domain. This value is higher than usually reported in the literature (e.g., [20], ~ 0.20, [8], ~ 0.23), although some experimental works did indicated even higher values (e.g., [21], Y'/<Yc> ~ 0.37). The higher unmixedness value potentially indicates the possible higher entrainment due to the buoyancy effects.
Figure 5a shows self-similar collapse of the helium mass fraction profiles normalized by jet half-width Ly. Non-buoyant jets mixing can be approximated by the Gaussian curve. The deviation of mass fraction profiles in Fig.5a implies the influence of the buoyancy on the mixing process. This can be explained by the effects of buoyancy on the velocity field in the shear layer, affecting mixing process [4]. It can be seen that the helium mass fraction profiles deviate from the Gaussian distribution, characterizing non-buoyant jets, near the jet-ambient air interface, indicating potentially higher mixing and therefore entrainment. This coincides with theoretical predictions by [22], although some experimental data (e.g., [4]) appears to contradict this conclusion.
6

Figure 4. a) Jet spread rate mass fraction Y_j/<Y_c> and molar fraction Xj/Xc versus x/D; b) RMS to mean helium mass fraction ratio Y'/<Yc> versus x/D.
Figure 5. a) Normalized mean concentration (helium mass fraction) profiles <Y>/<Yc> versus y/Ly at various distances from the nozzle x/D; b) Instantaneous helium molar fraction filed.
5.3 Transient Concentration Fields
Most of the experimental and numerical works studying jet release are concentrated on the investigation of mean jet characteristics. However, in evaluation of safety margins for the emergency hydrogen release case, it is equally important to monitor transient concentration fields, since even the transient increase of hydrogen concentration above flammability threshold near ignition source will be sufficient to initiate combustion, despite the time-averaged concentration value at the this location being below the threshold. These transient eddies of high concentration of flammable gas are driven by a combination of the turbulence and the hydrodynamic instabilities, including transversal jet oscillations and vortex generation and shedding at the mixing layer. Indeed, an instantaneous snapshot of the concentration field reveals complex pattern (see Fig. 5b), with a number of pockets of flammable gas with concentration exceeding flammability threshold observed outside the average flammability threshold. It is therefore necessary, in order to establish proper safety margins to take into account transient concentration fields as well as the average filed.
7
One of the primary aims of the present work, therefore, was to characterize these transient concentration fields and determine their relative importance. LES, with its accurate modeling of the turbulent effects, provides a convenient tool to investigate such transient phenomena. Since the present

work used helium jet for the purpose of validation by experiment, the flammability threshold in a subsequent discussion refers to the concentrations values corresponding to the hydrogen flammability threshold. Note that the term 'flammable condition' in the present work refer only to the concentrations within flammability limits, and do not take into account flow velocity, turbulence level, temperature, etc., which might inhibit ignition.
In order to assess the extent and persistence of the transient concentration field, cumulative data on the presence of gas concentration within flammability limits (4 – 75% by volume) has been collected. In order to avoid the influence of the (quasi-)periodical phenomena, cumulative data has been collected by performing random sampling over a period of time significantly exceeding periods of known instabilities (over a 50 flow-through times, based on an exhaust velocity). The number of samples in which concentration in a given cell lied within flammability threshold, normalized by total number of samples, is referred to as a frequency of flammable condition occurrence in a given cell, and characterize persistence of the flammable conditions. Present work concentrated on the momentum dominated near field of the jet (X/D < 30 for the present work), encompassing transition from the potential flow and the initial stages of the self-similar expansion. Note that while transient effects are expected to play lesser role in the momentum dominated area when compared to the far field where buoyancy and turbulence effects become dominant, it is nevertheless an important region due to its proximity to the storage tank and potential ignition sources.
Figure 6. Iso-surfaces of the volume where flammability limit is exceeded (smaller iso-surfaces on the right illustrate the volume where upper flammability limit is exceeded) a) at least in one of the samples, b) persistently (i.e., in each sample), and c) based on the averaged gas concentrations.
Figures 6 and 7 illustrate the results of transient flammability data collection. Figure 6a and 6b show iso-surfaces corresponding to spatial extent of minimum (i.e., occurred once during data collection) and maximum (i.e., flammable condition persisted through all samples) frequency of presence of flammable conditions correspondingly. Note that both surfaces have ``lumped'' appearance, being superposition of the individual transient vortical tubes. The persistent flammable condition iso-surface exhibit much finer ``lumps'', due both to the finer scale, and the higher frequency of vortical eddies passing through it, while the surface representing maximum extent of flammable conditions (Fig. 7) is formed by a small number, or even by individual vortical eddies reaching extreme distances from the centerline.
8

Figure 7. Spatial distribution of the cells with helium concentration within (hydrogen) flammability limits. Colours denote the frequency of occurrence of flammable conditions. Solid lines show
minimum (4%) and maximum (75%) hydrogen flammability thresholds for average gas concentration.
Figure 7 illustrates the frequency of flammable condition occurrence in jet cross-section. Red area in the core of the jet indicates the area of persistent helium concentration above (hydrogen) flammability limit. It can be seen that the transient flammable zones more than double the extent of flammability zone. The area of the concentration exceeding upper flammability threshold is relatively small, but nevertheless significant as it is occurs in the immediate vicinity of the storage tank and potential ignition sources. Figure 6 illustrate iso-surfaces of the region where gas concentration exceeds upper flammability threshold, for the transient and persistent cases correspondingly. It can be seen that the persistent region of excessive concentration is confined to the cylinder with diameter not exceeding initial nozzle diameter and terminating near the point of the beginning of jet transition from the potential flow to the self-similar mode, at approximately 2-2.5 x/D. The transient region of excessive gas concentrations extends significantly further, up to ~7 x/D, and exhibits characteristic “lumped” surface formed by superposition of small-scale eddies. Figure 8a illustrates frequency of the flammable condition occurrence at five distances from the nozzle, x/D = 2, 5, 10, 15 and 20. It illustrates the significant extent of area with excessive transient concentration values at x/D = 2 and 5, and Fig. 8b shows the frequency of excessive concentration occurrence on the jet centerline.
The implication of the transient concentration fields for the safety guidelines are summarized in Fig. 9. Figure 9a shows comparison between jet width defined by different criteria, with three new definition of the jet width introduced in Fig. 9a: Lf, is the width of the jet defined by the maximum extent of the flammable conditions observed during data collection, <Lf> is the jet width defined by the extent of the region with average gas concentration exceeding flammability threshold, and Lpf. is the jet width defined by the extent of the persistent flammable condition (i.e., all samples show concentration within flammable range). It can be seen that the Lpf. closely matches jet width Lu derived from velocity. It is confined to the core of the jet, inside of the mixing layers. The Lf, width is growing noticeably faster than Lu, and faster than the average <Lf>, indicating that the growth rate of the extent of transient flammable regions exceed jet core growth, as can be expected with the reduction of momentum dominance. Figure 9b illustrates the relationships between Lf, <Lf> and Lpf. It is seen that the ratio between Lf, and <Lf> varies between ~ 75% and 85%, increasing with the distance from the nozzle, indicating the increasing range of transient eddies carrying flammable gas concentrations. Difference between average and the maximum extent of transient flammable concentration width is sufficiently significant (25% at 27 x/D) to warrant consideration in the development of safety guidelines, particularly if the difference in area rather than radius is taken into account. Note that the reverse can be true as well - it had been reported [10] that at M ~ 0.2 the minimal hydrogen concentration for ignition was 6.4-7.5% rather than 4%, which was attributed to influence of the transient eddies with lean hydrogen mixture. The ratio between Lf, and Lpf. varies in a range of 30% to 40%, with Lpf. growing with rate closer to the growth rate of velocity based Lu. This indicates that the
9

jet remains in the momentum dominated mode throughout the computational domain. It can be noted in Figs. 7 and 8a that the persistent flammable condition region becomes discontinuous toward the end of the domain (x/D → 30). It can be expected that further downstream with the decrease of centerline concentration, beginning of jet core break up and increase of eddies spread, the persistent flammable conditions would terminates.
Figure 8. a) Frequency of flammable conditions occurrence at various distances from the nozzle x/D; b) Frequency of the flammable condition occurrence along the jet centerline near the nozzle.
Figure 9. a) Jet half-width determined by velocity (Lu) and Helium mass fraction (Ly), compared with the half-width of the maximum extent of transient flammable region Lf, averaged flammable region
<Lf>, and persistent flammable region Lpf; b) The ratio of the maximum extent of the transient flammable region to the average flammable region (round markers), and persistent flammable region
(square markers), percent;
5.4 Transient Concentration Fields during Initial Jet Development
All preceding discussions considered well developed, steady state jet. Another important aspect of the transient incursion of gas concentrations above flammability limit, however, is associated with initial moments of jet development. Figure 10 illustrates the sequence of snapshots of instantaneous mass fraction values for hydrogen jet at M = 0.3 at the beginning of its development. Note that snapshots are confined to the essentially potential flow zone x/D < 2, where relatively little transient effects were observed in the steady-state case. It is seen, however, that as the jet start to penetrate stationary air, it creates large scale vortices carrying with them concentration fields to the areas where flammability limit is not (frequently) observed during steady state jet release. It can be further illustrated by Fig. 11. Figure 11a shows the spatial distribution of the hydrogen mass fraction along the line located at one nozzle diameter from the centre of the orifice, while Fig. 11b shows temporal evolution of hydrogen mass fraction at the location on this line elevated by one diameter (X = 1D, Y = 1D). It is seen that the vortex generated during the initial jet penetration into the stationary air carries high concentrations of
10
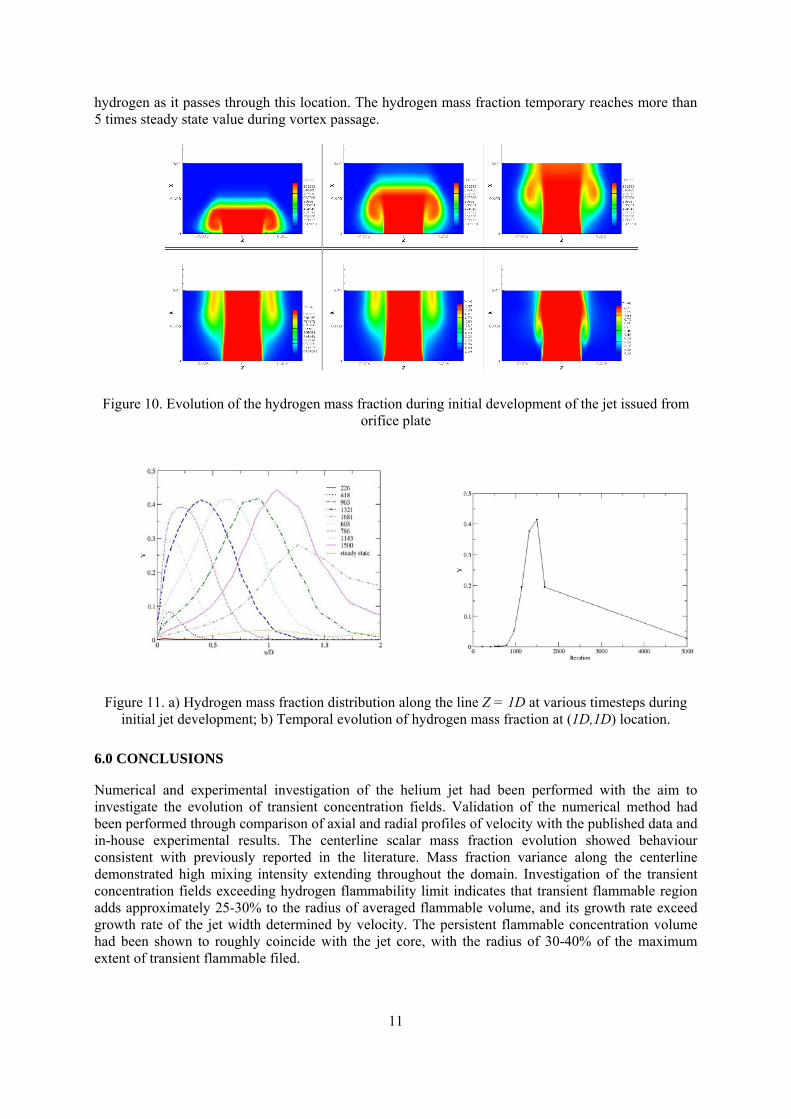
hydrogen as it passes through this location. The hydrogen mass fraction temporary reaches more than 5 times steady state value during vortex passage.
Figure 10. Evolution of the hydrogen mass fraction during initial development of the jet issued from orifice plate
Figure 11. a) Hydrogen mass fraction distribution along the line Z = 1D at various timesteps during initial jet development; b) Temporal evolution of hydrogen mass fraction at (1D,1D) location.
6.0 CONCLUSIONS
Numerical and experimental investigation of the helium jet had been performed with the aim to investigate the evolution of transient concentration fields. Validation of the numerical method had been performed through comparison of axial and radial profiles of velocity with the published data and in-house experimental results. The centerline scalar mass fraction evolution showed behaviour consistent with previously reported in the literature. Mass fraction variance along the centerline demonstrated high mixing intensity extending throughout the domain. Investigation of the transient concentration fields exceeding hydrogen flammability limit indicates that transient flammable region adds approximately 25-30% to the radius of averaged flammable volume, and its growth rate exceed growth rate of the jet width determined by velocity. The persistent flammable concentration volume had been shown to roughly coincide with the jet core, with the radius of 30-40% of the maximum extent of transient flammable filed.
11

12
7.0 ACKNOWLEDGEMENTS
This work was funded by the Auto 21 Network of Centres of Excellence, Natural Resources Canada, and the NSERC H2Can Research Network.
REFERENCES
1. K. Harstad and J. Bellan., Global analysis and parametric dependencies for potential unintended hydrogen-fuel releases, Combustion and Flame, 144, 2006, pp 89-102.
2. M. Amielh, T. Djeridane, F. Anselmet and L. Fulachier, Velocity near-field of variable density turbulent jets. Int. J. Heat Mass Transfer, 39, No.10, 1996, pp. 2149--2164.
3. R. M. C. So, J. Y. Zhu, M. V. Otugen, and B. C. Hwang, Some measurements in a binary gas jet , Experiments in Fluids, 9, 1990, pp. 273-284.
4. D. B. Helmer and L. K. Su. Imaging of turbulent buoyant jet mixing. AIAA Paper 2006-309, 44th Aerospace Sciences Meeting and Exhibit, 9-12 January 2006, Reno, NV.
5. W. M. Pitts, Effects of global density and Reynolds number variation on mixing in turbulent axisymmetric jets, Nat. Bur. Stand., NBSIR 86-3340.
6. J. R. DeBonis and J. N. Scott., Large eddy simulation of a turbulent compressible round jet, AIAA Journal, 40, No.7, 2002, pp. 1346-1354.
7. K. Mohamed and M. Paraschivoiu, Real gas simulation of hydrogen release from a high-pressure chamber, Int. J. Hydrogen Energy, 30, No.8, 2005, pp. 903-912.
8. W. M. Pitts, Effects of global density ratio on the centerline mixing behavior of axisymmetric turbulent jets, Experiments in Fluids, 11, 1991, pp. 125-134.
9. W. Houf, R. Schefer, Predicting radiative heat fluxes and flammability envelopes from unintended releases of hydrogen, Intl. J. of Hydrogen Energy. 32, No.1, 2007, p. 136-151.
10. M. R. Swain, P. A. Filoso, M. N. Swain, An Experimental investigation of ignition of leaking hydrogen, Intl. J. of Hydrogen Energy. 32, No.2, 2007, p. 287-295.
11. M. G. Zebatanis, US Bureau of Mines, Bulletin 627, 1965. 12. H. Suto, K. Matusara, M. Kobayashi, and Y. Kaneko, Large Eddy Simulation of flow and scalar
transport in a round jet, Heat Transfer - Asian Research, 33, No.3, 2004, pp. 175-188. 13. Fluent Inc. Fluent 6.3 User's Guide, 2007. 14. F. Magagnato, KAPPA – Karlsruhe program for aerodynamics, TASK quarterly, 2 (2), 1998, pp.
215-270. 15. J. H. Bell and R. D. Mehta, Contraction design for small low-speed wind tunnels, NASA CR
177488, Contract NAS2-NCC-2-294. 16. B. J. Boersma, G. Brethouwer, and F. T. M. Nieuwstadt, A numerical investigation on the effect
of the inflow conditions on the self-similar region of a round jet, Physics of Fluids, 10, No.4, 1998, pp. 899-909.
17. G. Xu and R. A. Antonia, Effect of different initial conditions on a turbulent round free jet, Experiments in Fluids, 33, 2002, pp. 677-683.
18. R. K. Chen and W. Rodi, Vertical Turbulent Jets,1980, Pergamon Press, Oxford. 19. M. W. Thring and M. P. Newby, Combustion length of enclosed turbulent jet flames, Fourth
Symposium (International) on Combustion, Pittsburgh: The Standing Committee on Combustion, 1953, pp. 786-796.
20. C. Niwa, J. Ichizawa, N. Yoshikawa, and K. Ohtake, Time-resolved concentration measurements of jets by laser Rayleigh method - comparison of He, CO2 and CCl2F2 jets. Proceedings of the Fourteens International Symposium on Space Technology and Science, Tokyo, 1984, pp. 469-476.
21. J. Way and P. A. Libby, Application of hot-wire anemometry and digital techniques to measurements in a turbulent helium jet, AIAA Journal, 9, pp. 1567-1573.
22. F. P. Ricou and D. B. Spalding, Measurements of entrainment by axisymmetrical jets, J. Fluid Mech., 11, 1961, pp. 21-32.