satellite image analytics, land change and food security
TRANSCRIPT

Satellite Image Analytics, Land Change and Food Security
Sunandan Chakraborty1,2, Zohaib Jabbar2, Lakshminarayanan Subramanian1,2,Yaw Nyarko2
1Department of Computer Science2Center for Technology and Economic Development, NYU Abu Dhabi
New York University, New York, USA{sunandan, lakshmi}@cs.nyu.edu, {zohaib.jabbar, yn1}@nyu.edu
ABSTRACTChanging patterns and reduction in agricultural land are among thefundamental problems that impacts food security in developing re-gions like India. Rapid economic growth coupled with increasingpopulations and changes in climatic patterns are among the mainfactors impacting availability of agricultural land. On a macro-scopic scale, due to the lack of good quality data, governments donot have a complete and clear cut picture of changes in land usagepatterns. In this paper, we present the design of a satellite image an-alytics engine that we use to perform a detailed analysis of changesin agricultural land patterns over a 13-year time period (2000-2012)in West Bengal, India, traditionally considered one of the most fer-tile areas in the world. Our satellite analytics engine can performa fine-grained analysis of macro-granular satellite images (eleva-tion of 11 km) and classify small portions of land in each imageinto different categories: agricultural, developed, forest and waterbodies. Our analytics engine can analyze temporal changes in landpatterns and compute the percentage of change in land under eachcategory. Based on detailed food production data gathered in col-laboration with the bureau of statistics of West Bengal, we analyzethe correlations between changes in agricultural land patterns andcorresponding changes in food production (normalized by changein yield patterns). Our tool can be used at varying levels of spa-tial granularities ranging from macroscopic analysis at a state levelto fine-grained analysis at sub-district levels. This analytics toolis targeted for government and non-governmental policy makers toanalyze land pattern changes and correlate them with food securitymetrics.
1. INTRODUCTIONAgricultural land availability is undergoing dramatic changes across
the globe. This phenomenon is more rampant in the developingworld where rapid economic growth and increasing population isresulting in unplanned development. The loss of arable area is es-timated to be 1-21% in South America and around 18% in Africa[36]. The major causes identified for this decline are: (1) rapidurbanization of these countries including industrialization; (2) themigration of farmers to cities resulting in the sale of farmland for
Permission to make digital or hard copies of all or part of this work forpersonal or classroom use is granted without fee provided that copies arenot made or distributed for profit or commercial advantage and that copiesbear this notice and the full citation on the first page. To copy otherwise, torepublish, to post on servers or to redistribute to lists, requires prior specificpermission and/or a fee.Copyright 20XX ACM X-XXXXX-XX-X/XX/XX ...$15.00.
non-agricultural development, a trend that has escalated in the pastfew years due to rising real estate prices. Loss of arable land hasa direct impact on food security. Most developing regions are alsopredominantly agrarian economies and changes in arable land cansignificantly impact food production and availability. Apart fromurbanization and industrialization, changes in climatic patterns andother environmental factors are also resulting in degradation offarmlands and eventual disappearance. There are reports that Sa-hara desert is expanding southwards at an alarming rate[9]. Risingsea levels are increasing salinity of soil and decreasing productivityof land [18]. In countries like India, unpredictable monsoon is alsoharming production and land quality.
Loss of arable land is also a well documented phenomena in de-veloped regions around the world, especially in North America andEurope. Unlike developing regions, land usage is well-documentedin most developed regions at fine-grained granularities. For exam-ple, from 1982 to 2007, more than 23 million acres of agriculturalland was converted to developed land in the USA[4][5] , with eachstate losing significant areas of farmland. Similarly, Germany lostfive million acres of its Utilized Agricultural Area (SAU) between1960 and 2010, a decline of almost 11 percent. France has about50 percent of its land used for agricultural activities in 2010 and itis also declining [1]. Most developed countries have traditionallymaintained detailed electronic records to monitor change in landpatterns over 5-10 decades. In contrast, such fine-grained data isoften found lacking in developing regions.
In this paper, we propose the design of an automated satelliteimage analytics tool that can leverage publicly available satelliteimage data sources to provide a fine-grained longitudinal analy-sis of changes in land pattern in a given region. Our goal is todesign a data analytics system that can understand the longitudi-nal relationship between the changes in agricultural land patternin a given small geographic area and its corresponding impact onfood production. This paper is specifically contextualized for theregion of West Bengal, traditionally considered one of the mostfertile areas in the world being in the delta of the Gangetic plains.We used a corpus of satellite images gathered from Google Earth,which maintains an updated repository of satellite images alongwith an archive of older images across the globe. Based on detailedfood production data gathered in collaboration with the bureau ofstatistics of West Bengal, we computed the correlations betweenthe changes in agricultural land patterns and in food production inthese years, at the district level of West Bengal.
The key building block of our analytics tool is a satellite im-age analysis engine that can analyze potentially noisy satellite im-ages and provide fine-grained classification of regions within eachimage into different categories such as: arable land, water body,developed land, forest etc. Given historical data about the same lo-

Figure 1: Image of a location in Angola taken in 2003
Figure 2: Image of a location in Angola taken in 2011
cation, the image analysis engine can provide a detailed analysis ofland pattern changes. Figure 1 is an example of a land in Angolain 2003 and a developed version of the same land in 2011 is shownin Figure 2. Our engine can detect such changes at different loca-tion granularities (small region, district, state level etc.). In the caseof West Bengal, we obtained data over a 13 year time period from2000-2012 and could track land evolution over this entire time pe-riod. We correlate this land change pattern with food productiondata over the same time period gathered by the Bureau of Statis-tics in the government. This tool can be helpful to policymakers tomonitor the changes in the land pattern and take appropriate stepsif any drastic changes are noticed.
Based on our detailed analysis of satellite data and food produc-tion data from 2000-2012, we present the following key results inthis paper:
• In the state of West Bengal agricultural land area has declinedby 2%.
• The decline in agricultural land area has demonstrated pos-itive correlations with rice/wheat production and agricultureproductivity index.
• The loss in arable land was higher in districts closer to urbanand industrial zones.
In this paper, we present the satellite analytics tool and the datagenerated by it to analyze food production and security issues. How-ever, this analytics tool can be used in other contexts as well. Thistool is a general purpose satellite image analytics tool whose end-goal is to process satellite images from any part of the world andgenerate data about distribution of land patterns and how the pat-tern has changed over the years in that region. The generated datacan be used in any relevant analysis.
2. RELATED WORK
There are two different classes of related works for the work pre-sented in this paper. There are many works which have focusedon detecting objects, patterns from images. These techniques havebeen or can be applied to satellite images. On the other hand thereare various other works which have used satellite images and in-formation extracted from them to infer different metrics and buildnovel applications.
We start with novel applications using satellite images and thendiscuss some techniques used in such applications. There are quitea few applications targeted at disease detection using satellite im-ages. Ceccato et al [11] used remote sensing technology to monitormalaria risk. They used high resolution images of Landsat data tomonitor features on earth’ surface. They monitored features, suchas, surface water, vegetation, temperature, humidity which has adirect impact on outbreaks of disease such as malaria. Safi et al[8] has a similar approach where they predicting malaria risk usingremote sensing data. They used neural networks and general linearmodel to combine precipitation, temperature and vegetation indexobtained from remote sensed data to build a predictive model formalaria cases. They ran this model for 23 provinces in Afghanistanand showed good prediction accuracy. Another example of ap-plying image analysis in public health is the work by Kelly et al[21]. They used an object based image classification approach toidentify objects within the satellite images that can help in under-standing various public health issues. Another similar work can beseen in the paper describing an early warning system for malaria[32]. Famine detection and prediction is another common applica-tion that have been targeted using satellite imagery. In a slightlyearlier work, Hutchinson [20] developed an early warning systemfor famine in sub-Saharan Africa. This work demonstrated betterefficiency and accuracy of using satellite data in building such sys-tem compared to datasets from ground sources. In a recent work asimilar approach and data was used to predict famine Uganda [28].In this work, two main parameters used for famine detection – veg-etation index and rainfall – were derived from multi-spectral satel-lite images to characterize crop yield. Related to famine, there arenumerous works that have focused on food security [19][17][22].Huber et al [19] has argued that early warning systems for food se-curity can be vastly improved with the help of satellite data. Theirclaim is that frequent temporal data on water stress and surface tem-perature can help in detecting drought early, thus, reducing theirimpact on the society.
Deforestation and other environment related issues can also bewell understood from satellite data. Vibrans et al [33] created aland database of a state in Brazil to determine the remaining landarea covered by Atlantic rain forest. A specific deforestation casewas covered by Rahman et al [30], where they looked the disap-pearance of mangrove forests, making way for aquaculture. Theyused MODES data from NASA’s Terra and Aqua satellites to studythe Mahakam delta mangrove forest in Indonesia between the years2000 and 2010. Another work focusing on environmental issue us-ing satellite data is by Diouf et al [13]. There goal was to detect theconcentration of Saharan dusts and sea surface chlorophyll fromsatellite data.
There are other works which have analyzed satellite data to infervarious metrics. Example of such an application is using night-timesatellite images to infer poverty in a region [26]. Abelson et al [6]used satellite image data to identify extremely poor regions usingroof top of buildings as a proxy of poverty. This work has been toidentify poor regions for better cash flow using mobile platforms.They have shown that the intensity of artificial lights during nighttime, as captured in night-time satellite images, has strong corre-lation with GDP of that region. Dahmani et al [12] used satellite

images to build cartographic database of slums to facilitate betterplanning and policies.
On the other hand, there have been many works that has de-veloped novel techniques for processing satellite images or digitalimages in general that can be applied to satellite images as well.Object detection [25][34] has been a very popular method used toextract information from satellite images [6]. A typical feature ofsatellite images is they are heterogeneous and more continuous innature. Within a small area there can be different objects placedone after the other. Hence, segmentation becomes an importantpreprocessing step before any kind of information extraction task.There are works which have specifically targeted satellite imagesfor segmentation [10] [29]. There are numerous other works focus-ing on image segmentation [15] [14] or superpixel extraction [16][24] [31][7][35] that can be applied to satellite image analysis aswell .
Based on past works it can be understood that information ex-tracted from satellite images can be very useful to infer many use-ful parameters, particularly in public health, environmental issuesand public policy. Such a technique is even more essential whenground source data – particularly for developing or underdevelopedregions – are error-prone, irregular and difficult to obtain at regularintervals.
3. LAND PATTERN ANALYSIS AND FOODSECURITY
In this section, we provide a brief context and motivation for theproblem addressed in this paper. We begin by stating the impor-tance of the problem before providing specifics of the data analysisstudy presented in the paper.
Context: Food security is emerging as one of the biggest prob-lems that human populations may face in the upcoming centurydue to growing populations, urbanization and reduction in arableland. Reduction in arable land is a relatively hard task to reverseand food statistics around the world clearly indicate that agricul-tural land patterns are on the decline, and in recent times the ratehas accelerated.
The problem of decrease in agricultural land is particularly animportant question for developing countries which are predomi-nantly agrarian economies. Given unprecedented population growth,coupled with only a relatively modest growth in agricultural yields,any minor changes in land can have catastrophic consequences onthe food security for the population in such countries. While west-ern countries have relied on large scale imports, developing coun-tries do not have the economic horsepower to rely on imports fortackling food deficiencies.
A critical metric that needs to be monitored for food securityin agrarian economies is agricultural land availability. While de-veloped nations are known to have much more detailed records onland change patterns, the relative documentation of such data indeveloping regions is often lacking due to the lack of fine graineddata. In many developing regions, data is not frequently updated ornot complete. Policy decision-making is often done based on staleor incomplete data and an important phenomena such as disappear-ance of arable land often go unnoticed.
Even if policy makers are aware of the decline in arable land, thesecond problem is the lack of knowledge of the underlying causesbehind this disappearance. On many occasions, land acquisitionfor development is happening illegally [3]. Local authorities areunaware of this change and at what rate it is happening. Apart fromthis, there might be reasons for which land is losing productivity[27] due to bad agricultural practices or environmental factors. The
exact transformation of agricultural land to what other types canprovide valuable clues to the solution of the problem. For all thesefactors, land pattern statistics at regular intervals are essential.
3.1 Satellite ImagesAdvantage of using satellite images is that they can give a clear
picture of the state of the land. Over the years, the quality of theseimages have greatly improved providing rich information about thesurface area of different regions. Processing these images can re-veal the present status of a region. Moreover, having access to his-torical images, short and long term changes in a region can be easilytracked. How historical satellite images can detect changes is ev-ident from Figure 1 and 2. This images are taken from Angola inthe year 2003 and 2011 respectively. In the 2003 it shows a greenpatch of land, probably used for agriculture, with marks of beingconverted into developed land. Within 8 years the entire green landhas turned into an urban area. Thus, the sattelite images can havean important impact in tracking changes in the land pattern.
In addition, satellite images can provide an account of of whattype of changes happened in a region. A piece of agriculturalland disappearing might not always be a very useful observation totackle the problem. On the other hand, identifying the exact changecan provide more insights. An existing agricultural land can changeto some other land type – acquired for urban or industrial devel-opment. Alternatively, due to changing climatic conditions or badagricultural practices, the land’s quality has deteriorated and hence,it is turning into a barren land. Being able to track these changes,a policy maker can address the situation properly. In the first case,the solution is to deal with illegal and forcible acquisitions and inthe second case come up with sustainable solution to protect exist-ing farmlands. In conclusion, these steps can protect agriculturallands, moreover, ensure food security and stabilize food prices forlong term sustainability.
3.2 West Bengal: A Case StudyIn this paper, we contextualize our study of the agricultural land
availability problem for the state of West Bengal in India. WestBengal lies in the north Indian Gangetic Plains, as a result fertilealluvial soil is abundant in the state. Hence, agriculture is the pre-dominant driving force of the economy of the state. Table 1 showssome facts of the state. The reason we chose West Bengal is dueits relatively smaller area and its dominance in agriculture. Basedon the data presented in Table 1 it is clear that that the economy ofthe state is heavily dependent upon agriculture. Agriculture con-tributes to about 24% [2] of the state’s domestic product and withsuch a high percentage of the labor force engaged in agriculture,it is apparent any decline in agriculture will have a drastic effecton the state, its economy. This will impact the food security ofthe state as well. One of the goal of this paper is to use the toolto estimate land pattern statistics of West Bengal and observe whatchanges have occurred in the last 10 years.
In this paper, we try to analyze the agricultural land availabilityproblem by building a satellite image analysis tool that can classifysatellite images into various categories. In addition, it can moni-tor the changes over time and report what is changing and how itis changing. Subsequently, we use the data produced by the toolto compare changing land patterns with officially collected govern-ment data on food production at a district granularity.
4. SATELLITE IMAGE DATAWe created our dataset from the satellite image repository of
Google Earth (GE). GE has freely available satellite images fromacross the world, including an archive of historical images. To de-

Table 1: West Bengal at a glance
Area 88,752 sq kmPopulation (2011) 91,347,736Population density (2011) 1000/sq. kmRural population (2011) 72%Area under agriculture (2012) 5,666,000 h.a.Labor force engaged in agriculture 67%
velop and test our image analytics tool, we gathered satellite imagesfrom different regions across India and different countries acrossAfrica. We collected around 8800 images from 7 different coun-tries in Africa and 5100 images from 2 different states in India. Allthese images were captured at an elevation of 11 KM, to make surethey are not too blurry (if captured from too close to the ground) ormissing details (if captured from a very high elevation). The timerange of these images is between 2000 and 2012. A typical imageis shown in Figure 1.
One of the key challenges in processing the satellite image is thevariability in the quality of images. Google Earth images do nothave consistent quality. Particularly, for older images the quality isquite poor and blurry. Second, the precision of images presentedby Google Earth can historically vary. Third, in many images theland area is not visible in some parts due to completely blankedout images or due to cloud cover. Finally, the background coloracross images is not consistent which makes it difficult to classifyland into different categories. For this study, we ignored such noisyimages and built the model assuming the images are clear. Forfuture work, we intend to build a more robust model to tackle suchnoisy images.
5. SATELLITE IMAGE ANALYSIS TOOLThe image analysis tool is aimed at classifying satellite images
into 4 different categories. To design the classifier we used Convo-lutional Neural Network (CNN) [23]. The network takes an imageas an input and has 4 output nodes for each class to describe theimage. The categories are - Arable, Tree-covered, Water body,Developed.
We experimented with a variety of standard methods and featuresets to build the tool. In order to evaluate each method, we split thedata into a training and a cross validation set. We set aside 10% ofthe images for cross validation from each individual category. So,our training set is the combined set of 90% of the images from 7different African countries and 2 Indian states.
5.1 PreprocessingA single frame in a satellite image covers a large portion of land
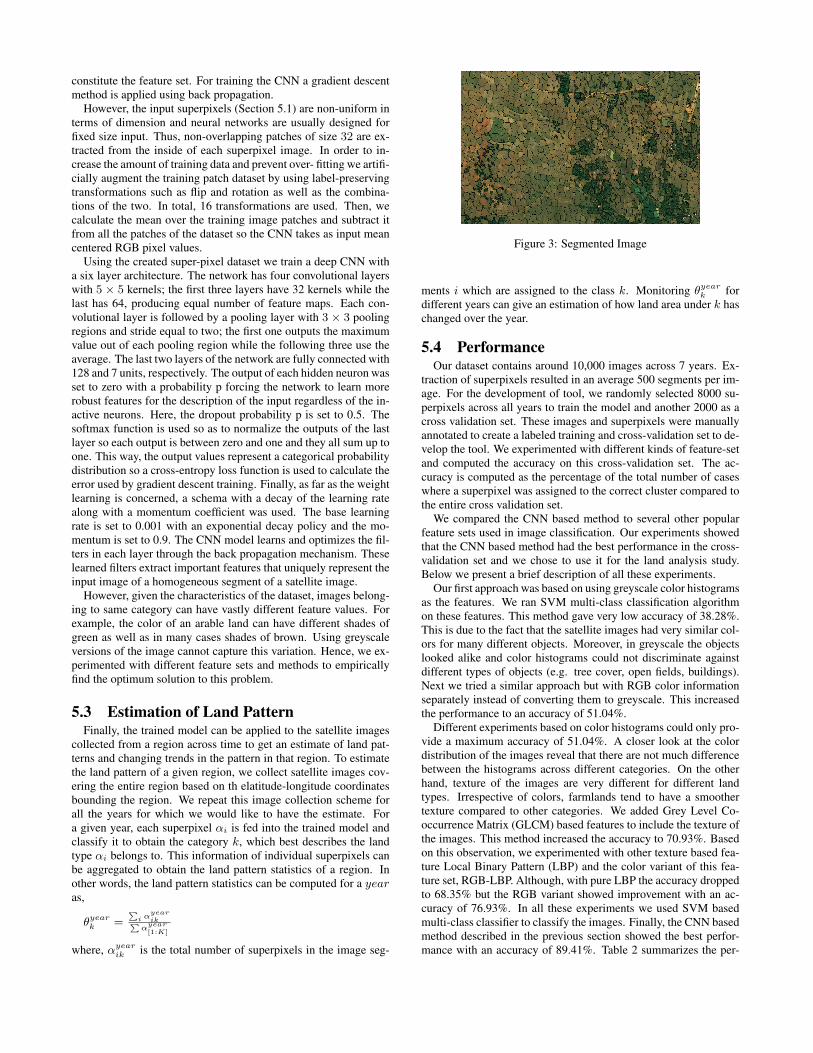
and they typically have more than one category of land. Fig 3 showa typical satellite image from our dataset and this image has agri-cultural land, tree-covered areas, as well as water bodies. Thus, ev-ery image needed to be broken into segments or superpixels, whereeach superpixel represents a homogeneous area, potentially belong-ing to only one of the categories mentioned above. There are manyrelated works that involve segmenting images and extracting su-perpixels [16] [24] [7][35], we chose Markov Random Field basedapproach [31] to extract the superpixels. In this method the condi-tional distribution of a pixel is determined by the 8 neighboring pix-els. A graphical model is constructed where every node is a pixeland edges are drawn between adjacent pixels. The edge potentialsdefine how similar they are or whether they belong to the same su-
perpixel or not. Based on some annotated superpixels, the modellearned the edge potentials and based on the learned model, thesuperpixels were extracted from the larger image. Figure 3 showsthe resulting superpixels after segmentation. Here, each superpixelrepresents a uniform region within the image. We treat these super-pixels as an atomic unit of the images and are fed into the networkfor classification.
5.2 Image ClassificationOur dataset essentially consists of segmented superpixels ex-
tracted from satellite images. After the segmentation process andextracting the superpixels, it is assumed that the superpixels haveone and only one type of land type. Thus, each superpixel can beclassified into one category (i.e. arable, tree-covered, water body ordeveloped). We experimented with different feature sets and clas-sification methods to classify these superpixels into one of thesecategories. The purpose of these experiments were to identify thebest performing method to achieve our ultimate goal of building asatellite image classification tool and get an accurate estimate ofland patterns over a geographical region. We employed two clas-sification methods – support vector machine based method usinga suite of feature sets and a convolutional neural network basedmodel with implicit feature extraction module. In the rest of thesection, we provide a brief overview of the methods used.
Support Vector Machines (SVM) are designed for binary clas-sification. However, in our case, we are classifying the imagesinto 4 classes by combining several binary classifiers using one vsrest method. We used several image features to experiment withidentify the best performing model. Our features include standardimage features, such as, color histograms, texture etc. We startedwith greyscale features, as many of the satellite images have non-standard color codes. That is, in many images, agricultural land andwater bodies are depicted with similar colors. To test this intuition,we used RGB color histograms as well. We also considered thetexture of an image, as many images across categories had similarcolor distributions, we used a couple of texture based features, suchGrey Level Co-occurrence Matrix (GLCM) and Local Binary Pat-tern (LBP) features sets. All these different types of features wereextracted from the superpixels and fed into an SVM classifier toclassify each superpixel into a category. The detailed results fromthese experiments are discussed in Section 5.4.
The second type of model used to build this tool was Convolu-tional Neural Networks (CNN). CNNs are multi-layered artificialneural networks which incorporate both unsupervised feature ex-traction and classification. A CNN consists of a series of convolu-tional and pooling layers that perform feature extraction followedby one or more fully connected layers for the classification. Theinputs of a unit in a convolutional layer come from just a smallrectangular subset of units of the previous layer. In addition, thenodes of a convolutional layer are grouped in feature maps shar-ing the same weights. The inputs of each feature map are tiled insuch a way that correspond to overlapping regions of the previouslayer making the aforementioned procedure equivalent to convolu-tion while the shared weights within each map correspond to thekernels . The output of convolution passes through an activationfunction that produces nonlinearities in an element-wise fashion.A pooling layer follows which subsamples the previous layer byaggregating small rectangular subsets of values. Max or mean pool-ing is applied replacing the input values with the maximum or themean value, respectively. A number of fully connected layers fol-low with the last one having a number of units equal to the numberof classes. This part of the network performs the supervised classi-fication and takes as input the values of the last pooling layer which
constitute the feature set. For training the CNN a gradient descentmethod is applied using back propagation.
However, the input superpixels (Section 5.1) are non-uniform interms of dimension and neural networks are usually designed forfixed size input. Thus, non-overlapping patches of size 32 are ex-tracted from the inside of each superpixel image. In order to in-crease the amount of training data and prevent over- fitting we artifi-cially augment the training patch dataset by using label-preservingtransformations such as flip and rotation as well as the combina-tions of the two. In total, 16 transformations are used. Then, wecalculate the mean over the training image patches and subtract itfrom all the patches of the dataset so the CNN takes as input meancentered RGB pixel values.
Using the created super-pixel dataset we train a deep CNN witha six layer architecture. The network has four convolutional layerswith 5 × 5 kernels; the first three layers have 32 kernels while thelast has 64, producing equal number of feature maps. Each con-volutional layer is followed by a pooling layer with 3 × 3 poolingregions and stride equal to two; the first one outputs the maximumvalue out of each pooling region while the following three use theaverage. The last two layers of the network are fully connected with128 and 7 units, respectively. The output of each hidden neuron wasset to zero with a probability p forcing the network to learn morerobust features for the description of the input regardless of the in-active neurons. Here, the dropout probability p is set to 0.5. Thesoftmax function is used so as to normalize the outputs of the lastlayer so each output is between zero and one and they all sum up toone. This way, the output values represent a categorical probabilitydistribution so a cross-entropy loss function is used to calculate theerror used by gradient descent training. Finally, as far as the weightlearning is concerned, a schema with a decay of the learning ratealong with a momentum coefficient was used. The base learningrate is set to 0.001 with an exponential decay policy and the mo-mentum is set to 0.9. The CNN model learns and optimizes the fil-ters in each layer through the back propagation mechanism. Theselearned filters extract important features that uniquely represent theinput image of a homogeneous segment of a satellite image.
However, given the characteristics of the dataset, images belong-ing to same category can have vastly different feature values. Forexample, the color of an arable land can have different shades ofgreen as well as in many cases shades of brown. Using greyscaleversions of the image cannot capture this variation. Hence, we ex-perimented with different feature sets and methods to empiricallyfind the optimum solution to this problem.
5.3 Estimation of Land PatternFinally, the trained model can be applied to the satellite images
collected from a region across time to get an estimate of land pat-terns and changing trends in the pattern in that region. To estimatethe land pattern of a given region, we collect satellite images cov-ering the entire region based on th elatitude-longitude coordinatesbounding the region. We repeat this image collection scheme forall the years for which we would like to have the estimate. Fora given year, each superpixel αi is fed into the trained model andclassify it to obtain the category k, which best describes the landtype αi belongs to. This information of individual superpixels canbe aggregated to obtain the land pattern statistics of a region. Inother words, the land pattern statistics can be computed for a yearas,
θyeark =∑
i αyearik∑
αyear[1:K]
where, αyearik is the total number of superpixels in the image seg-
Figure 3: Segmented Image
ments i which are assigned to the class k. Monitoring θyeark fordifferent years can give an estimation of how land area under k haschanged over the year.
5.4 PerformanceOur dataset contains around 10,000 images across 7 years. Ex-
traction of superpixels resulted in an average 500 segments per im-age. For the development of tool, we randomly selected 8000 su-perpixels across all years to train the model and another 2000 as across validation set. These images and superpixels were manuallyannotated to create a labeled training and cross-validation set to de-velop the tool. We experimented with different kinds of feature-setand computed the accuracy on this cross-validation set. The ac-curacy is computed as the percentage of the total number of caseswhere a superpixel was assigned to the correct cluster compared tothe entire cross validation set.
We compared the CNN based method to several other popularfeature sets used in image classification. Our experiments showedthat the CNN based method had the best performance in the cross-validation set and we chose to use it for the land analysis study.Below we present a brief description of all these experiments.
Our first approach was based on using greyscale color histogramsas the features. We ran SVM multi-class classification algorithmon these features. This method gave very low accuracy of 38.28%.This is due to the fact that the satellite images had very similar col-ors for many different objects. Moreover, in greyscale the objectslooked alike and color histograms could not discriminate againstdifferent types of objects (e.g. tree cover, open fields, buildings).Next we tried a similar approach but with RGB color informationseparately instead of converting them to greyscale. This increasedthe performance to an accuracy of 51.04%.
Different experiments based on color histograms could only pro-vide a maximum accuracy of 51.04%. A closer look at the colordistribution of the images reveal that there are not much differencebetween the histograms across different categories. On the otherhand, texture of the images are very different for different landtypes. Irrespective of colors, farmlands tend to have a smoothertexture compared to other categories. We added Grey Level Co-occurrence Matrix (GLCM) based features to include the texture ofthe images. This method increased the accuracy to 70.93%. Basedon this observation, we experimented with other texture based fea-ture Local Binary Pattern (LBP) and the color variant of this fea-ture set, RGB-LBP. Although, with pure LBP the accuracy droppedto 68.35% but the RGB variant showed improvement with an ac-curacy of 76.93%. In all these experiments we used SVM basedmulti-class classifier to classify the images. Finally, the CNN basedmethod described in the previous section showed the best perfor-mance with an accuracy of 89.41%. Table 2 summarizes the per-

Table 2: Accuracy of the tool for different features used
Feature-set AccuracyGreyscale color histogram 38.28%RGB color histogram 51.04%Texture (GLCM) 70.93%Local Binary Pattern (LBP) 68.35%LBP + RGB 76.93%CNN 89.41%
Figure 4: Percentage of arable land per year
formance of the satellite image analysis tool based on different fea-tures. We performed the rest of the analysis with the CNN basedimage analysis tool, given the best performance of the model.
6. LAND PATTERN ANALYSIS OF WESTBENGAL
After the development of the tool, we applied it to the satelliteimages collected from the Indian state of West Bengal. Our goalwas to analyze the variation of agricultural land in that state acrossseveral years. We collected satellite images covering entire area ofthe state for 7 years between 2000 and 2012. The tool was appliedon this data to estimate the percentage of arable land in all theseyears and observe the change in percentage across years. For ayear, the total number segments under arable land category wasaggregated to estimate the percentage of arable land for that year.
For the case study, we collected the images from West Bengalfrom the GE repository for 7 different years, starting from 2000 till2012 at an interval of 2 years. For each year we had 7,505 imagescovering the entire land area of the southern part of the state. Eachimage captured were rectangular in shape with a fixed height andwidth. All the images were captured at an elevation of 11 KM,
The estimated percentage of arable land as computed by our toolis shown if Figure 4. We see that there has been a decline in agri-cultural land in the state between these year. Although, the percent-age slightly rose between 2000 and 2002, according to the estimatethere has been a drop of 2.0% between 2000 and 2012.
We wanted to compare our findings with the food productionstatistics published by the Bureau of Applied Economics and Statis-tics affiliated to the Government of West Bengal [2]. The bureaupublishes various statistics about the state in their annual EconomicReview journal. The different food production related metrics wecollected are - Land area under rice, Land area under wheat, Netrice production, Net wheat production, Net cropped area, Agricul-tural area index, Agricultural production index.Our goal was to validate our findings as well understand the impli-cations of reduction in arable land and food production from thesedata. To validate the estimate given by the tool we compared the
Figure 5: Comparison between official percentage cropped area(upper) and estimation from the satellite images analysis tool(lower)
Table 3: Comparison between arable land and food production
Index Correlation coefficient p-valueNet rice production 0.58 0.012*Net wheat production 0.61 0.041*Agricultural area index 0.68 0.023*Agricultural production index 0.72 0 .030*
result with the cropped area published in the official report. Thecomparison of the official and our computed values are shown inFigure 5. Although our findings do not exactly match with the offi-cial figures, we see that the trends in both the plots have similarity.
To understand the implication of decline in arable land, we com-pared our findings with the food production data published by thegovernment. We computed the correlation coefficients to see howarable land area can affect food production. The results are sum-marized in Table 3. The results indicate that in a region reductionin arable land has a positive correlation with food production.
Apart from looking at the entire state as a whole, we have alsoanalyzed different districts of the state separately. In India, dis-tricts are the second level administrative boundaries in each state.The state of West Bengal is divided into 19 districts, including theurban district of Kolkata, which is also the state’s capital. In thispaper we have focused on 12 districts in the southern part of thestate, excluding the district of Kolkata. Figure 6 shows the map ofWest Bengal and district boundaries of the region considered in thisstudy. The southern part of the state is part of the large Gangeticplain and conditions are well suited for agriculture.
Our satellite images were labeled with the latitude-longitude co-ordinates of the location from where they were extracted. Using aGIS database we identified the district from where the image wasextracted. Then for each such cluster we computed the year-wiseshare of each land type and produced a district level data of landpattern and its changes. The percentage change in agricultural landfor these districts is summarized in Table 4. The figure in the tableshows the change between year 2012 and 2000, as produced by ourtool.
We see that in some districts the disappearance of agriculturalland is higher than others. Interestingly, the districts with higherrate of disappearance, such as, Howrah, Hooghly are close to theurban district of Kolkata. Due to increasing population of the city,more land from the neighboring districts are being taken up for ur-ban development. Similar arguments can be applied to relativelyhigh rate of disappearance of agricultural land in the Burdwan dis-trict. Burdwan is a very populous district with industrial townssuch as Asansol and Durgapur. On the other hand, in some dis-

Figure 6: Map of West Bengal and district boundaries of southernpart of the state
Table 4: District-wise change in agricultural land between 2000and 2012
District Change in agricultural land (%)Bankura 6.10Burdwan -1.44Birbhum -2.36Midnapore1 0.23Howrah -1.76Hooghly -5.3024 Parganas (North) -0.3624 Parganas (South) -2.11Nadia 2.09Murshidabad -2.20Purulia 1.48
1 Midnapore district was split into 2 districts in 2002. Due to unavailabilityof separate data for earlier years we have considered them as one aggregat-ing their data wherever needed
tricts, such as, Purulia and Bankura where we observe a increase inagricultural land. These districts are in the western part of the stateand industrialization initiatives are limited in that region. Also, thepopulation density is relatively lower.
Similar to the state-level data, we tried to find the relationshipbetween arable land and food production in the districts as well.We did this comparison between the land share and rice productionin these districts. We chose rice was because it is the most pro-duced crop and the most consumed food in this region. The resultof this comparison is shown in Figure 7. The figure shows a pos-itive relationship between agricultural land (computed by the tool)and rice production in these districts. Both the values have beennormalized to a score between 0 and 1. The scatter plot shows anapproximate linear relationship between land area under agricul-ture and rice production. Hence, even in the districts we see thatland area is changing over time and this change is showing positiverelationship with food production.
7. DISCUSSIONIn this paper, we presented a framework to estimate food produc-
tion by identifying land pattern distribution in a region. We havedemonstrated that the estimation of agricultural land in a region us-ing our tool correlates strongly with food production indices in thatregion. The state of the art methods of measuring these metrics are
Figure 7: Relationship between agricultural land area and rice pro-duction for different districts (2012)
done manually by visiting the site, hence they are, cumbersome,time consuming and prone to errors. With our solution, reason-ably accurate estimation of the same parameters can be done muchfaster. With this improvement, our tool can be an important toolfor government employees and policy-makers, who can have fasteraccess to such data, leading to better decision-making.
Based on the early findings from the study presented in the paper,we are in the process of collaboration with Government of WestBengal by deploying our tool at their units, offering our findingsand in exchange including their expertise and additional data to im-prove the system’s functionalities. We are also planning to deployour tool in Ghana at the Ministry of Food and Agriculture (MoFA)field offices. MoFA field workers can greatly benefit from this toolby obtaining data about the area under their supervision. There is ashortage of field workers recruited by MoFA and thus, each workerhas a huge area to supervise. Monitoring the land, which normallydone manually by visiting the area in person, is slow and cumber-some. This tool can provide a positive impact on their operationsby reducing time and increasing accuracy in their data. A new fea-ture can further benefit them, if the tool can access updated satelliteimages of the region at a more frequent intervals.
The main component of the study is the satellite image analysistool. The performance of the tool is greatly dependent upon theunderlying data on which the model is trained and applied. In thisstudy, we have used a freely available repository of satellite imagesfrom Google Earth. Although this data is free and easily accessi-ble, the quality is poor. Re-training the model with high resolutionsatellite images can vastly improve the performance of the systemand quality of the data produced. A major emphasis in the futuredirection of this work will be to acquire better data and train animproved model.
Apart from producing agriculture related information, the in-creased impact of the tool can be realized by applying it to otherapplications. This tool can be used – at its present form – to moni-tor water bodies. This can help in two different applications - firstly,detecting unlawful filling of ponds and lakes for development, andsecondly, monitor the impact of rising water levels in coastal areasor disappearance of land due to river erosion. Generally, this toolcan be a useful apparatus for policy makers and law-enforcementagencies to detect illegal constructions on protected or vulnerableland, provided that it has access to supporting data.
8. CONCLUSIONThis paper presents and evaluates a hypothesis that changing
land pattern can affect food production in a region. In order to eval-uate the hypothesis, we built a tool that processes satellite imagesto estimate the distribution of land patterns in a region, computes

the changing proportion in arable land and show that these changescorrelate with food production indices in the region. The satelliteimage analysis tool introduced in the paper, processes Google Earthsatellite images to classify land area in a region into 4 classes. Theimage classification engine of the tool demonstrated an accuracyof around 89%. Further improvement in the accuracy can greatlyincrease the tool’s usability and reliability. So, one direction of thefuture work is to improve the system performance specifically forsatellite images used and goals aimed in this work. Another ap-proach in the future versions of this work would be to incorporatedatasets from other sources, with less noise, better coverage andmore frequent updates. In future, we would also like to focus onother regions, apart from West Bengal and build nationwide mapsof land patterns. In addition, highlighting regions where there hasbeen drastic changes in this pattern over the recent past.
9. ACKNOWLEDGEMENTSWe thank the NYU Abu Dhabi Research Institute and the Center for
Technology and Economic Development (CTED) in NYU Abu Dhabi forsupporting Sunandan Chakraborty and Lakshminarayanan Subramanian onthis project.
10. REFERENCES[1] http://www.momagri.org/UK/
agriculture-s-key-figures/Every-single-day-over-550-acres-of-\agricultural-land-the-equivalent-of-\\four-average-size-farms\-are-disappearing-in-France_1057.html. [Online;accessed Feb-2016].
[2] Economic review and statistical appendix, department of statisticsand programme implementation, government of west bengal,2000-2012.
[3] Land lost, singur farmer said no to compensation, commits suicide.http://archive.indianexpress.com/news/land-lost-singur-farmer-said-no-to-\\compensation-commits-suicide/31930/, 2007.[Online; accessed Feb-2016].
[4] Yale environment 360: Most productive u.s. farmland disappearing atfastest rate. http://e360.yale.edu/digest/most-productive-us-farmland-disappearing\-at-fastest-rate-report-says/2627/, 2010. [Online;accessed Feb-2016].
[5] Incredible shrinking farmland.http://grist.org/sustainable-farming/2011-11-07-incredible-shrinking-farmland/, 2011.[Online; accessed Feb-2016].
[6] B. Abelson, K. R. Varshney, and J. Sun. Targeting direct cashtransfers to the extremely poor. KDD ’14, 2014.
[7] R. Achanta, A. Shaji, K. Smith, A. Lucchi, P. Fua, and S. Susstrunk.Slic superpixels compared to state-of-the-art superpixel methods.IEEE Trans. Pattern Anal. Mach. Intell., 34(11), Nov. 2012.
[8] F. Adimi, R. P. Soebiyanto, N. Safi, and R. Kiang. Towards malariarisk prediction in afghanistan using remote sensing. Malaria Journal,9(125), May 2010.
[9] BBC. Desertification - expansion of the sahara desert.http://www.bbc.co.uk/programmes/p00xbj4w.[Online; accessed Feb-2016].
[10] A. Bretto, A. Ducournau, and S. Rital. A hypergraph reductionalgorithm for joint segmentation and classification of satellite imagecontent. In Progress in Pattern Recognition, Image Analysis,Computer Vision, and Applications, volume 6419. 2010.
[11] P. Ceccato, S. Connor, I. Jeanne, and M. Thomson. Application ofgeographical information systems and remote sensing technologiesfor assessing and monitoring malaria risk. Parassitologia, 47(1), ’05.
[12] R. Dahmani, A. Fora, and A. Sbihi. Monitoring the proliferation ofslums through gis and satellite image processing in the rural commonof sidi taibi. I. J. of Engineering Research and Development, 10(8),Aug 2014.
[13] D. Dioufa, A. Nianga, J. Brajardb, M. Creponb, and S. Thiriab.Retrieving aerosol characteristics and sea-surface chlorophyll fromsatellite ocean color multi-spectral sensors using a neural-variationalmethod. Remote Sensing of Environment, 130, Mar 2013.
[14] A. Ducournau and A. Bretto. Random walks in directed hypergraphsand application to semi-supervised image segmentation. ComputerVision and Image Understanding, 120:91–102, Mar 2014.
[15] A. Ducournau, A. Bretto, S. Rital, and B. Laget. A reductiveapproach to hypergraph clustering: An application to imagesegmentation. Pattern Recognition, 45(7), July 2012.
[16] B. Fulkerson, A. Vedaldi, and S. Soatto. Class segmentation andobject localization with superpixel neighborhoods. In IEEE Intl.Conf. on Computer Vision, 2009.
[17] J. Hielkema and F. L. Snijders. Operational use of environmentalsatellite remote sensing and satellite communications technology forglobal food security and locust control by fao: The artemis and dianasystems. Acta Astronautica, 32(9), Sep 1994.
[18] M. Hossain. Global warming induced sea level rise on soil, land andcrop production loss in bangladesh. In World Congress of SoilScience, Soil Solutions for a Changing World, 2010.
[19] S. Huber, R. Fensholt, K. Rasmussen, S. Proud, and A. Anyamba.Improving early warning systems for food security in africa withgeostationary earth observation data. IOP Conference Series: Earthand Environmental Science, 6:–, 2009.
[20] C. F. Hutchinson. Uses of satellite data for famine early warning insub- saharan africa. Intl. J. of Remote Sensing, 12(6), 1991.
[21] M. Kelly, S. Blanchard, E. Kersten, and K. Koy. Terrestrial remotelysensed imagery in support of public health: New avenues of researchusing object-based image analysis. Remote Sensing, 3(11), 2011.
[22] B. W. Khan MM, Mock NB. Composite indicators for famine earlywarning systems. Disasters, 16(3), Sep 1992.
[23] Y. LeCun, L. Bottou, Y. Bengio, and P. Haffner. Gradient-basedlearning applied to document recognition. Proceedings of the IEEE,86(11), 1998.
[24] M.-Y. Liu, O. Tuzel, S. Ramalingam, and R. Chellappa. Entropy ratesuperpixel segmentation. In CVPR, 2011, 2011.
[25] A. Mohan, C. Papageorgiou, and T. Poggio. Example-based objectdetection in images by components. Pattern Analysis and MachineIntelligence, 23(4), Apr 2001.
[26] A. M. Noor, V. A. Alegana, P. W. Gething, A. J. Tatem, and R. W.Snow. Using remotely sensed night-time light as a proxy for povertyin africa. Population Health Metrics, 6(5), 2008.
[27] T. Philpott. New research: synthetic nitrogen destroys soil carbon,undermines soil health. http://grist.org/article/2010-02-23-new-research-synthetic-nitrogen\\-destroys-soil-carbon-undermines/, 2010. [Online;accessed Feb-2016].
[28] J. A. Quinn, W. Okori, and A. Gidudu. Increased-specificity famineprediction using satellite observation data. ACM DEV ’10, 2010.
[29] K. R., S. R., and S. N. Satellite image resolution enhancement usingcontrast limited adaptive histogram equalization. Digital ImageProcessing, 6(3), 2014.
[30] A. F. Rahman, D. Dragoni, K. Didan, A. Barreto-Munoz, and J. A.Hutabarat. Detecting large scale conversion of mangroves toaquaculture with change point and mixed-pixel analyses ofhigh-fidelity modis data. Remote Sensing of Environment, 130, 2013.
[31] A. Schick, M. Bauml, and R. Stiefelhagen. Improving foregroundsegmentations with probabilistic superpixel markov random fields. InCVPRW, 2012, 2012.
[32] C. S. Thomson MC. The development of malaria early warningsystems for africa. Trends Parasitol, 17(9):438–445, Sep 2001.
[33] A. C. Vibrans, R. E. McRoberts, P. Moser, and A. L. Nicoletti. Usingsatellite image-based maps and ground inventory data to estimate thearea of the remaining atlantic forest in the brazilian state of santacatarina. Remote Sensing of Environment, 130, 2013.
[34] P. Viola and M. Jones. Rapid object detection using a boostedcascade of simple features. In CVPR 2001, 2001.
[35] S. Wang, H. Lu, F. Yang, and M.-H. Yang. Superpixel tracking. InICCV, 2011, Nov 2011.
[36] X. Zhang and X. Cai. Climate change impacts on global agriculturalland availability. Environmental Research Letters, 6(1), 2011.