sat 10 (2013) presentation for parents online (eng approved by ms.kate) (1)
TRANSCRIPT
SAT 10(Stanford 10)
2013Nakornpayap International School
Presentation by Ms.Pooh

The Stanford 10 Achievement Test is given from 22nd April 2013 - 3rd
May 2013 students from Grades 1 to 12.
The content of the Stanford 10
includes academic concepts and skills typically taught in
schools throughout the United States.
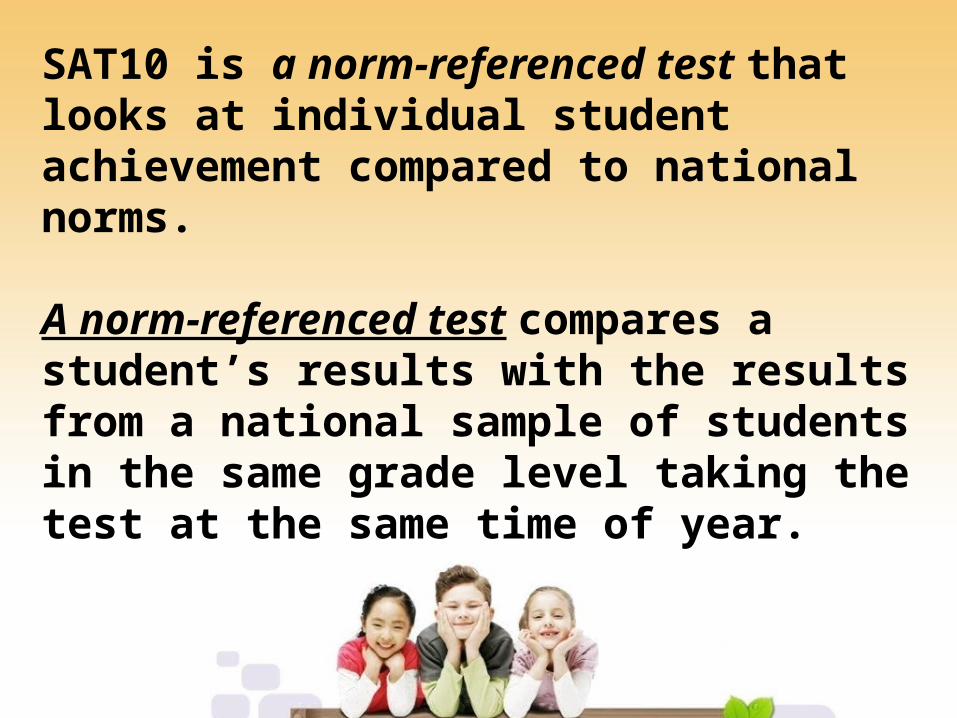
SAT10 is a norm-referenced test that looks at individual student achievement compared to national norms.
A norm-referenced test compares a student’s results with the results from a national sample of students in the same grade level taking the test at the same time of year.
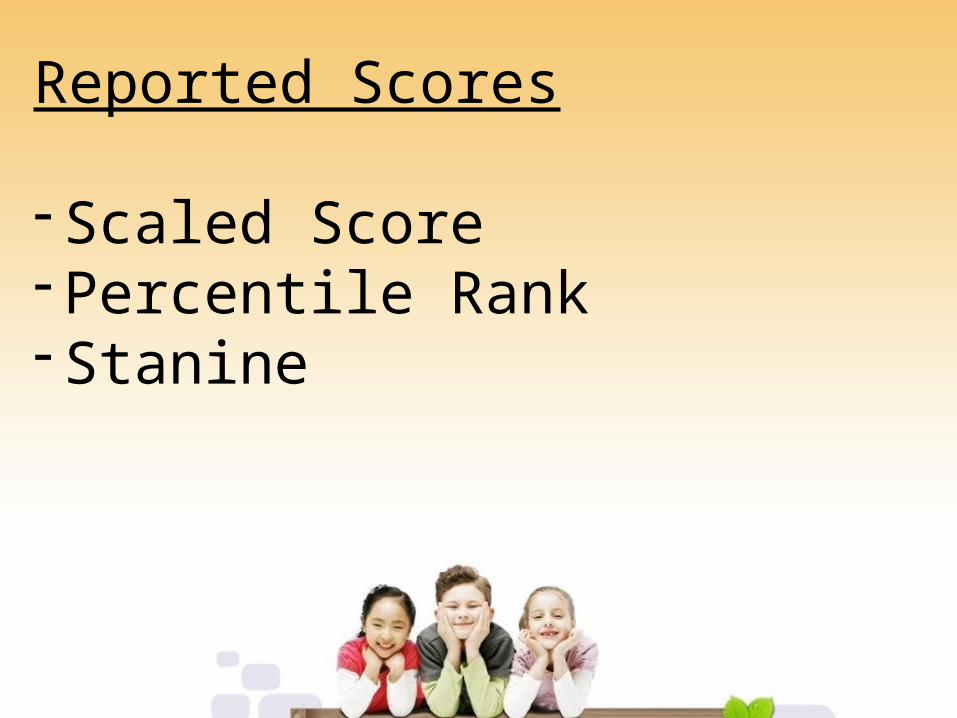
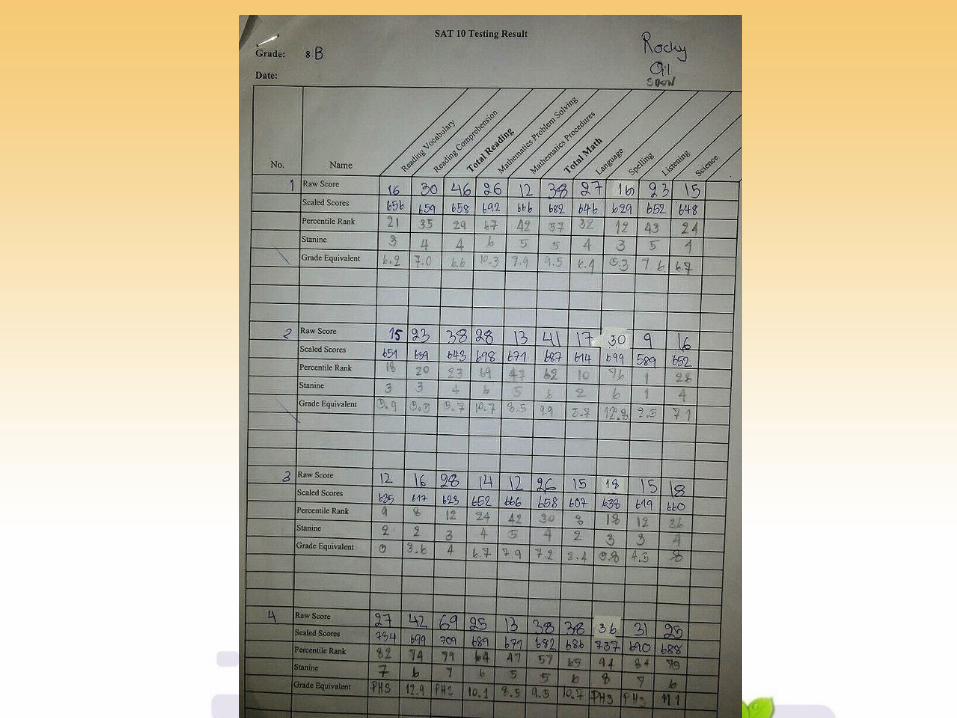
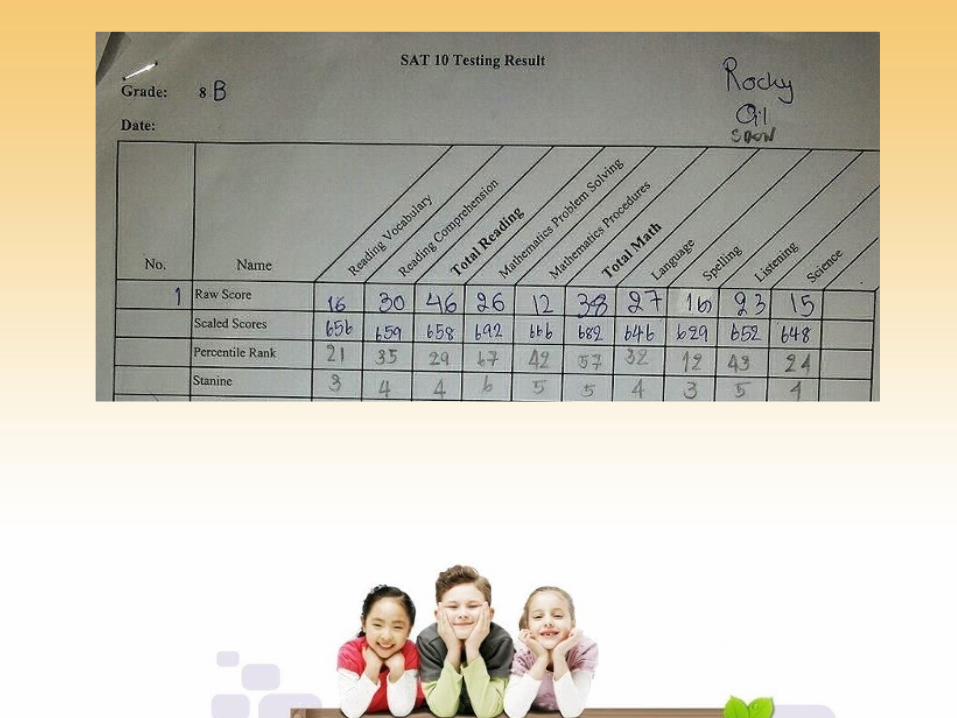
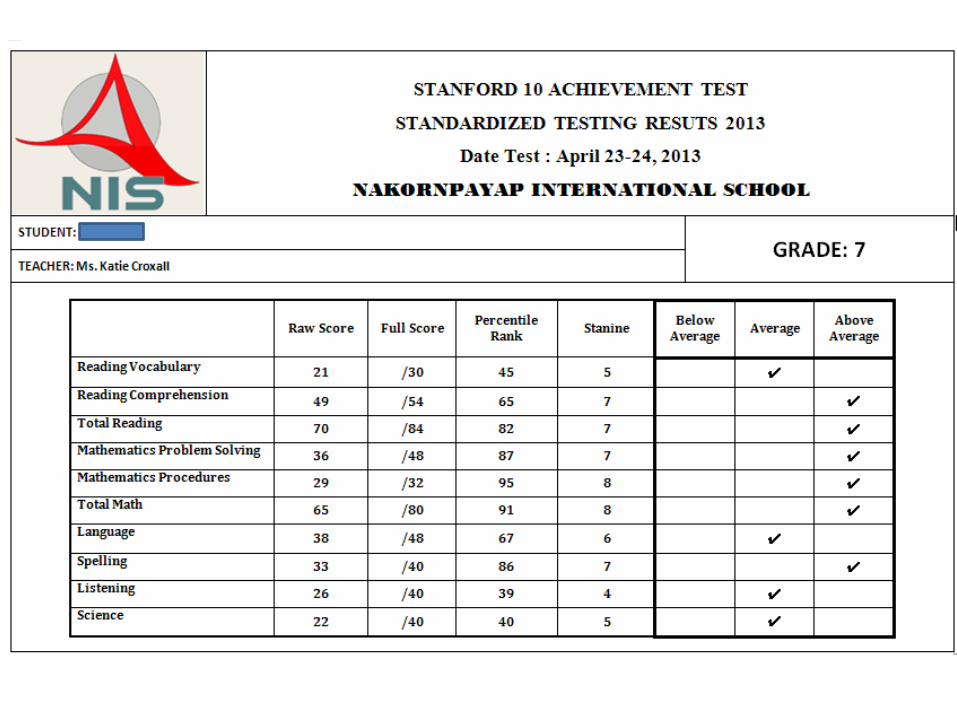
Reported Scores
- Scaled Score- Percentile Rank- Stanine
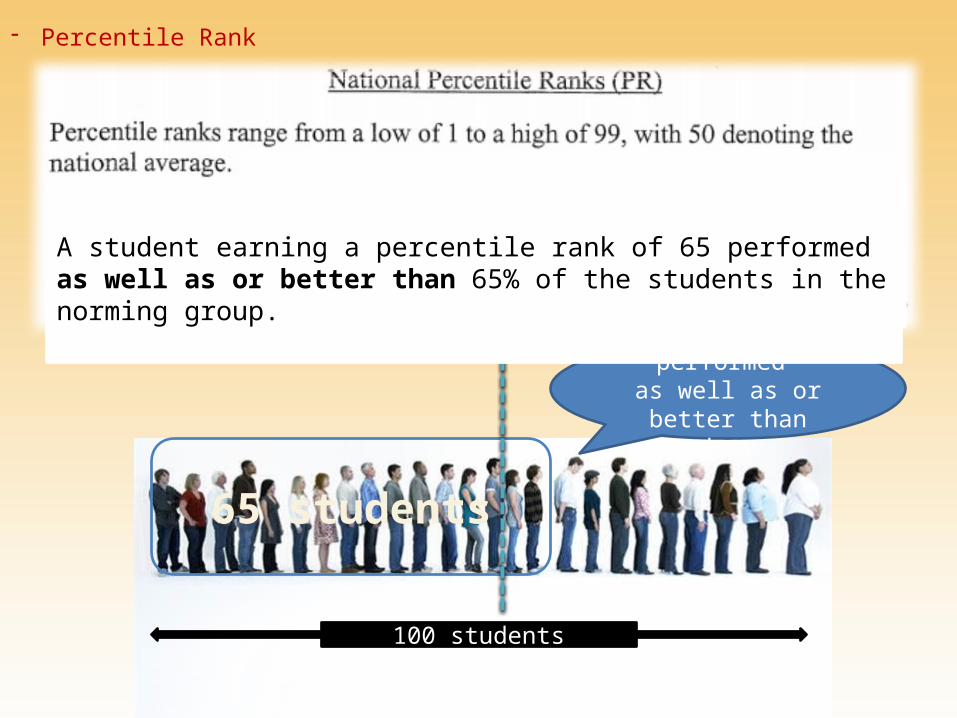
- Percentile Rank
100 students
65 students
Yeah! I performed as well as or better
than them.
A student earning a percentile rank of 65 performed as well as or better than 65% of the students in the norming group.
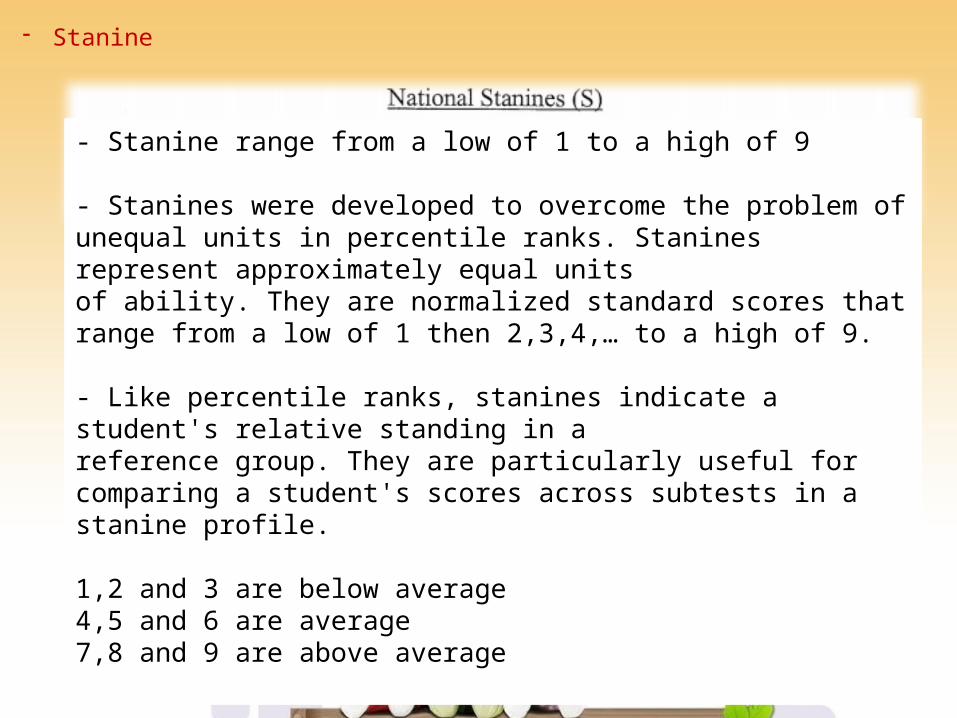
- Stanine
- Stanine range from a low of 1 to a high of 9
- Stanines were developed to overcome the problem of unequal units in percentile ranks. Stanines represent approximately equal units of ability. They are normalized standard scores that range from a low of 1 then 2,3,4,… to a high of 9.
- Like percentile ranks, stanines indicate a student's relative standing in a reference group. They are particularly useful for comparing a student's scores across subtests in a stanine profile.
1,2 and 3 are below average4,5 and 6 are average7,8 and 9 are above average
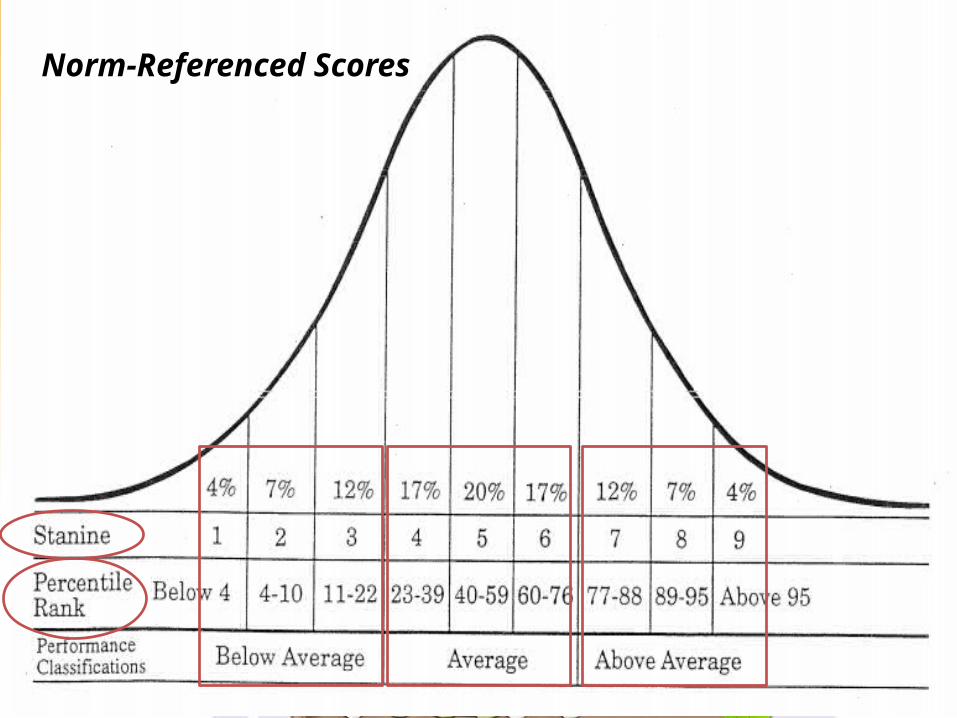
Norm-Referenced Scores

RESULTS
STANINEElementa
ry

Word
Study Skills
Word
Reading
Sentence
Reading
Reading Comprehensio
n
Total Reading
Math
ematics Pro
blem Solving
Math
ematics Pro
cedure
s
Total Math
Spelling
Language
Liste
ning
Environment
0%10%20%30%40%50%60%70%80%90%
100%
Grade 1
above averageaveragebelow average
Word
Study Skills
Reading Vocab
Reading Comprehensio
n
Total Reading
Math
ematics Pro
blem Solving
Math
ematics Pro
cedure
s
Total Math
Spelling
Language
Liste
ning0%
10%20%30%40%50%60%70%80%90%
100%
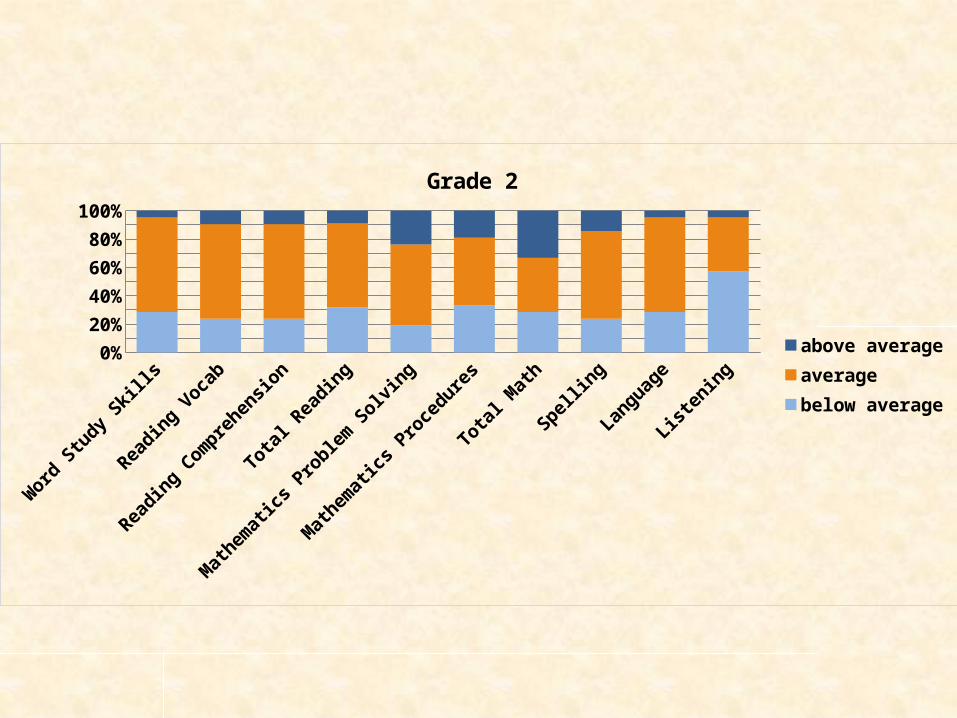
Grade 2
above averageaveragebelow average
Word
Study Skills
Reading Vocab
Reading Comprehensio
n
Total Reading
Math
ematics Pro
blem Solving
Math
ematics Pro
cedure
s
Total Math
Spelling
Language
Science
Liste
ning0%
20%
40%
60%
80%
100%
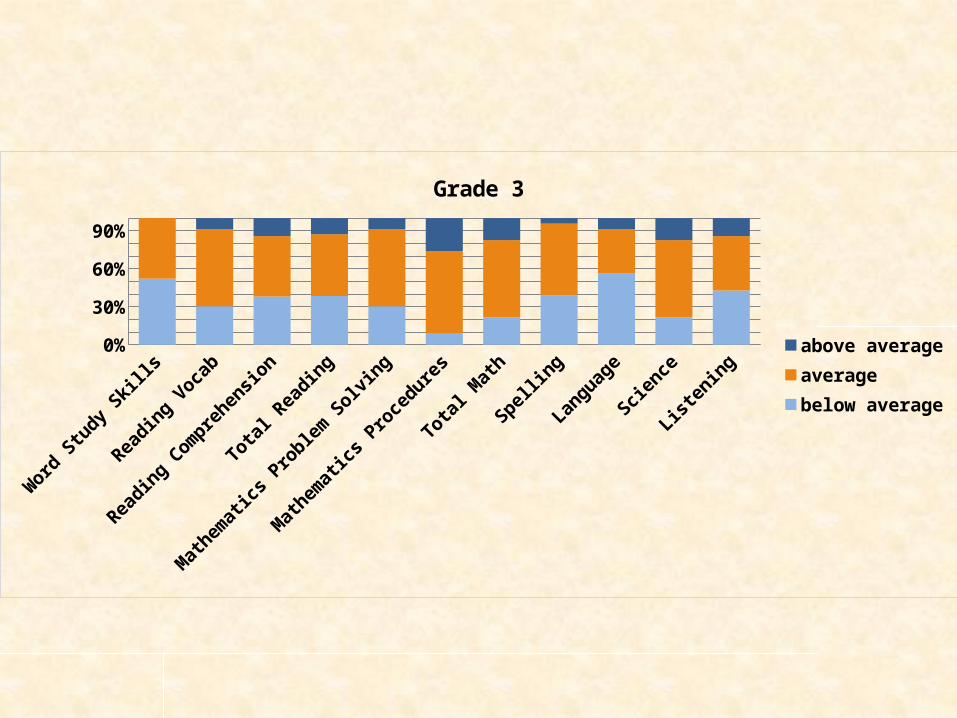
Grade 3
above averageaveragebelow average
Word
Study Skills
Reading Vocab
Reading Comprehensio
n
Total Reading
Math
ematics Pro
blem Solving
Math
ematics Pro
cedure
s
Total Math
Spelling
Language
Science
Liste
ning0%
10%20%30%40%50%60%70%80%90%
100%
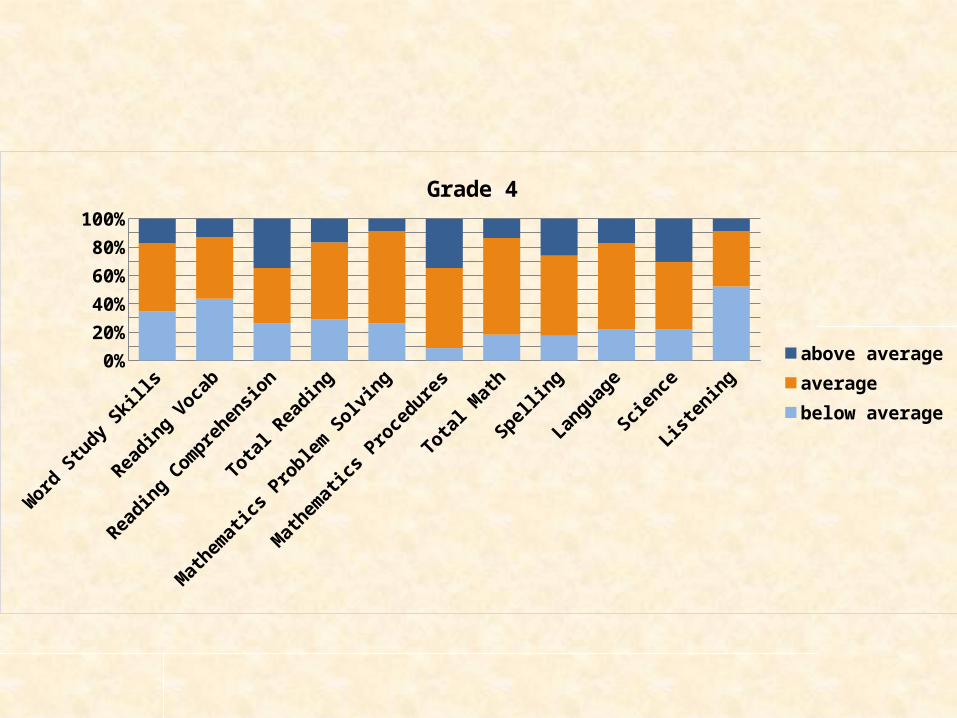
Grade 4
above averageaveragebelow average
Reading Vocab
Reading Comprehensio
n
Total Reading
Math
ematics Pro
blem Solving
Math
ematics Pro
cedure
s
Total Math
Spelling
Language
Science
Liste
ning0%
10%20%30%40%50%60%70%80%90%
100%
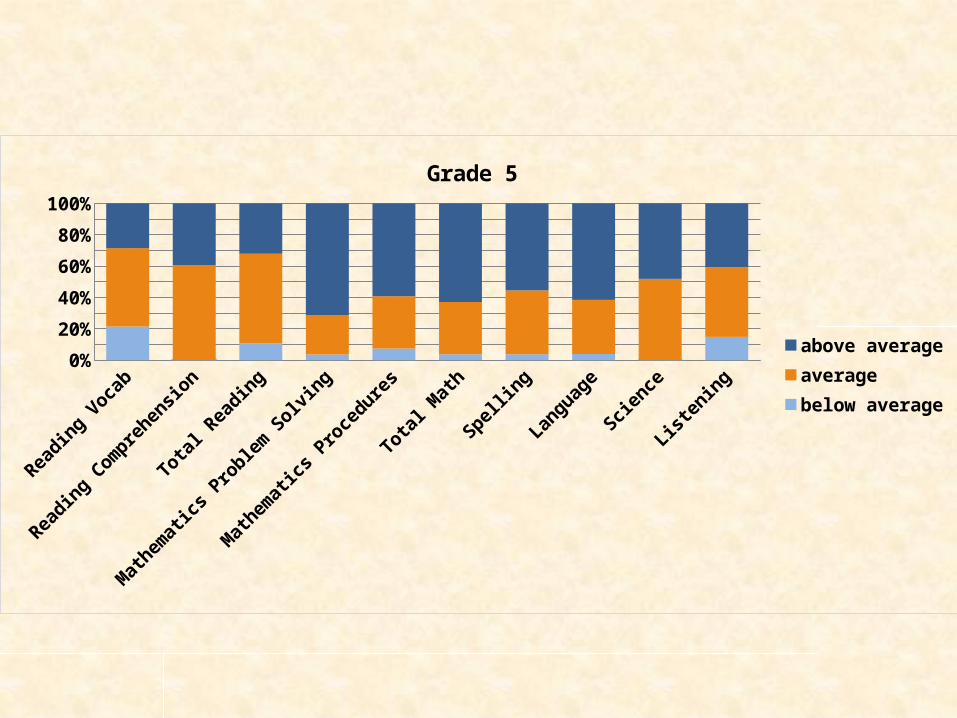
Grade 5
above averageaveragebelow average
Reading Vocab
Reading Comprehensio
n
Total Reading
Math
ematics Pro
blem Solving
Math
ematics Pro
cedure
s
Total Math
Spelling
Language
Science
Liste
ning0%
10%20%30%40%50%60%70%80%90%
100%
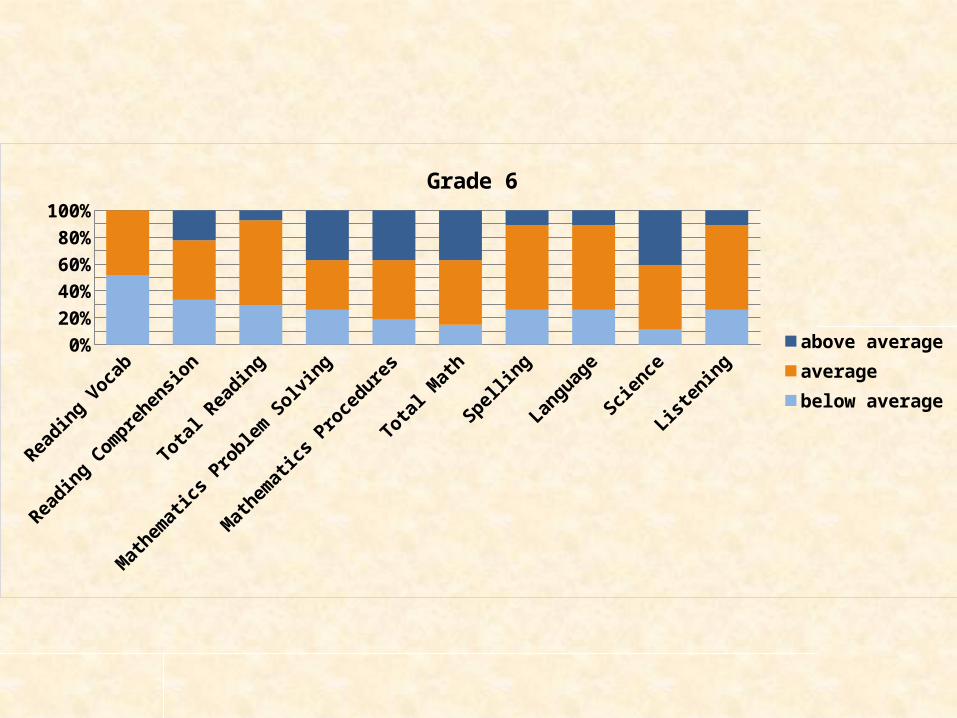
Grade 6
above averageaveragebelow average
Reading Comprehensio
n
Math
ematics Pro
blem Solving
Math
ematics Pro
cedure
s
Spelling
Language
Liste
ning
Science
(G.3-6)
0%10%20%30%40%50%60%70%80%90%
100%
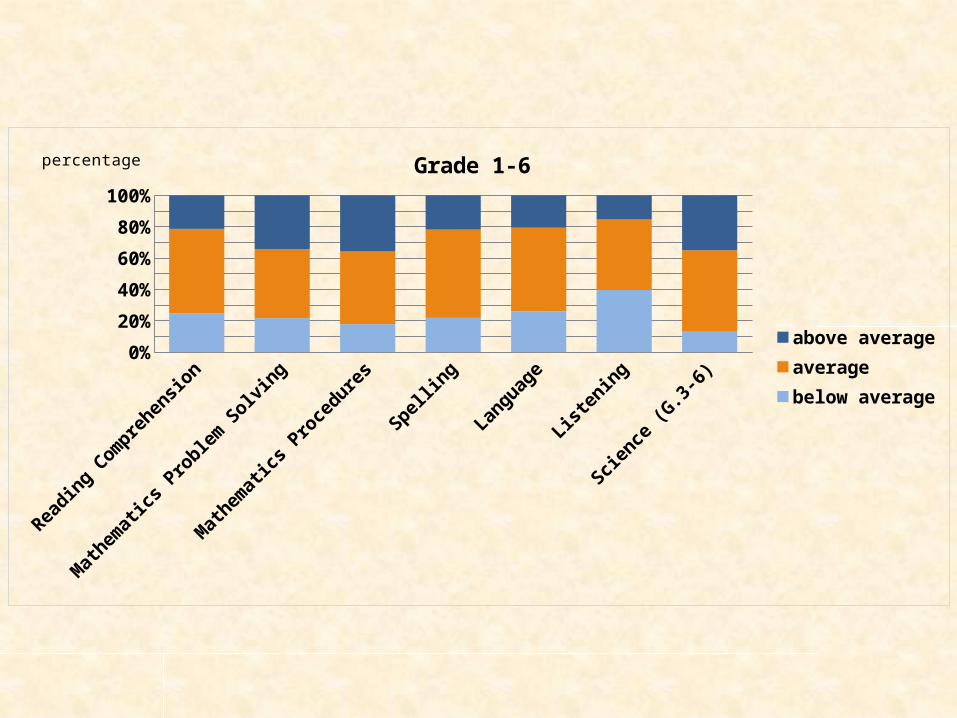
Grade 1-6
above averageaveragebelow average
percentage

STANINEHigh
School
Reading V
ocab
Reading C
ompre
Total
Reading
Math Problem So
lving
Math Proce
dures
Total
Math
Langu
age
Spellin
g
Listening
Science
0%10%20%30%40%50%60%70%80%90%
100%
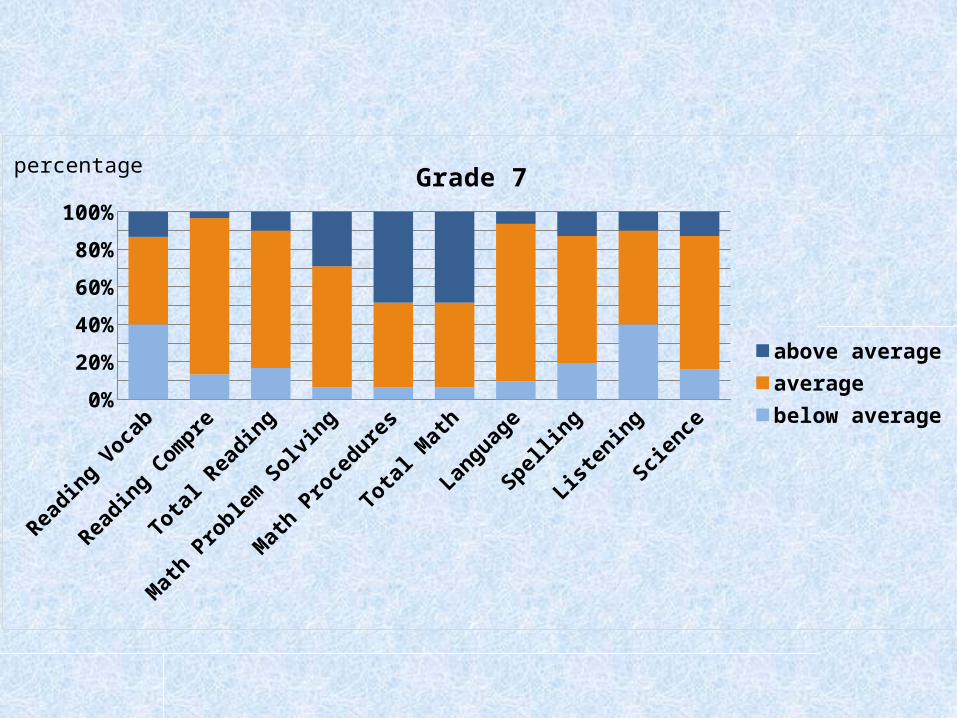
Grade 7
above averageaveragebelow average
percentage

Reading V
ocab
Reading C
ompre
Total
Reading
Math Problem So
lving
Math Proce
dures
Total
Math
Langu
age
Spellin
g
Listening
Science
0%10%20%30%40%50%60%70%80%90%
100%
Grade 8
above averageaveragebelow average
percentage

Reading Vocab
Reading Compre
Total Reading
Total Math Language Spelling Science0%
10%
20%
30%
40%
50%
60%
70%
80%
90%
100%
Grade 9
above averageaveragebelow average
percentage
Reading Vocab
Reading Compre
Total Reading
Total Math Language Spelling Science0%
10%
20%
30%
40%
50%
60%
70%
80%
90%
100%
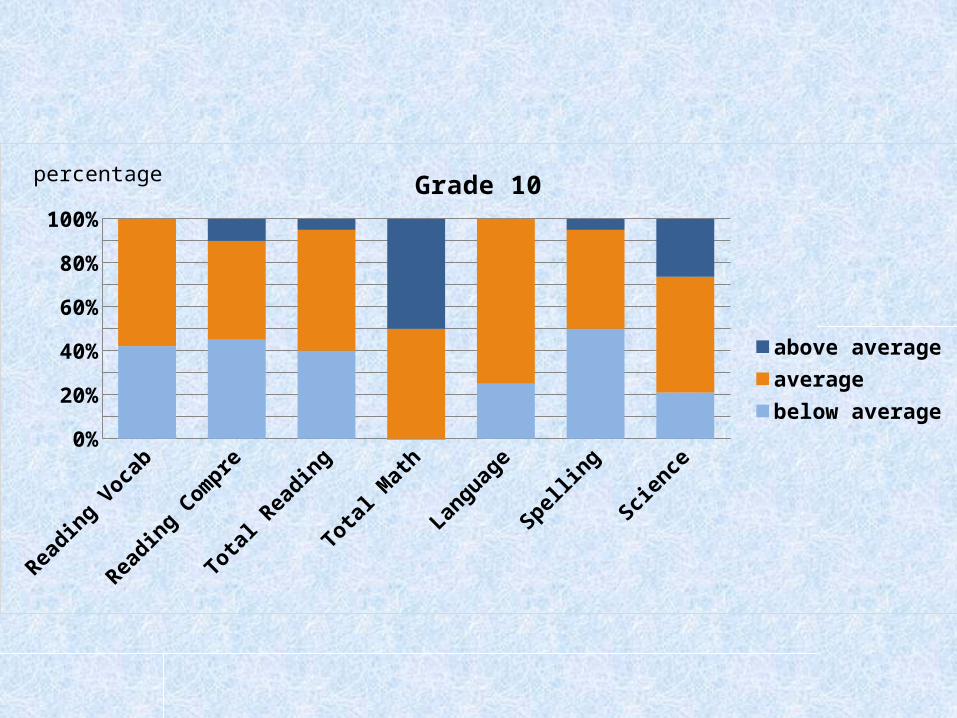
Grade 10
above averageaveragebelow average
percentage
Reading Vocab
Reading Compre
Total Reading
Total Math Language Spelling Science0%
10%
20%
30%
40%
50%
60%
70%
80%
90%
100%
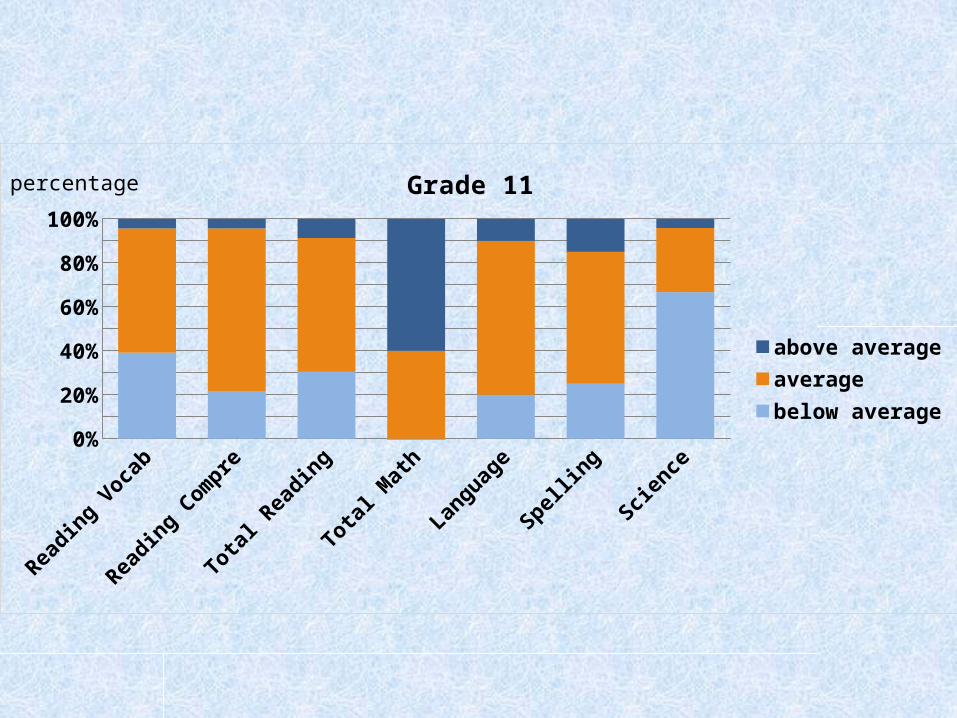
Grade 11
above averageaveragebelow average
percentage
Reading V
ocab
Reading C
ompre
Total
Reading
Total
Math
Langu
age
Spellin
g
Science
0%10%20%30%40%50%60%70%80%90%
100%
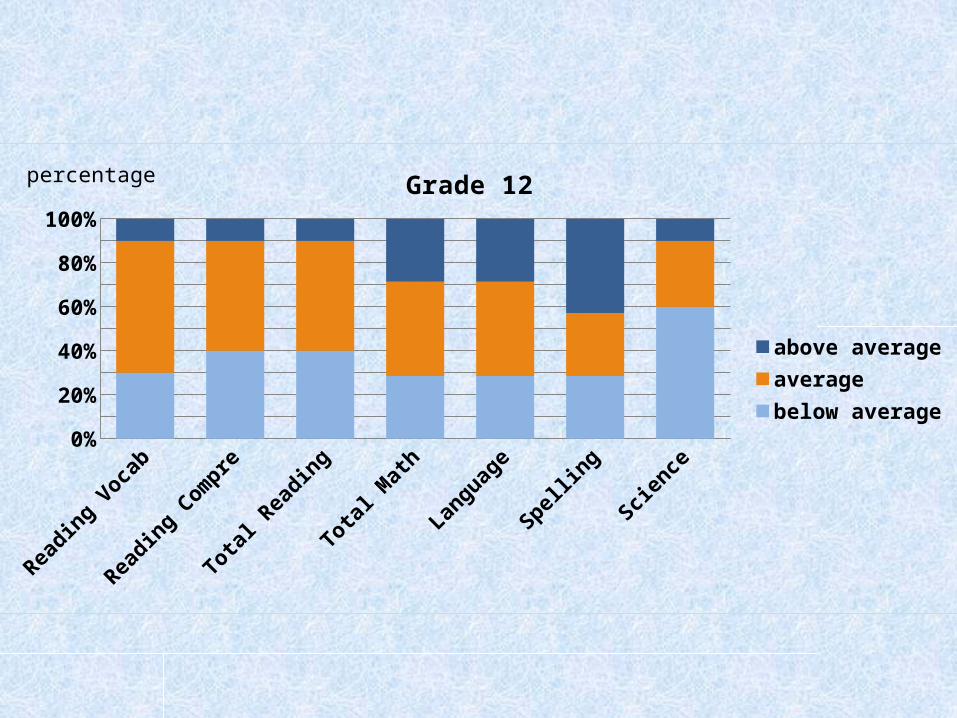
Grade 12
above averageaveragebelow average
percentage

Reading Vocab
Reading Compre
Total Reading
Total Math Language Spelling Science0%
10%
20%
30%
40%
50%
60%
70%
80%
90%
100%
Grade 7-12
above averageaveragebelow average
percentage
Conclusion
SAT10 is a test which compares students’ scores with students in the US who are mostly native English speakers. This explains why language related scores are likely to fall to below the average of students in the US. However, the majority of our students scores fall into the average range.
Thank you