sar imaging using a small consumer droneusers.ece.utexas.edu/~ling/dronesar_li_ling.pdf ·...
TRANSCRIPT

Synthetic Aperture Radar Imaging Using a Small Consumer Drone
Chenchen J. Li and Hao Ling
The University of Texas at Austin
1
I. Motivation and Objective
II. Drone SAR System
III. Validation on Corner Reflectors
IV. Preliminary Data on Other Targets
V. Conclusion
2
Outline

• Small drones have become popular for aerial photography.
3
Motivation

• What happens when you mount a radar on the drone?
4
Motivation
??? ???

• Small drones have become popular for aerial photography.
• Radar imaging could provide complementary information and extended operating conditions.
• Applications in scientific, agricultural, and environmental monitoring.
• UAV-SAR systems exist but are typically too heavy and need to be supported by large UAVs [1-3].
5
Motivation
[2] Koo et al., 2012.
44 lb system
[1] Lynx, Sandia, 2000.
125 lb system
[3] NanoSAR, BYU, 2006.
2-3 lb system

Develop and demonstrate a low-cost SAR system that is mounted on a small consumer drone (DJI Phantom 2).
Scientific Question: Can a low-cost, high-resolution SAR system be realized on a small consumer drone (whose maximum payload is typically less than 1 lb)?
6
Objective
Radar

• PulsON 410 (P410) radar by Time Domain Corporation.
• Board is 7.6 cm x 8 cm x 1.6 cm, weighs 58 grams, and can be battery powered.
• Emits short pulses at a pulse repetition frequency of 10 MHz.
• Equivalent frequency bandwidth from 3.1 to 5.3 GHz centered at 4.3 GHz.
• USB interface to control radar and transfer range profiles.
7
PulsON 410 UWB Radar

8
Drone SAR System
SAR system consists of P410 radar, Raspberry Pi + Wi-Fi Dongle, helix antennas mounted on aluminum ground planes. Entire system (including cables and batteries) weighs less
than 300 g.
Wi-Fi
Raspberry Pi
Computer
Time Domain Radar
Radar Control
Drone Control
Rmin
R ϕ

9
Drone SAR Prototype Photos
Helix Antennas
Radar
Raspberry Pi

• Broadband 5-turn helix antenna centered at 4 GHz.
• Supported by 3-D printed mold.
• Aluminum ground planes.
• 1 right-hand CP for Tx, 1 left-hand CP for Rx.
• Gain: ~10 dB ; Two-way 3 dB beamwidth: ~15°
10
Helix Antennas
2.5 3 3.5 4 4.5 5 5.5-30
-25
-20
-15
-10
-5
0
Freq (GHz)
S11 (
dB
)
2.5 3 3.5 4 4.5 5 5.50
5
10
15
Freq (GHz)
Ga
in (
dB
)

• Measured range profiles are real valued but finely sampled in time.
• Use FFT to get the complex frequency response and only keep data from 3.1-5.3 GHz.
11
Measurement Range Profiles
0 0.5 1 1.5 2 2.5-1500
-1000
-500
0
500
1000
1500
Down-range (m)
Sig
na
l S
tre
ng
th
-5 0 50
0.5
1
1.5
2
2.5
3x 10
4
Frequency (GHz)
Sig
na
l S
tre
ng
th
Raw Range Profile Frequency Response
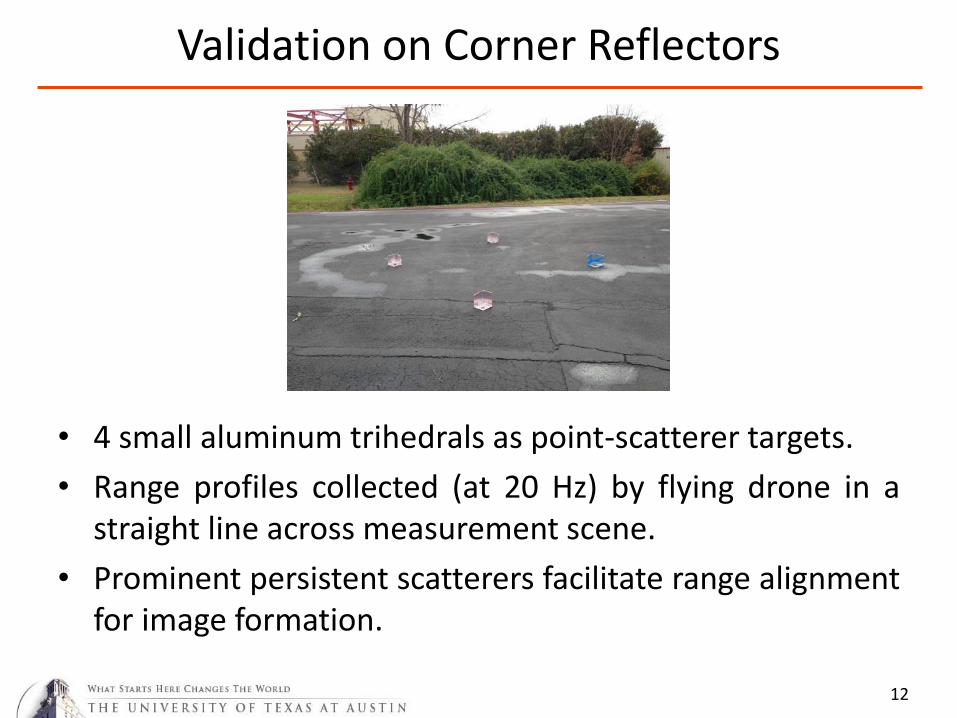
• 4 small aluminum trihedrals as point-scatterer targets.
• Range profiles collected (at 20 Hz) by flying drone in a straight line across measurement scene.
• Prominent persistent scatterers facilitate range alignment for image formation.
12
Validation on Corner Reflectors
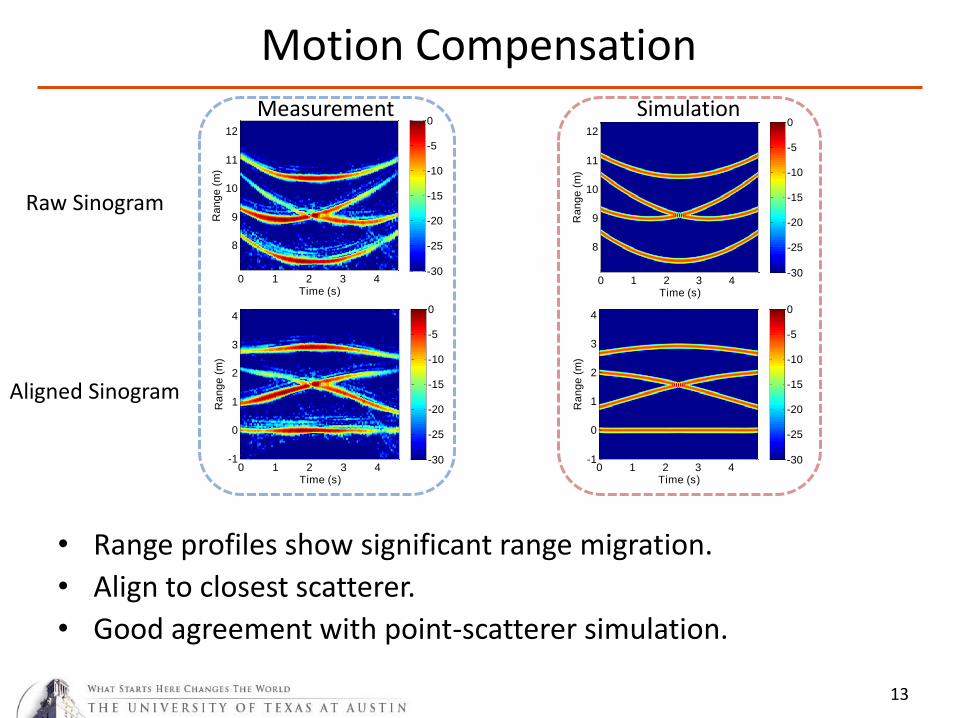
• Range profiles show significant range migration.
• Align to closest scatterer.
• Good agreement with point-scatterer simulation.
13
Motion Compensation
Ra
ng
e (
m)
Time (s)
0 1 2 3 4
8
9
10
11
12
-30
-25
-20
-15
-10
-5
0
Time (s)
Ra
ng
e (
m)
0 1 2 3 4-1
0
1
2
3
4
-30
-25
-20
-15
-10
-5
0
Ra
ng
e (
m)
Time (s)
0 1 2 3 4
8
9
10
11
12
-30
-25
-20
-15
-10
-5
0
Time (s)
Ra
ng
e (
m)
0 1 2 3 4-1
0
1
2
3
4
-30
-25
-20
-15
-10
-5
0
Measurement Simulation
Raw Sinogram
Aligned Sinogram

• Frequency/angle data are placed in k-space.
• Polar reformat to uniform kx-ky space and take 2-D inverse fast Fourier transform to obtain image.
14
Image Formation
𝐼𝑚𝑎𝑔𝑒 𝑟, 𝑐𝑟 = 𝐸𝑠 𝑓, ϕ 𝑒𝑗𝑘𝑥𝑟𝑒𝑗𝑘𝑦𝑐𝑟𝑑𝑘𝑥𝑑𝑘𝑦
𝑤ℎ𝑒𝑟𝑒
𝑘𝑥 =4𝜋𝑓
𝑐cosϕ
𝑘𝑦 =4𝜋𝑓
𝑐sinϕ
;
kx
ky
k-space data
2-D iFFT SAR image
Ran
ge
Cross-Range
ϕ = cos−1𝑅𝑚𝑖𝑛𝑅

• 3 focused scatterers. Cross-range smearing of farthest scatterer due to near-field effects.
• Good agreement between simulation and rail-SAR.
• More blurred result in drone-SAR.
15
Resulting SAR Images
Simulation Rail-SAR Drone-SAR
Ra
ng
e (
m)
Cross-Range (m)
-2 -1 0 1 2-1
0
1
2
3
4
-30
-25
-20
-15
-10
-5
0
Ra
ng
e (
m)
Cross-Range (m)
-2 -1 0 1 2-1
0
1
2
3
4
-30
-25
-20
-15
-10
-5
0
Ra
ng
e (
m)
Cross-Range (m)
-2 -1 0 1 2-1
0
1
2
3
4
-30
-25
-20
-15
-10
-5
0
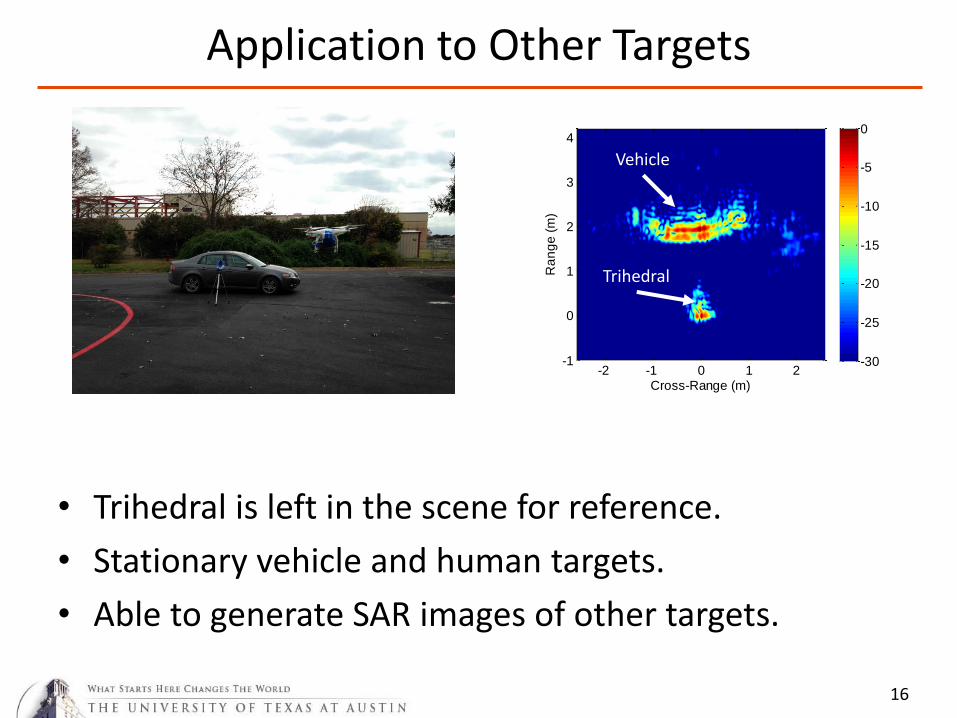
• Trihedral is left in the scene for reference.
• Stationary vehicle and human targets.
• Able to generate SAR images of other targets.
16
Application to Other Targets
Ra
ng
e (
m)
Cross-Range (m)
-2 -1 0 1 2-1
0
1
2
3
4
-30
-25
-20
-15
-10
-5
0
Vehicle
Trihedral

• Trihedral is left in the scene for reference.
• Stationary vehicle and human targets.
• Able to generate SAR images of other targets.
17
Application to Other Targets
Ra
ng
e (
m)
Cross-Range (m)
-2 -1 0 1 2-1
0
1
2
3
4
-30
-25
-20
-15
-10
-5
0
Vehicle
Trihedral Ra
ng
e (
m)
Cross-Range (m)
-2 -1 0 1 2-1
0
1
2
3
4
-30
-25
-20
-15
-10
-5
0
Vehicle
Trihedral

• Trihedral is left in the scene for reference.
• Stationary vehicle and human targets.
• Able to generate SAR images of other targets.
18
Application to Other Targets
Ra
ng
e (
m)
Cross-Range (m)
-2 -1 0 1 2-1
0
1
2
3
4
-30
-25
-20
-15
-10
-5
0
Vehicle
Trihedral Ra
ng
e (
m)
Cross-Range (m)
-2 -1 0 1 2-1
0
1
2
3
4
-30
-25
-20
-15
-10
-5
0
Vehicle
Trihedral Ra
ng
e (
m)
Cross-Range (m)
-2 -1 0 1 2-1
0
1
2
3
4
-30
-25
-20
-15
-10
-5
0
Trihedral
Human

• Devised a portable, lightweight SAR system that can be mounted on a small drone.
• Verified its imaging capability on trihedrals and then collected preliminary data of other targets.
• Current work.
– Near-field correction
– Downward-looking SAR
19
Recap

• Previous: used far-field FFT-based imaging scheme on near-field data.
• Solution: apply near-field backprojection imaging scheme.
20
Near-Field Effect Correction
Near-Field Data
Near-Field Backprojection
Far-Field FFT-Based
Imaging Final
Image

• Matched filter algorithm that projects the scattered field data into the phase function.
21
Near-Field Backprojection
SAR 𝑟, 𝑐𝑟 =1
𝑁𝑀 𝐸𝑠 𝑥𝑛, 𝑓𝑚 × 𝑒
𝑗4𝜋𝑓𝑚𝑐 𝑐𝑟−𝑥𝑛
2+ 𝑟+𝑦𝑜2+𝑧𝑜2
𝑀
𝑚=1
𝑁
𝑛=1
SAR Image
cr
r

• Near-field effects have been removed.
• Good agreement between rail-SAR and simulation.
• More blurred result in drone-SAR.
22
Resulting SAR Images
Ra
ng
e (
m)
Cross-Range (m)
-2 -1 0 1 2-1
0
1
2
3
4
-30
-25
-20
-15
-10
-5
0
Ra
ng
e (
m)
Cross-Range (m)
-2 -1 0 1 2-1
0
1
2
3
4
-30
-25
-20
-15
-10
-5
0
Ra
ng
e (
m)
Cross-Range (m)
-2 -1 0 1 2-1
0
1
2
3
4
-30
-25
-20
-15
-10
-5
0
Simulation Rail-SAR Drone-SAR

23
Downward-Looking SAR
Radar Control
Drone Control
Point antennas at the ground in order to change imaging plane.
Wi-Fi
Raspberry Pi
Computer
Time Domain Radar

24
Preliminary Investigation
• Currently mounted on a vehicle for preliminary investigation.
• Attached drone-SAR system on extension pole and pointed downward.
• Drive across parking lot and collect range profiles.

• Strong ground bounce and minor residual platform
returns.
• Height information is captured.
• Multiple scattering is visible.
25
Resulting Range Profiles R
an
ge
(m
)
Time (s)
0 20 40 600
0.5
1
1.5
2
2.5
3
3.5
4
-30
-25
-20
-15
-10
-5
0
Person Car 3 Car 2 Car 1 Car 2 Car 1
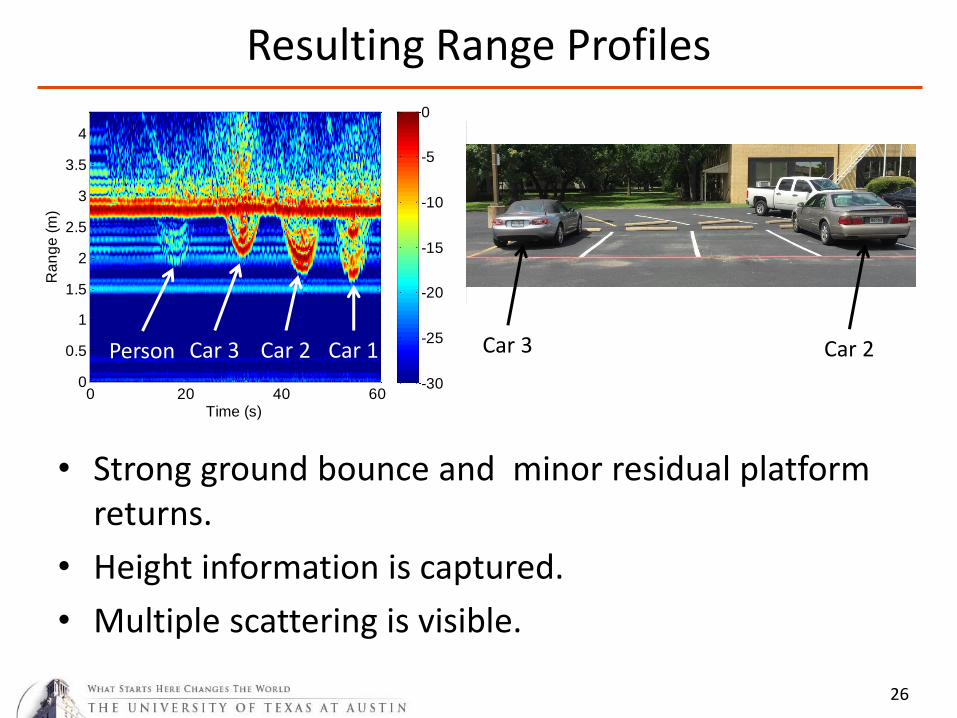
• Strong ground bounce and minor residual platform
returns.
• Height information is captured.
• Multiple scattering is visible.
26
Resulting Range Profiles R
an
ge
(m
)
Time (s)
0 20 40 600
0.5
1
1.5
2
2.5
3
3.5
4
-30
-25
-20
-15
-10
-5
0
Person Car 3 Car 2 Car 1 Car 2 Car 1
Car 3 Car 2

• Strong ground bounce and minor residual platform
returns.
• Height information is captured.
• Multiple scattering is visible.
27
Resulting Range Profiles R
an
ge
(m
)
Time (s)
0 20 40 600
0.5
1
1.5
2
2.5
3
3.5
4
-30
-25
-20
-15
-10
-5
0
Person Car 3 Car 2 Car 1 Car 2 Car 1
Car 3 Car 2
Person Car 3

• Devised and demonstrated a portable, lightweight SAR system that can be mounted on a small drone.
• Pros:
+ Low-cost and portability opens up many new possibilities for in-situ measurements that were prohibitive in the past.
• Cons:
– Needs prominent scatterer (absence of navigation data).
– Drone flight instability.
28
Conclusion

• Continue downward-looking SAR for frontal view imaging of targets.
• Examine radar signatures under co-polarized and cross-polarized scenarios.
• SAR imagery of targets through optical obstructions (smoke, foliage).
• Blind motion compensation / obtain navigation data.
29
Future Work

Thanks to Sam Grayson, Tiffany Dang, Li Wang, Reid Li, and Kevin Chaloupka for their assistance.
30
Acknowledgments