sapporo holdings limited annual report 2012
TRANSCRIPT
Maximizing Value
SAPPORO HOLDINGS LIMITED Annual Report 2012

01 Profile
02 Creating New Value at Sapporo
03 Our Business
04 Key Indicators
06 Financial Highlights
08 To Our Stakeholders
15Special Feature Maximizing Value
20 Performance Review and Plan 20 Japanese Alcoholic Beverages
22 International 24 Food & Soft Drinks
26 Restaurants
27 Real Estate
28 CSR: Selective about Our Raw Materials
30 Corporate Governance
34 Board of Directors and Audit & Supervisory Board Members
36 Financial Section
69 Corporate Data
ContentsContents description
Presents the goal of the Sapporo Group’s New Management Framework and our basic strategies.
The president discusses business performance in fiscal 2012 and explains the Sapporo Group’s Management Plan for fiscal 2013 to 2014, which seeks dynamic growth.
Discusses the factors behind our growth and future development in overseas markets.
Explains the business conditions, growth strategies, and Management Plan 2013 to 2014 by segment.
Contains an interview with an outside director and explains the Sapporo Group’s basic approach to corporate governance.
Introduces the reader to our Collaborative Contract Farming System, which insists on only the finest ingredients.
Statements in this annual report with respect to the Company’s plans, strategies, forecasts and other statements that are not historical facts are forward-looking statements that are based on management’s judgment in light of currently available information. Factors that could cause actual results to differ materially from our earnings forecasts include, without limitation, global economic conditions, our response to market demand for and competitive pricing pressure on products and services and currency exchange rate fluctuations.
Forward-looking Statements
All figures in this annual report are rounded to the nearest applicable unit.
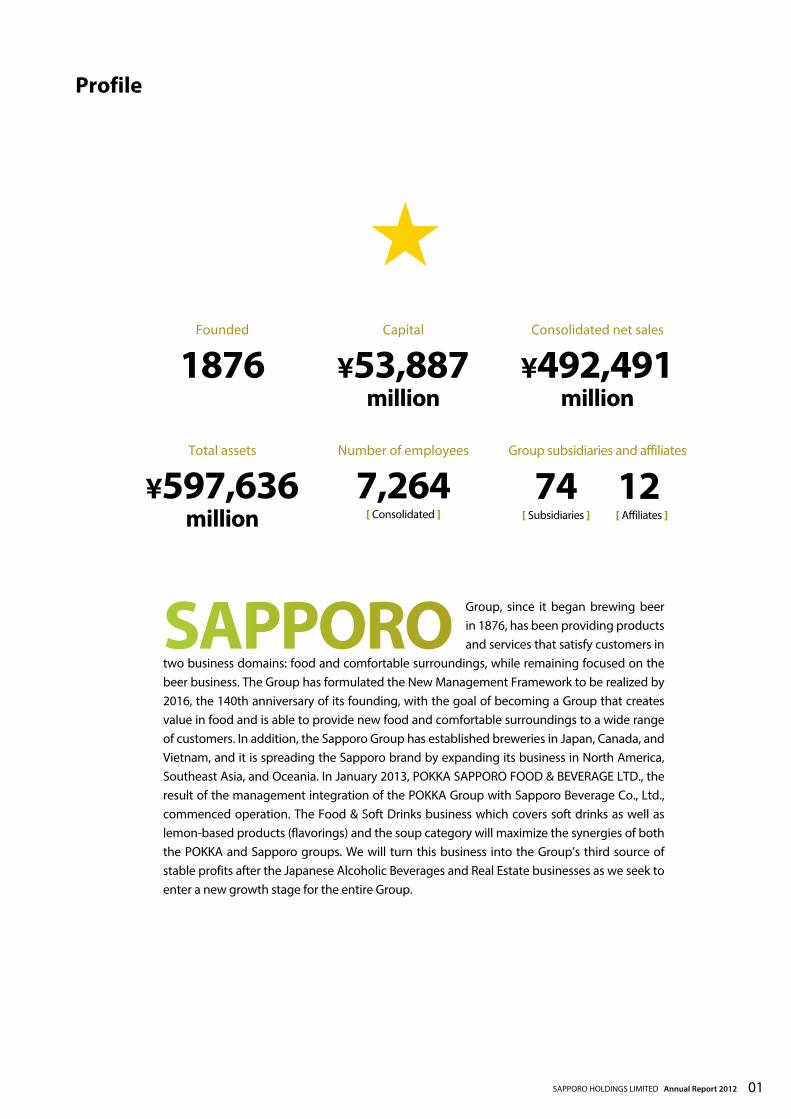
Profile
SAPPORO Group, since it began brewing beer in 1876, has been providing products and services that satisfy customers in
two business domains: food and comfortable surroundings, while remaining focused on the beer business. The Group has formulated the New Management Framework to be realized by 2016, the 140th anniversary of its founding, with the goal of becoming a Group that creates value in food and is able to provide new food and comfortable surroundings to a wide range of customers. In addition, the Sapporo Group has established breweries in Japan, Canada, and Vietnam, and it is spreading the Sapporo brand by expanding its business in North America, Southeast Asia, and Oceania. In January 2013, POKKA SAPPORO FOOD & BEVERAGE LTD., the result of the management integration of the POKKA Group with Sapporo Beverage Co., Ltd., commenced operation. The Food & Soft Drinks business which covers soft drinks as well as lemon-based products (flavorings) and the soup category will maximize the synergies of both the POKKA and Sapporo groups. We will turn this business into the Group’s third source of stable profits after the Japanese Alcoholic Beverages and Real Estate businesses as we seek to enter a new growth stage for the entire Group.
Capital
¥53,887 million
Consolidated net sales
¥492,491 million
Founded
1876
Total assets
¥597,636 million
Number of employees
7,264[ Consolidated ]
Group subsidiaries and affiliates
74 12[ Subsidiaries ] [ Affiliates ]
SAPPORO HOLDINGS LIMITED Annual Report 2012 01

International
Food & Soft Drinks
Sapporo Group’s New Management Framework
Creating New Value at Sapporo
Japanese Alcoholic Beverages
Real Estate
2007
1 Concentrate resources on creation of high-value-added products and services
2 Engage in strategic alliances aimed at building competitive advantage and expanding business
3 Actively expand overseas operations
4 Expand group synergies on the strategic and operational fronts
Group Strategies
Our Well-Balanced Business Portfolio
Goals to be Achieved (targets for 2016, 140th anniversary )
Net sales
¥600 billion
(incl. liquor tax)
¥450 billion
(excl. liquor tax)
Operating income to net sales
ROEOperating income
9% (excl. liquor tax)
¥40 billion
Basic approach for enhancing competitiveness through aggressive management based on long-term goals
Businesses that generate stable profits as the Group’s core business segments
Businesses positioned as future growth drivers
Stable Earnings Base Growth Drivers
Food value creation
Creating comfortable
surroundings
(before goodwill amortization) (before goodwill amortization) (before goodwill amortization)
8%or higher
02

2014 53%
9%
27%
5%5%1%
(Plan)2012 55%
7%
26%
5%5%2%
¥492.5 billion
Target ¥533.0 billion
Our Business
Business Segments
Net Sales Breakdown(¥ Billion)
As the Group’s mainstay business, it is expanding into such areas as wine, shochu and low- and non-alcoholic beverages focusing on core products such as Sapporo Draft Beer Black Label in the standard beer market, the Yebisu Beer brand in the premium beer market, and its leading Mugi to Hop brand in the new genres market.
Japanese Alcoholic Beverages
The Group is expanding the Sapporo brand, especially in the beer business in North America, where growth remains steady, and in Southeast Asia and Oceania, where business operations are in full swing. The Group is also expanding its beverage business in North America where it recently entered the market.
International
The Food & Soft Drinks business started anew as POKKA SAPPORO FOOD & BEVERAGE LTD. and is rolling out diverse brands such as lemon-based products and soups in its food business, and Ribbon, POKKA Coffee, and Aromax in its Soft Drinks business. The Soft Drinks business is leveraging POKKA brand in Singapore and strengthening its business presence in neighboring countries.
Food & Soft Drinks
Through Sapporo Lion Limited, with its more than a century of history as a restaurant industry pioneer, we launched Sapporo Lion Beer-Hall in Ginza and the YEBISU BAR chain, providing value by combining food with comfortable surroundings. In 2013, we began local market research to expand our beer halls internationally with Singapore as our base.
Restaurants
The Real Estate business mainly develops rental real estate, including Yebisu Garden Place, Sapporo Factory, and office buildings principally located in three areas where it has deep Group links: Ebisu, Ginza, and Sapporo, with the aim of raising the value of its existing properties.
Real Estate
■ Japanese Alcoholic Beverages
¥269.9 ¥283.5
■ International
¥36.1 ¥46.4
■ Food & Soft Drinks
¥129.0 ¥145.5
■ Restaurants
¥26.6 ¥28.2
■ Real Estate
¥23.2 ¥22.4
■ Other
¥7.6 ¥7.0Note: From fiscal 2013, Sapporo Logistics Systems Co., Ltd., which had been categorized as a Japanese Alcoholic
Beverages business, and POKKA Logistics Co., Ltd., which had been categorized as a Food & Soft Drinks business, have been shifted to “Other Business.” Also, POKKA FOOD (SINGAPORE) PTE. LTD., which had been in the Food & Soft Drinks business, has been categorized as a Restaurants business. Along with these changes, the above 2012 results show the amounts after retrospective application of these changes.
03SAPPORO HOLDINGS LIMITED Annual Report 2012

2016 Targets2012 Results
¥ 379.8 billion
¥ 450.0 billion
Net sales (excluding liquor tax)
¥ 18.3 billion
¥ 40.0 billion
Operating income (before goodwill amortization)
Key Indicators
¥ 600.0 billion
Net sales (including liquor tax)
¥ 492.5 billion
SAPPORO HOLDINGS LIMITED Annual Report 2012 04
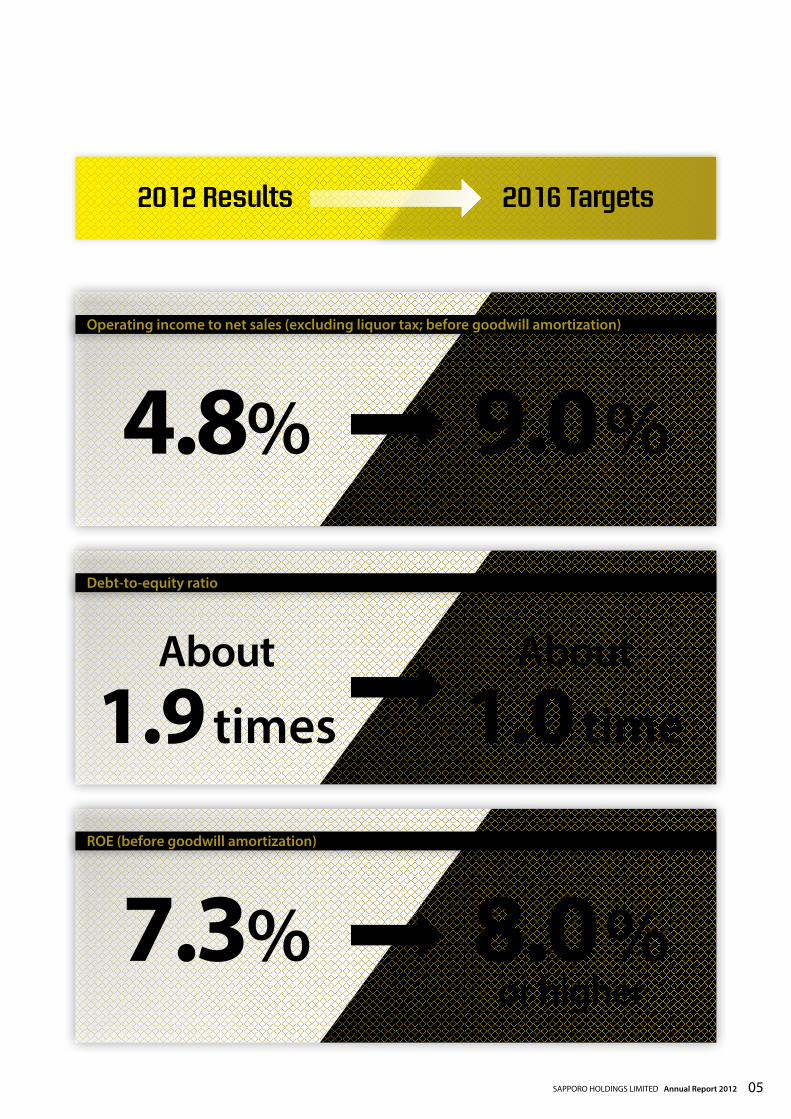
2016 Targets2012 Results
4.8% 9.0%
Operating income to net sales (excluding liquor tax; before goodwill amortization)
About
1.9 timesAbout
1.0 time
Debt-to-equity ratio
7.3% 8.0%or higher
ROE (before goodwill amortization)
SAPPORO HOLDINGS LIMITED Annual Report 2012 05

Millions of yen Thousands of U.S. dollars
Years ended December 31 2007 2008 2009 2010 2011 2012 2013 (plan) 2012For the Year:Net sales
Including tax ¥449,011 ¥414,558 ¥387,534 ¥389,245 ¥449,453 ¥492,491 ¥512,000 $5,688,273Excluding tax 309,794 284,412 264,604 269,874 336,838 379,793 397,300 4,386,609
Operating income 12,363 14,685 12,896 15,403 18,884 14,415 15,300 166,493Operating income before goodwill amortization 13,232 15,553 13,923 16,576 21,993 18,294 19,200 211,300EBITDA 37,759 37,158 36,470 39,080 46,477 44,100 43,600 509,351Net income 5,509 7,640 4,535 10,773 3,165 5,394 5,500 62,296Capital expenditures (cash basis) 19,884 27,342 21,910 19,801 13,423 53,870 21,000 622,199Depreciation and amortization 24,527 21,605 22,547 22,504 24,482 25,805 24,400 298,051Goodwill amortization 870 867 1,027 1,173 3,109 3,879 3,900 44,807Cash flows from operating activities 30,691 22,292 12,454 27,431 22,313 29,618 30,200 342,089Free cash flows 17,196 39,148 (19,773) 24,836 (28,579) (29,868) 6,200 (344,972)
At Year End:Net assets 125,189 116,862 118,591 126,645 124,775 134,947 — 1,558,636Total assets 561,859 527,287 506,875 494,798 550,784 597,636 — 6,902,706Financial liabilities 212,464 189,252 196,794 181,335 219,168 257,647 254,000 2,975,821
Other Indicators:Overseas sales ratio 9.0% 8.8% 8.5% 9.4% 11.0% 14.1% 14.7%Operating income to net sales
Excluding tax 4.0% 5.2% 4.9% 5.7% 5.6% 3.8% 3.9%Excluding tax; before goodwill amortization 4.3% 5.5% 5.3% 6.1% 6.5% 4.8% 4.8%
Debt-to-equity ratio (times) 1.7 1.6 1.7 1.4 1.8 1.9 1.8Equity ratio 22.3% 22.1% 23.4% 25.3% 22.4% 22.1% —ROE 4.6% 6.3% 3.9% 8.9% 2.5% 4.2% 4.1%ROE (before goodwill amortization) 5.3% 7.0% 4.7% 9.8% 5.1% 7.3% 7.1%Notes: 1. Because we have changed to an accounting method that excludes a portion of the sales incentives (which had been accounted for under selling, general and administrative expenses)
from net sales, the figures for fiscal 2011 and relevant key management indicators have been adjusted retroactively. 2. Yen amounts have been translated into U.S. dollar amounts at the rate of ¥86.58=U.S.$1.00, the exchange rate prevailing on December 31, 2012.
(¥ Million)
201220112010200920080
100,000
200,000
300,000
400,000
500,000
414,558387,534 389,245
449,453492,491
201220112010200920080
100,000
200,000
300,000
400,000
500,000(¥ Million)
284,412264,604 269,874
336,838379,793
Net sales (including tax) Net sales (excluding tax)
Creating New Value at Sapporo
Financial HighlightsSAPPORO HOLDINGS LIMITED and consolidated subsidiaries
06
Millions of yen Thousands of U.S. dollars
Years ended December 31 2007 2008 2009 2010 2011 2012 2013 (plan) 2012For the Year:Net sales
Including tax ¥449,011 ¥414,558 ¥387,534 ¥389,245 ¥449,453 ¥492,491 ¥512,000 $5,688,273Excluding tax 309,794 284,412 264,604 269,874 336,838 379,793 397,300 4,386,609
Operating income 12,363 14,685 12,896 15,403 18,884 14,415 15,300 166,493Operating income before goodwill amortization 13,232 15,553 13,923 16,576 21,993 18,294 19,200 211,300EBITDA 37,759 37,158 36,470 39,080 46,477 44,100 43,600 509,351Net income 5,509 7,640 4,535 10,773 3,165 5,394 5,500 62,296Capital expenditures (cash basis) 19,884 27,342 21,910 19,801 13,423 53,870 21,000 622,199Depreciation and amortization 24,527 21,605 22,547 22,504 24,482 25,805 24,400 298,051Goodwill amortization 870 867 1,027 1,173 3,109 3,879 3,900 44,807Cash flows from operating activities 30,691 22,292 12,454 27,431 22,313 29,618 30,200 342,089Free cash flows 17,196 39,148 (19,773) 24,836 (28,579) (29,868) 6,200 (344,972)
At Year End:Net assets 125,189 116,862 118,591 126,645 124,775 134,947 — 1,558,636Total assets 561,859 527,287 506,875 494,798 550,784 597,636 — 6,902,706Financial liabilities 212,464 189,252 196,794 181,335 219,168 257,647 254,000 2,975,821
Other Indicators:Overseas sales ratio 9.0% 8.8% 8.5% 9.4% 11.0% 14.1% 14.7%Operating income to net sales
Excluding tax 4.0% 5.2% 4.9% 5.7% 5.6% 3.8% 3.9%Excluding tax; before goodwill amortization 4.3% 5.5% 5.3% 6.1% 6.5% 4.8% 4.8%
Debt-to-equity ratio (times) 1.7 1.6 1.7 1.4 1.8 1.9 1.8Equity ratio 22.3% 22.1% 23.4% 25.3% 22.4% 22.1% —ROE 4.6% 6.3% 3.9% 8.9% 2.5% 4.2% 4.1%ROE (before goodwill amortization) 5.3% 7.0% 4.7% 9.8% 5.1% 7.3% 7.1%Notes: 1. Because we have changed to an accounting method that excludes a portion of the sales incentives (which had been accounted for under selling, general and administrative expenses)
from net sales, the figures for fiscal 2011 and relevant key management indicators have been adjusted retroactively. 2. Yen amounts have been translated into U.S. dollar amounts at the rate of ¥86.58=U.S.$1.00, the exchange rate prevailing on December 31, 2012.
20122011201020092008Operating income to net sales (excluding tax)Operating income
(%)
0
5,000
10,000
15,000
25,000
20,000
(¥ Million)
0
2
4
6
10
8
15,55313,923
16,576
21,993
18,294
20122011201020092008ROENet income
(%)
0
3,000
6,000
9,000
12,000
0
3
6
9
12(¥ Million)
7,640
4,535
10,773
3,165
5,394
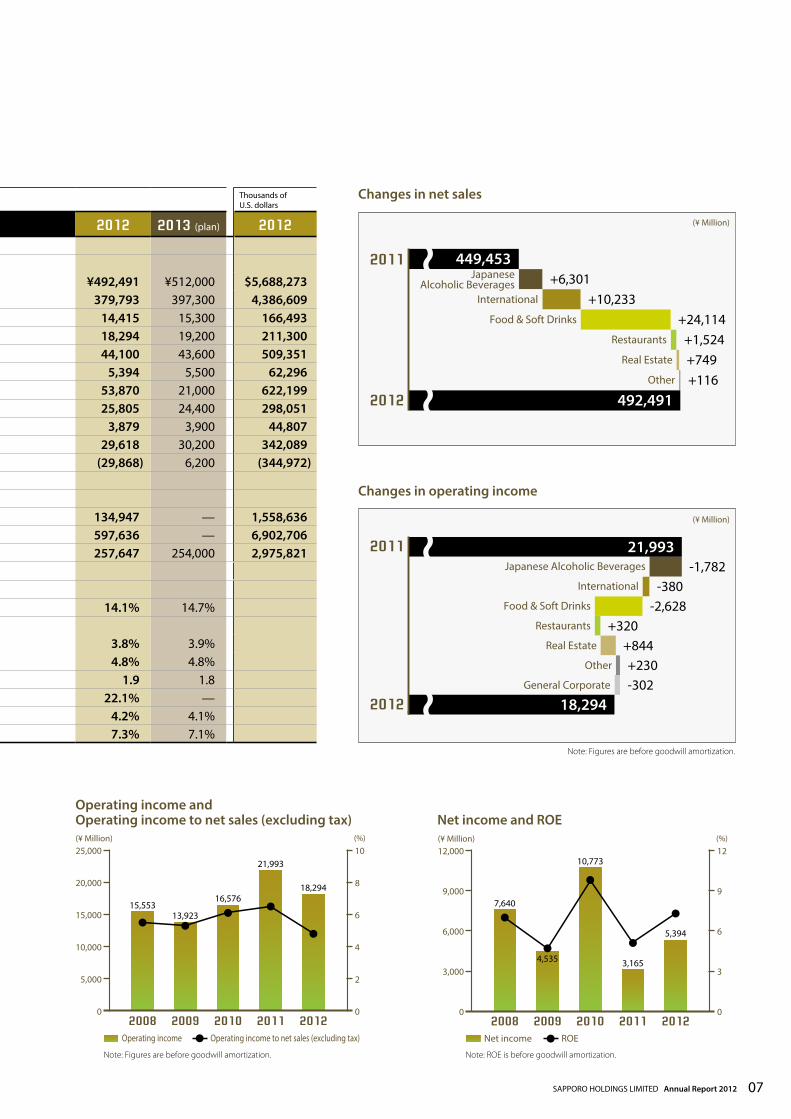
Operating income and Operating income to net sales (excluding tax) Net income and ROE
Changes in operating income
21,993-1,782
-380-2,628
+320+844+230-302
18,2942012
Other
General Corporate
Real Estate
Restaurants
Food & Soft Drinks
International
Japanese Alcoholic Beverages
2011
(¥ Million)
Changes in net sales
449,453+6,301
+10,233+24,114
+1,524+749+116
492,491
(¥ Million)
2012
Other
Real Estate
Restaurants
Food & Soft Drinks
International
JapaneseAlcoholic Beverages
2011
Note: Figures are before goodwill amortization. Note: ROE is before goodwill amortization.
Note: Figures are before goodwill amortization.
SAPPORO HOLDINGS LIMITED Annual Report 2012 07
From January 2013, the Sapporo Group underwent a transition with major changes
made to its Group structure including the start up of POKKA SAPPORO FOOD &
BEVERAGE LTD., a new company that integrates its Food & Soft Drinks business. With
four years remaining until 2016, the final year of our New Management Framework,
we have positioned the two years covering 2013 and 2014 as an important period
for establishing a foundation for achieving our target. With an eye on achieving our
targets ahead of schedule, we have started to further raise corporate value as the
new Sapporo Group.
To Our Stakeholders
President Tsutomu Kamijo Talks about StrategyIn fiscal 2013, the Sapporo Group began implementing the new Sapporo Group Medium-term Management Plan 2013–2014, which targets the achievement of the Group’s New Management Framework by 2016, the framework’s final fiscal year. The Sapporo Group’s performance in 2012 and the vision and goals of the new plan are explained below.
08
Business Climate in 2012 During 2012, the Japanese economy staged a modest recovery thanks to a rebound in consumer spending in line with Great East Japan Earthquake recovery efforts. Nevertheless, adverse conditions continued, including the yen remaining strong until the end of the year, and the global economic slowdown, mainly in Europe. The soft drinks industry saw sales gains for some new products and existing brands as favorable weather conditions, including a hot summer and warm temperatures lingering into early autumn, helped boost demand. However, the alcoholic beverages and restaurant industries, which were directly affected by the earthquake disaster in fiscal 2011, did not see demand rebound as much as expected, as consumer spending was slow to recover. In the real estate industry, high vacancy rates in the Greater Tokyo office leasing market caused by a recent increase in new office supply are gradually improving. Rent levels, however, remained weak.
Performance in 2012 In 2012, the Sapporo Group posted consolidated net sales of ¥492.5 billion, up 9.6% from 2011. The Japanese Alcoholic Beverages and Restaurants businesses both achieved higher sales than in 2011, when they were directly affected by the earthquake disaster. The International Business segment also achieved higher sales, aided by the consolidation of Silver Springs Citrus, Inc. from April 2012. Sales in the Food & Soft Drinks business were up sharply, thanks in part to the full-year’s contribution from the POKKA Group, which was consolidated in April 2011. Consolidated operating income totaled ¥14.4 billion, down 23.7% from 2011. The Restaurants business achieved profit growth on increased sales, while Real Estate business profits were higher thanks to the inclusion of revenues and earnings from Yebisu Garden Place in the Group’s consolidated income statement from March, following the acquisition of 15% of the trust beneficiary rights in Yebisu Garden Place from their former joint holders. Gains in these segments, however, were outweighed by lower profits or losses in other segments as the result of various profit-reducing factors, including an aggressive year-on-year increase in marketing expenses by both the Japanese Alcoholic Beverage business and the Food & Soft Drinks business, higher goodwill amortization in the Food & Soft Drinks business, a first quarter operating loss at the POKKA Group, and expenditures by the International Business segment to open new markets in Vietnam. Consolidated net income increased 70.4% to ¥5.4 billion, largely reflecting lower extraordinary losses than in 2011, when such losses were inflated by the application of accounting standards for asset retirement obligations and disaster-related losses.
Fiscal 2012 Overview
SAPPORO HOLDINGS LIMITED Annual Report 2012 09

Aiming for a Dynamic Growth Stage with Sapporo Group Management Plan 2013–2014
Management Plan Vision and GoalsWe have positioned the two years covering 2013 and 2014 as an important period for laying a foundation to achieve our goals. We will lay such a foundation for growth and produce results with our new Group management framework with the aim of achieving a new growth stage. The new plan sets the following numerical targets for fiscal 2014. Our consolidated net sales target is ¥533.0 billion, or ¥416.0 billion excluding the liquor tax. Moreover, we expect to achieve consolidated operating income of ¥17.8 billion (¥21.6 billion before goodwill write-off) and ROE of 5.1%. We view these two years as a period for laying a foundation for growth, including investments that will lead to major growth in the future.
Position of Sapporo Group Management Plan 2013–2014
Dynamic growth
III. Creating new opportunities for growth
I. Challenges toward growth in all businesses
II. Carrying out growth measures
Building foundation and generating results
140th anniversary of Group’s Founding Achievement of the New Management Framework’s Targets
Build foundation and generate results with the new group management structure
for dynamic growth
2013 2014 2015 2016
To Our Stakeholders
10
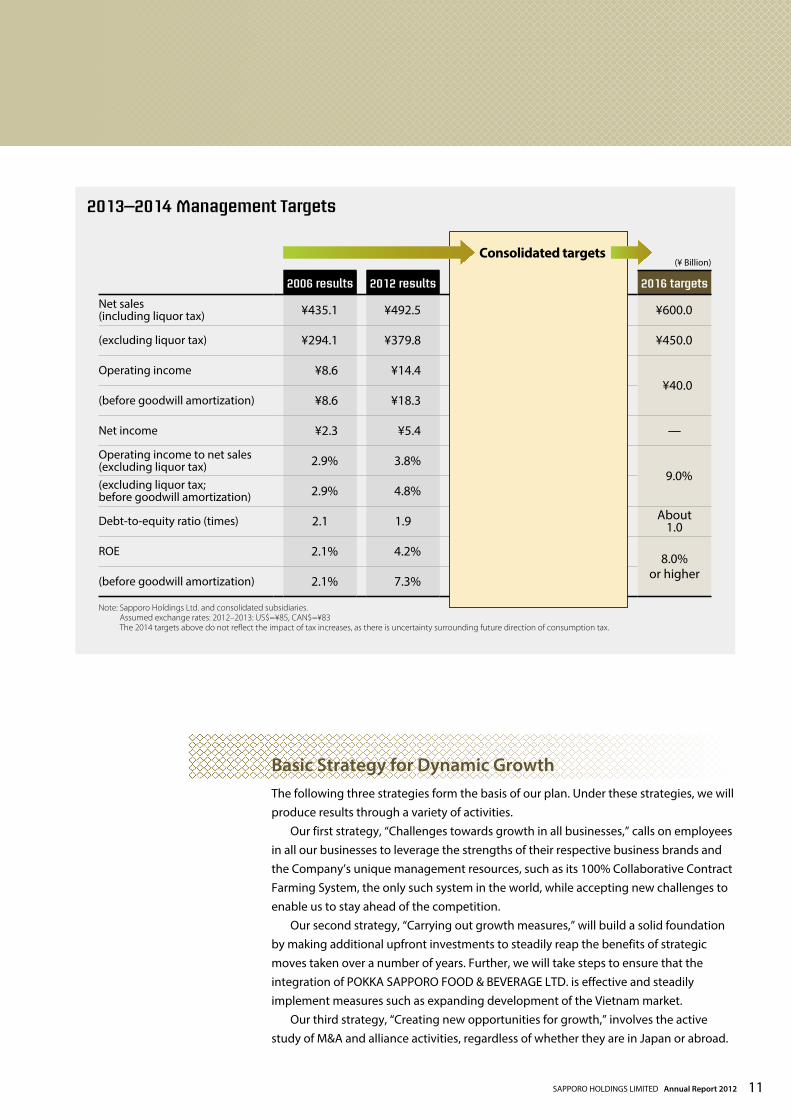
Basic Strategy for Dynamic Growth The following three strategies form the basis of our plan. Under these strategies, we will produce results through a variety of activities. Our first strategy, “Challenges towards growth in all businesses,” calls on employees in all our businesses to leverage the strengths of their respective business brands and the Company’s unique management resources, such as its 100% Collaborative Contract Farming System, the only such system in the world, while accepting new challenges to enable us to stay ahead of the competition. Our second strategy, “Carrying out growth measures,” will build a solid foundation by making additional upfront investments to steadily reap the benefits of strategic moves taken over a number of years. Further, we will take steps to ensure that the integration of POKKA SAPPORO FOOD & BEVERAGE LTD. is effective and steadily implement measures such as expanding development of the Vietnam market. Our third strategy, “Creating new opportunities for growth,” involves the active study of M&A and alliance activities, regardless of whether they are in Japan or abroad.
Note: Sapporo Holdings Ltd. and consolidated subsidiaries. Assumed exchange rates: 2012–2013: US$=¥85, CAN$=¥83 The 2014 targets above do not reflect the impact of tax increases, as there is uncertainty surrounding future direction of consumption tax.
2013–2014 Management Targets
2006 results 2012 results 2013 plan 2014 plan 2016 targets
Net sales (including liquor tax) ¥435.1 ¥492.5 ¥512.0 ¥533.0 ¥600.0
(excluding liquor tax) ¥294.1 ¥379.8 ¥397.3 ¥416.0 ¥450.0
Operating income ¥8.6 ¥14.4 ¥15.3 ¥17.8¥40.0
(before goodwill amortization) ¥8.6 ¥18.3 ¥19.2 ¥21.6
Net income ¥2.3 ¥5.4 ¥5.5 ¥7.0 —
Operating income to net sales (excluding liquor tax) 2.9% 3.8% 3.9% 4.3%
9.0%(excluding liquor tax; before goodwill amortization) 2.9% 4.8% 4.8% 5.2%
Debt-to-equity ratio (times) 2.1 1.9 1.8 1.7 About 1.0
ROE 2.1% 4.2% 4.1% 5.1% 8.0% or higher(before goodwill amortization) 2.1% 7.3% 7.1% 8.0%
Consolidated targets(¥ Billion)
SAPPORO HOLDINGS LIMITED Annual Report 2012 11

Basic Approach to Strategic InvestmentsWe will continue to make aggressive long-term strategic investments with the goal of sustaining the growth of the Sapporo Group. During the five years from 2012 to 2016, we plan to strategically invest between ¥150 billion and ¥200 billion, but basically our plan is to make these investments within the limits of our operating cash flows. In fiscal 2013, our investment target is approximately ¥28.0 billion and expected projects at this time include enhancement of the asset value of the Yebisu Garden Place complex and planned investment in the redevelopment of the Seiwa Yebisu Building. We are also planning to invest in facilities to further streamline the Japanese Alcoholic Beverages and Food & Soft Drinks businesses and open new restaurants in Japan and abroad.
Groupwide StrategyTo achieve even greater growth, it is essential that we promote further Group management efficiency. With the size of our Group expanding due to the integration of the POKKA Group, now is our chance to achieve it. Therefore, we will consolidate common operations within the Group in Sapporo Group Management (SGM) Ltd., a functional support company, while strengthening our ability to operate at low cost. We will actively work to strengthen the Group brand. We will make greater efforts across the Group, especially in priority areas that leverage the Group’s strength, to increase the popularity of the Sapporo Group among consumers. We will also continue to fortify Group human resource development. We will concentrate on human resource development with the goal of improving our ability to execute our growth strategy and respond to change, as well as on developing human resources who will be in charge of international strategy.
Overall Group Strategy
We will implement Group-wide initiatives for increasing the number of Sapporo Group fans primarily in the areas where we can leverage the Group’s strengths.
Initiatives for enhancing Group brand2) Further promotion of efficiency in Group Management
As the size of the Group expands, we will further concentrate common operations on SGM, a functional support company.1)
We will develop human resources so as to strengthen abilities to implement growth strategy and respond to changes.
Strengthening development of Group human resources3) Operations
started inJanuary 2013
Sapporo Group Management Ltd.Functional company
Operating companies
Holding company/Group headquarters Sapporo Holdings Ltd.
To Our Stakeholders
Sapporo Breweries Ltd.
Sapporo International Inc.
POKKA SAPPORO FOOD & BEVERAGE LTD.
Sapporo Real Estate Co., Ltd.
Sapporo Lion Limited
12

Businesses that Generate Stable Profits and Businesses that Drive GrowthAt the Sapporo Group, the Japanese Alcoholic Beverages and Real Estate businesses are viewed as businesses that generate stable profits, while the International and Food & Soft Drinks businesses are viewed as growth drivers. In this section, we will outline our strategy for each business segment. For details on strategies for each business segment, please see the Performance Review and Plan starting on page 20 of this report. In the Japanese Alcoholic Beverages business, we will pursue two major strategies. Focusing on the strategies of “Growth in the beer-taste market” and “Growth as a comprehensive alcoholic beverage enterprise,” we will take steps to further raise profitability and increase our corporate brand value, which is a reflection of Sapporo’s market presence. In the Real Estate business, we will raise Sapporo’s brand value and build stronger Group synergies while enhancing the asset value of our prime properties including Yebisu Garden Place. In the International Business, the Sapporo Group will further accelerate expansion in the North American market leveraging the strengths of its premium brand with the aim of increasing sales through business expansion in growth markets, particularly in Asia. In the Food & Soft Drinks business, we seek to establish POKKA SAPPORO FOOD & BEVERAGE LTD. as the third business pillar of the Sapporo Group and contribute to the Group’s overall growth by increasing synergistic effects within the Group.
Outlook for Fiscal 2013 With the goal of increasing net sales, operating income, and net income on a consolidated basis, fiscal 2013 has been positioned as a time to prepare for dynamic growth. In the Japanese Alcoholic Beverages business, 2013 is viewed as the year for strengthening the Sapporo brand. The greatest emphasis will be placed on fortifying its beer brands, and, in addition to its strategy specially designed to expand existing brands, it will aggressively increase sales of shochu (Japanese distilled spirits) and wine and western spirits. At the same time, it will restructure its non-alcoholic beer and ready-to-drink (RTD) beverage lineups. The International Business will work to gain wider brand recognition for the SLEEMAN and Sapporo brands in the North American market while expanding sales in Southeast Asia, especially in Vietnam. We also plan to expand soft drink sales in the North American market by leveraging new Group member Silver Springs Citrus, Inc., which became a consolidated subsidiary in 2012. In the Food & Soft Drinks business, we will strengthen and leverage existing brands in POKKA SAPPORO FOOD & BEVERAGE LTD. while developing distinctive new products to achieve steady growth. The Restaurants business will expand sales by strengthening its existing brands and opening new outlets, with a focus on the YEBISU BAR chain and the mid-size Ginza Lion brasserie format. In addition, the segment aims to seize the opportunity afforded
SAPPORO HOLDINGS LIMITED Annual Report 2012 13
by the inclusion of POKKA FOOD (SINGAPORE) PTE. LTD. to pursue an overseas growth strategy centered on expansion of our chain of beer halls. The Real Estate business will continue efforts to maintain and raise occupancy rates while targeting appropriate rent levels. The business targets new growth by enhancing the asset value of its core Yebisu Garden Place Property and through the redevelopment of its Seiwa Yebisu Building. As a result, in fiscal 2013, we expect consolidated net sales of ¥512.0 billion, an increase of 4.0% over the previous fiscal year.
As for operating income, the Japanese Alcoholic Beverages business plans to increase profits by boosting sales and continuing cost control measures. Although the International Business segment expects increased profits in North America, we expect segment operating income to remain basically unchanged in 2013 as a result of investing to build markets and brand recognition in Vietnam. In the Food & Soft Drinks business also, we plan to increase profits by boosting sales. Gains in both sales and profits are expected in the Restaurant business, as it plans to continue efforts to strengthen the profitability of its operations, while operating income is expected to decline in 2013 in the Real Estate business as redevelopment of its Seiwa Yebisu Building cuts into leasing revenues. As a result, we forecast 2013 consolidated operating income of ¥15.3 billion (up 6.1% year on year).
Shareholder Returns Providing fair returns to shareholders is a key management policy of the Sapporo Group. Our basic policy is to pay stable dividends to the extent permitted by our operating performance and financial condition. In line with this policy, we plan to pay an annual dividend of ¥7 per share for 2012, the same dividend paid in 2011. In 2013, we plan to maintain the annual dividend at ¥7 per share, as we steadily carry out our management plan while also making strategic investments and strengthening our financial foundation.
Tsutomu KamijoPresident, Representative Director and Group CEO
To Our Stakeholders
14

Maximizing Value
Overseas Markets as Growth DriverRaising the presence of the Sapporo brand in Asia and North America and leading the Group to a dynamic growth stage.
Special Feature
SAPPORO HOLDINGS LIMITED Annual Report 2012 15
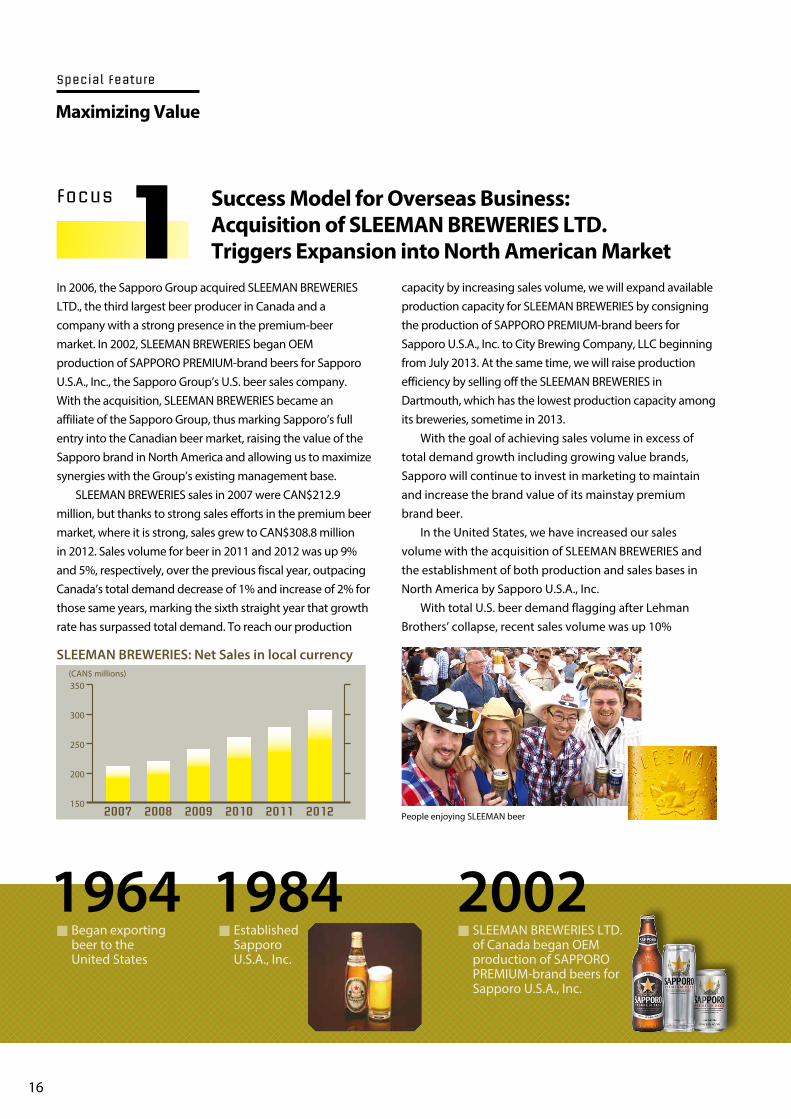
In 2006, the Sapporo Group acquired SLEEMAN BREWERIES LTD., the third largest beer producer in Canada and a company with a strong presence in the premium-beer market. In 2002, SLEEMAN BREWERIES began OEM production of SAPPORO PREMIUM-brand beers for Sapporo U.S.A., Inc., the Sapporo Group’s U.S. beer sales company. With the acquisition, SLEEMAN BREWERIES became an affiliate of the Sapporo Group, thus marking Sapporo’s full entry into the Canadian beer market, raising the value of the Sapporo brand in North America and allowing us to maximize synergies with the Group’s existing management base. SLEEMAN BREWERIES sales in 2007 were CAN$212.9 million, but thanks to strong sales efforts in the premium beer market, where it is strong, sales grew to CAN$308.8 million in 2012. Sales volume for beer in 2011 and 2012 was up 9% and 5%, respectively, over the previous fiscal year, outpacing Canada’s total demand decrease of 1% and increase of 2% for those same years, marking the sixth straight year that growth rate has surpassed total demand. To reach our production
capacity by increasing sales volume, we will expand available production capacity for SLEEMAN BREWERIES by consigning the production of SAPPORO PREMIUM-brand beers for Sapporo U.S.A., Inc. to City Brewing Company, LLC beginning from July 2013. At the same time, we will raise production efficiency by selling off the SLEEMAN BREWERIES in Dartmouth, which has the lowest production capacity among its breweries, sometime in 2013. With the goal of achieving sales volume in excess of total demand growth including growing value brands, Sapporo will continue to invest in marketing to maintain and increase the brand value of its mainstay premium brand beer. In the United States, we have increased our sales volume with the acquisition of SLEEMAN BREWERIES and the establishment of both production and sales bases in North America by Sapporo U.S.A., Inc. With total U.S. beer demand flagging after Lehman Brothers’ collapse, recent sales volume was up 10%
Success Model for Overseas Business: Acquisition of SLEEMAN BREWERIES LTD. Triggers Expansion into North American Market
Maximizing Value
Special Feature
SLEEMAN BREWERIES: Net Sales in local currency
201220112010200920082007
(CAN$ millions)
150
200
250
300
350
1Focus
People enjoying SLEEMAN beer
■ Began exporting beer to the United States
1964 1984 2002■ Established
Sapporo U.S.A., Inc.
■ SLEEMAN BREWERIES LTD. of Canada began OEM production of SAPPORO PREMIUM-brand beers for Sapporo U.S.A., Inc.
16

over fiscal 2011 and up 1% over fiscal 2012. Both figures exceeded total imported beer demand growth in the U.S. The Sapporo brand is now the number one beer from Asia in the U.S. market. In addition, Sapporo is ranked 20th in sales in the U.S., a market with several hundred imported beers. In 2016, we plan to raise annual production volume of SAPPORO PREMIUM-brand beers to five million cases (1case=24 350ml cans) by consigning production to the
aforementioned City Brewing Company, LLC. We will not limit sales to the Japanese-American market segment in the U.S., but will aim for additional growth through a stronger marketing strategy that focuses on the general population and the Asian-American market.
To enhance the marketing of SAPPORO PREMIUM-brand beers in South Korea, in January 2012, the Sapporo Group acquired 15% of the shares of M’s Beverage Co., Ltd., a wholly owned alcoholic beverage sales subsidiary of Maeil Dairies Co., Ltd., a major South Korean dairy products manufacturer. In 2010, Sapporo had already formed a business alliance with Maeil Dairies, which established M’s Beverage for the sales of SAPPORO PREMIUM-brand beers, hired new employees, and marketed to convenience stores, supermarkets, restaurants, and other outlets. Amid a downtrend in total beer demand, the South Korean market for imported beer is growing substantially, and Japanese-brand beer, in particular, has been highly acclaimed as premium beer. The Sapporo Group is raising its brand value and strengthening its product sales system in South Korea in order to fully develop its business there. In 2012, we sold 420,000 cases of beer against a sales target of 380,000 cases (1case=24 355ml cans). For 2015, we have set a sales target of 1,500,000 cases with the goal of becoming the
number one imported beer brand in South Korea. The Sapporo Group has developed a strategy aimed at making Japanese brand beer number one in Oceania, too. In July 2011, it entered into a licensing agreement with Australian beer maker Coopers Brewery Ltd. and fully expanded its beer business there. Coopers Brewery is Australia’s third largest beer maker and excels in premium-brand beer. Australia’s domestic beer market is on an upswing thanks to population growth and a robust economy, and the premium beer category is growing substantially as a percentage of total beer sales. Forming a partnership with Coopers Brewery will bolster our sales system in Australia’s premium beer market, making it a pillar of International Business after North America and Asia. We will also develop business with the goal of establishing the Sapporo brand in the Asia-Pacific basin by expanding the Sapporo brand from North America and Asia into Oceania.
Aiming to be the Number One Imported Beer Brand in South Korea and Japanese Beer Brand in Oceania.2Focus
Advertising of Sapporo U.S.A., Inc.
2007■ Announced the Sapporo
Group’s New Management Framework Aimed to expand business in overseas markets for alcoholic beverages as well as food and soft drinks
■ Acquired SLEEMAN BREWERIES LTD. of Canada
■ Established Sapporo International Inc.
2006
SAPPORO HOLDINGS LIMITED Annual Report 2012 17

Sapporo Vietnam Limited, established with the goal of expanding the beer business in Vietnam, completed construction of the Long An Brewery in November 2011. This is the first brewery built by a Japanese brewer in Vietnam. The new brewery began producing SAPPORO PREMIUM-brand beers, an internationally strategic product and began marketing it, mainly in Ho Chi Minh City. Full-scale market entry began in February 2012. From April 2012, we initiated a full-fledged marketing campaign locally using billboards, TV commercials, and other media, and have taken steps to popularize beer drinking, such as by offering draft beer from kegs. The growth in sales volume in Vietnam is progressing satisfactorily. In the commercial market, especially Ho Chi Minh City, we deliver beer to around 1,500 restaurants, and in the distribution
market to approximately 2,000 shops, including convenience stores and major supermarkets.
Outdoor advertising in Vietnam
Building a Stronger Alcoholic Beverages Business in Southeast Asia with Long An Brewery as a Key Base
In the International Business, we will expand in the Asia-Pacific basin, mainly in North America, Asia, and Oceania under a Premium-brand beer strategy focusing on SAPPORO PREMIUM-brand beers in the premium-price range. With the completion of the Long An Brewery, Sapporo Group has now established breweries in three locations worldwide, adding Southeast Asia to Japan and North America. By establishing our own breweries in these regions, we will build a stronger marketing base and
vigorously expand business in North America, where the Sapporo Group is strong, and in Asia. In Southeast Asia, Vietnam is viewed as a bridgehead for expanding sales of SAPPORO PREMIUM-brand beers. The Sapporo Group plans to use its convenient location to maximum advantage to make inroads into surrounding countries in Asia and has already expanded its brand in eight of the 10 ASEAN countries. After this expansion, we aim ramp up production capacity at the Long An Brewery
Focus
From Full-Scale Entry into Vietnam to Expansion into Neighboring Regions
■ Made POKKA CORPORATION a wholly owned subsidiary
■ Concluded licensing agreement with Australian beer maker Coopers Brewery Ltd.
■ Completed construction of Sapporo Vietnam Limited Long An Brewery
3Focus
■ Formed business alliance with Maeil Dairies Co., Ltd., a major South Korean dairy products manufacturer
■ Concluded capital and business alliance with POKKA CORPORATION
■ Decided to enter beer production and sales business in Vietnam
Maximizing Value
Special Feature
20112009 2010
18
Expanding the Sapporo Brand
throughout the World
■ Commenced operation of POKKA SAPPORO FOOD & BEVERAGE LTD.
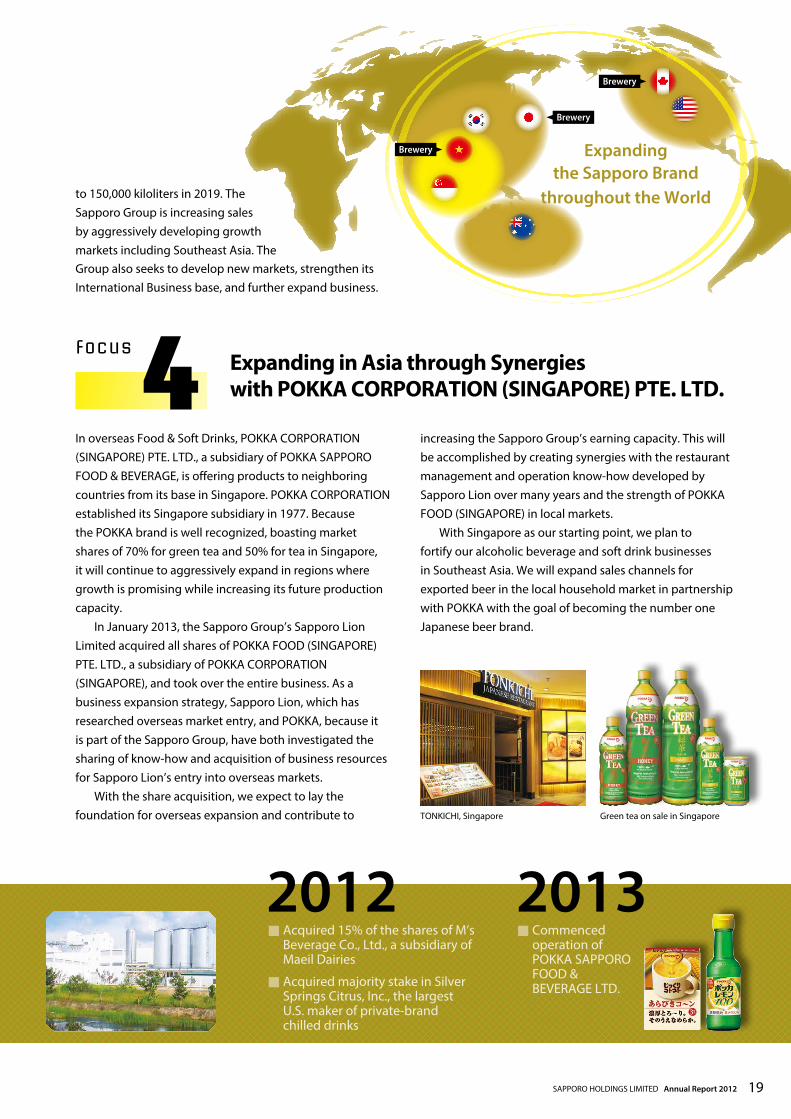
Green tea on sale in SingaporeTONKICHI, Singapore
Expanding in Asia through Synergies with POKKA CORPORATION (SINGAPORE) PTE. LTD.
increasing the Sapporo Group’s earning capacity. This will be accomplished by creating synergies with the restaurant management and operation know-how developed by Sapporo Lion over many years and the strength of POKKA FOOD (SINGAPORE) in local markets. With Singapore as our starting point, we plan to fortify our alcoholic beverage and soft drink businesses in Southeast Asia. We will expand sales channels for exported beer in the local household market in partnership with POKKA with the goal of becoming the number one Japanese beer brand.
In overseas Food & Soft Drinks, POKKA CORPORATION (SINGAPORE) PTE. LTD., a subsidiary of POKKA SAPPORO FOOD & BEVERAGE, is offering products to neighboring countries from its base in Singapore. POKKA CORPORATION established its Singapore subsidiary in 1977. Because the POKKA brand is well recognized, boasting market shares of 70% for green tea and 50% for tea in Singapore, it will continue to aggressively expand in regions where growth is promising while increasing its future production capacity. In January 2013, the Sapporo Group’s Sapporo Lion Limited acquired all shares of POKKA FOOD (SINGAPORE) PTE. LTD., a subsidiary of POKKA CORPORATION (SINGAPORE), and took over the entire business. As a business expansion strategy, Sapporo Lion, which has researched overseas market entry, and POKKA, because it is part of the Sapporo Group, have both investigated the sharing of know-how and acquisition of business resources for Sapporo Lion’s entry into overseas markets. With the share acquisition, we expect to lay the foundation for overseas expansion and contribute to
■ Acquired 15% of the shares of M’s Beverage Co., Ltd., a subsidiary of Maeil Dairies
■ Acquired majority stake in Silver Springs Citrus, Inc., the largest U.S. maker of private-brand chilled drinks
4Focus
to 150,000 kiloliters in 2019. The Sapporo Group is increasing sales by aggressively developing growth markets including Southeast Asia. The Group also seeks to develop new markets, strengthen its International Business base, and further expand business.
Brewery
Brewery
2012 2013
Brewery
SAPPORO HOLDINGS LIMITED Annual Report 2012 19

Performance Review and Plan
Japanese Alcoholic Beverages
Looking at the Japanese beer market in 2012, total domestic demand for beer and beer-type beverages is estimated to have declined by 1% year on year. During the period under review, beer and happo-shu (low malt beer) sales volumes slightly decreased. At the same time, growth rates for new-genre beer products slowed, despite a continued upswing in demand compared with the previous year. Against this backdrop, the Sapporo Group reported an increase in net sales for the first time in eight years. This was largely attributable to the year-on-year increase in total beer, happo-shu, and new-genre beer product sales volumes as well as higher sales of non-alcoholic beverages, ready-to-drink (RTD) beverages, wines, western spirits, and shochu (Japanese distilled spirits). As a result, net sales in the Japanese Alcoholic Beverages business climbed by ¥6.3 billion, or 2.3% compared with the previous year, to ¥274.5 billion. From a profit perspective, however, operating income declined by ¥1.8 billion, or 19.2% year on year, to ¥7.5 billion owing mainly to aggressive spending on marketing.
Sales in the shochu business grew significantly surging 34.0% year on year. This was largely attributable to the favorable reception for two new blended shochus: Imo Shochu Kokuimo, a blended shochu introduced in March 2012, and Mugi Shochu Koimugi, a barley-based shochu launched in September 2012.
In the wine business, demand for our everyday imported and domestic wines grew. At the same time, sales of our premium domestic wine, Grande Polaire, were also firm. Based on these factors, wine business sales improved 5.4% year on year. Turning to our spirits business, Bacardi products contributed to sales growth.
After launching a renewed version of Sapporo Premium Alcohol Free in February 2012, we unveiled the world’s first completely non-alcoholic black canned beer, Sapporo Premium Alcohol Free Black, in May 2012. These new products helped to boost total sales volumes by 7.3% year on year. In RTD beverages, our tie up with BACARDI JAPAN LIMITED led to the April 2012 launch of the jointly developed Bacardi Mojito, triggering a mojito boom. Earlier in March 2012, we released a renewed version of Sapporo Nectar Sour Peach Sparkling. Complementing this initiative, we continued to put forward limited-volume RTD beverage proposals with seasonal flavors as a part of efforts to bring new products to market that satisfy our customers’ demand for beverages that match a wide range of occasions. As a result, sales volumes increased substantially in 2012 compared with the previous year.
In beer and beer-type beverages, we launched a renewed version of the new-genre beer Mugi to Hop in January 2012. This was followed in March 2012 by the release of Mugi to Hop Black. Both products were received enthusiastically by the market. In July 2012, we introduced Hokkaido Premium, made from Hokkaido malt and Furano hops. This addition enhanced our lineup of new-genre beer products, providing customers with a refreshingly flavored beverage in contrast to the more robust flavored Mugi to Hop. Accounting for the aforementioned and other factors, sales volumes of beer and beer-type beverages edged up by 0.9% compared with the previous period, surpassing overall demand. Buoyed by improved results, we successfully increased our market share.
Non-Alcoholic Beer and RTD Beverages
Shochu Business
Beer Business
Fiscal 2012 Overview
Wine and Spirits Business
Net sales
20122011201020092008
(¥ Million)
200,000
220,000
240,000
260,000
280,000
300,000299,699
282,914 279,329268,189
274,491
Operating income to net salesOperating income
(¥ Million) (%)
201220112010200920080
1
2
3
4
5
0
2,000
4,000
6,000
8,000
10,000
7,709 7,483
9,290 9,305
7,522
Operating income and Operating income to net sales
Note: Figures are before goodwill amortization.
20
■ SAPPORO BREWERIES LIMITED■ SAPPORO WINES LIMITED■ YEBISU WINEMART CO., LTD.■ TANOSHIMARU SHUZO CO., LTD.
■ SAPPORO ENGINEERING LIMITED■ STARNET CO., LTD.■ NEW SANKO INC.
The Japanese Alcoholic Beverages business is the core business of the Sapporo Group. In this segment, we will pursue two major initiatives focusing on “growth in the beer-taste market” and “growth as a comprehensive alcoholic beverage enterprise.” At the same time, we will establish a market presence that befits the Sapporo Group while further enhance profitability as well as our corporate and brand values.
for the Japanese Alcoholic Beverages BusinessGrowth Strategy
Further growth in the beer-taste marketIn the beer business, we will work diligently to bolster the image of our three core brands. In specific terms, this will entail channeling management resources toward Yebisu Beer, which maintains a robust position in the premium beer market, Sapporo Draft Beer Black Label, a standard beer which accounts for the Company’s largest sales volume, and Mugi to Hop, a leading new-genre beer product brand. In the non-alcoholic beer category, we will also focus on boosting our brand image. To this end, we have released new product versions under the Sapporo Premium Alcohol Free brand in February 2013. In a bid to revitalize the beer market, we will leverage our position as a company that creates a beer culture to hold the Japan Beer Certificate Examination. We will also host the
Hyaku-nin Beer Lab and Hokkaido Likers with the aim of promoting direct communication with customers via Facebook. Endeavoring to bring the dreams of our customers to fruition, we will strive to reinforce the dissemination of information by engaging in such activities as WakuwakuBrewery that enable customers to customize their beer.
Growth as a comprehensive alcoholic beverage enterpriseThe Sapporo Group is committed to growth as a comprehensive alcoholic beverage enterprise. With this in mind, we will continue to foster our activities in wines, western spirits, shochu, umeshu, and RTD beverages as successive pillars of profit behind our beer products.
Management Plan 2013–2014
(¥ Billion)
Quantitative targets
2012results
2013targets
2014targets
Net sales 269.9 275.2 283.5
Operating income 7.5 9.0 9.0Operating income before goodwill amortization 7.5 9.0 —* Sapporo Logistics Systems Co., Ltd. will be moved to Other from fiscal 2013 onward.
The figures for fiscal 2012 are reflected in the table above.
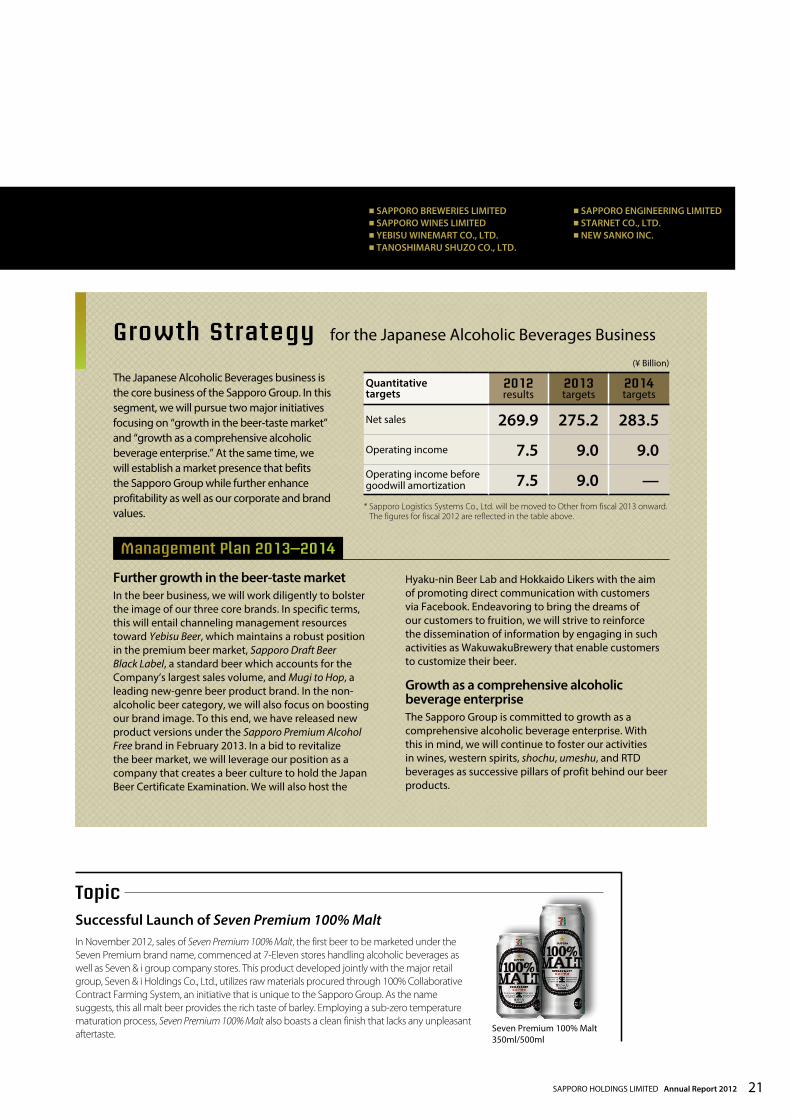
Topic
In November 2012, sales of Seven Premium 100% Malt, the first beer to be marketed under the Seven Premium brand name, commenced at 7-Eleven stores handling alcoholic beverages as well as Seven & i group company stores. This product developed jointly with the major retail group, Seven & i Holdings Co., Ltd., utilizes raw materials procured through 100% Collaborative Contract Farming System, an initiative that is unique to the Sapporo Group. As the name suggests, this all malt beer provides the rich taste of barley. Employing a sub-zero temperature maturation process, Seven Premium 100% Malt also boasts a clean finish that lacks any unpleasant aftertaste.
Successful Launch of Seven Premium 100% Malt
Seven Premium 100% Malt 350ml/500ml
SAPPORO HOLDINGS LIMITED Annual Report 2012 21

International
Performance Review and Plan
Net sales
201220112010200920080
10,000
20,000
30,000
40,000(¥ Million)
25,02122,582
25,386 25,888
36,121
Operating income to net salesOperating income
1,768 1,7201,607
1,433
1,053
201220112010200920080
500
1,000
1,500
2,000
0
3
6
9
12(¥ Million) (%)
Operating income and Operating income to net sales
Note: Figures are before goodwill amortization.
In North America, where the timing of a full-fledged economic recovery remains unclear, we estimate that total demand in the beer market increased only slightly in 2012. In contrast, the Asian beer market continues to expand steadily, supported by the region’s fast-growing economies. Turning to our International Business, we experienced an upswing in local currency denominated sales particularly in North America. In addition, we strengthened our foothold in the United States’ soft drinks market by acquiring a 51% equity stake in Silver Springs Citrus, Inc. (SSC) in January 2012. This new subsidiary’s results have been included in our consolidated statement of income since April 2012. Accounting for these factors, sales in this segment climbed ¥10.2 billion, or 39.5% compared with the previous year, to ¥36.1 billion. On the earnings front, however, we incurred an operating loss of ¥0.1 billion, a negative turnaround of ¥0.5 billion year on year. This was mainly attributed to expenditures undertaken to cultivate the Vietnamese market. Operating income before goodwill amortization declined by ¥0.4 billion, or 26.5%, to ¥1.1 billion.
In Vietnam, we commenced a full-fledged marketing offensive including TV commercials from April 2012 as a part of efforts to build recognition for the Sapporo brand. In South Korea, we acquired a 15% equity stake in M’s Beverage Co., Ltd., a group company of our local partner Maeil Dairies Co., Ltd., which boasts a top share in the local cheese, low-fat milk, and chilled coffee drinks market, in January 2012. Through this initiative, we strengthened our structure in South Korea allowing us to accelerate sales of Sapporo brand beers to local household and commercial markets while enhancing our brand value. In the Oceania region, we took steps to reinforce sales in Australia and New Zealand by entering into a brewing and sales licensing agreement with Coopers Brewery Ltd. in October 2011. Continuing to work in close collaboration with our local subsidiary, we are expanding sales channels in the local household market in Singapore. Building on these initiatives, we achieved a 68% year-on-year increase in beer sales volumes in Asia and other markets outside North America.
The Sapporo Group continued to engage in aggressive marketing activities that target the premium beer market, where it exhibits core strengths. Canadian subsidiary, SLEEMAN BREWERIES, achieved a 4% year-on-year increase in unit sales (excluding outsourced production of Sapporo brand products and sales of domestic brands), keeping its six-year growth streak intact, by boosting investments aimed at marketing premium brands. In the United States, Sapporo U.S.A., Inc posted a 1% year-on-year upswing in sales volumes of Sapporo brand beers. While maintaining our base in the Japanese-American market, this upswing reflects successful efforts to expand into the wider U.S. and Asian-American markets.
Asia and Oceania Market
North American Market
Fiscal 2012 Overview
22

■ SAPPORO INTERNATIONAL INC.■ SAPPORO U.S.A., INC.■ SAPPORO CANADA INC.■ SLEEMAN BREWERIES LTD.
■ SAPPORO ASIA PRIVATE LIMITED■ SAPPORO VIETNAM LIMITED■ SILVER SPRINGS CITRUS, INC.
Topic
Silver Springs Citrus, products
The Sapporo Group acquired 51% of the total issued shares of SSC from the Toyota Tsusho Group for a payment of US$24 million. This acquisition will trigger the Group’s full-fledged entry into the U.S. beverage market and complement its competitive advantage as an established top beer brand from Asia in the U.S. market. Harnessing their respective strengths, the Sapporo and Toyota Tsusho groups will work to expand the SSC beverage business in the U.S.
Acquisition of a 51% Equity Interest in Silver Springs Citrus, Inc., the Biggest U.S. Manufacturer of Private-Brand Chilled Beverages
Positioned as a growth driver, we will accelerate efforts to expand the International Business by capitalizing on our strengths in the premium beer category in North America. At the same time, we will boost sales by actively expanding business in such growing markets as Asia and keeping a keen eye on opportunities to tap into areas outside the alcohol business domain.
for the International BusinessGrowth Strategy(¥ Billion)
Quantitative targets
2012results
2013targets
2014targets
Net sales 36.1 43.3 46.4
Operating income* (0.1) 0.0 1.1Operating income before goodwill amortization 1.1 1.2 —* Because of expenditures to build the Vietnam market, fiscal 2012 and 2013 include
operating losses of ¥1.7 billion and ¥1.8 billion, respectively.
Strengthen the Sapporo brand in the Asia and Oceania market[Vietnam]While continuing to engage in full-scale marketing to establish and enhance recognition of the Sapporo brand at an early stage, we will build on existing beachhead Ho Chi Minh marketing activities to expand into the northern regions of Vietnam including Hanoi.
[South Korea / Oceania]In the South Korea and Oceania markets, we will reinforce sales by directing efforts mainly through our business alliance with Maeil Dairies Co., Ltd. and licensed production through Coopers Brewery Limited, respectively.
Bolster marketing in the North American market[Canada]SLEEMAN BREWERIES will continue investments in marketing to maintain and improve the value of its core premium brands. In addition, energies will be channeled toward achieving sales volumes including growing value brands that exceed the growth in total demand.
[U.S.A.]In the U.S., Sapporo U.S.A., Inc will redouble its efforts to develop business in the U.S. general and Asian-American markets. These efforts are aimed at achieving sales volumes that outstrip any increase in total demand.
Management Plan 2013–2014
SAPPORO HOLDINGS LIMITED Annual Report 2012 23
Food & Soft Drinks
Performance Review and Plan
Net sales
201220112010200920080
50,000
100,000
150,000(¥ Million)
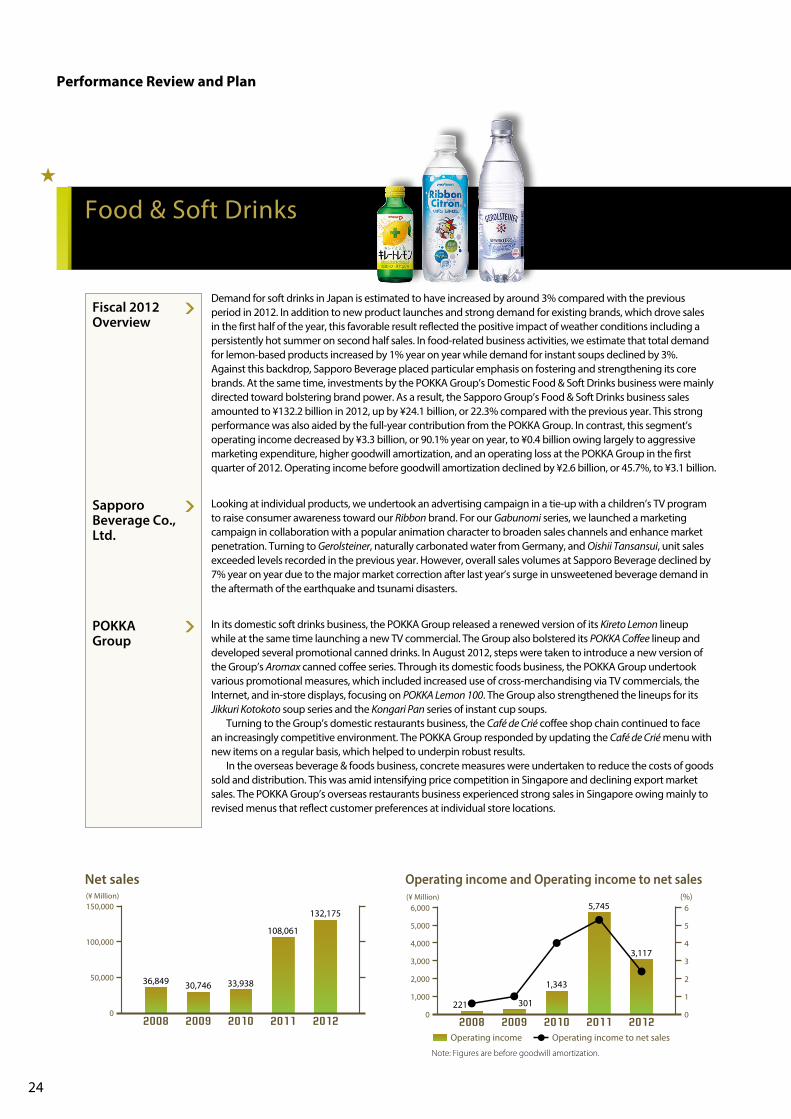
36,849 30,746 33,938
108,061
132,175
Operating income to net salesOperating income
(%)
201220112010200920080
1,000
2,000
3,000
6,000
5,000
4,000
0
1
2
3
6
4
5
(¥ Million)
221 301
1,343
5,745
3,117
Operating income and Operating income to net sales
Note: Figures are before goodwill amortization.
Demand for soft drinks in Japan is estimated to have increased by around 3% compared with the previous period in 2012. In addition to new product launches and strong demand for existing brands, which drove sales in the first half of the year, this favorable result reflected the positive impact of weather conditions including a persistently hot summer on second half sales. In food-related business activities, we estimate that total demand for lemon-based products increased by 1% year on year while demand for instant soups declined by 3%. Against this backdrop, Sapporo Beverage placed particular emphasis on fostering and strengthening its core brands. At the same time, investments by the POKKA Group’s Domestic Food & Soft Drinks business were mainly directed toward bolstering brand power. As a result, the Sapporo Group’s Food & Soft Drinks business sales amounted to ¥132.2 billion in 2012, up by ¥24.1 billion, or 22.3% compared with the previous year. This strong performance was also aided by the full-year contribution from the POKKA Group. In contrast, this segment’s operating income decreased by ¥3.3 billion, or 90.1% year on year, to ¥0.4 billion owing largely to aggressive marketing expenditure, higher goodwill amortization, and an operating loss at the POKKA Group in the first quarter of 2012. Operating income before goodwill amortization declined by ¥2.6 billion, or 45.7%, to ¥3.1 billion.
In its domestic soft drinks business, the POKKA Group released a renewed version of its Kireto Lemon lineup while at the same time launching a new TV commercial. The Group also bolstered its POKKA Coffee lineup and developed several promotional canned drinks. In August 2012, steps were taken to introduce a new version of the Group’s Aromax canned coffee series. Through its domestic foods business, the POKKA Group undertook various promotional measures, which included increased use of cross-merchandising via TV commercials, the Internet, and in-store displays, focusing on POKKA Lemon 100. The Group also strengthened the lineups for its Jikkuri Kotokoto soup series and the Kongari Pan series of instant cup soups. Turning to the Group’s domestic restaurants business, the Café de Crié coffee shop chain continued to face an increasingly competitive environment. The POKKA Group responded by updating the Café de Crié menu with new items on a regular basis, which helped to underpin robust results. In the overseas beverage & foods business, concrete measures were undertaken to reduce the costs of goods sold and distribution. This was amid intensifying price competition in Singapore and declining export market sales. The POKKA Group’s overseas restaurants business experienced strong sales in Singapore owing mainly to revised menus that reflect customer preferences at individual store locations.
Looking at individual products, we undertook an advertising campaign in a tie-up with a children’s TV program to raise consumer awareness toward our Ribbon brand. For our Gabunomi series, we launched a marketing campaign in collaboration with a popular animation character to broaden sales channels and enhance market penetration. Turning to Gerolsteiner, naturally carbonated water from Germany, and Oishii Tansansui, unit sales exceeded levels recorded in the previous year. However, overall sales volumes at Sapporo Beverage declined by 7% year on year due to the major market correction after last year’s surge in unsweetened beverage demand in the aftermath of the earthquake and tsunami disasters.
POKKA Group
Sapporo Beverage Co., Ltd.
Fiscal 2012 Overview
24

■ POKKA SAPPORO FOOD & BEVERAGE LTD.■ STELLA BEVERAGE SERVICE CO., LTD.■ STAR BEVERAGE SERVICE CO., LTD.■ SUN POKKA CO., LTD.■ POKKA CREATE CO., LTD.■ POKKA CORPORATION (SINGAPORE) PTE. LTD.
Having commenced operations from January 2013, every effort is being made to position POKKA SAPPORO FOOD & BEVERAGE LTD. as a third core business pillar of the Sapporo Group. Moving forward, we will work diligently to bolster our business activities by making the most of Group synergies.
for the Food & Soft Drinks BusinessGrowth Strategy
Kireto Lemon, POKKA Lemon 100, and related brands as we look to expand sales. In soups & foods, we are reinforcing each of the Kongari Pan and Jikkuri Kotokoto lineups while fostering Kantanbimi. In the overseas soft drinks business, we will increase production capacity and put in place the foundation required to secure further growth.
Post integration objectiveIn order to enter a renewed growth phase, we undertook a review our Marketing Division’s strategic units and set up the five categories of soft drink brands, overseas brands, lemon & natural foods, soup & foods, and commercial-use products.
Enhance brand powerAs a part of efforts to enhance the brand power of our soft drinks and overseas products, we are selectively channeling marketing investments and operating capabilities toward the core Gerolsteiner, Aromax, Ribbon, and Gabunomi brands as well as such new brands as Yasuragi Kibun-no Corn-Cha. In similar fashion, we are boosting investments in our lemon & natural foods business, placing particular emphasis on the
(¥ Billion)
Quantitative targets
2012results
2013targets
2014targets
Net sales 129.0 136.5 145.5
Operating income 0.4 1.0 2.7Operating income before goodwill amortization 3.1 3.8 —* POKKA Logistics Co., Ltd. will be moved to Other, and POKKA FOOD (SINGAPORE)
PTE. LTD. will be moved to Restaurants from fiscal 2013 onward. The figures for fiscal 2012 are reflected in the table above.
Topic
POKKA SAPPORO FOOD & BEVERAGE products
POKKA SAPPORO FOOD & BEVERAGE LTD. was established in March 2012. This company was charged with the responsibility of promoting the integration of Sapporo Beverage Co., Ltd. and POKKA CORPORATION. Subsequently, POKKA SAPPORO FOOD & BEVERAGE commenced operations in January 2013. Serving as the principal food and beverage company of the Sapporo Group, POKKA SAPPORO FOOD & BEVERAGE is targeting net sales of ¥170.0 billion and operating income before goodwill amortization of ¥8.5 billion in fiscal 2016 under the Sapporo Group’s New Management Framework.
Newly Integrated Company, POKKA SAPPORO FOOD & BEVERAGE LTD. Commences Operations in January 2013
Management Plan 2013–2014
SAPPORO HOLDINGS LIMITED Annual Report 2012 25
Performance Review and Plan
Net sales
201220112010200920080
10,000
20,000
30,000(¥ Million)
29,538 28,02626,429
24,091 25,616
Operating income (loss) and Operating income (loss) to net sales
New Restaurants
Existing Restaurants
Fiscal 2012 Overview
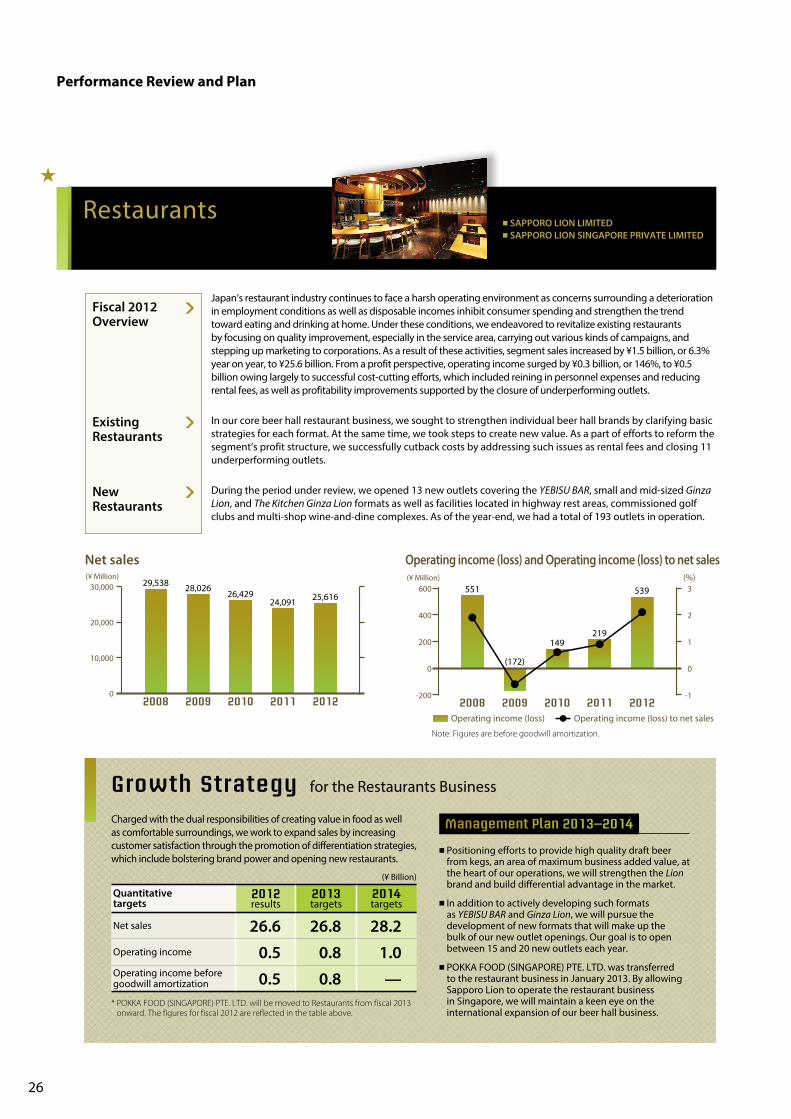
Japan’s restaurant industry continues to face a harsh operating environment as concerns surrounding a deterioration in employment conditions as well as disposable incomes inhibit consumer spending and strengthen the trend toward eating and drinking at home. Under these conditions, we endeavored to revitalize existing restaurants by focusing on quality improvement, especially in the service area, carrying out various kinds of campaigns, and stepping up marketing to corporations. As a result of these activities, segment sales increased by ¥1.5 billion, or 6.3% year on year, to ¥25.6 billion. From a profit perspective, operating income surged by ¥0.3 billion, or 146%, to ¥0.5 billion owing largely to successful cost-cutting efforts, which included reining in personnel expenses and reducing rental fees, as well as profitability improvements supported by the closure of underperforming outlets.
During the period under review, we opened 13 new outlets covering the YEBISU BAR, small and mid-sized Ginza Lion, and The Kitchen Ginza Lion formats as well as facilities located in highway rest areas, commissioned golf clubs and multi-shop wine-and-dine complexes. As of the year-end, we had a total of 193 outlets in operation.
In our core beer hall restaurant business, we sought to strengthen individual beer hall brands by clarifying basic strategies for each format. At the same time, we took steps to create new value. As a part of efforts to reform the segment’s profit structure, we successfully cutback costs by addressing such issues as rental fees and closing 11 underperforming outlets.
■ SAPPORO LION LIMITED■ SAPPORO LION SINGAPORE PRIVATE LIMITED
for the Restaurants BusinessGrowth StrategyCharged with the dual responsibilities of creating value in food as well as comfortable surroundings, we work to expand sales by increasing customer satisfaction through the promotion of differentiation strategies, which include bolstering brand power and opening new restaurants.
■ Positioning efforts to provide high quality draft beer from kegs, an area of maximum business added value, at the heart of our operations, we will strengthen the Lion brand and build differential advantage in the market.
■ In addition to actively developing such formats as YEBISU BAR and Ginza Lion, we will pursue the development of new formats that will make up the bulk of our new outlet openings. Our goal is to open between 15 and 20 new outlets each year.
■ POKKA FOOD (SINGAPORE) PTE. LTD. was transferred to the restaurant business in January 2013. By allowing Sapporo Lion to operate the restaurant business in Singapore, we will maintain a keen eye on the international expansion of our beer hall business.
Management Plan 2013–2014
Restaurants
(¥ Million) (%)
20122011201020092008Operating income (loss) to net salesOperating income (loss)
-200
0
200
400
600
-1
0
1
2
3551
(172)
149219
539
Note: Figures are before goodwill amortization.
(¥ Billion)
Quantitative targets
2012results
2013targets
2014targets
Net sales 26.6 26.8 28.2Operating income 0.5 0.8 1.0Operating income before goodwill amortization 0.5 0.8 —* POKKA FOOD (SINGAPORE) PTE. LTD. will be moved to Restaurants from fiscal 2013
onward. The figures for fiscal 2012 are reflected in the table above.
26
Net sales
20122011201020092008
(¥ Million)
23,452 23,26723,537
22,468
23,217
20,000
21,000
22,000
23,000
24,000(¥ Million) (%)
201220112010200920080
2,000
4,000
6,000
8,000
10,000
Operating income to net salesOperating income
0
10
20
30
40
50
7,612 7,524 7,9868,553
9,396
Operating income and Operating income to net sales
Real Estate Development
Yebisu Garden Place
Fiscal 2012 Overview
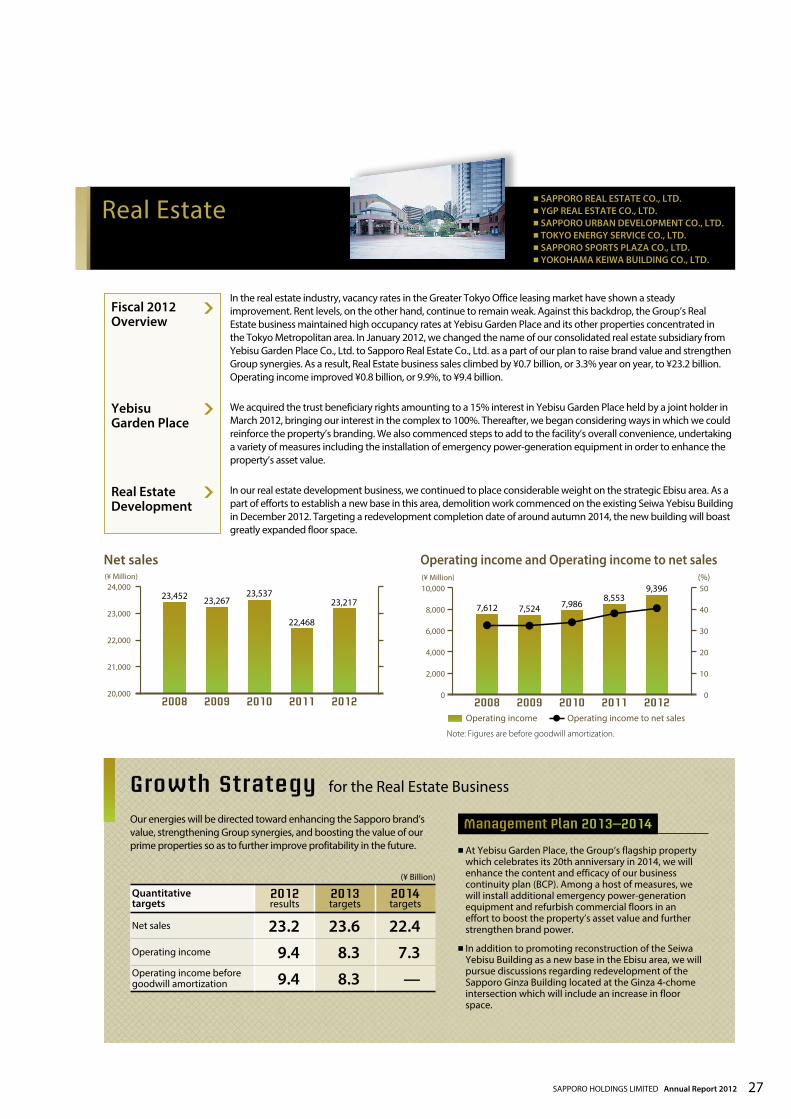
In the real estate industry, vacancy rates in the Greater Tokyo Office leasing market have shown a steady improvement. Rent levels, on the other hand, continue to remain weak. Against this backdrop, the Group’s Real Estate business maintained high occupancy rates at Yebisu Garden Place and its other properties concentrated in the Tokyo Metropolitan area. In January 2012, we changed the name of our consolidated real estate subsidiary from Yebisu Garden Place Co., Ltd. to Sapporo Real Estate Co., Ltd. as a part of our plan to raise brand value and strengthen Group synergies. As a result, Real Estate business sales climbed by ¥0.7 billion, or 3.3% year on year, to ¥23.2 billion. Operating income improved ¥0.8 billion, or 9.9%, to ¥9.4 billion.
In our real estate development business, we continued to place considerable weight on the strategic Ebisu area. As a part of efforts to establish a new base in this area, demolition work commenced on the existing Seiwa Yebisu Building in December 2012. Targeting a redevelopment completion date of around autumn 2014, the new building will boast greatly expanded floor space.
We acquired the trust beneficiary rights amounting to a 15% interest in Yebisu Garden Place held by a joint holder in March 2012, bringing our interest in the complex to 100%. Thereafter, we began considering ways in which we could reinforce the property’s branding. We also commenced steps to add to the facility’s overall convenience, undertaking a variety of measures including the installation of emergency power-generation equipment in order to enhance the property’s asset value.
■ SAPPORO REAL ESTATE CO., LTD.■ YGP REAL ESTATE CO., LTD.■ SAPPORO URBAN DEVELOPMENT CO., LTD.■ TOKYO ENERGY SERVICE CO., LTD.■ SAPPORO SPORTS PLAZA CO., LTD.■ YOKOHAMA KEIWA BUILDING CO., LTD.
for the Real Estate BusinessGrowth StrategyOur energies will be directed toward enhancing the Sapporo brand’s value, strengthening Group synergies, and boosting the value of our prime properties so as to further improve profitability in the future.
Management Plan 2013–2014
■ At Yebisu Garden Place, the Group’s flagship property which celebrates its 20th anniversary in 2014, we will enhance the content and efficacy of our business continuity plan (BCP). Among a host of measures, we will install additional emergency power-generation equipment and refurbish commercial floors in an effort to boost the property’s asset value and further strengthen brand power.
■ In addition to promoting reconstruction of the Seiwa Yebisu Building as a new base in the Ebisu area, we will pursue discussions regarding redevelopment of the Sapporo Ginza Building located at the Ginza 4-chome intersection which will include an increase in floor space.
Real Estate
Note: Figures are before goodwill amortization.
(¥ Billion)
Quantitative targets
2012results
2013targets
2014targets
Net sales 23.2 23.6 22.4Operating income 9.4 8.3 7.3Operating income before goodwill amortization 9.4 8.3 —
SAPPORO HOLDINGS LIMITED Annual Report 2012 27

CSR: Selective about Our Raw Materials
Definition of Collaborative Contract Farming System Cultivation by exclusively contracted producers is Sapporo’s unique and unprecedented raw material procurement system that is based on the three pillars of, 1) specifying the production area and producer, 2) specifying the production method, and 3) contact between the producer and us. Raw material specialists, called Field Workers (FWs), who belong to the only such organization in the world, directly visit the production areas of producers who cultivate by exclusive contract for Sapporo at 2,300 locations in nine countries throughout the world. By maintaining constant and close communication with producers, they ensure that high-quality raw materials are produced. As of January 2006, all of our Beer’s barley and hops were cultivated by exclusively contracted producers. As a result of efforts in this area, we were awarded Germany’s “National Honor in the world” (the
Bundesehrenpreis in Gold) for producers of quality spirits. The specific activities of FWs are to inspect all production areas each year prior to sowing, cultivation, and harvesting as well as after harvesting and to repeatedly meet with producers. FWs ensure that producers understand the raw material quality that we demand, and work together with producers in all areas from plant breeding to cultivation methods, the use of fertilizers and pesticides, and storehouse management.
Basic FW ActivitiesPlanningFirst, FWs review the previous farming season and draw up an action plan for the current season. They think about what plants to grow and how to grow them on the fields this year and decide what they need to communicate to
Sapporo Breweries Ltd., born in the 1870’s as Japan’s first full-fledged beer company founded by Japanese brewers, based on its conviction that “good raw materials produce good-quality beer,” took on the challenge of plant breeding through test cultivation of barley and hops even before its brewery was founded. This was the starting point of our current “Collaborative Contract Farming System.” Our highly selective approach to raw material production for today’s Sapporo Breweries has been continuously passed down.
“ Collaborative Contract Farming System,” Cultivation by Exclusively Contracted Producers
28
producers in order to achieve this. With this plan in hand, they then head out to the production area.
Pre-Sowing and Cultivation MeetingPrior to sowing the barley, we bring the producers together before hop cultivation begins and explain to them the concept behind cultivation by exclusively contracted producers, our safety and quality standards, and meet with them about this year’s plan.
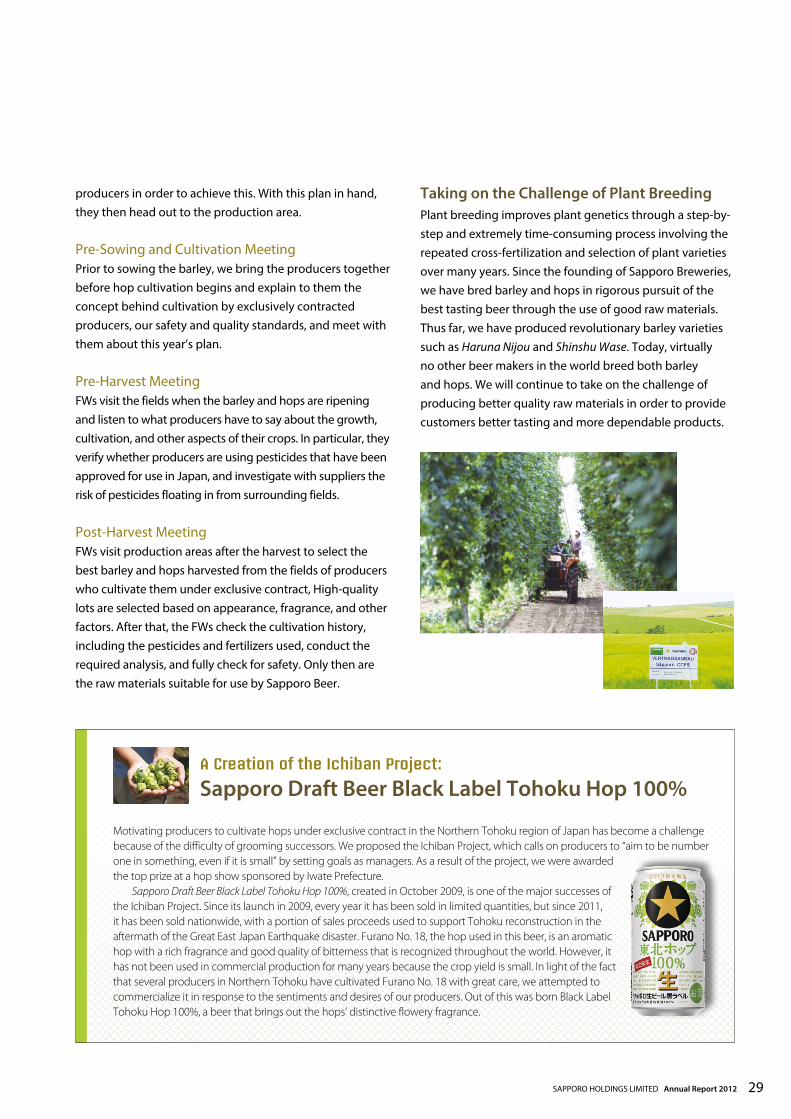
Pre-Harvest Meeting FWs visit the fields when the barley and hops are ripening and listen to what producers have to say about the growth, cultivation, and other aspects of their crops. In particular, they verify whether producers are using pesticides that have been approved for use in Japan, and investigate with suppliers the risk of pesticides floating in from surrounding fields.
Post-Harvest MeetingFWs visit production areas after the harvest to select the best barley and hops harvested from the fields of producers who cultivate them under exclusive contract, High-quality lots are selected based on appearance, fragrance, and other factors. After that, the FWs check the cultivation history, including the pesticides and fertilizers used, conduct the required analysis, and fully check for safety. Only then are the raw materials suitable for use by Sapporo Beer.
Taking on the Challenge of Plant BreedingPlant breeding improves plant genetics through a step-by-step and extremely time-consuming process involving the repeated cross-fertilization and selection of plant varieties over many years. Since the founding of Sapporo Breweries, we have bred barley and hops in rigorous pursuit of the best tasting beer through the use of good raw materials. Thus far, we have produced revolutionary barley varieties such as Haruna Nijou and Shinshu Wase. Today, virtually no other beer makers in the world breed both barley and hops. We will continue to take on the challenge of producing better quality raw materials in order to provide customers better tasting and more dependable products.
A Creation of the Ichiban Project:
Sapporo Draft Beer Black Label Tohoku Hop 100%
Motivating producers to cultivate hops under exclusive contract in the Northern Tohoku region of Japan has become a challenge because of the difficulty of grooming successors. We proposed the Ichiban Project, which calls on producers to “aim to be number one in something, even if it is small” by setting goals as managers. As a result of the project, we were awarded the top prize at a hop show sponsored by Iwate Prefecture. Sapporo Draft Beer Black Label Tohoku Hop 100%, created in October 2009, is one of the major successes of the Ichiban Project. Since its launch in 2009, every year it has been sold in limited quantities, but since 2011, it has been sold nationwide, with a portion of sales proceeds used to support Tohoku reconstruction in the aftermath of the Great East Japan Earthquake disaster. Furano No. 18, the hop used in this beer, is an aromatic hop with a rich fragrance and good quality of bitterness that is recognized throughout the world. However, it has not been used in commercial production for many years because the crop yield is small. In light of the fact that several producers in Northern Tohoku have cultivated Furano No. 18 with great care, we attempted to commercialize it in response to the sentiments and desires of our producers. Out of this was born Black Label Tohoku Hop 100%, a beer that brings out the hops’ distinctive flowery fragrance.
SAPPORO HOLDINGS LIMITED Annual Report 2012 29
Corporate Governance
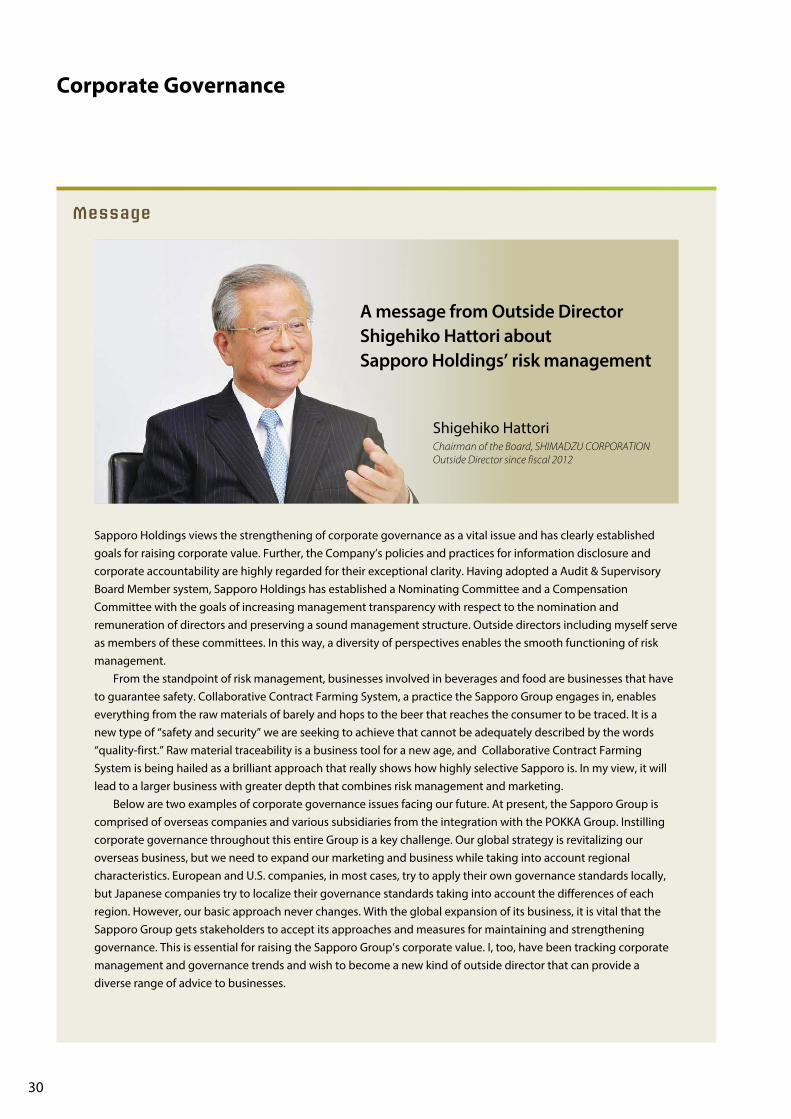
Sapporo Holdings views the strengthening of corporate governance as a vital issue and has clearly established goals for raising corporate value. Further, the Company’s policies and practices for information disclosure and corporate accountability are highly regarded for their exceptional clarity. Having adopted a Audit & Supervisory Board Member system, Sapporo Holdings has established a Nominating Committee and a Compensation Committee with the goals of increasing management transparency with respect to the nomination and remuneration of directors and preserving a sound management structure. Outside directors including myself serve as members of these committees. In this way, a diversity of perspectives enables the smooth functioning of risk management. From the standpoint of risk management, businesses involved in beverages and food are businesses that have to guarantee safety. Collaborative Contract Farming System, a practice the Sapporo Group engages in, enables everything from the raw materials of barely and hops to the beer that reaches the consumer to be traced. It is a new type of “safety and security” we are seeking to achieve that cannot be adequately described by the words “quality-first.” Raw material traceability is a business tool for a new age, and Collaborative Contract Farming System is being hailed as a brilliant approach that really shows how highly selective Sapporo is. In my view, it will lead to a larger business with greater depth that combines risk management and marketing. Below are two examples of corporate governance issues facing our future. At present, the Sapporo Group is comprised of overseas companies and various subsidiaries from the integration with the POKKA Group. Instilling corporate governance throughout this entire Group is a key challenge. Our global strategy is revitalizing our overseas business, but we need to expand our marketing and business while taking into account regional characteristics. European and U.S. companies, in most cases, try to apply their own governance standards locally, but Japanese companies try to localize their governance standards taking into account the differences of each region. However, our basic approach never changes. With the global expansion of its business, it is vital that the Sapporo Group gets stakeholders to accept its approaches and measures for maintaining and strengthening governance. This is essential for raising the Sapporo Group’s corporate value. I, too, have been tracking corporate management and governance trends and wish to become a new kind of outside director that can provide a diverse range of advice to businesses.
Message
Shigehiko HattoriChairman of the Board, SHIMADZU CORPORATIONOutside Director since fiscal 2012
A message from Outside Director Shigehiko Hattori about Sapporo Holdings’ risk management
30
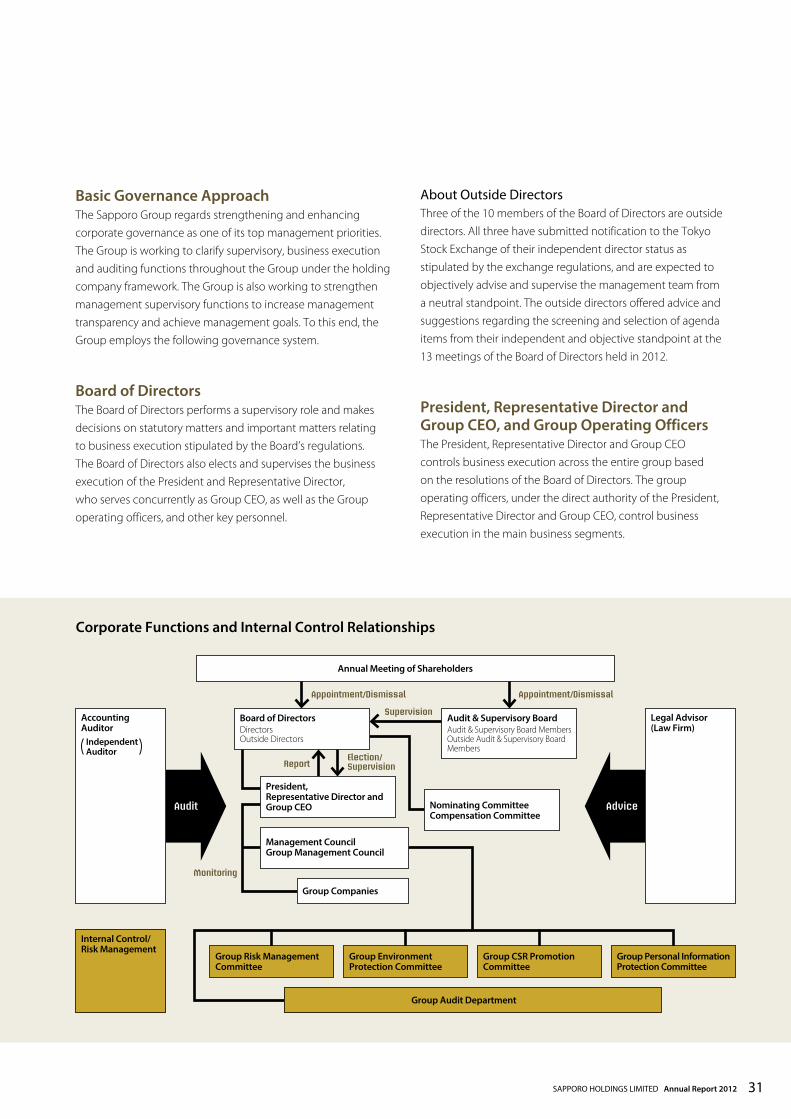
Basic Governance ApproachThe Sapporo Group regards strengthening and enhancing corporate governance as one of its top management priorities. The Group is working to clarify supervisory, business execution and auditing functions throughout the Group under the holding company framework. The Group is also working to strengthen management supervisory functions to increase management transparency and achieve management goals. To this end, the Group employs the following governance system.
Board of DirectorsThe Board of Directors performs a supervisory role and makes decisions on statutory matters and important matters relating to business execution stipulated by the Board’s regulations. The Board of Directors also elects and supervises the business execution of the President and Representative Director, who serves concurrently as Group CEO, as well as the Group operating officers, and other key personnel.
About Outside Directors Three of the 10 members of the Board of Directors are outside directors. All three have submitted notification to the Tokyo Stock Exchange of their independent director status as stipulated by the exchange regulations, and are expected to objectively advise and supervise the management team from a neutral standpoint. The outside directors offered advice and suggestions regarding the screening and selection of agenda items from their independent and objective standpoint at the 13 meetings of the Board of Directors held in 2012.
President, Representative Director and Group CEO, and Group Operating OfficersThe President, Representative Director and Group CEO controls business execution across the entire group based on the resolutions of the Board of Directors. The group operating officers, under the direct authority of the President, Representative Director and Group CEO, control business execution in the main business segments.
Corporate Functions and Internal Control Relationships
ReportElection/Supervision
Monitoring
Appointment/Dismissal Appointment/Dismissal
Audit
Internal Control/Risk Management
Legal Advisor(Law Firm)
Audit & Supervisory BoardAudit & Supervisory Board MembersOutside Audit & Supervisory Board Members
Board of DirectorsDirectorsOutside Directors
Annual Meeting of Shareholders
President, Representative Director andGroup CEO
Management CouncilGroup Management Council
Group Companies
Group Risk Management Committee
Group Environment Protection Committee
Group CSR Promotion Committee
Group Personal Information Protection Committee
Group Audit Department
Nominating CommitteeCompensation Committee
Supervision
Advice
Accounting Auditor Independent
Auditor
SAPPORO HOLDINGS LIMITED Annual Report 2012 31
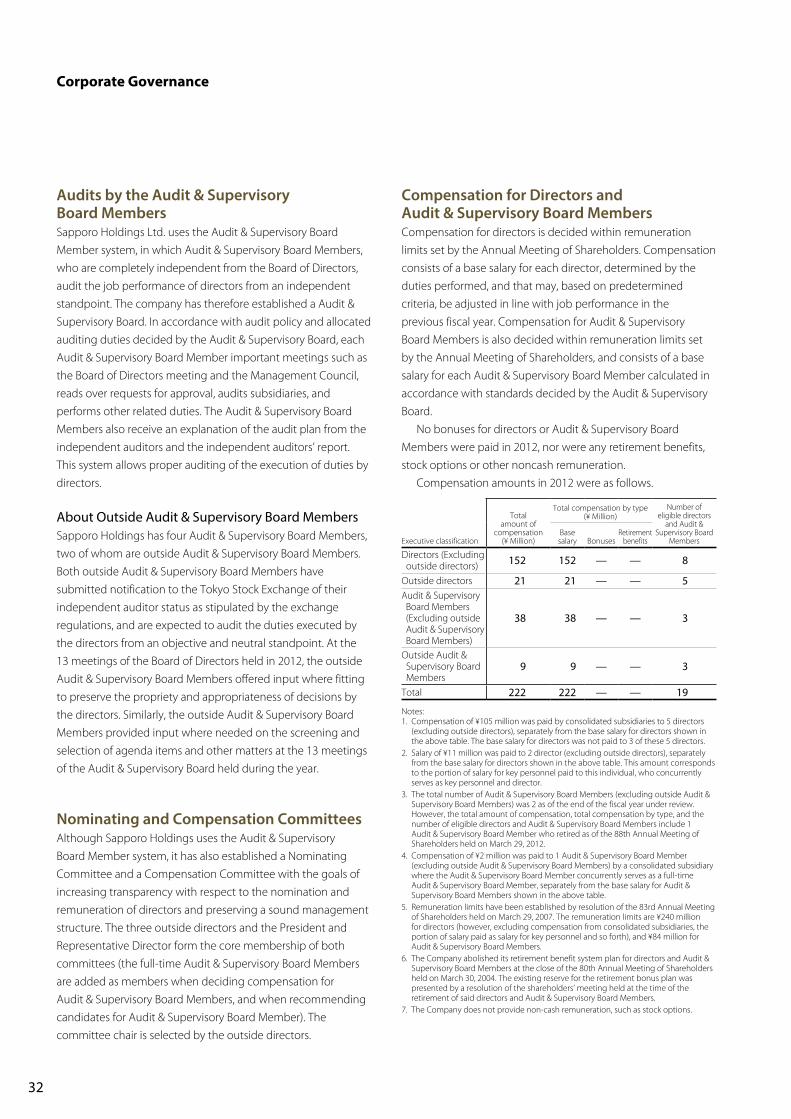
Compensation for Directors and Audit & Supervisory Board MembersCompensation for directors is decided within remuneration limits set by the Annual Meeting of Shareholders. Compensation consists of a base salary for each director, determined by the duties performed, and that may, based on predetermined criteria, be adjusted in line with job performance in the previous fiscal year. Compensation for Audit & Supervisory Board Members is also decided within remuneration limits set by the Annual Meeting of Shareholders, and consists of a base salary for each Audit & Supervisory Board Member calculated in accordance with standards decided by the Audit & Supervisory Board. No bonuses for directors or Audit & Supervisory Board Members were paid in 2012, nor were any retirement benefits, stock options or other noncash remuneration. Compensation amounts in 2012 were as follows.
Executive classification
Total amount of
compensation (¥ Million)
Total compensation by type (¥ Million)
Number of eligible directors
and Audit & Supervisory Board
MembersBase salary Bonuses
Retirement benefits
Directors (Excluding outside directors) 152 152 — — 8
Outside directors 21 21 — — 5Audit & Supervisory Board Members (Excluding outside Audit & Supervisory Board Members)
38 38 — — 3
Outside Audit & Supervisory Board Members
9 9 — — 3
Total 222 222 — — 19
Notes:1. Compensation of ¥105 million was paid by consolidated subsidiaries to 5 directors
(excluding outside directors), separately from the base salary for directors shown in the above table. The base salary for directors was not paid to 3 of these 5 directors.
2. Salary of ¥11 million was paid to 2 director (excluding outside directors), separately from the base salary for directors shown in the above table. This amount corresponds to the portion of salary for key personnel paid to this individual, who concurrently serves as key personnel and director.
3. The total number of Audit & Supervisory Board Members (excluding outside Audit & Supervisory Board Members) was 2 as of the end of the fiscal year under review. However, the total amount of compensation, total compensation by type, and the number of eligible directors and Audit & Supervisory Board Members include 1 Audit & Supervisory Board Member who retired as of the 88th Annual Meeting of Shareholders held on March 29, 2012.
4. Compensation of ¥2 million was paid to 1 Audit & Supervisory Board Member (excluding outside Audit & Supervisory Board Members) by a consolidated subsidiary where the Audit & Supervisory Board Member concurrently serves as a full-time Audit & Supervisory Board Member, separately from the base salary for Audit & Supervisory Board Members shown in the above table.
5. Remuneration limits have been established by resolution of the 83rd Annual Meeting of Shareholders held on March 29, 2007. The remuneration limits are ¥240 million for directors (however, excluding compensation from consolidated subsidiaries, the portion of salary paid as salary for key personnel and so forth), and ¥84 million for Audit & Supervisory Board Members.
6. The Company abolished its retirement benefit system plan for directors and Audit & Supervisory Board Members at the close of the 80th Annual Meeting of Shareholders held on March 30, 2004. The existing reserve for the retirement bonus plan was presented by a resolution of the shareholders’ meeting held at the time of the retirement of said directors and Audit & Supervisory Board Members.
7. The Company does not provide non-cash remuneration, such as stock options.
Audits by the Audit & Supervisory Board MembersSapporo Holdings Ltd. uses the Audit & Supervisory Board Member system, in which Audit & Supervisory Board Members, who are completely independent from the Board of Directors, audit the job performance of directors from an independent standpoint. The company has therefore established a Audit & Supervisory Board. In accordance with audit policy and allocated auditing duties decided by the Audit & Supervisory Board, each Audit & Supervisory Board Member important meetings such as the Board of Directors meeting and the Management Council, reads over requests for approval, audits subsidiaries, and performs other related duties. The Audit & Supervisory Board Members also receive an explanation of the audit plan from the independent auditors and the independent auditors’ report. This system allows proper auditing of the execution of duties by directors.
About Outside Audit & Supervisory Board MembersSapporo Holdings has four Audit & Supervisory Board Members, two of whom are outside Audit & Supervisory Board Members. Both outside Audit & Supervisory Board Members have submitted notification to the Tokyo Stock Exchange of their independent auditor status as stipulated by the exchange regulations, and are expected to audit the duties executed by the directors from an objective and neutral standpoint. At the 13 meetings of the Board of Directors held in 2012, the outside Audit & Supervisory Board Members offered input where fitting to preserve the propriety and appropriateness of decisions by the directors. Similarly, the outside Audit & Supervisory Board Members provided input where needed on the screening and selection of agenda items and other matters at the 13 meetings of the Audit & Supervisory Board held during the year.
Nominating and Compensation CommitteesAlthough Sapporo Holdings uses the Audit & Supervisory Board Member system, it has also established a Nominating Committee and a Compensation Committee with the goals of increasing transparency with respect to the nomination and remuneration of directors and preserving a sound management structure. The three outside directors and the President and Representative Director form the core membership of both committees (the full-time Audit & Supervisory Board Members are added as members when deciding compensation for Audit & Supervisory Board Members, and when recommending candidates for Audit & Supervisory Board Member). The committee chair is selected by the outside directors.
Corporate Governance
32

Internal AuditsUnder instructions from the President, Representative Director and Group CEO, Sapporo Holdings has established a Group Audit Department as an internal auditing organization independent of the executive chain of command. The Group Audit Department performs internal audits across the entire Group, including operating companies and their subsidiaries. The Group Audit Department and the Audit & Supervisory Board Members meet regularly to exchange views on the results of the internal audits, the status of internal control and other related matters. The internal audit report of the Group Audit Department is read by the Audit & Supervisory Board Members as part of the information that they share.
Upgrading the Internal Control SystemThe Group has appointed leaders responsible for creating systems to ensure appropriate financial reporting, CSR/Compliance, Group Governance and Risk Management, and is taking concrete steps to put these systems in place. The goal is to achieve full adherence to the basic policies decided by the Board of Directors, and to constantly upgrade and enhance the systems for the entire group. The secretariats of these initiatives all sit on an Internal Control Liaison Committee that the Group has also established to facilitate mutual understanding and coordination regarding the status of each project.
Risk ManagementThe Group manages risks relating to Sapporo Holdings and its subsidiaries and prepares crisis management measures. To achieve a more robust risk management structure for the entire Group the Company has formulated basic policies and management systems for Group risk management, as well as crisis management regulations. Specifically, Sapporo Holdings and its subsidiaries upgrade and develop systems for managing risks associated with important decisions made during business execution or risks inherent to it, and systems for managing crisis situations that may arise. These efforts are governed by the basic policies for the development of internal control systems.
ComplianceThe Group has set out the Sapporo Group Code of Business Conduct to provide a solid set of ethical guidelines for the conduct of all executives and employees. The Group CSR Promotion Committee has created a Group-wide compliance system and established a Whistle-Blower’s Hotline and Helpline
to help with prevention and early detection of misconduct. In addition, the Group Audit Department, which is an internal auditing body that is independent of the executive chain of command, audits the general business operations of Sapporo Holdings and its subsidiaries to ensure compliance with laws and regulations, the Company’s Articles of Incorporation and internal rules.
Policy Toward the Large-Scale Purchase of Share Certificates, etc., of the CompanyThe Board of Directors considers that decisions regarding the sale of the Company’s shares in response to the attempt by a Company shareholder to pursue a large-scale purchase of shares should ultimately rest with the shareholders themselves. However, should an attempt at the large-scale purchase of shares suddenly materialize, the Board of Directors recognizes the provision of ample and appropriate information from both the intended buyer and the Company’s Board of Directors as essential to making an optimal decision. The Board of Directors has therefore formulated a policy governing large-scale share purchases* that was approved by the ordinary general meeting of shareholders. The policy stipulates that the intended purchaser provide ample and necessary information to the Company’s Board of Directors prior to initiating any attempt at a large-scale share purchase. The Board of Directors then reserves a specified period of time to review the proposed purchase, allowing it to provide shareholders with opinions and information that contribute to their final decision. In the event that the proposed purchase is unequivocally deemed to drastically harm the mutual interests of the Company’s shareholders, the Board of Directors will, as stipulated by the policy, enact measures deemed appropriate to protect such interests. To prevent an arbitrary decision to apply this policy by the Board of Directors, an independent committee staffed by three or more individuals selected from among outside directors, auditors and experts has been established to provide an institutional check. The independent committee will receive advice regarding the purchase from the Board of Directors, and offer various counsel pertaining to the matter. * Policy Toward the Large-Scale Purchase of Share Certificates, etc. of the Company
http://www.sapporoholdings.jp/english/ir/report/nr/pdf/110210_06.pdf
SAPPORO HOLDINGS LIMITED Annual Report 2012 33
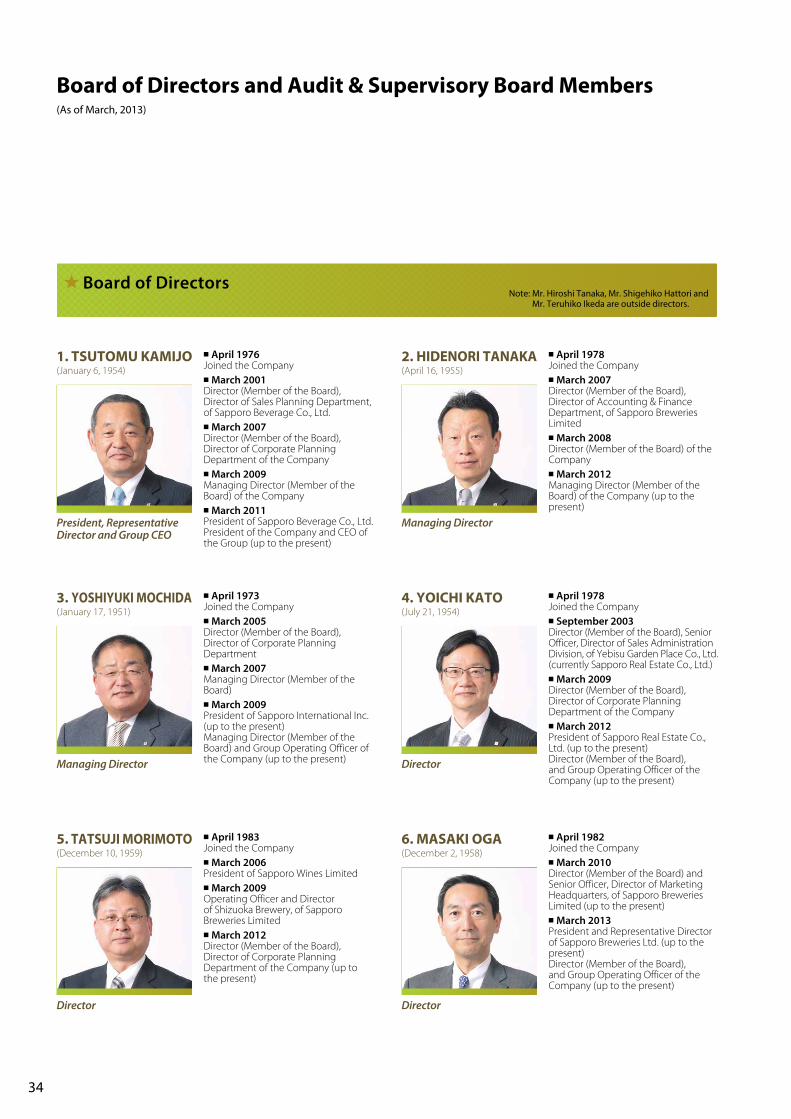
◾ April 1978Joined the Company◾ March 2007Director (Member of the Board), Director of Accounting & Finance Department, of Sapporo Breweries Limited◾ March 2008Director (Member of the Board) of the Company◾ March 2012Managing Director (Member of the Board) of the Company (up to the present)
2. HIDENORI TANAKA(April 16, 1955)
Managing Director
◾ April 1976Joined the Company◾ March 2001Director (Member of the Board), Director of Sales Planning Department, of Sapporo Beverage Co., Ltd.◾ March 2007Director (Member of the Board), Director of Corporate Planning Department of the Company◾ March 2009Managing Director (Member of the Board) of the Company◾ March 2011President of Sapporo Beverage Co., Ltd. President of the Company and CEO of the Group (up to the present)
1. TSUTOMU KAMIJO (January 6, 1954)
President, Representative Director and Group CEO
◾ April 1978Joined the Company◾ September 2003Director (Member of the Board), Senior Officer, Director of Sales Administration Division, of Yebisu Garden Place Co., Ltd. (currently Sapporo Real Estate Co., Ltd.)◾ March 2009Director (Member of the Board), Director of Corporate Planning Department of the Company◾ March 2012President of Sapporo Real Estate Co., Ltd. (up to the present)Director (Member of the Board), and Group Operating Officer of the Company (up to the present)
4. YOICHI KATO(July 21, 1954)
Director
◾ April 1973Joined the Company◾ March 2005Director (Member of the Board), Director of Corporate Planning Department◾ March 2007Managing Director (Member of the Board)◾ March 2009President of Sapporo International Inc. (up to the present)Managing Director (Member of the Board) and Group Operating Officer of the Company (up to the present)
3. YOSHIYUKI MOCHIDA(January 17, 1951)
Managing Director
◾ April 1983Joined the Company◾ March 2006President of Sapporo Wines Limited◾ March 2009Operating Officer and Director of Shizuoka Brewery, of Sapporo Breweries Limited◾ March 2012Director (Member of the Board), Director of Corporate Planning Department of the Company (up to the present)
5. TATSUJI MORIMOTO(December 10, 1959)
Director
◾ April 1982Joined the Company◾ March 2010Director (Member of the Board) and Senior Officer, Director of Marketing Headquarters, of Sapporo Breweries Limited (up to the present)◾ March 2013President and Representative Director of Sapporo Breweries Ltd. (up to the present)Director (Member of the Board), and Group Operating Officer of the Company (up to the present)
6. MASAKI OGA(December 2, 1958)
Director
Board of DirectorsNote: Mr. Hiroshi Tanaka, Mr. Shigehiko Hattori and
Mr. Teruhiko Ikeda are outside directors.
Board of Directors and Audit & Supervisory Board Members(As of March, 2013)
34

◾ June 2001Director (Member of the Board), Chief of Planning Office, of POKKA Corporation (Part-time Director)◾ December 2005Representative Director (Member of the Board), President, of POKKA Corporation◾ March 2012Director (Chairman of the Board) of POKKA Corporation President and Representative Director of Sapporo Beverage Co., Ltd. President and Representative Director of POKKA SAPPORO FOOD & BEVERAGE LTD. (up to the present)◾ March 2013Director (Member of the Board), and Group Operating Officer of the Company (up to the present)
7. MASATOSHI HORI(October 14, 1953)
Director
◾ April 1964Joined Kureha Chemical Industry Co., Ltd. (currently Kureha Corporation)◾ June 2003President & Chief Executive Officer of Kureha Corporation◾ April 2007Chairman of the Board of Directors of Kureha Corporation◾ March 2008Director (Member of the Board), of the Company (up to the present)◾ June 2010Advisor of Kureha Corporation (up to the present)Director
8. HIROSHI TANAKA(September 23, 1941)
◾ April 1964Joined Shimadzu Corporation◾ June 1993Director (Member of the Board), of Shimadzu Corporation (seconded to the United States of America)◾ June 2003President and CEO of Shimadzu Corporation◾ June 2009Chairman of the Board of Director of Shimadzu Corporation (up to the present)◾ March 2012Director (Member of the Board), of the Company (up to the present)
Director
9. SHIGEHIKO HATTORI(August 21, 1941)
◾ April 1969Joined The Fuji Bank, Ltd. (currently Mizuho Financial Group, Inc.)◾ April 2002Deputy President of Mizuho Corporate Bank, Ltd.◾ June 2004President and Chief Executive Officer of Mizuho Trust & Banking Co., Ltd.◾ June 2010Advisor of Mizuho Trust & Banking Co., Ltd. (up to the present)◾ March 2012Director (Member of the Board) of the Company (up to the present)Director
10. TERUHIKO IKEDA(December 5, 1946)
◾ March 1977Joined POKKA Lemon Co., Ltd. (currently POKKA Corporation)◾ April 2003Operating Officer and General Manager of Corporate Strategic Division of POKKA Corporation◾ June 2011Director and General Manager of Corporate Strategic Division of POKKA Corporation (Member of the Board)◾ March 2012Audit & Supervisory Board Member of the Company (up to the present)
KEIJI IIDA(July 20, 1954)
Audit & Supervisory Board Member
◾ April 1975Joined the Company◾ July 2003Director of Corporate Planning Department of Sapporo Breweries Ltd.◾ September 2004Director of Business Support Department of the Company◾ October 2007Director of Group Audit Department◾ March 2011Standing Audit & Supervisory Board Member of the Company (up to the present)
RYOICHI YAMADA(January 28, 1953)
Standing Audit & Supervisory Board Member
◾ April 1982Registered as a lawyer (Daiichi Tokyo Bar Association) Joined the Law Offices of Furness, Sato & Ishizawa (currently Law Offices of Ishizawa, Ko & Sato) (up to the present)◾ October 1990Registered as a lawyer (New York State Bar Association)◾ April 2011Vice Chairman of Daiichi Tokyo Bar Association◾ March 2012Audit & Supervisory Board Member of the Company (up to the present)
JUNYA SATO(May 4, 1953)
Audit & Supervisory Board Member
◾ August 1970Joined Dainippon Ink and Chemicals, Inc. (currently DIC Corporation)◾ June 2001Director of Dainippon Ink and Chemicals, Inc.◾ April 2009Representative Director, President and CEO of DIC Corporation◾ April 2012Chairman of the Board of DIC Corporation (up to the present)◾ March 2013Audit & Supervisory Board Member of the Company (up to the present)
KAZUO SUGIE(October 5, 1945)
Audit & Supervisory Board Member
Note: Mr. Junya Sato and Mr. Kazuo Sugie are outside Audit & Supervisory Board Members.
Audit & Supervisory Board Members
SAPPORO HOLDINGS LIMITED Annual Report 2012 35
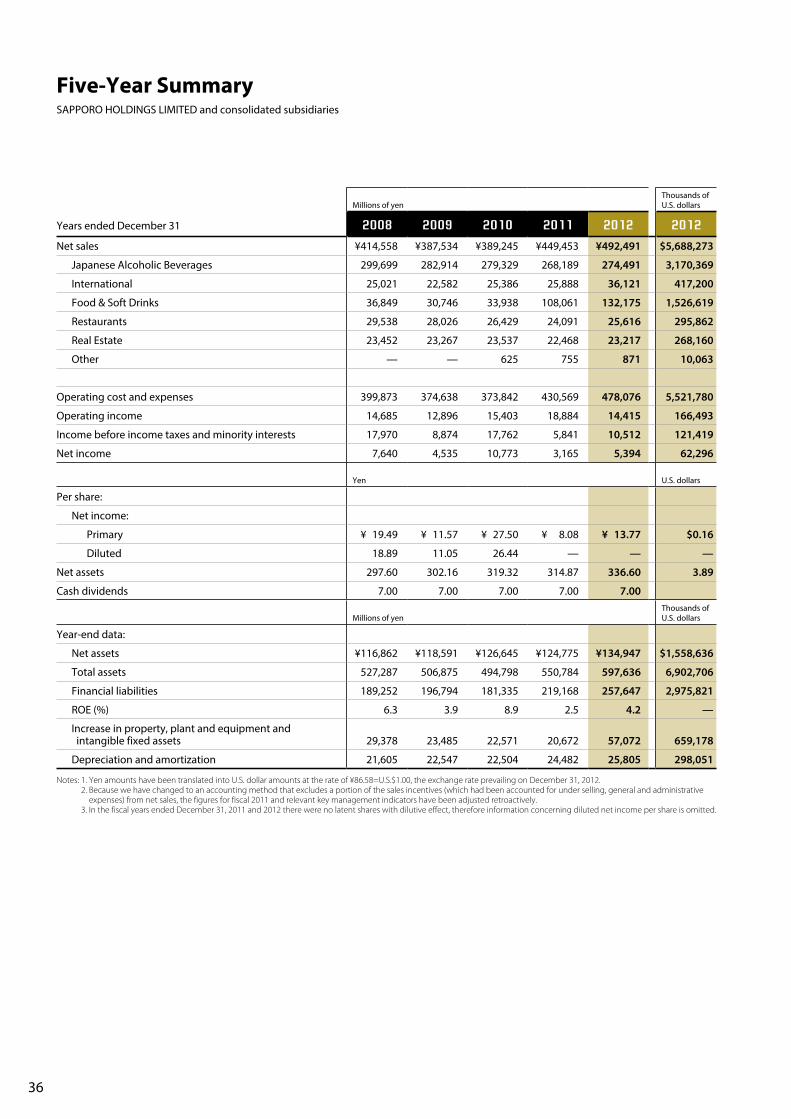
Millions of yenThousands of U.S. dollars
Years ended December 31 2008 2009 2010 2011 2012 2012
Net sales ¥414,558 ¥387,534 ¥389,245 ¥449,453 ¥492,491 $5,688,273
Japanese Alcoholic Beverages 299,699 282,914 279,329 268,189 274,491 3,170,369
International 25,021 22,582 25,386 25,888 36,121 417,200
Food & Soft Drinks 36,849 30,746 33,938 108,061 132,175 1,526,619
Restaurants 29,538 28,026 26,429 24,091 25,616 295,862
Real Estate 23,452 23,267 23,537 22,468 23,217 268,160
Other — — 625 755 871 10,063
Operating cost and expenses 399,873 374,638 373,842 430,569 478,076 5,521,780
Operating income 14,685 12,896 15,403 18,884 14,415 166,493
Income before income taxes and minority interests 17,970 8,874 17,762 5,841 10,512 121,419
Net income 7,640 4,535 10,773 3,165 5,394 62,296
Yen U.S. dollars
Per share:
Net income:
Primary ¥ 19.49 ¥ 11.57 ¥ 27.50 ¥ 8.08 ¥ 13.77 $0.16
Diluted 18.89 11.05 26.44 — — —
Net assets 297.60 302.16 319.32 314.87 336.60 3.89
Cash dividends 7.00 7.00 7.00 7.00 7.00
Millions of yenThousands of U.S. dollars
Year-end data:
Net assets ¥116,862 ¥118,591 ¥126,645 ¥124,775 ¥134,947 $1,558,636
Total assets 527,287 506,875 494,798 550,784 597,636 6,902,706
Financial liabilities 189,252 196,794 181,335 219,168 257,647 2,975,821
ROE (%) 6.3 3.9 8.9 2.5 4.2 —
Increase in property, plant and equipment and intangible fixed assets 29,378 23,485 22,571 20,672 57,072 659,178
Depreciation and amortization 21,605 22,547 22,504 24,482 25,805 298,051
Notes: 1. Yen amounts have been translated into U.S. dollar amounts at the rate of ¥86.58=U.S.$1.00, the exchange rate prevailing on December 31, 2012. 2. Because we have changed to an accounting method that excludes a portion of the sales incentives (which had been accounted for under selling, general and administrative
expenses) from net sales, the figures for fiscal 2011 and relevant key management indicators have been adjusted retroactively. 3. In the fiscal years ended December 31, 2011 and 2012 there were no latent shares with dilutive effect, therefore information concerning diluted net income per share is omitted.
Five-Year SummarySAPPORO HOLDINGS LIMITED and consolidated subsidiaries
36
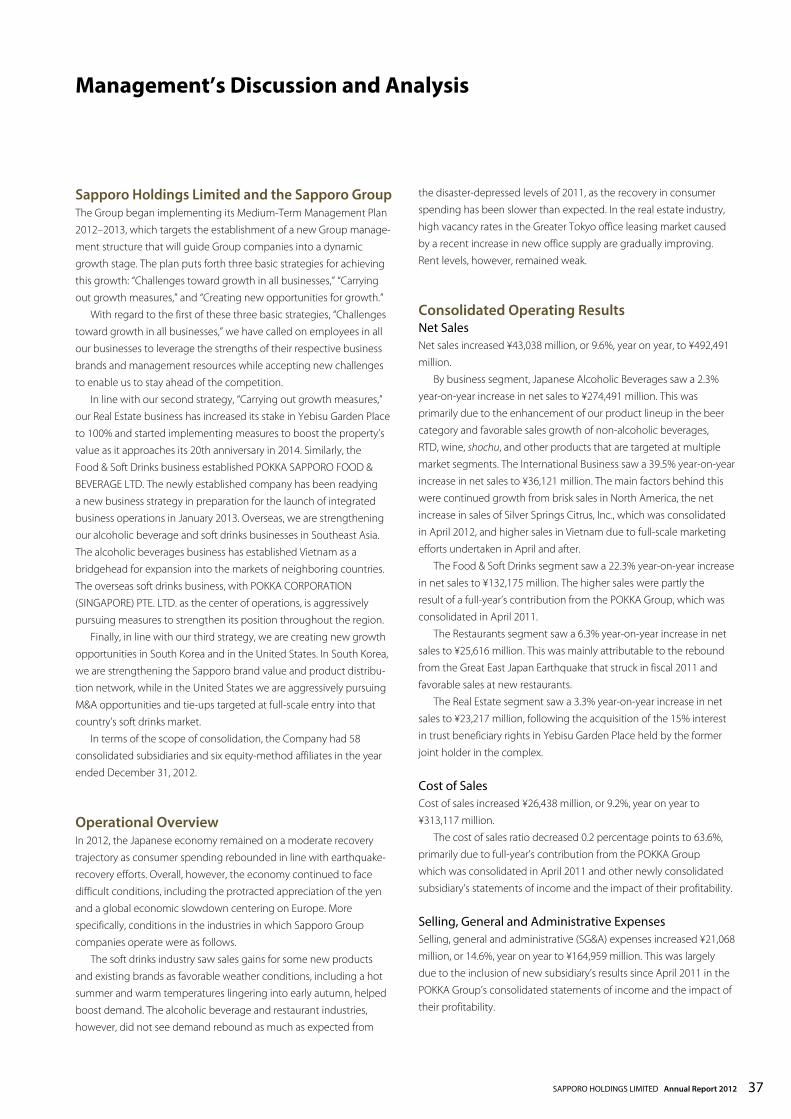
Management’s Discussion and Analysis
Sapporo Holdings Limited and the Sapporo GroupThe Group began implementing its Medium-Term Management Plan
2012–2013, which targets the establishment of a new Group manage-
ment structure that will guide Group companies into a dynamic
growth stage. The plan puts forth three basic strategies for achieving
this growth: “Challenges toward growth in all businesses,” “Carrying
out growth measures,” and “Creating new opportunities for growth.”
With regard to the first of these three basic strategies, “Challenges
toward growth in all businesses,” we have called on employees in all
our businesses to leverage the strengths of their respective business
brands and management resources while accepting new challenges
to enable us to stay ahead of the competition.
In line with our second strategy, “Carrying out growth measures,”
our Real Estate business has increased its stake in Yebisu Garden Place
to 100% and started implementing measures to boost the property’s
value as it approaches its 20th anniversary in 2014. Similarly, the
Food & Soft Drinks business established POKKA SAPPORO FOOD &
BEVERAGE LTD. The newly established company has been readying
a new business strategy in preparation for the launch of integrated
business operations in January 2013. Overseas, we are strengthening
our alcoholic beverage and soft drinks businesses in Southeast Asia.
The alcoholic beverages business has established Vietnam as a
bridgehead for expansion into the markets of neighboring countries.
The overseas soft drinks business, with POKKA CORPORATION
(SINGAPORE) PTE. LTD. as the center of operations, is aggressively
pursuing measures to strengthen its position throughout the region.
Finally, in line with our third strategy, we are creating new growth
opportunities in South Korea and in the United States. In South Korea,
we are strengthening the Sapporo brand value and product distribu-
tion network, while in the United States we are aggressively pursuing
M&A opportunities and tie-ups targeted at full-scale entry into that
country’s soft drinks market.
In terms of the scope of consolidation, the Company had 58
consolidated subsidiaries and six equity-method affiliates in the year
ended December 31, 2012.
Operational OverviewIn 2012, the Japanese economy remained on a moderate recovery
trajectory as consumer spending rebounded in line with earthquake-
recovery efforts. Overall, however, the economy continued to face
difficult conditions, including the protracted appreciation of the yen
and a global economic slowdown centering on Europe. More
specifically, conditions in the industries in which Sapporo Group
companies operate were as follows.
The soft drinks industry saw sales gains for some new products
and existing brands as favorable weather conditions, including a hot
summer and warm temperatures lingering into early autumn, helped
boost demand. The alcoholic beverage and restaurant industries,
however, did not see demand rebound as much as expected from
the disaster-depressed levels of 2011, as the recovery in consumer
spending has been slower than expected. In the real estate industry,
high vacancy rates in the Greater Tokyo office leasing market caused
by a recent increase in new office supply are gradually improving.
Rent levels, however, remained weak.
Consolidated Operating ResultsNet SalesNet sales increased ¥43,038 million, or 9.6%, year on year, to ¥492,491
million.
By business segment, Japanese Alcoholic Beverages saw a 2.3%
year-on-year increase in net sales to ¥274,491 million. This was
primarily due to the enhancement of our product lineup in the beer
category and favorable sales growth of non-alcoholic beverages,
RTD, wine, shochu, and other products that are targeted at multiple
market segments. The International Business saw a 39.5% year-on-year
increase in net sales to ¥36,121 million. The main factors behind this
were continued growth from brisk sales in North America, the net
increase in sales of Silver Springs Citrus, Inc., which was consolidated
in April 2012, and higher sales in Vietnam due to full-scale marketing
efforts undertaken in April and after.
The Food & Soft Drinks segment saw a 22.3% year-on-year increase
in net sales to ¥132,175 million. The higher sales were partly the
result of a full-year’s contribution from the POKKA Group, which was
consolidated in April 2011.
The Restaurants segment saw a 6.3% year-on-year increase in net
sales to ¥25,616 million. This was mainly attributable to the rebound
from the Great East Japan Earthquake that struck in fiscal 2011 and
favorable sales at new restaurants.
The Real Estate segment saw a 3.3% year-on-year increase in net
sales to ¥23,217 million, following the acquisition of the 15% interest
in trust beneficiary rights in Yebisu Garden Place held by the former
joint holder in the complex.
Cost of SalesCost of sales increased ¥26,438 million, or 9.2%, year on year to
¥313,117 million.
The cost of sales ratio decreased 0.2 percentage points to 63.6%,
primarily due to full-year’s contribution from the POKKA Group
which was consolidated in April 2011 and other newly consolidated
subsidiary’s statements of income and the impact of their profitability.
Selling, General and Administrative ExpensesSelling, general and administrative (SG&A) expenses increased ¥21,068
million, or 14.6%, year on year to ¥164,959 million. This was largely
due to the inclusion of new subsidiary’s results since April 2011 in the
POKKA Group’s consolidated statements of income and the impact of
their profitability.
37SAPPORO HOLDINGS LIMITED Annual Report 2012

Operating IncomeOperating income decreased ¥4,469 million, or 23.7%, year on year to
¥14,415 million.
The Restaurants business achieved profit growth on increased
sales, and Real Estate business profits were higher thanks to the
inclusion of revenues and earnings from Yebisu Garden Place in the
Group’s consolidated income statement from March, following the
acquisition of the 15% interest in trust beneficiary rights in Yebisu
Garden Place held by the former joint holder in the complex. Gains in
these segments, however, were outweighed by lower profits or losses
in other segments as the result of various profit-reducing factors,
including an aggressive year-over-year increase in marketing expenses
by both the Japanese Alcoholic Beverage business and the Food &
Soft Drinks business, increased goodwill amortization in the Food &
Soft Drinks business, a first-quarter operating loss at the POKKA Group,
and expenditures by the International Business segment to open new
markets in Vietnam.
Other Income (Expenses)Other expenses improved ¥9,141 million to ¥3,903 million.
With regard to net financial income (expenses), calculated as the
sum of interest and dividend income minus interest expense, the
Company recorded expenses of ¥2,451 million in fiscal 2012. Net
financial expenses improved from the previous year due to a lower
interest rate, despite an increase in financial liabilities.
The Company recorded a foreign exchange gain from the
depreciating yen of ¥536 million. A loss on disposal of property, plant
and equipment of ¥2,088 million was recorded mainly due to the
demolition of a beer production facility and real estate property.
An impairment loss of ¥188 million was recorded due to a
decline in market value of idle real estate, the closing of unprofitable
restaurants in the Restaurants business, and an impairment loss on
machinery and equipment in food businesses.
A loss on devaluation of investment securities of ¥582 million was
recorded mainly as a result of the declining market value of listed
stock.
Business structure improvement expenses of ¥346 million were
recorded due in part to consulting and other expenses related to the
management integration of the Food & Soft Drinks business.
Income before Income Taxes and Minority InterestsAs a result of the aforementioned and other factors, income before
income taxes and minority interests increased ¥4,672 million to
¥10,512 million.
Income Taxes and Net IncomeIncome taxes applicable to the Company, calculated as the sum of
corporation, inhabitants’ and enterprise taxes, were ¥5,351 million.
Income taxes accounted for 50.9% of income before income taxes
and minority interests. The difference between this percentage and
the statutory effective tax rate of 40.7% mainly reflected the recording
of a valuation allowance.
As a result, net income increased ¥2,229 million, or 70.4%, year on
year to ¥5,394 million.
Segment InformationMillions of yen
Net salesOperating
income
Depreciation and
amortization
Increase in property, plant and equipment and intangible
fixed assets
Japanese Alcoholic Beverages ¥274,491 ¥7,522 ¥10,307 ¥ 2,772International 36,121 (73) 1,507 1,442Food & Soft Drinks 132,175 364 6,654 7,633Restaurants 25,616 539 567 809Real Estate 23,217 9,396 4,612 42,207
Assets, Liabilities and Shareholders’ EquityThe Sapporo Group has a cash management system (CMS), which
enables Sapporo Holdings to centrally manage fund allocation within
the Group in Japan.
The concentration at the Company of cash flows generated by
individual Group companies helps preserve fund liquidity, while flex-
ible and efficient fund allocation within the Group serves to minimize
financial liabilities.
The Company strives to secure fund procurement channels and
liquidity to make certain that ample funds are on hand to cover pres-
ent and future operating activities, as well as the repayment of debts
and other funding needs. Necessary funds are procured mainly from
cash flows from operating activities, and loans, primarily from financial
institutions.
AssetsTotal assets at December 31, 2012 stood at ¥597,636 million, up
¥46,852 million, or 8.5%, from a year ago.
The increase mainly reflected an increase in land and property
holdings accompanying the acquisition of the additional 15% equity
interest in Yebisu Garden Place, which more than offset a decrease in
intangible fixed assets related to the amortization of goodwill.
LiabilitiesFinancial liabilities increased ¥38,478 million to ¥257,647 million.
Total liabilities increased ¥36,681 million, or 8.6%, to ¥462,690 mil-
lion, reflecting an increase in bank loans and other financial liabilities,
which were partially offset by a decrease on deposits received.
Management’s Discussion and Analysis
38

Net AssetsRetained earnings increased ¥2,653 million to ¥31,394 million.
Asset growth was supported by an increase in unrealized gains on
securities and in the foreign currency translation adjustment account,
as well as posting of net income for fiscal 2012.
As a result, net assets increased ¥10,171 million from a year earlier
to ¥134,947 million.
Cash FlowsConsolidated cash and cash equivalents as of December 31, 2012
were ¥9,725 million, an increase of ¥667 million, or 7.4%, from the
previous fiscal year-end. Factors behind this increase were as follows.
Cash Flows from Operating ActivitiesNet cash provided by operating activities was ¥29,618 million, ¥7,305
million, or 32.7%, higher the in the previous fiscal year.
The main contributors were income before income taxes and
minority interests of ¥10,512 million and depreciation and amortiza-
tion of ¥25,805 million. These were partially offset by a ¥2,015 million
increase in notes and accounts receivable, a ¥2,955 million decrease
in deposits received, a ¥1,827 million increase in inventories and other
factors.
Cash Flows from Investing ActivitiesInvesting activities used net cash of ¥59,486 million, an increase of
¥8,594 million from the net cash used in the previous fiscal year.
This change mainly reflected payments of ¥1,611 million to
acquire shares of a subsidiary in line with a change in the scope of
consolidation, a ¥51,133 million for purchases of property, plant and
equipment, a ¥2,737 million for purchases of intangibles and other
factors.
Cash Flows from Financing ActivitiesFinancing activities provided net cash of ¥30,159 million, a change of
¥5,914 million from the net cash provided in the previous fiscal year.
This change mainly reflected a net increase in commercial paper of
¥34,000 million, ¥27,879 million from proceeds from long-term debt
and ¥9,960 million from the issuance of bonds. These were partially
offset by a ¥31,489 million repayment of long-term debt and a pay-
ment of ¥10,000 million for redemption of bonds.
Cautionary StatementThe Company’s financial statements in English have not been
audited by independent auditors. However, the original Japanese
financial statements on which they are based have been audited by
independent auditors.
Management IndicatorsThe current ratio decreased 3.8 percentage points from 60.7% to
56.9%. This was the combined result of a ¥9,240 million increase in
total current assets, which mainly reflected the increase in notes and
account receivable, and a ¥30,556 million increase in current liabilities,
which mainly reflected the issuance of commercial paper.
The equity ratio decreased from 22.4% a year earlier to 22.1%,
mainly reflecting an increase in foreign currency translation adjust-
ments as well as an increase of ¥46,852 million in total assets.
Return on equity (ROE) increased from 2.5% to 4.2%, due to the
year-on-year increase in net income.
The debt-to-equity (D/E) ratio, calculated as financial liabilities
divided by net assets, increased from 1.8 to 1.9 in line with the
increase in financial liabilities.
Outlook for 2013In accordance with the Sapporo Group Management Plan 2013–2014,
a rolling two-year plan, the Group will focus on three fundamental
strategies: (1) Creating new opportunities for growth, (2) Challenges
toward growth in all businesses, and (3) Carrying out growth mea-
sures. We regard the next two years as a crucial period for establishing
the foundations that will enable us to achieve our goals and will make
every effort to enhance our corporate value during this period.
Consequently, the Company is forecasting consolidated net sales
of ¥512,000 million, (up 4.0% year on year), operating income of
¥15,300 million (up 6.1% year on year), and net income of ¥5,500 mil-
lion (up 2.0% year on year). Please see pages 20 to 27, Management
Plan 2013–2014 Key Points for details on targets for sales and operat-
ing income by segment, and strategies. From fiscal 2013, the results of
two Group companies—Sapporo Logistics Systems Co., Ltd., which to
date has been included in the Japanese Alcoholic Beverage segment,
and POKKA Logistics Co., Ltd., which was included in the Food &
Soft Drinks segment—will be accounted for in the Other segment.
Similarly, the results of POKKA FOOD (SINGAPORE) PTE. LTD. will be
accounted for in the Restaurants segment instead of the Food & Soft
Drinks segment. The consolidated financial statements for fiscal 2012
have been retroactively adjusted to reflect these changes.
For 2013, the Company plans to maintain annual dividends of ¥7
per share by steadily executing the Sapporo Group Management
Plan, while also making strategic investments and strengthening its
financial foundation.
39SAPPORO HOLDINGS LIMITED Annual Report 2012
Risk FactorsMajor risks that could potentially impact the operating results and
financial position of the Sapporo Group, including stock price, are
found below.
Forward-looking statements in the following text reflect the judg-
ment of management as of December 31, 2012.
Economic ConditionsBecause net sales of the Sapporo Group are mainly affected by
domestic economic trends, the unit price of key products could
decline due to fluctuating shipments of key products and deflationary
trends as a result of economic deterioration caused by changing
economic conditions. Moreover, deteriorating economic conditions
could also lead to a decrease in the value of asset holdings.
High Dependency on Specific Business AreasIn 2012, Japanese Alcoholic Beverages, one of the Sapporo Group’s
core business segments, accounted for 56% of consolidated net sales.
To break away from its high dependency on the Japanese
Alcoholic Beverages business and further increase profitability, the
Group will expand its business activities in overseas markets.
The Group could thus be significantly affected by the performance
of this business.
Overseas Business ActivitiesThe Sapporo Group is aiming to grow earnings by expanding its
business activities in overseas markets. In particular, it is expanding the
alcoholic beverages business in the U.S. and Canada.
In Asia, the Group is conducting business in the beverage and
restaurant fields, mainly in Singapore. With the completion of the
Long An Brewery, it has begun full-scale local production and sales of
beer in Vietnam.
The overseas business activities of the Sapporo Group are subject
to a variety of factors that could adversely affect operating results.
These factors include economic trends, changes in the competitive
landscape, and exchange rate fluctuations, in addition to changes to
regulations governing investment, trade, taxation, foreign exchange
and other areas, differences in business customs and labor relations,
as well as other governmental and social factors.
Food Product SafetyBeyond quality issues originating solely at the Group, quality problems
relating to generally available products and/or raw materials, as well
as food poisoning and other incidents in the restaurants business,
could adversely affect operating results.
OEM Products and Purchased ProductsThe Sapporo Group outsources the manufacturing of some products
to external parties. It also handles products purchased from outside
the Group.
While the Sapporo Group does its best to ensure the quality of
such products, quality problems beyond the control of the Group
could result in the suspension of sales, product recalls and other
actions that may in turn adversely affect operating results.
Raw Material and Supply PricesPrices of certain raw materials and supplies are subject to fluctuations
in market conditions. A sharp increase in these prices could push up
the cost of sales, which may in turn adversely affect operating results.
Capital Investment PlansThe Sapporo Group conducts capital investment and systems
development on an ongoing basis, but related scheduling delays,
investment budget overruns and other factors may adversely affect
operating results.
Leaks of Customer InformationIn the event of the leak of personal information and other related
issues resulting from an unforeseen intrusion of a computer virus,
unauthorized access to information or other incident, the Sapporo
Group could face claims for damages and suffer a decline in its trust-
worthiness. This could have a negative impact on operating results by
increasing costs and reducing earnings.
Credit Risk of CustomersThe collection of receivables may be hindered by such factors as an
unforeseen bankruptcy of customers or investees. This could have a
negative impact on the Group’s operating results.
Impact of Laws and RegulationsThe unanticipated application of laws and regulations to Sapporo
Group businesses in the future could restrict business operations, with
an adverse effect on operating results.
For example, should demand decline due to liquor and
consumption tax increases, or should regulations pertaining to liquor
advertising, selling hours of liquor at liquor stores, or liquor sales
locations spread, factors including expenses required for dealing with
decreased demand and responding to new regulations could have a
negative effect on business performance.
Management’s Discussion and Analysis
40

Risk of Natural DisastersThe Sapporo Group could sustain damage as a result of a large-scale
natural disaster or a secondary disaster. This could have a negative
impact on the Group’s operating results such as by disrupting the
supply of products.
Financial LiabilitiesThe Sapporo Group raises a significant portion of the funds it requires
for various businesses through the issuance of corporate bonds and
borrowings from financial institutions. Accordingly, the Group has a
high balance of financial liabilities relative to total assets. Moreover,
the Group’s financial liabilities may increase further as a result of large-
scale investments accompanying the execution of its growth strategy.
In the event of an increase in market interest rates, or a downgrading
of the Company’s ratings by ratings agencies, the Group’s interest
expenses could increase or fund raising conditions could deteriorate.
This could have a negative impact on the Group’s operating results.
Retirement Benefit ObligationsThe Sapporo Group calculates employees’ retirement benefit
expenses and obligations based on actuarial assumptions, such as the
discount rate, and the expected rate of return on pension assets.
In the event of differences between actual performance and
actuarial assumptions, or a change in these assumptions, the impact
will be recorded as an actuarial difference on a cumulative basis and
amortized over the average remaining period of service of employees
at the time of accrual.
There would consequently be an impact on future retirement
benefit expenses and the amount of retirement benefit obligations
booked. Separately, the net retirement obligation at transition, which
arose upon a change in accounting standards for retirement benefits,
is amortized over 15 years.
Loss on Impairment of Property, Plant and Equipment and Leased AssetsThe Sapporo Group records impairment losses on property, plant and
equipment and leased assets, and on intangibles at the Company and
consolidated subsidiaries in Japan in line with impairment criteria based
on Japanese accounting standards for the impairment of fixed assets.
Overseas, consolidated subsidiaries record impairment losses,
as necessary, based on local accounting standards. However, going
forward, the Sapporo Group may need to book additional impairment
losses if assets meet impairment criteria due to changes in market and
operating conditions or other factors, or the Company may need to
book losses on sales and disposal of property, plant and equipment,
depending on the sales price.
This could adversely affect the Sapporo Group’s operating results
and financial position.
Business and Capital Alliances The Sapporo Group is promoting business and capital alliances with
other companies worldwide as part of efforts to increase its competi-
tiveness with a view to achieving growth in line with the Sapporo
Group Medium-Term Management Plan. However, the Group may
not achieve results as initially anticipated, depending on market
conditions, changes in the business environment and other factors. In
certain situations, the Sapporo Group’s operating results and financial
position may be negatively affected in the event of deterioration
in the business operations, assets and other aspects of an alliance
partner or investee. In addition, the Sapporo Group may record the
amortization of large amounts of goodwill in line with investments, or
may record an impairment loss on goodwill and other assets due to
deterioration in the business results of investees. These factors could
have a negative impact on the Sapporo Group’s operating results and
financial position.
Holding Company RiskSapporo Holdings derives income from brand licensing fees and com-
missions for management guidance, as well as interest and dividends
paid by Group operating companies.
Any deterioration in the financial position of Group operating
companies could result in nonpayment, which could adversely affect
Sapporo Holdings’ business performance.
41SAPPORO HOLDINGS LIMITED Annual Report 2012

Consolidated Balance Sheets(December 31, 2012 and 2011)
Millions of yenThousands of U.S. dollars (Note 1)
ASSETS 2012 2011 2012Current assets:
Cash and cash equivalents ¥ 9,725 ¥ 9,058 $ 112,327
Time deposits 30 147 344
Notes and accounts receivable—trade 83,581 79,340 965,363
Inventories (Note 5) 32,730 28,354 378,037
Allowance for doubtful receivables (287) (387) (3,317)
Deferred tax assets (Note 17) 3,737 4,539 43,163
Other current assets 8,742 7,966 100,969
Total current assets 138,258 129,018 1,596,887
Investments and long-term loans:
Investment securities (Notes 12 and 14) 35,670 31,209 411,990
Long-term loans receivable 9,784 10,143 113,001
Allowance for doubtful receivables (1,387) (1,412) (16,017)
Deferred tax assets (Note 17) 2,041 2,203 23,570
Other investments 15,223 16,251 175,821
61,330 58,394 708,365
Property, plant and equipment (Notes 6 and 14):
Land 115,413 83,826 1,333,026
Buildings and structures 384,996 376,201 4,446,707
Accumulated depreciation (205,156) (201,765) (2,369,554)
Machinery and vehicles 210,465 203,307 2,430,875
Accumulated depreciation (170,804) (163,081) (1,972,788)
Lease assets 19,256 19,151 222,402
Accumulated depreciation (9,470) (9,071) (109,377)
Construction in progress 4,425 2,059 51,112
Other 19,987 20,149 230,853
Accumulated depreciation (16,051) (16,397) (185,389)
Property, plant and equipment, net 353,062 314,379 4,077,869
Intangibles:
Goodwill 37,542 40,148 433,605
Other 7,444 8,845 85,981
44,986 48,993 519,586
¥597,636 ¥550,784 $6,902,706
The accompanying Notes to Consolidated Financial Statements are an integral part of these statements.
42
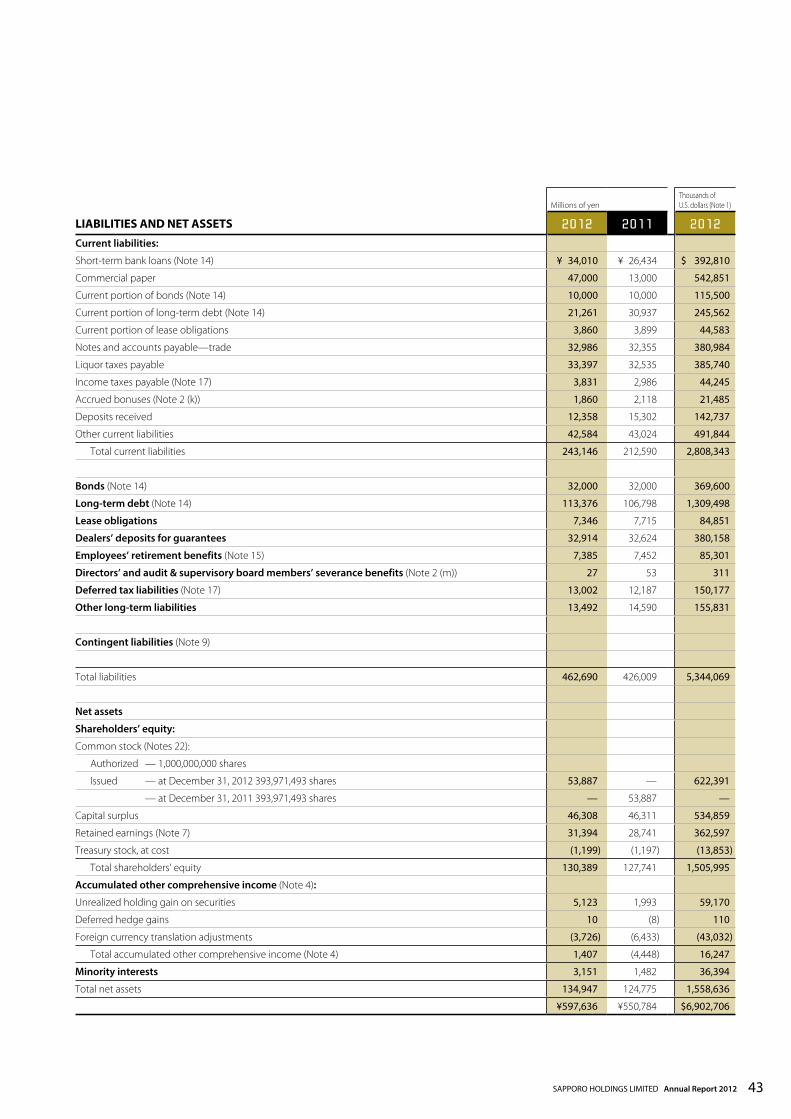
Millions of yenThousands of U.S. dollars (Note 1)
LIABILITIES AND NET ASSETS 2012 2011 2012Current liabilities:
Short-term bank loans (Note 14) ¥ 34,010 ¥ 26,434 $ 392,810
Commercial paper 47,000 13,000 542,851
Current portion of bonds (Note 14) 10,000 10,000 115,500
Current portion of long-term debt (Note 14) 21,261 30,937 245,562
Current portion of lease obligations 3,860 3,899 44,583
Notes and accounts payable—trade 32,986 32,355 380,984
Liquor taxes payable 33,397 32,535 385,740
Income taxes payable (Note 17) 3,831 2,986 44,245
Accrued bonuses (Note 2 (k)) 1,860 2,118 21,485
Deposits received 12,358 15,302 142,737
Other current liabilities 42,584 43,024 491,844
Total current liabilities 243,146 212,590 2,808,343
Bonds (Note 14) 32,000 32,000 369,600
Long-term debt (Note 14) 113,376 106,798 1,309,498
Lease obligations 7,346 7,715 84,851
Dealers’ deposits for guarantees 32,914 32,624 380,158
Employees’ retirement benefits (Note 15) 7,385 7,452 85,301
Directors’ and audit & supervisory board members’ severance benefits (Note 2 (m)) 27 53 311
Deferred tax liabilities (Note 17) 13,002 12,187 150,177
Other long-term liabilities 13,492 14,590 155,831
Contingent liabilities (Note 9)
Total liabilities 462,690 426,009 5,344,069
Net assets
Shareholders’ equity:
Common stock (Notes 22):
Authorized — 1,000,000,000 shares
Issued — at December 31, 2012 393,971,493 shares 53,887 — 622,391
— at December 31, 2011 393,971,493 shares — 53,887 —
Capital surplus 46,308 46,311 534,859
Retained earnings (Note 7) 31,394 28,741 362,597
Treasury stock, at cost (1,199) (1,197) (13,853)
Total shareholders’ equity 130,389 127,741 1,505,995
Accumulated other comprehensive income (Note 4):
Unrealized holding gain on securities 5,123 1,993 59,170
Deferred hedge gains 10 (8) 110
Foreign currency translation adjustments (3,726) (6,433) (43,032)
Total accumulated other comprehensive income (Note 4) 1,407 (4,448) 16,247
Minority interests 3,151 1,482 36,394
Total net assets 134,947 124,775 1,558,636
¥597,636 ¥550,784 $6,902,706
43SAPPORO HOLDINGS LIMITED Annual Report 2012

Consolidated Statements of Income andConsolidated Statements of Comprehensive Income
Consolidated Statements of Income(Three years ended December 31)
Millions of yenThousands of U.S. dollars (Note 1)
2012 2011 2010 2012Net sales ¥492,491 ¥449,453 ¥389,245 $5,688,273
Operating cost and expenses:
Cost of sales 313,117 286,679 261,212 3,616,507
Selling, general and administrative expenses 164,959 143,890 112,630 1,905,274
Operating income 14,415 18,884 15,403 166,493
Other income (expenses):
Interest and dividend income 997 940 1,058 11,520
Interest expense (3,449) (3,558) (3,647) (39,835)
Other, net (Notes 6 and 8) (1,451) (10,425) 4,948 (16,760)
(3,903) (13,043) 2,359 (45,074)
Income before income taxes and minority interests 10,512 5,841 17,762 121,419
Income taxes (Note 17):
Current 5,669 4,115 3,171 65,472
Deferred (318) (1,316) 3,823 (3,669)
5,351 2,798 6,994 61,803
Minority interests 232 123 4 2,680
Net income (Note 22) ¥ 5,394 ¥ 3,165 ¥ 10,773 $ 62,296
The accompanying Notes to Consolidated Financial Statements are an integral part of these statements.
Consolidated Statements of Comprehensive Income (Note 4)(Year ended December 31, 2012 and 2011)
Millions of yenThousands of U.S. dollars (Note 1)
2012 2011 2012Income before minority interests ¥ 5,162 ¥3,042 $ 59,616
Other comprehensive income
Unrealized holding gain on securities 3,131 (960) 36,160
Deferred hedge gains (losses) 9 (0) 106
Foreign currency translation adjustments 2,739 (1,140) 31,636
Share of other comprehensive income of associates accounted for using equity method 50 (130) 573
Total other comprehensive income 5,929 (2,230) 68,474
Comprehensive income ¥11,090 ¥ 812 $128,090
Total comprehensive income attributable to
Owners of the parent ¥11,248 ¥ 998 $129,916
Minority interests (158) (186) (1,826)
The accompanying Notes to Consolidated Financial Statements are an integral part of these statements.
44

Millions of yenThousands of U.S. dollars (Note 1)
2012 2011 2010 2012Shareholders’ equity
Common stock:
Balance at beginning of year ¥53,887 ¥53,887 ¥53,887 $622,391
Changes during the year — — — —
Balance at end of year ¥53,887 ¥53,887 ¥53,887 $622,391
Capital surplus:
Balance at beginning of year ¥46,311 ¥46,316 ¥46,318 $534,890
Disposition of treasury stock (3) (5) (3) (31)
Balance at end of year ¥46,308 ¥46,311 ¥46,316 $534,859
Retained earnings (Note 7):
Balance at beginning of year ¥28,741 ¥28,317 ¥20,287 $331,959
Net income 5,394 3,165 10,773 62,296
Cash dividends (2,741) (2,741) (2,742) (31,659)
Balance at end of year ¥31,394 ¥28,741 ¥28,317 $362,597
Treasury stock, at cost:
Balance at beginning of year ¥ (1,197) ¥ (1,190) ¥ (1,132) $ (13,830)
Purchase of treasury stock (7) (19) (75) (84)
Disposition of treasury stock 5 12 16 62
Balance at end of year ¥ (1,199) ¥ (1,197) ¥ (1,190) $ (13,853)
Accumulated other comprehensive income (Note 4)
Unrealized holding gain on securities:
Balance at beginning of year ¥ 1,993 ¥ 2,985 ¥ 2,638 $ 23,023
Net change during the year 3,130 (992) 348 34,146
Balance at end of year ¥ 5,123 ¥ 1,993 ¥ 2,985 $ 59,170
Deferred hedge gains:
Balance at beginning of year ¥ (8) ¥ (8) ¥ 1 $ (95)
Net change during the year 18 0 (9) 205
Balance at end of year ¥ 10 ¥ (8) ¥ (8) $ 110
Foreign currency translation adjustments (Note 2 (n)):
Balance at beginning of year ¥ (6,433) ¥ (5,259) ¥ (3,627) $ (74,301)
Net change during the year 2,707 (1,174) (1,631) 31,268
Balance at end of year ¥ (3,726) ¥ (6,433) ¥ (5,259) $ (43,032)
Minority interests:
Balance at beginning of year ¥ 1,482 ¥ 1,598 ¥ 219 $ 17,121
Net change during the year 1,669 (115) 1,379 19,274
Balance at end of year ¥ 3,151 ¥ 1,482 ¥ 1,598 $ 36,394
The accompanying Notes to Consolidated Financial Statements are an integral part of these statements.
Consolidated Statements of Shareholders’ Equity(Three years ended December 31)
45SAPPORO HOLDINGS LIMITED Annual Report 2012
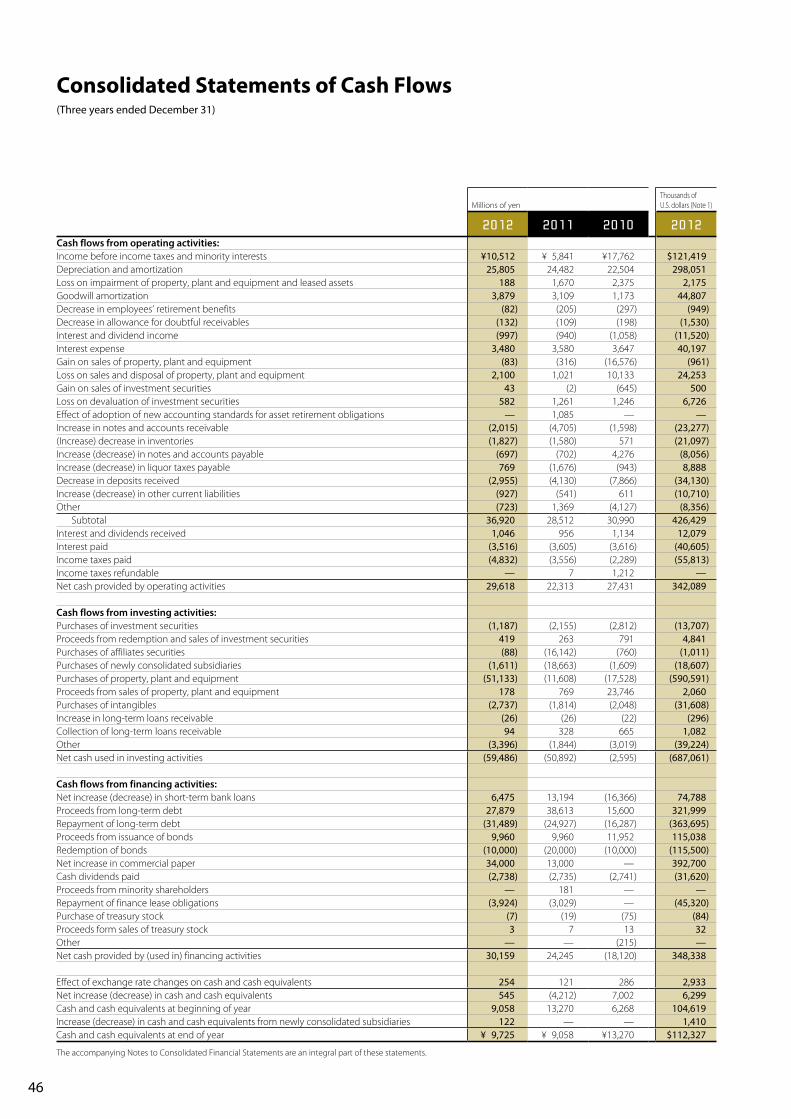
Consolidated Statements of Cash Flows(Three years ended December 31)
Millions of yenThousands of U.S. dollars (Note 1)
2012 2011 2010 2012Cash flows from operating activities: Income before income taxes and minority interests ¥10,512 ¥ 5,841 ¥17,762 $121,419Depreciation and amortization 25,805 24,482 22,504 298,051Loss on impairment of property, plant and equipment and leased assets 188 1,670 2,375 2,175Goodwill amortization 3,879 3,109 1,173 44,807Decrease in employees’ retirement benefits (82) (205) (297) (949)Decrease in allowance for doubtful receivables (132) (109) (198) (1,530)Interest and dividend income (997) (940) (1,058) (11,520)Interest expense 3,480 3,580 3,647 40,197Gain on sales of property, plant and equipment (83) (316) (16,576) (961)Loss on sales and disposal of property, plant and equipment 2,100 1,021 10,133 24,253Gain on sales of investment securities 43 (2) (645) 500Loss on devaluation of investment securities 582 1,261 1,246 6,726Effect of adoption of new accounting standards for asset retirement obligations — 1,085 — —Increase in notes and accounts receivable (2,015) (4,705) (1,598) (23,277)(Increase) decrease in inventories (1,827) (1,580) 571 (21,097)Increase (decrease) in notes and accounts payable (697) (702) 4,276 (8,056)Increase (decrease) in liquor taxes payable 769 (1,676) (943) 8,888Decrease in deposits received (2,955) (4,130) (7,866) (34,130)Increase (decrease) in other current liabilities (927) (541) 611 (10,710)Other (723) 1,369 (4,127) (8,356)
Subtotal 36,920 28,512 30,990 426,429Interest and dividends received 1,046 956 1,134 12,079Interest paid (3,516) (3,605) (3,616) (40,605)Income taxes paid (4,832) (3,556) (2,289) (55,813)Income taxes refundable — 7 1,212 —Net cash provided by operating activities 29,618 22,313 27,431 342,089
Cash flows from investing activities: Purchases of investment securities (1,187) (2,155) (2,812) (13,707)Proceeds from redemption and sales of investment securities 419 263 791 4,841Purchases of affiliates securities (88) (16,142) (760) (1,011)Purchases of newly consolidated subsidiaries (1,611) (18,663) (1,609) (18,607)Purchases of property, plant and equipment (51,133) (11,608) (17,528) (590,591)Proceeds from sales of property, plant and equipment 178 769 23,746 2,060Purchases of intangibles (2,737) (1,814) (2,048) (31,608)Increase in long-term loans receivable (26) (26) (22) (296)Collection of long-term loans receivable 94 328 665 1,082Other (3,396) (1,844) (3,019) (39,224)Net cash used in investing activities (59,486) (50,892) (2,595) (687,061)
Cash flows from financing activities: Net increase (decrease) in short-term bank loans 6,475 13,194 (16,366) 74,788Proceeds from long-term debt 27,879 38,613 15,600 321,999Repayment of long-term debt (31,489) (24,927) (16,287) (363,695)Proceeds from issuance of bonds 9,960 9,960 11,952 115,038Redemption of bonds (10,000) (20,000) (10,000) (115,500)Net increase in commercial paper 34,000 13,000 — 392,700Cash dividends paid (2,738) (2,735) (2,741) (31,620)Proceeds from minority shareholders — 181 — —Repayment of finance lease obligations (3,924) (3,029) — (45,320)Purchase of treasury stock (7) (19) (75) (84)Proceeds form sales of treasury stock 3 7 13 32Other — — (215) —Net cash provided by (used in) financing activities 30,159 24,245 (18,120) 348,338
Effect of exchange rate changes on cash and cash equivalents 254 121 286 2,933Net increase (decrease) in cash and cash equivalents 545 (4,212) 7,002 6,299Cash and cash equivalents at beginning of year 9,058 13,270 6,268 104,619Increase (decrease) in cash and cash equivalents from newly consolidated subsidiaries 122 — — 1,410Cash and cash equivalents at end of year ¥ 9,725 ¥ 9,058 ¥13,270 $112,327
The accompanying Notes to Consolidated Financial Statements are an integral part of these statements.
46
Notes to Consolidated Financial Statements
1. Basis of PresentationThe Company and its domestic consolidated subsidiaries maintain their accounting records and prepare their financial statements in accordance with accounting principles generally accepted in Japan, which are different in certain respects as to the application and dis-closure requirements of International Financial Reporting Standards, and its consolidated foreign subsidiaries, in accordance with that of their country of domicile. The accompanying financial statements have been compiled from the consolidated financial statements prepared by the Company as required by the Financial Instruments and Exchange Act of Japan. The relevant notes have been prepared as additional information. In addition, certain reclassifications have been made to present the accompanying consolidated financial statements in a format which is familiar to readers outside Japan. Furthermore, certain reclassifications of previously reported amounts have been made to reconcile the consolidated financial statements for the years ended December 31, 2010 and 2011 to the 2012 presentation. For the convenience of the reader, the accompanying consoli-dated financial statements as of and for the year ended December 31, 2012 have been translated from yen amounts into U.S. dollar amounts at the rate of ¥86.58=U.S.$1.00, the exchange rate prevailing on December 31, 2012.
2. Summary of Significant Accounting Policies(a) Principles of consolidationThe accompanying consolidated financial statements include the accounts of the Company and its significant subsidiaries. All significant intercompany balances, transactions and profits have been eliminated in consolidation. During the year ended December 31, 2012, the Company established three new subsidiaries, gained two subsidiaries via share acquisitions, gained one subsidiary on the basis of influence, and lost two subsidiaries due to corporate liquidation. Accordingly, the number of consolidated subsidiaries was 58 as of December 31, 2012. The Company’s remaining subsidiaries, whose gross assets, net sales, net income and retained earnings were not significant in the aggregate in relation to comparable balances in the consolidated financial statements, have not been consolidated. Regarding the fiscal years of consolidated subsidiaries, the fiscal year of SILVER SPRINGS CITRUS, INC. ends on September 30. When preparing consolidated financial statements, said account settlement date is used as the date of the financial statements. However, impor-tant transactions that occur up to the consolidated account settle-ment date are adjusted as required. Among consolidated subsidiaries, the fiscal years of SUN POKKA CITRUS, INC. and POKKA AUSTRALIA PTY. LTD. end on January 31. When preparing consolidated financial statements, October 31 is used as the date of the financial statements. However, important transactions that occur up to the consolidated closing date are adjusted as required.
(b) Investments in unconsolidated subsidiaries and affiliatesDuring the year ended December 31, 2012, the Company removed two subsidiaries from the scope of affiliation as a result of consolida-tion. As a result, the Company had made investments in six affiliates accounted for by the equity method as of December 31, 2012. Investments in unconsolidated subsidiaries and affiliates other than those accounted for by the equity method are stated at cost determined by the moving-average method as, in the aggregate, they were not material.
(c) Cash equivalentsAll highly liquid investments with a maturity of three months or less when purchased are considered cash equivalents.
(d) Marketable and investment securitiesSecurities other than those of subsidiaries and affiliates are classified into three categories: trading, held-to-maturity and other securities. Trading securities are carried at fair value, and held-to-maturity securities are carried at amortized cost. Marketable securities classified as other securities are carried at fair value as of the end of the year, with any net unrealized gain or loss included as a separate compo-nent of shareholders’ equity, net of the related taxes. Nonmarketable securities classified as other securities are carried at cost. Cost of securities sold is determined by the moving-average method.
(e) DerivativesDerivatives’ positions are stated at fair value.
(f) InventoriesInventories are stated at cost determined principally by the gross average method.
(g) Property, plant and equipmentProperty, plant and equipment is stated at cost. Depreciation is computed by the declining-balance method over the estimated useful lives of the manufacturing facilities for alcoholic beverages and soft drinks, and by the straight-line method for the real estate assets held and for buildings acquired in Japan subsequent to March 31, 1988. The annual provisions for depreciation have been computed over periods from two to 65 years for buildings and structures, and from two to 17 years for machinery and vehicles. For property and equipment retired or otherwise disposed of, costs and related depreciation are charged to the respective accounts and the net difference, less any amount realized on disposal, is charged to operations. Maintenance and repairs, including minor refurbishments and improvements, are charged to income when incurred.
(h) IntangiblesIntangibles with limited useful lives are amortized by the straight-line method over their estimated useful lives. Software used internally is amortized by the straight-line method over its estimated useful life (5 years) within the Company.
47SAPPORO HOLDINGS LIMITED Annual Report 2012

(i) Lease assetsLease assets are amortized by the straight-line method with the lease period considered to be the useful life and the guaranteed residual value considered to be the residual value. Finance leases other than those that transfer ownership of the leased assets to the lessees, entered into on or before December 31, 2008, are treated in the same way as ordinary operating leases for accounting purposes.
(j) Allowance for doubtful accountsThe allowance for doubtful accounts is estimated as the average percentage of actual historical bad debts, which is then applied to the balance of receivables. In addition, an amount deemed necessary to cover uncollectible receivables is provided for specific doubtful accounts.
(k) Accrued bonusesThe accrual for employees’ bonuses is based on an estimate of the amounts to be paid subsequent to the balance sheet date.
(l) Employees’ retirement benefitsEmployees’ retirement benefits are provided principally at an amount calculated based on the retirement benefit obligation and the fair value of the pension plan assets at the balance sheet date, as adjusted for the unrecognized net retirement benefit obligation at transition, unrecognized actuarial gain or loss, and unrecognized past service cost. The net retirement benefit obligation at transition is being amor-tized over a period of 15 years by the straight line method. Actuarial gain and loss are amortized in the year following the year in which the gain or loss is recognized primarily by the straight-line method over the average remaining years of service of the eligible employees (nine years through 15 years). Past service cost is amortized by the straight-line method over the average remaining years of service of the employees (nine years through 14 years). Further, beginning from the consolidated financial statements for the fiscal year ending December 31, 2014, the Company will apply Accounting Standard for Retirement Benefits (ASBJ Statement No. 26, May 17, 2012) and Guidance on Accounting Standard for Retirement Benefits (ASBJ Guidance No. 25, May 17). In addition, because a transitional arrangement is prescribed in said accounting standard, it will not be applied retroactively to past financial statements. The application of said accounting standards is now being evaluated to determine its effect on the consolidated financial statements.
(m) Directors’ and audit & supervisory board members’ severance benefitsDirectors and audit & supervisory board members of the Company and certain consolidated subsidiaries are customarily entitled to lump-sum severance payments. Provisions for these officers’ severance benefits are made at estimated amounts. Effective the year ended December 31, 2004, the Company and its major subsidiaries abolished their directors’ and Audit & Supervisory Board Members’ severance benefit system. Accordingly, no additional provisions for these severance benefits have been recognized.
(n) Foreign currency translationAll monetary assets and liabilities denominated in foreign currencies, whether long-term or short-term, are translated into Japanese yen at the exchange rates prevailing at the balance sheet date. The resulting exchange gain or loss is credited or charged to income. All assets and liabilities of foreign subsidiaries are translated into Japanese yen at the exchange rates prevailing at the balance sheet date. Revenues and expenses of foreign subsidiaries, on the other hand, are translated into Japanese yen at the average exchange rate for the fiscal year. Any translation differences are included in foreign currency transla-tion adjustments in the net assets section of the balance sheet.
(o) Hedge accountingGain or loss on derivatives positions designated as hedging instru-ments is deferred until the gain or loss on the underlying hedged item is recognized. In addition, if an interest-rate swap of forward foreign exchange contract meets certain conditions, the interest expense is computed at a combined rate and recognized.
(p) Amortization of goodwill and negative goodwillGoodwill is amortized in equal amounts over an appropriate period not to exceed 20 years.
3. Change in Method of Accounting(Method of accounting for sales)Sapporo Beverage Co., Ltd., and POKKA CORPORATION, both subsid-iaries of the Company, were merged on January 1, 2013. In line with this merger, the reportable segments for Soft Drinks and POKKA Group presented in the consolidated accounts for the year ended December 31, 2011 have been integrated into a single segment called “Food & Soft Drinks” from the first quarter of the year ended December 31, 2012. In addition, a portion of the sales incen-tives paid to business partners (wholesalers and retail outlets) on the sales price of flavored-water drinks and food products, which to date have been accounted for under selling, general and administrative expenses, are excluded from reported sales from the year ended December 31, 2012. These changes to accounting methods are applied retroactively to the Company’s financial statements for the fiscal year ending December 31, 2011, and the consolidated financial statements for the full year ending on the same date. As a result, sales, gross profit, and selling, general and administra-tive expenses on the revised financial statements for the fiscal year ending on December 31, 2011, have each been reduced by ¥4,647 million ($53,673 thousand) from the amounts reported before the retroactive application of the new accounting method. Operating income is unaffected by the change.
Notes to Consolidated Financial Statements
48

(Changes in depreciation method)In response to Japan’s recent corporate tax law amendments and effective from the year ended December 31, 2012, the method which some domestic consolidated Group subsidiaries use for depreciation of property, plant, and equipment acquired on or after April 1, 2012 is adjusted to reflect the revised corporate tax code. The impact of this change on the Group’s fiscal year consolidated operating loss, ordinary loss, and the loss before income taxes is immaterial.
(Application of “Accounting Standard for Equity Method of Accounting for Investments” and “Practical Solution on Unification of Accounting Policies Applied to Associates Accounted for Using the Equity Method”)Effective from the year ended December 31, 2011, the Company has applied the “Accounting Standard for Equity Method of Accounting for Investments” (ASBJ Statement No. 16, March 10, 2008) and the “Practical Solution on Unification of Accounting Policies Applied to Associates Accounted for Using the Equity Method” (PITF No. 24, March 10, 2008). The application of this accounting standard and practical solution had no effect on income before income taxes and minority interests for the fiscal year under review.
(Application of Accounting Standard for Asset Retirement Obligations, etc.)Effective from the year ended December 31, 2011, the Company has applied the “Accounting Standard for Asset Retirement Obligations” (ASBJ Statement No. 18, March 31, 2008) and “Guidance on Accounting Standard for Asset Retirement Obligations (ASBJ Guidance No. 21, March 31, 2008). As a result of this change, in the year ended December 31, 2011, operating income was ¥94 million lower, and income before income taxes and minority interests was ¥1,178 million lower than would have been reported previously.
(Application of Partial Amendments to Accounting Standard for Retirement Benefits (Part 3))Effective from the year ended December 31, 2010, the Company has applied the “Partial Amendments to Accounting Standard for Retirement Benefits (Part 3)” (ASBJ Statement No. 19, July 31, 2008). The application of this accounting standard had no effect on oper-ating income, or income before income taxes and minority interests for the fiscal year under review.
(Change in standard for posting balance and cost of completed construction work)Regarding the standard for posting profit related to contracted construction work, effective from the year ended December 31, 2010, the Company has applied “Accounting Standard for Construction Contracts” (ASBJ Statement No. 15, December 27, 2007) and “Guidance on Accounting Standard for Construction Contracts” (ASBJ Statement No. 18, December 27, 2007). For all construction work contracts, includ-ing those present at the beginning of the fiscal year, the Company has applied the percentage-of-completion method (cost-to-cost method used to estimate the rate of progress for construction work) with respect to the portion of ascertainable progress made on such construction work by the end of the fiscal year. For other construction work, the Company has applied the completed-contract method.
4. Changes in Presentation Method(Consolidated balance sheets)Effective the year ended December 31, 2012, “commercial paper,” which was previously included in “other” under “current liabilities,” is individually presented because of its increased importance in mon-etary terms. Accordingly, the consolidated financial statements for the year ended December 31, 2011 have been retroactively adjusted to reflect the change. As a result, ¥56,024 million included in “other” under “current liabilities” in the consolidated balance sheets for the year ended December 31, 2011 was presented as “commercial paper” of ¥13,000 million and “other” of ¥43,024 million.
(Application of Accounting Standard for Accounting Changes and Error Corrections)The Company has adopted the Accounting Standard for Accounting Changes and Error Corrections (ASBJ Statement No. 24, December 4, 2009) and its associated Guidance on Accounting Changes and Error Corrections (ASBJ Guidance No. 24, December 4, 2009) in regards to accounting changes and the revision of errors on past accounts being carried out from the start of the first quarter of the year ended December 31, 2012.
(Application of Accounting Standard for Presentation of Comprehensive Income)Effective from the year ended December 31, 2011, the Company has applied the “Accounting Standard for Presentation of Comprehensive Income” (ASBJ Statement No. 25, June 30, 2010). However, the amounts recorded as accumulated other comprehensive income and total accumulated other comprehensive income for the year ended 2010 correspond to the amounts recorded as valuation and transla-tion adjustments and total valuation and translation adjustments, respectively.
5. InventoriesInventories at December 31, 2012 and 2011 are summarized as follows:
Millions of yenThousands of U.S. dollars (Note 1)
2012 2011 2012
Finished goods and merchandise ¥16,283 ¥13,082 $188,066Real estate for sale 87 87 1,001Work in process 4,289 4,237 49,533Raw materials 10,856 9,899 125,386Supplies 1,216 1,050 14,050
¥32,730 ¥28,354 $378,037
49SAPPORO HOLDINGS LIMITED Annual Report 2012

6. Loss on Impairment of Property, Plant and EquipmentThe Company and its consolidated subsidiaries recorded impairment losses on the following asset groups for the year ended December 31, 2012:
Location Use Classification Millions of yenThousands of U.S. dollars (Note 1)
Sapporo Lion Ltd.Restaurants for business (Toshima-ku, Tokyo and other)
Restaurants for operations Buildings ¥ 98 $1,128Machinery 28 318
¥125 $1,446
Pokka Create Co., Ltd.Restaurants for business (Minato-ku, Tokyo and other)
Restaurants for operations Buildings ¥ 23 $ 261Machinery 0 5Other 18 206
¥ 40 $ 472
Sapporo Fine Foods Co., Ltd. (Oota-shi, Gunma) Food manufacturing Buildings ¥ 0 $ 4Machinery 8 95Other 4 50
¥ 13 $ 149
Sun Pokka Co., Ltd. (Hatori-gun, Gifu and other) Idle real estate Land ¥ 9 $ 108¥ 9 $ 108¥188 $2,175
The Company and its consolidated subsidiaries recorded impairment losses on the following asset groups for the year ended December 31, 2011:
Location Use Classification Millions of yen
Sapporo Breweries Ltd. (Kitakanbara-gun, Niigata) Idle real estate Land ¥ 309¥ 309
Sapporo Lion Ltd.Restaurants for business (Chiyoda-ku, Tokyo and other)
Restaurants for operations Buildings ¥ 239Machinery 22Other 54
¥ 315
POKKA Corporation and its subsidiaryRestaurants for business (Shibuya-ku, Tokyo and other)
Restaurants for operations Buildings ¥ 66Other 4
¥ 70
Sapporo Real Estate Co., Ltd. (Sapporo-shi, Hokkaido) Real estate for lease Buildings ¥ 9¥ 9
Sapporo Fine Foods Co., Ltd. (Oota-shi, Gunma) Food manufacturing facilities Buildings ¥ 227Machinery 40Lease 628Other 72
¥ 966¥1,670
Notes to Consolidated Financial Statements
50

The Company and its consolidated subsidiaries recorded impairment losses on the following asset groups for the year ended December 31, 2010:
Location Use Classification Millions of yen
Sapporo Breweries Ltd. (Nasu-gun, Tochigi and other) Real estate for lease Buildings ¥ 409¥ 409
Sapporo Lion Ltd. Restaurants for operations Buildings ¥ 542Restaurants for business (Minato-ku, Tokyo and other) Machinery 50
Other 33¥ 625
Sapporo Real Estate Co., Ltd. (Sapporo-shi, Hokkaido) Real estate for lease Buildings ¥ 156¥ 156
SLEEMAN BREWERIES LTD. (Ontario, Canada) Other Goodwill ¥1,123Other 61
¥1,184¥2,375
The Company and its consolidated subsidiaries decided the asset group in consideration of the division in management accounting. Idle real estate and real estate for lease are grouped with each real estate, and the restaurants are mainly grouped with each store. The asset groups for food manufacturing facilities are for each respective business. Real estate for lease has been written down to the recoverable amount as it is expected to be difficult to recover the investment due to declin-ing profitability. An impairment loss has been booked for the amount of the write-down. For restaurants for operations, the amount by which the carrying amount of these assets exceeds the expected present value of these assets is recognized as an impairment loss because the carrying amount of these assets may not be recoverable due to poor profitability. Food manufacturing facilities have been written down to the recoverable amount as it is expected to be difficult to recover the investment due to declining profitability. An impairment loss has been booked for the amount of the write-down. The recoverable amount is measured by the net selling cost and the value in use, with the net selling cost determined based on an appraisal value provided by a real estate appraisal company. The value in use is calculated based on future cash flows discounted by a certain discount rate. The discount rate was 6.5% in 2012, 6.3% in 2011 and 7.6% in 2010.
7. Shareholders’ EquityRetained earnings include a legal reserve provided in accordance with the provisions of the Commercial Code. This reserve is not available for the payment of dividends, but it may be used to reduce or eliminate a deficit by resolution of the shareholders or may be transferred to common stock by resolution of the Board of Directors.
51SAPPORO HOLDINGS LIMITED Annual Report 2012

8. Other Income (Expenses)“Other income (expenses)—Other, net” for each of the three years in the period ended December 31, 2012 consisted of the following:
Millions of yenThousands of U.S. dollars (Note 1)
2012 2011 2010 2012
Gain on gift voucher redemptions ¥ 570 ¥ 511 ¥ 677 $ 6,587Equity in income of affiliates 181 33 611 2,088Foreign exchange gain 536 — — 6,186Gain on sales of property, plant and equipment 83 316 16,576 961Gain on sales of investment securities 21 25 645 248Reversal of provision for doubtful receivables — — 62 —Reversal of removal costs — — 569 —Settlement received — 262 — —Loss on disposal of property, plant and equipment (2,088) (998) (1,724) (24,115)Loss on sales of property, plant and equipment (12) (23) (8,410) (138)Loss on impairment of property, plant and equipment (188) (1,670) (2,375) (2,175)
Devaluation of marketable securities and investments (582) (1,261) (1,246) (6,726)Loss on sales of investment securities (65) (24) — (748)Business reorganization costs (346) — (664) (4,001)Effect of adoption of new accounting standards for asset retirement obligations — (1,085) — —Compensation expenses — (268) — —Loss on phased acquisition — (567) — —Loss on change in equity — (244) — —Disaster losses — (5,431) — —Other 439 (3) 226 5,073
¥(1,451) ¥(10,425) ¥ 4,948 $(16,760)
9. Contingent LiabilitiesContingent liabilities at December 31, 2012 and 2011 are summarized as follows:
Millions of yenThousands of U.S. dollars (Note 1)
2012 2011 2012
Guarantee of loans, principally loans for employees’ housing ¥832 ¥929 $9,606
10. Leases(a) Finance leasesi) LesseeFinance leases other than those that transfer ownership of the leased assets to the lessees Description of lease assets 1. Property, plant and equipment
Fixtures (other) for sales purposes and vending machines (other) 2. Intangible fixed assets
Software Finance leases other than those that transfer ownership of the leased assets to the lessees, entered into on or before December 31, 2008, continue to be treated in the same way as ordinary operating leases for accounting purposes. Details are summarized as follows:
Millions of yenThousands of U.S. dollars (Note 1)
2012 2011 2012
Acquisition costs:Machinery and vehicles ¥ 282 ¥ 548 $ 3,262Other 1,237 2,714 14,289
¥1,520 ¥3,261 $17,551
Accumulated depreciation:Machinery and vehicles ¥ 251 ¥ 460 $ 2,894Other 1,046 2,042 12,082
¥1,297 ¥2,503 $14,976
Accumulated loss on impairment:Machinery and vehicles ¥ — ¥ — $ —Other — 73 —
¥ — ¥ 73 $ —
Net book value:Machinery and vehicles ¥ 32 ¥ 87 $ 368Other 191 599 2,207
¥ 223 ¥ 686 $ 2,575
Lease payments relating to finance leases accounted for as operating leases amounted to ¥450 million ($5,196 thousand) and ¥1,035 mil-lion, which equaled the corresponding depreciation on the respective leased assets computed by the straight-line method over the lease terms for the years ended December 31, 2012 and 2011, respectively. There was no recorded loss on impairment of leased assets for the years ended December 31, 2012 and 2011. Reversals of allowance for impairment loss on leased properties was ¥85 million ($983 thousand) and ¥192 million for the year ended December 31, 2012 and 2011. The amount of depreciation equivalents was ¥365 million ($4,213 thousand) and ¥843 million for the years ended December 31, 2012 and 2011.
Notes to Consolidated Financial Statements
52

Future minimum lease payments, including the interest portion thereon, subsequent to December 31, 2012 and 2011 for finance lease transactions accounted for as operating leases are summarized as follows:
Millions of yenThousands of U.S. dollars (Note 1)
Year ended December 31, 2012 2011 2012
Due within one year ¥200 ¥528 $2,306Due after one year 23 230 268Total ¥223 ¥758 $2,575
(b) Operating leasesFuture minimum lease payments subsequent to December 31, 2012 and 2011 for operating leases are summarized as follows:
i) Lessee
Millions of yenThousands of U.S. dollars (Note 1)
Year ended December 31, 2012 2011 2012
Due within one year ¥2,416 ¥ 3,278 $27,905Due after one year 6,205 7,458 71,666Total ¥8,621 ¥10,736 $99,571
ii) Lessor
Millions of yenThousands of U.S. dollars (Note 1)
Year ended December 31, 2012 2011 2012
Due within one year ¥ 3,625 ¥ 3,456 $ 41,873Due after one year 14,546 15,413 168,012Total ¥18,172 ¥18,869 $209,885
11. Financial Instruments(a) Matters related to financial instrumentsi) Group policy regarding financial instrumentsThe Sapporo Group procures the funds it requires mainly through borrowings from banks and the issue of corporate bonds. Any temporary surpluses are then invested in highly secure, highly liquid financial assets. Short-term operating capital is procured through bank loans and commercial paper. Derivatives are not used for speculative purposes, but rather are used mainly to mitigate exposure to risks stemming from exchange rate and interest rate volatility.
ii) Breakdown of financial instruments and related risksOperating receivables, such as notes and accounts receivable, are exposed to customer credit risks. To cope with these risks, the Sapporo Group, in line with internal regulations, engages in due date control and balance management for each respective business partner. Marketable securities and investment securities mainly consist of stocks of companies with which the Group has business relations and the investment of temporary surpluses in bonds. These securities are exposed to risks stemming from market price volatility. The Sapporo Group periodically evaluates the market value of these stocks and bonds. The Group also makes long-term loans to business partners and other entities. Payables, such as notes and accounts payable, are operating liabilities and due for payment within one year.
Short-term borrowings and commercial paper consist mainly of operating funds procured for business transactions. Long-term debt and corporate bonds are funds procured mainly for capital investment pur-poses. Long-term debt is exposed to risks stemming from interest-rate and foreign exchange volatility. For certain long-term debt, the Sapporo Group uses derivative transactions (interest-rate swaps and currency swaps) as a hedge against risks stemming from interest-rate volatility. Currency-related derivative transactions consist of foreign exchange contracts and currency swap transactions. Interest rate derivative transactions are interest rate swaps. Derivative financial instruments consist of commodity futures and commodity option transactions.
iii) Risk management system for financial instruments ① Management of credit risks
(risks associated with default, etc., by business partners) Regarding operating receivables and long-term loans, the
Company and its major consolidated subsidiaries, in line with internal rules of conduct at each Company, periodically monitor the status of main business partners via the executive department of each business division.
Along with managing due dates and balances for each partner, the Company and its major subsidiaries take steps to preventatively assess and minimize losses from instances in which the recovery of receivables or loans may become doubtful due to deterioration, etc., in financial condition.
In derivative transactions, the Company and its major subsidiaries, based on standards of internal control, only enter into contracts with financial institutions possessing high credit ratings. These controls are followed as a rule to prevent the emergence of possible credit risks.
② Management of market risks (risks from exchange-rate and interest-rate volatility)
With regard to operating receivables and payables denominated in foreign currencies, the Company and certain of its subsidiaries use forward foreign exchange contracts to limit to within a certain scope risks stemming from exchange-rate volatility. Interest rate swaps are also used to control volatility risks involved in the inter-est rates on borrowings.
To mitigate risks associated with foreign currency transactions, currency swap transactions are used. Commodity futures and commodity option transactions are used to hedge against the risk of fluctuating raw material purchase prices to limit such risk within a specified range.
For marketable and investment securities, the Company and its major subsidiaries periodically assess the market value of the securities and the financial condition, etc. of the issuer (business partners), and, as necessary, review the holding status of such securities, taking into account their relationship with the business partner in question.
Derivative transactions are executed and managed pursuant to standards of internal control. These controls clearly stipulate matters pertaining to derivatives, including their purpose, product range, transaction counterparties, settlement approval procedures, the segregation of duties within executive departments, and the system for reporting such transactions. The balance and status of
53SAPPORO HOLDINGS LIMITED Annual Report 2012
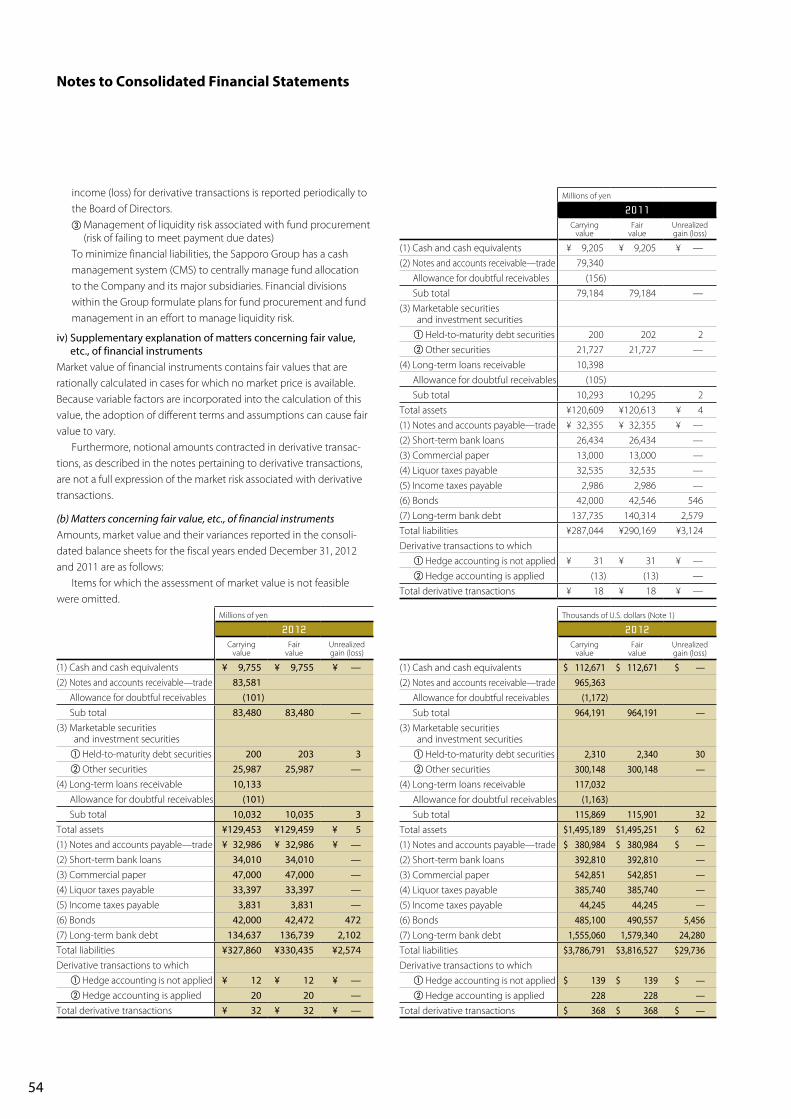
income (loss) for derivative transactions is reported periodically to the Board of Directors.
③ Management of liquidity risk associated with fund procurement (risk of failing to meet payment due dates)
To minimize financial liabilities, the Sapporo Group has a cash management system (CMS) to centrally manage fund allocation to the Company and its major subsidiaries. Financial divisions within the Group formulate plans for fund procurement and fund management in an effort to manage liquidity risk.
iv) Supplementary explanation of matters concerning fair value, etc., of financial instruments
Market value of financial instruments contains fair values that are rationally calculated in cases for which no market price is available. Because variable factors are incorporated into the calculation of this value, the adoption of different terms and assumptions can cause fair value to vary. Furthermore, notional amounts contracted in derivative transac-tions, as described in the notes pertaining to derivative transactions, are not a full expression of the market risk associated with derivative transactions.
(b) Matters concerning fair value, etc., of financial instrumentsAmounts, market value and their variances reported in the consoli-dated balance sheets for the fiscal years ended December 31, 2012 and 2011 are as follows: Items for which the assessment of market value is not feasible were omitted.
Millions of yen
2012Carrying
valueFair
valueUnrealized gain (loss)
(1) Cash and cash equivalents ¥ 9,755 ¥ 9,755 ¥ —(2) Notes and accounts receivable—trade 83,581
Allowance for doubtful receivables (101)Sub total 83,480 83,480 —
(3) Marketable securities and investment securities ① Held-to-maturity debt securities 200 203 3② Other securities 25,987 25,987 —
(4) Long-term loans receivable 10,133Allowance for doubtful receivables (101)Sub total 10,032 10,035 3
Total assets ¥129,453 ¥129,459 ¥ 5(1) Notes and accounts payable—trade ¥ 32,986 ¥ 32,986 ¥ —(2) Short-term bank loans 34,010 34,010 —(3) Commercial paper 47,000 47,000 —(4) Liquor taxes payable 33,397 33,397 —(5) Income taxes payable 3,831 3,831 —(6) Bonds 42,000 42,472 472(7) Long-term bank debt 134,637 136,739 2,102Total liabilities ¥327,860 ¥330,435 ¥2,574Derivative transactions to which
① Hedge accounting is not applied ¥ 12 ¥ 12 ¥ —② Hedge accounting is applied 20 20 —
Total derivative transactions ¥ 32 ¥ 32 ¥ —
Millions of yen
2011Carrying
valueFair
valueUnrealized gain (loss)
(1) Cash and cash equivalents ¥ 9,205 ¥ 9,205 ¥ —(2) Notes and accounts receivable—trade 79,340
Allowance for doubtful receivables (156)Sub total 79,184 79,184 —
(3) Marketable securities and investment securities ① Held-to-maturity debt securities 200 202 2② Other securities 21,727 21,727 —
(4) Long-term loans receivable 10,398Allowance for doubtful receivables (105)Sub total 10,293 10,295 2
Total assets ¥120,609 ¥120,613 ¥ 4(1) Notes and accounts payable—trade ¥ 32,355 ¥ 32,355 ¥ —(2) Short-term bank loans 26,434 26,434 —(3) Commercial paper 13,000 13,000 —(4) Liquor taxes payable 32,535 32,535 —(5) Income taxes payable 2,986 2,986 —(6) Bonds 42,000 42,546 546(7) Long-term bank debt 137,735 140,314 2,579Total liabilities ¥287,044 ¥290,169 ¥3,124Derivative transactions to which
① Hedge accounting is not applied ¥ 31 ¥ 31 ¥ —② Hedge accounting is applied (13) (13) —
Total derivative transactions ¥ 18 ¥ 18 ¥ —
Thousands of U.S. dollars (Note 1)
2012Carrying
valueFair
valueUnrealized gain (loss)
(1) Cash and cash equivalents $ 112,671 $ 112,671 $ —(2) Notes and accounts receivable—trade 965,363
Allowance for doubtful receivables (1,172)Sub total 964,191 964,191 —
(3) Marketable securities and investment securities ① Held-to-maturity debt securities 2,310 2,340 30② Other securities 300,148 300,148 —
(4) Long-term loans receivable 117,032Allowance for doubtful receivables (1,163)Sub total 115,869 115,901 32
Total assets $1,495,189 $1,495,251 $ 62(1) Notes and accounts payable—trade $ 380,984 $ 380,984 $ —(2) Short-term bank loans 392,810 392,810 —(3) Commercial paper 542,851 542,851 —(4) Liquor taxes payable 385,740 385,740 —(5) Income taxes payable 44,245 44,245 —(6) Bonds 485,100 490,557 5,456(7) Long-term bank debt 1,555,060 1,579,340 24,280Total liabilities $3,786,791 $3,816,527 $29,736Derivative transactions to which
① Hedge accounting is not applied $ 139 $ 139 $ —② Hedge accounting is applied 228 228 —
Total derivative transactions $ 368 $ 368 $ —
Notes to Consolidated Financial Statements
54

i) Methods for determining market value of financial instruments and matters concerning marketable securities and derivative transactions
<Assets>(1) Cash and cash equivalents, (2) Notes and accounts receivableBook value is used since the variance between market value and book value is small due to the settlement of these accounts in the near future.(3) Marketable and investment securitiesIn determining market value, the stock market price is used for stocks. In the absence of a market price quotation, fair value on public and corporate bonds is determined as follows. Such bonds are first sorted in sets according to maturity and credit rating. Yield on a government bond with a similar maturity or another appropriate indicator is then applied as a benchmark, and a spread taking into account credit rat-ing and maturity of a set of bonds is added on top of the benchmark rate. This rate approximating the future cash flow of that set of bonds is then applied as the discount rate in calculating the set’s present value. For matters pertaining to respective marketable securities to be held-to-maturity, refer to “12. Marketable Securities and Investment Securities” in the Notes to Consolidated Financial Statements.(4) Long-term loans receivableWithin the Sapporo Group, the fair value of long-term loans receiv-able is calculated as follows. Loans are first sorted in sets according to maturity and credit risk. Yield on a government bond with a similar maturity or another appropriate indicator is then applied as a benchmark, and a spread taking into account the credit risk and maturity of a set of loans is added on top of the benchmark rate. This rate approximating future cash flow of that set of loans is then applied as the discount rate in calculating the set’s present value. The fair value of potentially doubtful receivables is calculated either at present value using the same discount rate formula, or based on the projected amount of collateral or guarantees deemed recoverable.<Liabilities>(1) Accounts payable, (2) Short-term bank loans, (3) Commercial paper, (4) Liquor taxes payable, and (5) Income taxes payableBook value is used since the variance between market value and book value is small due to the short-term settlement of these accounts.(6) Corporate bondsThe market value of bonds issued by the Company is calculated based on the market price for bonds that have market prices.(7) Long-term debtFor long-term debt, the method for determining fair value is to discount the sum total of the outstanding principal and interest by the estimated interest-rate cost of refinancing it. Long-term bank loans based on variable interest rates are subject to special procedures for interest rate swaps and allocation proce-dures for currency swaps. This is calculated by discounting the sum total amount of principal and interest, with said interest rate swaps and currency swaps treated as one, at a reasonably estimated interest rate that applies when refinancing.
ii) Financial instruments for which the assessment of market value is not feasible
Millions of yenThousands of U.S. dollars (Note 1)
2012 2011 2012Carrying
valueCarrying
valueCarrying
value
Unlisted stocks, etc. ¥ 9,803 ¥ 9,282 $113,220Dealers’ deposits for guarantees 32,914 32,624 380,158
iii) Estimate of monetary claims and maturing marketable securities due for redemption after the consolidated account settlement
Millions of yen
2012
Inside one year
After one year
and inside five years
After five years and inside ten years
After ten years
Cash and cash equivalents ¥ 7,354 ¥ — ¥ — ¥—Notes and accounts receivable—trade 83,581 — — —Marketable securities and investment securities
Held-to-maturity debt securities 100 100 — —
Long-term loans receivable 349 9,356 410 18Total ¥91,384 ¥9,456 ¥410 ¥18
Thousands of U.S. dollars (Note 1)
2012
Inside one year
After one year
and inside five years
After five years and inside ten years
After ten years
Cash and cash equivalents $ 84,938 $ — $ — $ —Notes and accounts receivable—trade 965,363 — — —Marketable securities and investment securities
Held-to-maturity debt securities 1,155 1,155 — —
Long-term loans receivable 4,031 108,059 4,738 203Total $1,055,487 $109,214 $4,738 $203
Millions of yen
2011
Inside one year
After one year
and inside five years
After five years and inside ten years
After ten years
Cash and cash equivalents ¥ 8,293 ¥ — ¥ — ¥—Notes and accounts receivable—trade 79,340 — — —Marketable securities and investment securities
Held-to-maturity debt securities — 200 — —
Long-term loans receivable 255 9,515 610 17Total ¥87,888 ¥9,715 ¥610 ¥17
55SAPPORO HOLDINGS LIMITED Annual Report 2012

12. Marketable Securities and Investment Securities(a) Trading securitiesNo relevant items as of December 31, 2012 and 2011.
(b) Held-to-maturity debt securitiesThe aggregate carrying value, fair value, gross unrealized gain and loss on held-to-maturity debt securities whose fair value was determinable at December 31, 2012 and 2011 are summarized as follows:
Millions of yen
2012Carrying
valueFair
valueUnrealized gain (loss)
Securities whose fair value exceeds their carrying value:
Government and municipal bonds ¥ — ¥ — ¥—Corporate bonds 200 203 3Other — — —
Subtotal ¥200 ¥203 ¥ 3
Thousands of U.S. dollars (Note 1)
2012Carrying
valueFair
valueUnrealized gain (loss)
Securities whose fair value exceeds their carrying value:
Government and municipal bonds $ — $ — $—Corporate bonds 2,310 2,340 30Other — — —
Subtotal $2,310 $2,340 $30
Millions of yen
2011Carrying
valueFair
valueUnrealized gain (loss)
Securities whose fair value exceeds their carrying value:
Government and municipal bonds ¥ — ¥ — ¥—Corporate bonds 200 202 2Other — — —
Subtotal ¥200 ¥202 ¥ 2
(c) Other securitiesThe aggregate acquisition cost, carrying value, gross unrealized gain and loss on other securities whose fair value was determinable at December 31, 2012 and 2011 are summarized as follows: Unlisted stocks have no discernable market price, making any assessment of market value unfeasible. Such stocks have subse-quently been omitted from the chart of other securities below.
Millions of yen
2012Carrying
valueAcquisition
costUnrealized gain (loss)
Securities whose carrying value exceeds their acquisition cost:
Stock ¥20,637 ¥10,943 ¥ 9,693Debt securities 16 16 0Other — — —
Subtotal ¥20,653 ¥10,959 ¥ 9,693
Securities whose acquisition cost exceeds their carrying value:
Stock ¥ 5,334 ¥ 7,582 ¥(2,248)Debt securities — — —Other — — —
Subtotal ¥ 5,334 ¥ 7,582 ¥(2,248)Total ¥25,987 ¥18,541 ¥ 7,446
Thousands of U.S. dollars (Note 1)
2012Carrying
valueAcquisition
costUnrealized gain (loss)
Securities whose carrying value exceeds their acquisition cost:
Stock $238,353 $126,394 $111,959Debt securities 185 185 0Other — — —
Subtotal $238,538 $126,578 $111,959
Securities whose acquisition cost exceeds their carrying value:
Stock $ 61,610 $ 87,573 $ (25,964)Debt securities — — —Other — — —
Subtotal $ 61,610 $ 87,573 $ (25,964)Total $300,148 $214,152 $ 85,996
Millions of yen
2011Carrying
valueAcquisition
costUnrealized gain (loss)
Securities whose carrying value exceeds their acquisition cost:
Stock ¥13,022 ¥ 7,472 ¥ 5,551Debt securities — — —Other — — —
Subtotal ¥13,022 ¥ 7,472 ¥ 5,551
Securities whose acquisition cost exceeds their carrying value:
Stock ¥ 8,705 ¥11,183 ¥(2,479)Debt securities — — —Other — — —
Subtotal ¥ 8,705 ¥11,183 ¥(2,479)Total ¥21,727 ¥18,655 ¥ 3,072
Notes to Consolidated Financial Statements
56
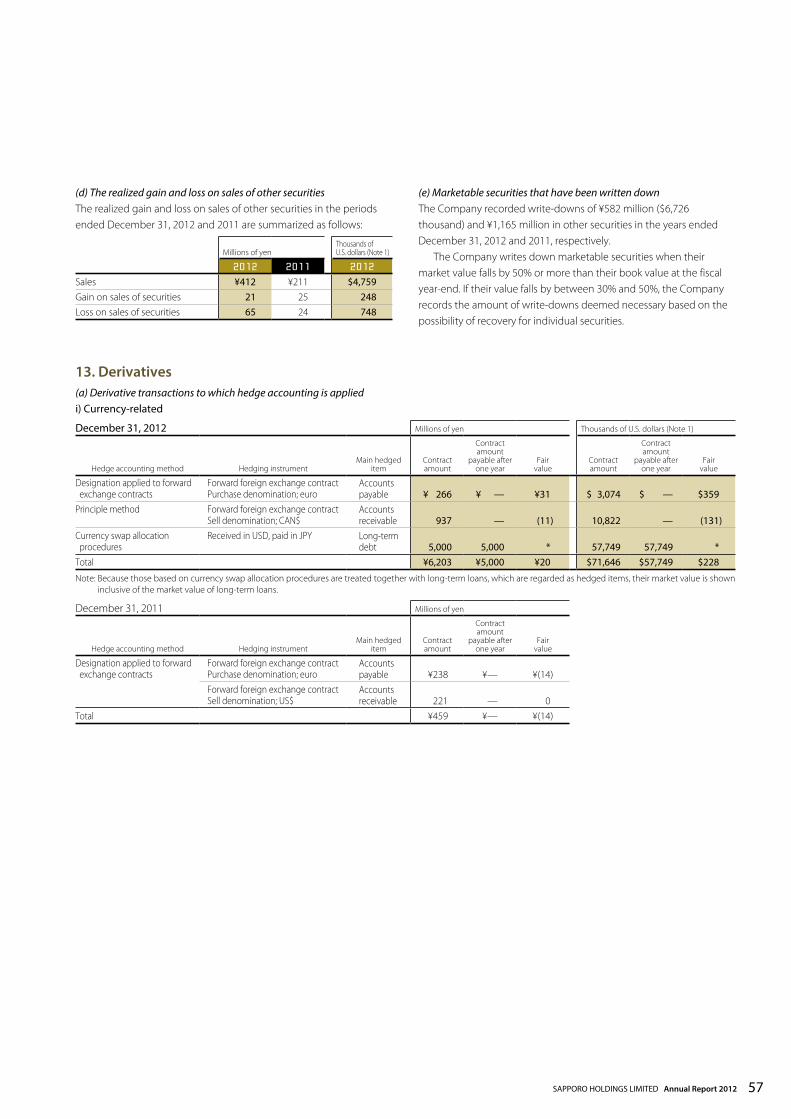
(d) The realized gain and loss on sales of other securitiesThe realized gain and loss on sales of other securities in the periods ended December 31, 2012 and 2011 are summarized as follows:
Millions of yenThousands of U.S. dollars (Note 1)
2012 2011 2012
Sales ¥412 ¥211 $4,759Gain on sales of securities 21 25 248Loss on sales of securities 65 24 748
(e) Marketable securities that have been written downThe Company recorded write-downs of ¥582 million ($6,726 thousand) and ¥1,165 million in other securities in the years ended December 31, 2012 and 2011, respectively. The Company writes down marketable securities when their market value falls by 50% or more than their book value at the fiscal year-end. If their value falls by between 30% and 50%, the Company records the amount of write-downs deemed necessary based on the possibility of recovery for individual securities.
13. Derivatives(a) Derivative transactions to which hedge accounting is appliedi) Currency-related
December 31, 2012 Millions of yen Thousands of U.S. dollars (Note 1)
Hedge accounting method Hedging instrument Main hedged
itemContract amount
Contract amount
payable after one year
Fair value
Contract amount
Contract amount
payable after one year
Fair value
Designation applied to forward exchange contracts
Forward foreign exchange contractPurchase denomination; euro
Accounts payable ¥ 266 ¥ — ¥31 $ 3,074 $ — $359
Principle method Forward foreign exchange contractSell denomination; CAN$
Accounts receivable 937 — (11) 10,822 — (131)
Currency swap allocation procedures
Received in USD, paid in JPY Long-term debt 5,000 5,000 * 57,749 57,749 *
Total ¥6,203 ¥5,000 ¥20 $71,646 $57,749 $228
Note: Because those based on currency swap allocation procedures are treated together with long-term loans, which are regarded as hedged items, their market value is shown inclusive of the market value of long-term loans.
December 31, 2011 Millions of yen
Hedge accounting method Hedging instrument Main hedged
itemContract amount
Contract amount
payable after one year
Fair value
Designation applied to forward exchange contracts
Forward foreign exchange contractPurchase denomination; euro
Accounts payable ¥238 ¥— ¥(14)
Forward foreign exchange contractSell denomination; US$
Accounts receivable 221 — 0
Total ¥459 ¥— ¥(14)
57SAPPORO HOLDINGS LIMITED Annual Report 2012

ii) Interest rate-related
December 31, 2012 Millions of yen Thousands of U.S. dollars (Note 1)
Hedge accounting method Hedging instrument Main hedged
itemContract amount
Contract amount
payable after one year
Fair value
Contract amount
Contract amount
payable after one year
Fair value
Special treatment for interest rate swaps
Interest rate swapsReceive variable rate, pay fixed rate
Long-term debt ¥43,278 ¥42,867 * $499,863 $495,116 *
Total ¥43,278 ¥42,867 — $499,863 $495,116 —
December 31, 2011 Millions of yen
Hedge accounting method Hedging instrument Main hedged
itemContract amount
Contract amount
payable after one year
Fair value
Special treatment for interest rate swaps
Interest rate swapsReceive variable rate, pay fixed rate
Long-term debt ¥47,456 ¥27,470 *
Total ¥47,456 ¥27,470 —
Note: Interest rate swaps backing long-term debts as hedges are subject to special treatment. Their fair value is recorded in conjunction with the long-term debts they back.
(b) Derivative transactions to which hedge accounting is not appliedi) Currency-related
December 31, 2012 Millions of yen Thousands of U.S. dollars (Note 1)
Hedge accounting method Hedging instrument
Contract amount
Contract amount
payable after one year
Fair value
Unrealized gain (loss)
Contract amount
Contract amount
payable after one year
Fair value
Unrealized gain (loss)
Transactions other than market transactions
Forward foreign exchange contractPurchase denomination; US$ ¥706 ¥706 ¥1 ¥1 $ 8,155 $8,155 $14 $14Forward foreign exchange contractSell denomination; US$ 173 — 1 1 1,995 — 6 6
Total ¥879 ¥706 ¥2 ¥2 $10,150 $8,155 $20 $20
December 31, 2011 Millions of yen
Hedge accounting method Hedging instrument
Contract amount
Contract amount
payable after one year
Fair value
Unrealized gain (loss)
Transactions other than market transactions
Forward foreign exchange contractPurchase denomination; US$ ¥601 ¥601 ¥27 ¥27Forward foreign exchange contractSell denomination; US$ 306 — 4 4
Total ¥908 ¥601 ¥31 ¥31
ii) Commodity-related
December 31, 2012 Millions of yen Thousands of U.S. dollars (Note 1)
Hedge accounting method Hedging instrument
Contract amount
Contract amount
payable after one year
Fair value
Unrealized gain (loss)
Contract amount
Contract amount
payable after one year
Fair value
Unrealized gain (loss)
Market transactions Commodity option contract Purchase denomination; Call ¥ 9 ¥— ¥ (4) ¥ (4) $ 98 $— $ (49) $ (49)Sell denomination; Put 11 — 6 6 122 — 66 66Commodity future tradingPurchase denomination 325 — 9 9 3,755 — 102 102
Total ¥344 ¥— ¥10 ¥10 $3,976 $— $119 $119
Note: No relevant transaction as of December 31, 2011
Notes to Consolidated Financial Statements
58
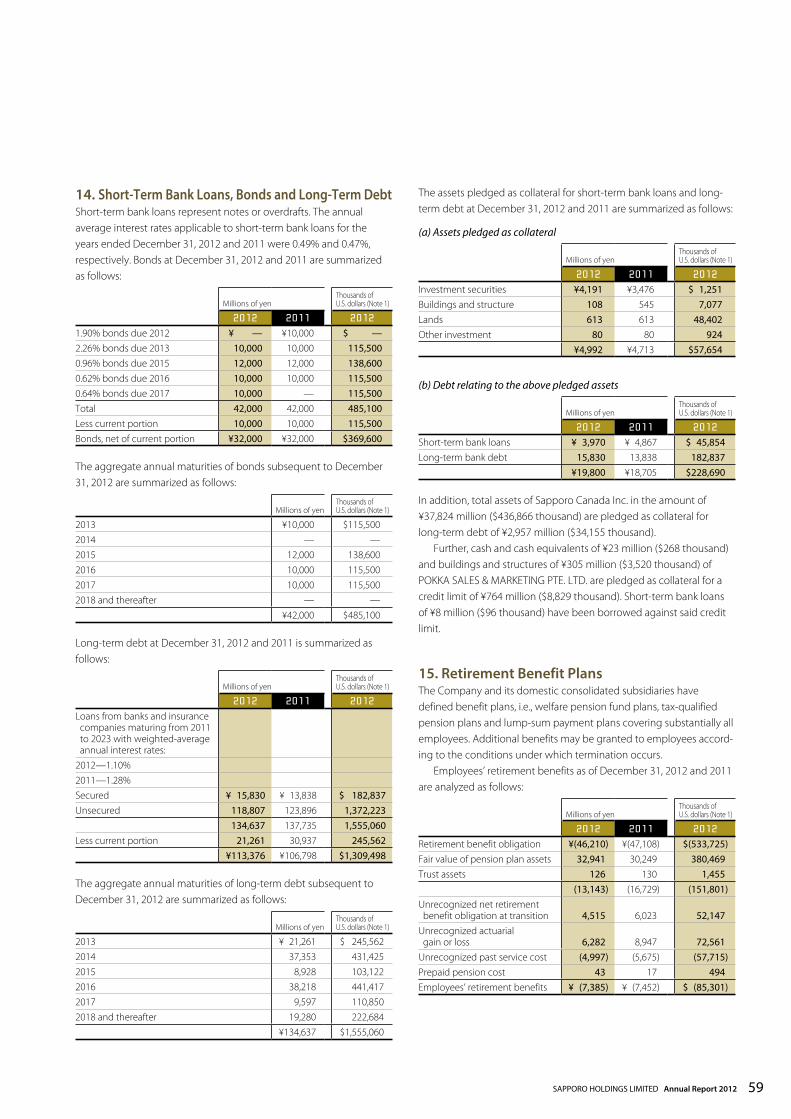
14. Short-Term Bank Loans, Bonds and Long-Term DebtShort-term bank loans represent notes or overdrafts. The annual average interest rates applicable to short-term bank loans for the years ended December 31, 2012 and 2011 were 0.49% and 0.47%, respectively. Bonds at December 31, 2012 and 2011 are summarized as follows:
Millions of yenThousands of U.S. dollars (Note 1)
2012 2011 2012
1.90% bonds due 2012 ¥ — ¥10,000 $ —2.26% bonds due 2013 10,000 10,000 115,5000.96% bonds due 2015 12,000 12,000 138,6000.62% bonds due 2016 10,000 10,000 115,5000.64% bonds due 2017 10,000 — 115,500Total 42,000 42,000 485,100Less current portion 10,000 10,000 115,500Bonds, net of current portion ¥32,000 ¥32,000 $369,600
The aggregate annual maturities of bonds subsequent to December 31, 2012 are summarized as follows:
Millions of yenThousands of U.S. dollars (Note 1)
2013 ¥10,000 $115,5002014 — —2015 12,000 138,6002016 10,000 115,5002017 10,000 115,5002018 and thereafter — —
¥42,000 $485,100
Long-term debt at December 31, 2012 and 2011 is summarized as follows:
Millions of yenThousands of U.S. dollars (Note 1)
2012 2011 2012
Loans from banks and insurance companies maturing from 2011 to 2023 with weighted-average annual interest rates:2012—1.10%2011—1.28%Secured ¥ 15,830 ¥ 13,838 $ 182,837Unsecured 118,807 123,896 1,372,223
134,637 137,735 1,555,060Less current portion 21,261 30,937 245,562
¥113,376 ¥106,798 $1,309,498
The aggregate annual maturities of long-term debt subsequent to December 31, 2012 are summarized as follows:
Millions of yenThousands of U.S. dollars (Note 1)
2013 ¥ 21,261 $ 245,5622014 37,353 431,4252015 8,928 103,1222016 38,218 441,4172017 9,597 110,8502018 and thereafter 19,280 222,684
¥134,637 $1,555,060
The assets pledged as collateral for short-term bank loans and long-term debt at December 31, 2012 and 2011 are summarized as follows:
(a) Assets pledged as collateral
Millions of yenThousands of U.S. dollars (Note 1)
2012 2011 2012
Investment securities ¥4,191 ¥3,476 $ 1,251Buildings and structure 108 545 7,077Lands 613 613 48,402Other investment 80 80 924
¥4,992 ¥4,713 $57,654
(b) Debt relating to the above pledged assets
Millions of yenThousands of U.S. dollars (Note 1)
2012 2011 2012
Short-term bank loans ¥ 3,970 ¥ 4,867 $ 45,854Long-term bank debt 15,830 13,838 182,837
¥19,800 ¥18,705 $228,690
In addition, total assets of Sapporo Canada Inc. in the amount of ¥37,824 million ($436,866 thousand) are pledged as collateral for long-term debt of ¥2,957 million ($34,155 thousand). Further, cash and cash equivalents of ¥23 million ($268 thousand) and buildings and structures of ¥305 million ($3,520 thousand) of POKKA SALES & MARKETING PTE. LTD. are pledged as collateral for a credit limit of ¥764 million ($8,829 thousand). Short-term bank loans of ¥8 million ($96 thousand) have been borrowed against said credit limit.
15. Retirement Benefit PlansThe Company and its domestic consolidated subsidiaries have defined benefit plans, i.e., welfare pension fund plans, tax-qualified pension plans and lump-sum payment plans covering substantially all employees. Additional benefits may be granted to employees accord-ing to the conditions under which termination occurs. Employees’ retirement benefits as of December 31, 2012 and 2011 are analyzed as follows:
Millions of yenThousands of U.S. dollars (Note 1)
2012 2011 2012
Retirement benefit obligation ¥(46,210) ¥(47,108) $(533,725)Fair value of pension plan assets 32,941 30,249 380,469Trust assets 126 130 1,455
(13,143) (16,729) (151,801)Unrecognized net retirement benefit obligation at transition 4,515 6,023 52,147Unrecognized actuarial gain or loss 6,282 8,947 72,561Unrecognized past service cost (4,997) (5,675) (57,715)Prepaid pension cost 43 17 494Employees’ retirement benefits ¥ (7,385) ¥ (7,452) $ (85,301)
59SAPPORO HOLDINGS LIMITED Annual Report 2012
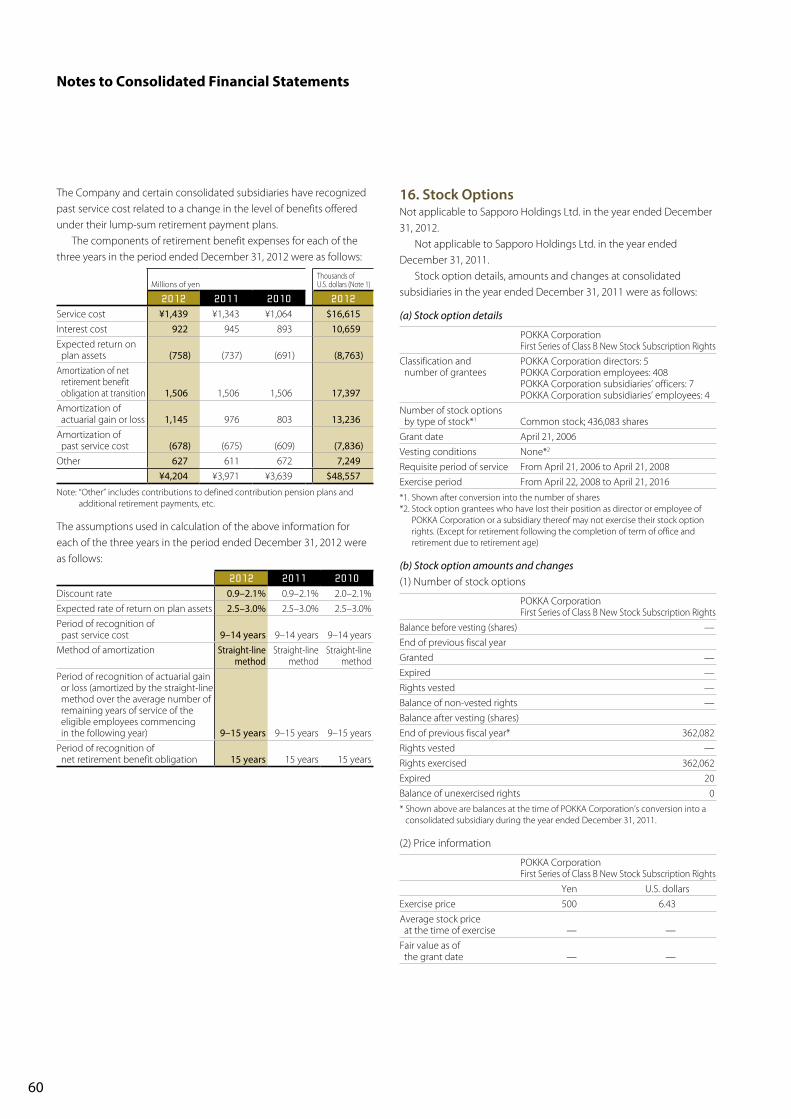
The Company and certain consolidated subsidiaries have recognized past service cost related to a change in the level of benefits offered under their lump-sum retirement payment plans. The components of retirement benefit expenses for each of the three years in the period ended December 31, 2012 were as follows:
Millions of yenThousands of U.S. dollars (Note 1)
2012 2011 2010 2012
Service cost ¥1,439 ¥1,343 ¥1,064 $16,615Interest cost 922 945 893 10,659Expected return on plan assets (758) (737) (691) (8,763)Amortization of net retirement benefit obligation at transition 1,506 1,506 1,506 17,397Amortization of actuarial gain or loss 1,145 976 803 13,236Amortization of past service cost (678) (675) (609) (7,836)Other 627 611 672 7,249
¥4,204 ¥3,971 ¥3,639 $48,557
Note: “Other” includes contributions to defined contribution pension plans and additional retirement payments, etc.
The assumptions used in calculation of the above information for each of the three years in the period ended December 31, 2012 were as follows:
2012 2011 2010
Discount rate 0.9–2.1% 0.9–2.1% 2.0–2.1%Expected rate of return on plan assets 2.5–3.0% 2.5–3.0% 2.5–3.0%Period of recognition of past service cost 9–14 years 9–14 years 9–14 yearsMethod of amortization Straight-line
methodStraight-line
methodStraight-line
methodPeriod of recognition of actuarial gain or loss (amortized by the straight-line method over the average number of remaining years of service of the eligible employees commencing in the following year) 9–15 years 9–15 years 9–15 yearsPeriod of recognition of net retirement benefit obligation 15 years 15 years 15 years
16. Stock OptionsNot applicable to Sapporo Holdings Ltd. in the year ended December 31, 2012. Not applicable to Sapporo Holdings Ltd. in the year ended December 31, 2011. Stock option details, amounts and changes at consolidated subsidiaries in the year ended December 31, 2011 were as follows:
(a) Stock option details
POKKA CorporationFirst Series of Class B New Stock Subscription Rights
Classification and number of grantees
POKKA Corporation directors: 5POKKA Corporation employees: 408POKKA Corporation subsidiaries’ officers: 7POKKA Corporation subsidiaries’ employees: 4
Number of stock options by type of stock*1 Common stock; 436,083 sharesGrant date April 21, 2006Vesting conditions None*2
Requisite period of service From April 21, 2006 to April 21, 2008Exercise period From April 22, 2008 to April 21, 2016*1. Shown after conversion into the number of shares*2. Stock option grantees who have lost their position as director or employee of
POKKA Corporation or a subsidiary thereof may not exercise their stock option rights. (Except for retirement following the completion of term of office and retirement due to retirement age)
(b) Stock option amounts and changes(1) Number of stock options
POKKA CorporationFirst Series of Class B New Stock Subscription Rights
Balance before vesting (shares) —End of previous fiscal yearGranted —Expired —Rights vested —Balance of non-vested rights —Balance after vesting (shares)End of previous fiscal year* 362,082Rights vested —Rights exercised 362,062Expired 20Balance of unexercised rights 0* Shown above are balances at the time of POKKA Corporation’s conversion into a
consolidated subsidiary during the year ended December 31, 2011.
(2) Price information
POKKA CorporationFirst Series of Class B New Stock Subscription Rights
Yen U.S. dollarsExercise price 500 6.43Average stock price at the time of exercise — —Fair value as of the grant date — —
Notes to Consolidated Financial Statements
60
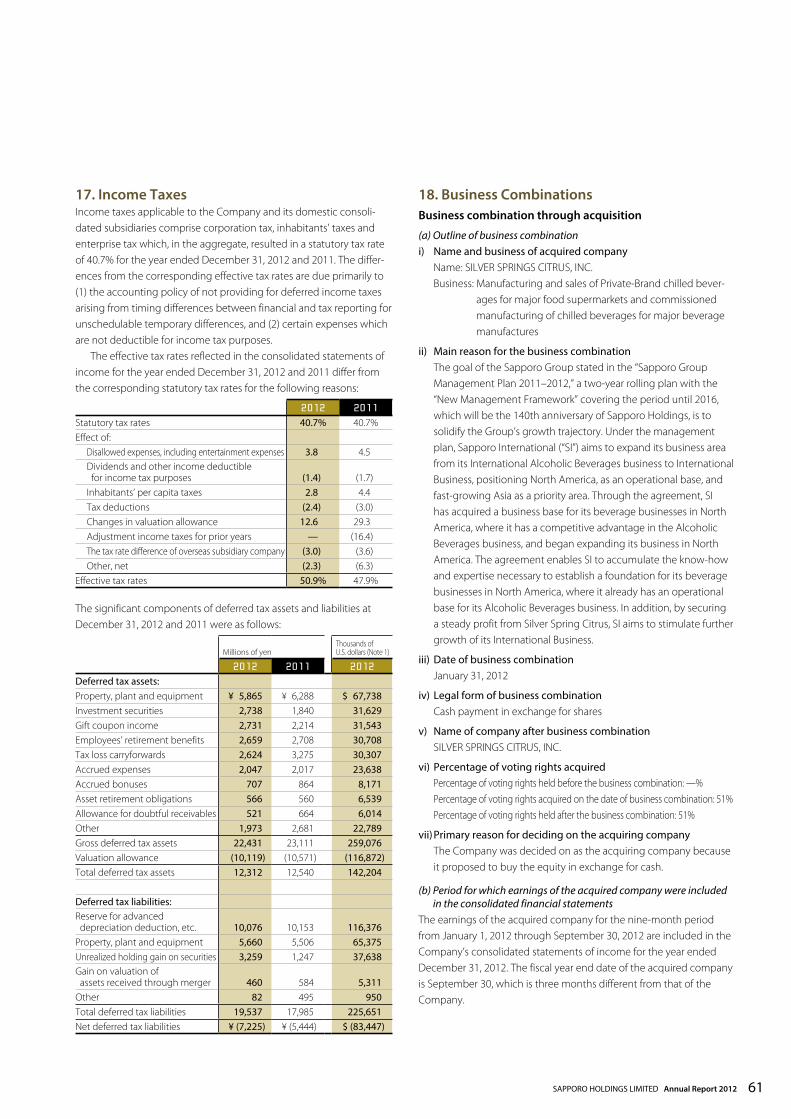
17. Income TaxesIncome taxes applicable to the Company and its domestic consoli-dated subsidiaries comprise corporation tax, inhabitants’ taxes and enterprise tax which, in the aggregate, resulted in a statutory tax rate of 40.7% for the year ended December 31, 2012 and 2011. The differ-ences from the corresponding effective tax rates are due primarily to (1) the accounting policy of not providing for deferred income taxes arising from timing differences between financial and tax reporting for unschedulable temporary differences, and (2) certain expenses which are not deductible for income tax purposes. The effective tax rates reflected in the consolidated statements of income for the year ended December 31, 2012 and 2011 differ from the corresponding statutory tax rates for the following reasons:
2012 2011
Statutory tax rates 40.7% 40.7%Effect of:
Disallowed expenses, including entertainment expenses 3.8 4.5Dividends and other income deductible for income tax purposes (1.4) (1.7)Inhabitants’ per capita taxes 2.8 4.4Tax deductions (2.4) (3.0)Changes in valuation allowance 12.6 29.3Adjustment income taxes for prior years — (16.4)The tax rate difference of overseas subsidiary company (3.0) (3.6)Other, net (2.3) (6.3)
Effective tax rates 50.9% 47.9%
The significant components of deferred tax assets and liabilities at December 31, 2012 and 2011 were as follows:
Millions of yenThousands of U.S. dollars (Note 1)
2012 2011 2012
Deferred tax assets:Property, plant and equipment ¥ 5,865 ¥ 6,288 $ 67,738Investment securities 2,738 1,840 31,629Gift coupon income 2,731 2,214 31,543Employees’ retirement benefits 2,659 2,708 30,708Tax loss carryforwards 2,624 3,275 30,307Accrued expenses 2,047 2,017 23,638Accrued bonuses 707 864 8,171Asset retirement obligations 566 560 6,539Allowance for doubtful receivables 521 664 6,014Other 1,973 2,681 22,789Gross deferred tax assets 22,431 23,111 259,076Valuation allowance (10,119) (10,571) (116,872)Total deferred tax assets 12,312 12,540 142,204
Deferred tax liabilities:Reserve for advanced depreciation deduction, etc. 10,076 10,153 116,376Property, plant and equipment 5,660 5,506 65,375Unrealized holding gain on securities 3,259 1,247 37,638Gain on valuation of assets received through merger 460 584 5,311Other 82 495 950Total deferred tax liabilities 19,537 17,985 225,651Net deferred tax liabilities ¥ (7,225) ¥ (5,444) $ (83,447)
18. Business CombinationsBusiness combination through acquisition
(a) Outline of business combinationi) Name and business of acquired company Name: SILVER SPRINGS CITRUS, INC. Business: Manufacturing and sales of Private-Brand chilled bever-
ages for major food supermarkets and commissioned manufacturing of chilled beverages for major beverage manufactures
ii) Main reason for the business combination The goal of the Sapporo Group stated in the “Sapporo Group
Management Plan 2011–2012,” a two-year rolling plan with the “New Management Framework” covering the period until 2016, which will be the 140th anniversary of Sapporo Holdings, is to solidify the Group’s growth trajectory. Under the management plan, Sapporo International (“SI”) aims to expand its business area from its International Alcoholic Beverages business to International Business, positioning North America, as an operational base, and fast-growing Asia as a priority area. Through the agreement, SI has acquired a business base for its beverage businesses in North America, where it has a competitive advantage in the Alcoholic Beverages business, and began expanding its business in North America. The agreement enables SI to accumulate the know-how and expertise necessary to establish a foundation for its beverage businesses in North America, where it already has an operational base for its Alcoholic Beverages business. In addition, by securing a steady profit from Silver Spring Citrus, SI aims to stimulate further growth of its International Business.
iii) Date of business combination January 31, 2012
iv) Legal form of business combination Cash payment in exchange for shares
v) Name of company after business combination SILVER SPRINGS CITRUS, INC.
vi) Percentage of voting rights acquired Percentage of voting rights held before the business combination: —% Percentage of voting rights acquired on the date of business combination: 51% Percentage of voting rights held after the business combination: 51%
vii) Primary reason for deciding on the acquiring company The Company was decided on as the acquiring company because
it proposed to buy the equity in exchange for cash.
(b) Period for which earnings of the acquired company were included in the consolidated financial statements
The earnings of the acquired company for the nine-month period from January 1, 2012 through September 30, 2012 are included in the Company’s consolidated statements of income for the year ended December 31, 2012. The fiscal year end date of the acquired company is September 30, which is three months different from that of the Company.
61SAPPORO HOLDINGS LIMITED Annual Report 2012

(c) Acquisition cost and breakdownAcquisition price: ¥1,836 million ($21,200 thousand)Costs incurred directly in the acquisition: ¥0 million ($0 thousand)Acquisition cost: ¥1,836 million ($21,200 thousand)
(d) Amount of goodwill, reason for its recognition, amortization method, and amortization period
i) Amount of goodwill: ¥422 million ($4,871 thousand)ii) Reason for its recognition:
The acquired company’s future business activities are expected to generate excess profits.
iii) Amortization method and amortization period: 5 years with the straight-line method
(e) Assets acquired and liabilities assumed at the date of business combination
Current assets: ¥2,610 million ($30,142 thousand)Fixed assets: ¥1,731 million ($19,996 thousand)Total assets: ¥4,341 million ($50,138 thousand)Current liabilities: ¥1,525 million ($17,613 thousand)Long-term liabilities: ¥100 million ($1,150 thousand) Total liabilities: ¥1,624 million ($18,762 thousand)
(f) Approximate effects on the consolidated statements of income for the year ended December 31, 2012 assuming that the business combination was completed on January 1, 2012 and method of calculation
Net sales: ¥2,081 million ($24,036 thousand)Ordinary loss: ¥13 million ($150 thousand)Net loss: ¥19 million ($219 thousand)
(Method adopted to estimate approximate effects)The approximate effects correspond to the acquired company’s net sales and income/loss recorded on its consolidated statements of income assuming that the business combination was completed on January 1, 2012. These approximate effects have not been audited.
19. Real Estate for LeaseThe Company and certain consolidated subsidiaries own office buildings for rent and commercial facilities for rent (including land) in Tokyo and other areas. Rental income associated with real estate for rent in the fiscal years ended December 31, 2012 and 2011 were ¥7,945 million ($91,770 thousand) and ¥7,049 million. Significant earnings from rent are included under operating income; rental-related expenses are posted under operating expenses. In 2012 and 2011, the carrying value of this real estate for rent on the consolidated balance sheets, the change in carrying value, and the total fair value were as follows:Year ended or as of December 31, 2012
Millions of yen
Balance at December 31, 2011
Change during 2012
Balance at December 31, 2012
Fair value at December 31, 2012
¥173,297 ¥36,628 ¥209,925 ¥335,673
Year ended or as of December 31, 2012Thousands of U.S. dollars (Note 1)
Balance at December 31, 2011
Change during 2012
Balance at December 31, 2012
Fair value at December 31, 2012
$2,001,583 $423,048 $2,424,631 $3,877,023
Year ended or as of December 31, 2011Millions of yen
Balance at December 31, 2011
Change during 2012
Balance at December 31, 2012
Fair value at December 31, 2012
¥173,601 ¥(304) ¥173,297 ¥299,801
Notes: 1. Amounts posted in the consolidated balance sheets represent the acquisi-tion cost after the deduction of cumulative depreciation.
2. In regard to the main components of changes in the year ended December 31, 2012, the main increase was the acquisition of real estate of ¥41,663 million ($481,212 thousand), while the main decreases were depreciation and amortization of ¥4,123 million ($47,616 thousand) and disposal losses of ¥874 million ($10,093 thousand). In regard to the main components of changes in the year ended December 31, 2011, the main increase was the acquisition of real estate of ¥3,994 million while the main decreases were depreciation and amortization of ¥3,952 million and impairment losses of ¥318 million.
3. Fair value at the end of the fiscal year under review is based primarily on real estate appraisals carried out by external appraisers.
20. Segment Information(a) Segment information by geographic areai) Net salesYear ended or as of December 31, 2012
Millions of yen Thousands of U.S. dollars (Note 1)
Japan North America Asia Others Total Japan North America Asia Others Total
¥439,114 ¥34,658 ¥14,836 ¥3,883 ¥492,491 $5,071,769 $400,299 $171,351 $44,854 $5,688,273
Sales to external customers in Japan constituted more than 90% of net sales on the consolidated statements of income. Accordingly, geographical segment information has not been disclosed in 2011.
ii) Property, plant and equipmentSales to external customers in Japan constituted more than 90% of net sales on the consolidated statements of income. Accordingly, geographical segment information has not been disclosed.
(b) Information by major customerThe Company does not have any major customers whose share of sales accounts for more than 10% of net sales shown on the consolidated statements of income. Accordingly, information by major customer is omitted.
Notes to Consolidated Financial Statements
62
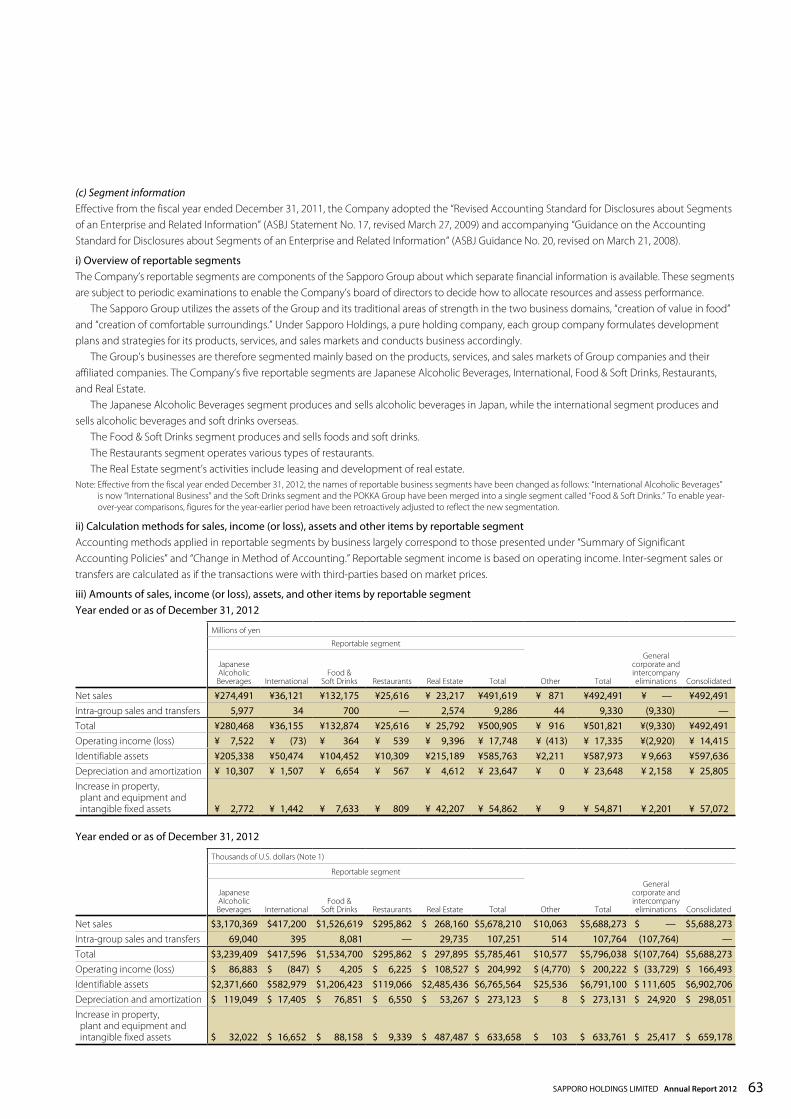
(c) Segment informationEffective from the fiscal year ended December 31, 2011, the Company adopted the “Revised Accounting Standard for Disclosures about Segments of an Enterprise and Related Information” (ASBJ Statement No. 17, revised March 27, 2009) and accompanying “Guidance on the Accounting Standard for Disclosures about Segments of an Enterprise and Related Information” (ASBJ Guidance No. 20, revised on March 21, 2008).
i) Overview of reportable segmentsThe Company’s reportable segments are components of the Sapporo Group about which separate financial information is available. These segments are subject to periodic examinations to enable the Company’s board of directors to decide how to allocate resources and assess performance. The Sapporo Group utilizes the assets of the Group and its traditional areas of strength in the two business domains, “creation of value in food” and “creation of comfortable surroundings.” Under Sapporo Holdings, a pure holding company, each group company formulates development plans and strategies for its products, services, and sales markets and conducts business accordingly. The Group’s businesses are therefore segmented mainly based on the products, services, and sales markets of Group companies and their affiliated companies. The Company’s five reportable segments are Japanese Alcoholic Beverages, International, Food & Soft Drinks, Restaurants, and Real Estate. The Japanese Alcoholic Beverages segment produces and sells alcoholic beverages in Japan, while the international segment produces and sells alcoholic beverages and soft drinks overseas. The Food & Soft Drinks segment produces and sells foods and soft drinks. The Restaurants segment operates various types of restaurants. The Real Estate segment’s activities include leasing and development of real estate.Note: Effective from the fiscal year ended December 31, 2012, the names of reportable business segments have been changed as follows: “International Alcoholic Beverages”
is now “International Business” and the Soft Drinks segment and the POKKA Group have been merged into a single segment called “Food & Soft Drinks.” To enable year-over-year comparisons, figures for the year-earlier period have been retroactively adjusted to reflect the new segmentation.
ii) Calculation methods for sales, income (or loss), assets and other items by reportable segmentAccounting methods applied in reportable segments by business largely correspond to those presented under “Summary of Significant Accounting Policies” and “Change in Method of Accounting.” Reportable segment income is based on operating income. Inter-segment sales or transfers are calculated as if the transactions were with third-parties based on market prices.
iii) Amounts of sales, income (or loss), assets, and other items by reportable segmentYear ended or as of December 31, 2012
Millions of yen
Reportable segment
Japanese Alcoholic Beverages International
Food & Soft Drinks Restaurants Real Estate Total Other Total
General corporate and intercompany eliminations Consolidated
Net sales ¥274,491 ¥36,121 ¥132,175 ¥25,616 ¥ 23,217 ¥491,619 ¥ 871 ¥492,491 ¥ — ¥492,491Intra-group sales and transfers 5,977 34 700 — 2,574 9,286 44 9,330 (9,330) —Total ¥280,468 ¥36,155 ¥132,874 ¥25,616 ¥ 25,792 ¥500,905 ¥ 916 ¥501,821 ¥(9,330) ¥492,491Operating income (loss) ¥ 7,522 ¥ (73) ¥ 364 ¥ 539 ¥ 9,396 ¥ 17,748 ¥ (413) ¥ 17,335 ¥(2,920) ¥ 14,415Identifiable assets ¥205,338 ¥50,474 ¥104,452 ¥10,309 ¥215,189 ¥585,763 ¥2,211 ¥587,973 ¥ 9,663 ¥597,636Depreciation and amortization ¥ 10,307 ¥ 1,507 ¥ 6,654 ¥ 567 ¥ 4,612 ¥ 23,647 ¥ 0 ¥ 23,648 ¥ 2,158 ¥ 25,805Increase in property, plant and equipment and intangible fixed assets ¥ 2,772 ¥ 1,442 ¥ 7,633 ¥ 809 ¥ 42,207 ¥ 54,862 ¥ 9 ¥ 54,871 ¥ 2,201 ¥ 57,072
Year ended or as of December 31, 2012
Thousands of U.S. dollars (Note 1)
Reportable segment
Japanese Alcoholic Beverages International
Food & Soft Drinks Restaurants Real Estate Total Other Total
General corporate and intercompany eliminations Consolidated
Net sales $3,170,369 $417,200 $1,526,619 $295,862 $ 268,160 $5,678,210 $10,063 $5,688,273 $ — $5,688,273Intra-group sales and transfers 69,040 395 8,081 — 29,735 107,251 514 107,764 (107,764) —Total $3,239,409 $417,596 $1,534,700 $295,862 $ 297,895 $5,785,461 $10,577 $5,796,038 $(107,764) $5,688,273Operating income (loss) $ 86,883 $ (847) $ 4,205 $ 6,225 $ 108,527 $ 204,992 $ (4,770) $ 200,222 $ (33,729) $ 166,493Identifiable assets $2,371,660 $582,979 $1,206,423 $119,066 $2,485,436 $6,765,564 $25,536 $6,791,100 $ 111,605 $6,902,706Depreciation and amortization $ 119,049 $ 17,405 $ 76,851 $ 6,550 $ 53,267 $ 273,123 $ 8 $ 273,131 $ 24,920 $ 298,051Increase in property, plant and equipment and intangible fixed assets $ 32,022 $ 16,652 $ 88,158 $ 9,339 $ 487,487 $ 633,658 $ 103 $ 633,761 $ 25,417 $ 659,178
63SAPPORO HOLDINGS LIMITED Annual Report 2012
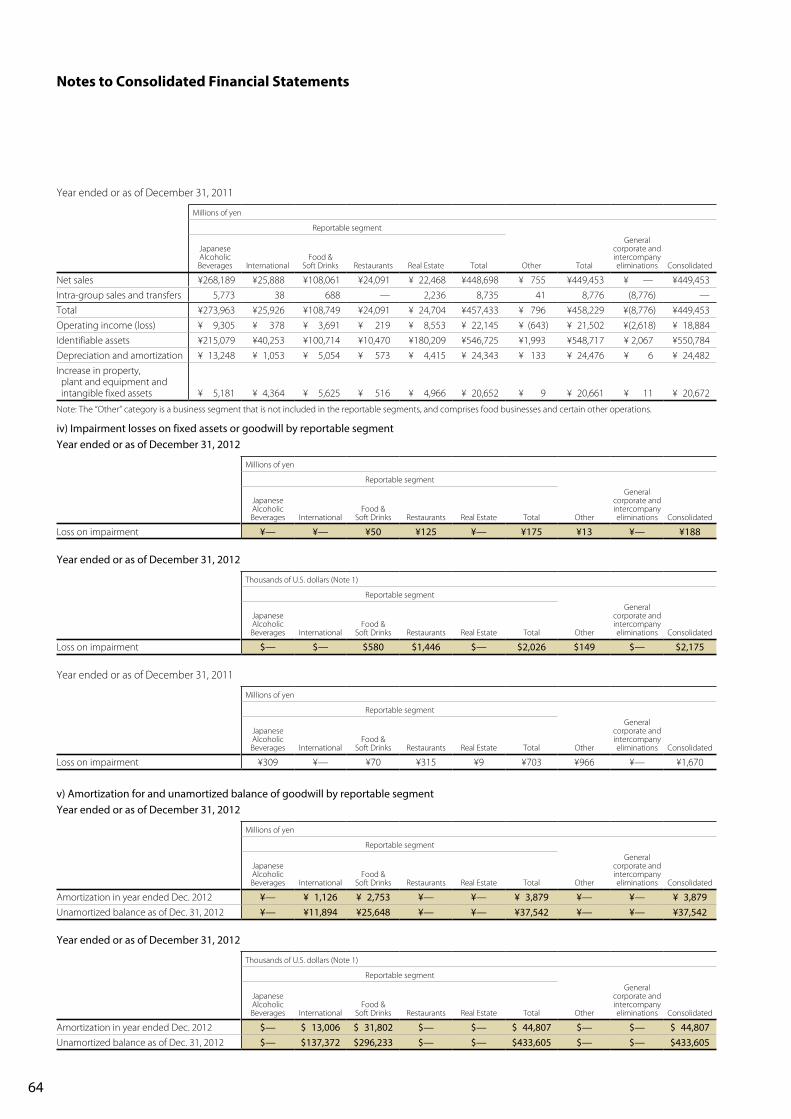
Year ended or as of December 31, 2011
Millions of yen
Reportable segment
Japanese Alcoholic Beverages International
Food & Soft Drinks Restaurants Real Estate Total Other Total
General corporate and intercompany eliminations Consolidated
Net sales ¥268,189 ¥25,888 ¥108,061 ¥24,091 ¥ 22,468 ¥448,698 ¥ 755 ¥449,453 ¥ — ¥449,453Intra-group sales and transfers 5,773 38 688 — 2,236 8,735 41 8,776 (8,776) —Total ¥273,963 ¥25,926 ¥108,749 ¥24,091 ¥ 24,704 ¥457,433 ¥ 796 ¥458,229 ¥(8,776) ¥449,453Operating income (loss) ¥ 9,305 ¥ 378 ¥ 3,691 ¥ 219 ¥ 8,553 ¥ 22,145 ¥ (643) ¥ 21,502 ¥(2,618) ¥ 18,884Identifiable assets ¥215,079 ¥40,253 ¥100,714 ¥10,470 ¥180,209 ¥546,725 ¥1,993 ¥548,717 ¥ 2,067 ¥550,784Depreciation and amortization ¥ 13,248 ¥ 1,053 ¥ 5,054 ¥ 573 ¥ 4,415 ¥ 24,343 ¥ 133 ¥ 24,476 ¥ 6 ¥ 24,482Increase in property, plant and equipment and intangible fixed assets ¥ 5,181 ¥ 4,364 ¥ 5,625 ¥ 516 ¥ 4,966 ¥ 20,652 ¥ 9 ¥ 20,661 ¥ 11 ¥ 20,672
Note: The “Other” category is a business segment that is not included in the reportable segments, and comprises food businesses and certain other operations.
iv) Impairment losses on fixed assets or goodwill by reportable segmentYear ended or as of December 31, 2012
Millions of yen
Reportable segment
Japanese Alcoholic Beverages International
Food & Soft Drinks Restaurants Real Estate Total Other
General corporate and intercompany eliminations Consolidated
Loss on impairment ¥— ¥— ¥50 ¥125 ¥— ¥175 ¥13 ¥— ¥188
Year ended or as of December 31, 2012
Thousands of U.S. dollars (Note 1)
Reportable segment
Japanese Alcoholic Beverages International
Food & Soft Drinks Restaurants Real Estate Total Other
General corporate and intercompany eliminations Consolidated
Loss on impairment $— $— $580 $1,446 $— $2,026 $149 $— $2,175
Year ended or as of December 31, 2011
Millions of yen
Reportable segment
Japanese Alcoholic Beverages International
Food & Soft Drinks Restaurants Real Estate Total Other
General corporate and intercompany eliminations Consolidated
Loss on impairment ¥309 ¥— ¥70 ¥315 ¥9 ¥703 ¥966 ¥— ¥1,670
v) Amortization for and unamortized balance of goodwill by reportable segmentYear ended or as of December 31, 2012
Millions of yen
Reportable segment
Japanese Alcoholic Beverages International
Food & Soft Drinks Restaurants Real Estate Total Other
General corporate and intercompany eliminations Consolidated
Amortization in year ended Dec. 2012 ¥— ¥ 1,126 ¥ 2,753 ¥— ¥— ¥ 3,879 ¥— ¥— ¥ 3,879Unamortized balance as of Dec. 31, 2012 ¥— ¥11,894 ¥25,648 ¥— ¥— ¥37,542 ¥— ¥— ¥37,542
Year ended or as of December 31, 2012
Thousands of U.S. dollars (Note 1)
Reportable segment
Japanese Alcoholic Beverages International
Food & Soft Drinks Restaurants Real Estate Total Other
General corporate and intercompany eliminations Consolidated
Amortization in year ended Dec. 2012 $— $ 13,006 $ 31,802 $— $— $ 44,807 $— $— $ 44,807Unamortized balance as of Dec. 31, 2012 $— $137,372 $296,233 $— $— $433,605 $— $— $433,605
Notes to Consolidated Financial Statements
64

Year ended or as of December 31, 2011
Millions of yen
Reportable segment
Japanese Alcoholic Beverages International
Food & Soft Drinks Restaurants Real Estate Total Other
General corporate and intercompany eliminations Consolidated
Amortization in year ended Dec. 2011 ¥ 0 ¥ 1,055 ¥ 2,054 ¥— ¥— ¥ 3,109 ¥— ¥— ¥ 3,109Unamortized balance as of Dec. 31, 2011 ¥— ¥12,177 ¥27,971 ¥— ¥— ¥40,148 ¥— ¥— ¥40,148
vi) Gain on negative goodwill by reportable segmentNot applicable in the year ended December 31, 2012 and 2011.
21. Related Party TransactionsNot applicable in the year ended December 31, 2012. Related party transactions in the year ended December 31, 2011 were as follows:(1) Transactions with parties related to the CompanyOfficers of material subsidiaries of the Company, and their close family members
Type Name Occupation Transaction detailsTransaction amount
(¥ million)
Officer of material subsidiary Masatoshi Hori Director of POKKA Corporation Purchase of shares of subsidiary ¥264Officer of material subsidiary Akifumi Ito Director of POKKA Corporation Purchase of shares of subsidiary ¥194Officer of material subsidiary Eiji Yamada Director of POKKA Corporation Purchase of shares of subsidiary ¥123Officer of material subsidiary Koji Yamauchi Director of POKKA Corporation Purchase of shares of subsidiary ¥ 93
Note: Transaction conditions and policy on determining transaction conditions: Purchases of shares of subsidiaries are determined based on the financial position of the subsidiary at the time of the transaction.
(2) Transactions with consolidated subsidiaries and parties related to the CompanyOfficers of material subsidiaries of the Company, and their close family members
Type Name Occupation Transaction detailsTransaction amount
(¥ million)
Officer of material subsidiary Masatoshi Hori Director of POKKA Corporation Exercise of stock options ¥17Officer of material subsidiary Akifumi Ito Director of POKKA Corporation Exercise of stock options ¥13
Notes: 1. Shown above are amounts related to stock options exercised in the year ended December 31, 2011. These stock options were granted based on a resolution of an extraordinary meeting of shareholders held on April 6, 2006.
2. The Transaction amount column lists the product of the number of shares granted by exercise of stock options in the fiscal year under review multiplied by the amount paid.
22. Amounts per ShareBasic net income per share has been computed based on the net income available for distribution to shareholders of common stock and the weighted average number of shares of common stock outstanding during the year, and diluted net income per share has been computed based on the net income available for distribution to shareholders and the weighted average number of shares of common stock outstanding during the year after allowing for the dilutive potential of shares of common stock to be issued upon the conversion of convertible bonds. Information concerning diluted net income per share is omitted because there were no latent shares with a dilutive effect in the years ended December 31, 2012 and 2011. Amounts per share of net assets have been computed based on the net assets available for distribution to shareholders and the number of shares of common stock outstanding at each balance sheet date.
YenU.S. dollars (Note 1)
Year ended December 31 2012 2011 2010 2012
Net income ¥13.77 ¥8.08 ¥27.50 $0.16Diluted net income — — 26.44 —
* Information concerning diluted net income per share is omitted because there were no latent shares with a dilutive effect in the year ended December 31, 2012 and 2011.
YenU.S. dollars (Note 1)
As of December 31 2012 2011 2012
Net assets ¥336.60 ¥314.87 $3.89
65SAPPORO HOLDINGS LIMITED Annual Report 2012
23. Subsequent Events(Appropriation of retained earnings)On March 28, 2013, the following appropriation of retained earnings was approved at the annual general meeting of the Company’s shareholders:
Millions of yenThousands of U.S. dollars (Note 1)
Cash dividends ¥2,754 $31,805
(Reorganization in the Food & Soft Drinks Business)At a board of directors’ meeting held on October 3, 2012, the Company decided to reorganize (hereafter, “the organization”) through an absorption-type merger of its consolidated subsidiaries in the Group’s Food & Soft Drinks business. The reorganization was carried out on January 1, 2013.
(a) Purpose of ReorganizationThe Sapporo Group conducted the following three absorption-type mergers among the consolidated subsidiaries in the Foods and Soft Drinks Business of the Sapporo Group with the aim of achieving a highly competitive “food value creation group” in Japan and overseas.• Absorption-type merger between POKKA CORPORATION (“Pokka”) (surviving company) and HOKKAIDO POKKA CORPORATION (“Hokkaido Pokka”)
(extinct company)• Absorption-type merger between POKKA SAPPORO FOOD & BEVERAGE LTD. (“Pokka Sapporo”) (surviving company) and Pokka (extinct company)• Absorption-type merger between Pokka Sapporo (surviving company) and Sapporo Beverage Co., Ltd. (“Sapporo Beverage”) (extinct company) In addition, in order to keep Pokka Sapporo (surviving company) as a wholly owned subsidiary after the completion of the three mergers, the Company conducted an absorption-type merger (forward triangular merger) between Pokka Sapporo and Pokka, where shares of common stock of the Company, being as a parent owning whole shares of common stock of Pokka Sapporo, were allocated to the shareholders of Pokka (extinct company) in exchange for all of the issued and outstanding shares thereof.
(b) Merger between Consolidated SubsidiariesAbsorption-type Merger Outline
i) Absorption-type merger between Pokka (surviving company) and Hokkaido Pokka (extinct company) ① Schedule of Absorption-type Merger
• Resolution by the board of directors: October 30, 2012 (Pokka) November 7, 2012 (Hokkaido Pokka)• Date of contract of the merger agreement: November 7, 2012• Date of the merger: January 1, 2013
Note: Since the absorption-type merger constitutes a simplified absorption-type merger with Pokka as the surviving company, and a short-form absorption-type merger with Hokkaido Pokka as the extinct company, it was not necessary to obtain approval at each company’s Shareholders’ Meeting.
② Allocation of Merger ConsiderationsIn conducting the absorption-type merger, Pokka (surviving company) did not distribute cash, stock or other means to the shareholders of Hokkaido Pokka (extinct company) in exchange for the receipt of Hokkaido Pokka common stock.
ii) Absorption-type merger between Pokka Sapporo (surviving company) and Pokka (extinct company)① Absorption-type Merger Schedule
• Resolution by the board of directors: October 30, 2012 (Pokka) November 7, 2012 (Pokka Sapporo)• Date of contract of the merger agreement: November 7, 2012• Resolution by the general meeting of shareholders: November 30, 2012 (Pokka Sapporo)• Date of the merger (effective date): January 1, 2013
Note: Since the absorption-type merger constitutes a short-form absorption-type merger for Pokka as the extinct company, Pokka conducted the absorption-type merger without obtaining the approval of the Shareholders’ meeting. This absorption-type merger shall become effective upon fulfillment of the condition of the absorption-type merger between Pokka and Hokkaido Pokka as set forth in i) above.
② Allocation of Merger ConsiderationsIn conducting the absorption-type merger between Pokka Sapporo and Pokka, Pokka Sapporo, a surviving company, allocate the Company’s common stock to the shareholders (excluding Pokka Sapporo) of Pokka (extinct company) in consideration of Pokka common stock at the share exchange ratio of 1:15.55 (one share of Pokka common stock in exchange of 15.55 shares of common stock of the Company).
Notes to Consolidated Financial Statements
66

iii) Absorption-type merger between Pokka Sapporo (surviving company) and Sapporo Beverage (extinct company)① Absorption-type merger schedule
• Resolution by the board of directors: November 7, 2012 (Sapporo Beverage) November 7, 2012 (Pokka Sapporo)• Date of contract of the merger agreement: November 7, 2012• Resolution by the general meeting of shareholders: November 30, 2012 (Sapporo Beverage) November 30, 2012 (Pokka Sapporo)• Date of the merger (effective date): January 1, 2013
② Allocation of Merger ConsiderationsIn conducting the absorption-type merger between Pokka Sapporo and Sapporo Beverage, Pokka Sapporo (surviving company) issued one share of common stock to the shareholders of Sapporo Beverage (extinct company), and allocated all shares to the Company, the only shareholder of Sapporo Beverage.
(c) Impact on Consolidated Operating ResultsThe impact on the consolidated operating results due to the disposal of treasury stock, absorption-type split, and absorption-type mergers among the consolidated subsidiaries will be immaterial.
(d) Merger Parties (as of December 31, 2012)<1> Surviving company (as of December 31, 2012)
Successor company and surviving company(1) Company name: POKKA SAPPORO FOOD & BEVERAGE LTD. (2) Head office: 2-29, Sakae 4-chome, Naka-ku, Nagoya, Aichi (3) Representative: Masatoshi Hori, President and Representative Director(4) Outline of business: Beverage & food businesses, restaurant business, confectionary business, logistics business, etc.(5) Capital: ¥10 million
<2> Extinct company (as of December 31, 2012)Extinct company 1
(1) Company name: POKKA CORPORATION(2) Head office: 2-29, Sakae 4-chome, Naka-ku, Nagoya, Aichi(3) Representative: Akifumi Ito, President and Representative Director(4) Outline of businesses: Manufacture and sales of beverages and foods: procurement/sales, etc.(5) Capital: ¥2,525 million
Extinct company 2(1) Company name: Sapporo Beverage Co., Ltd. (2) Head office: 20-1, Ebisu 4-chome, Shibuya-ku, Tokyo(3) Representative: Masatoshi Hori, President and Representative Director(4) Outline of businesses: Manufacture and sales of soft drinks, etc.(5) Capital: ¥5,421 million
Extinct company 3(1) Company name: HOKKAIDO POKKA CORPORATION(2) Head office: 2-30, Higashisapporo 6-jo 1-chome, Shiroishi-ku, Sapporo, Hokkaido(3) Representative: Yoshiho Murata, President and Representative Director(4) Outline of business: Sales of soft drinks and foods(5) Capital: ¥58 million
67SAPPORO HOLDINGS LIMITED Annual Report 2012
(Disposal of investment securities)At a Board of Directors’ meeting of POKKA SAPPORO FOOD & BEVERAGE LTD., (hereafter, “Pokka Sapporo”) held on January 8, 2013, and a Board of Directors’ meeting of the Company held on January 31, 2013, the Company and its consolidated subsidiary Pokka Sapporo resolved to dispose of investment securities held by Pokka Sapporo and concluded said disposal. Consequently, a gain on sales of investment securities was recorded.1. Date of said event
January 31, 2013 (date transfer agreement was concluded)2. Details of disposal of investment securities
① Investment securities to be disposed of: Komeda Co., Ltd.② Gain on sale: ¥3,472 million③ Buyer: MBKP3 (a fund managed by MBK Partners)④ Transfer date: February 15, 2013
3. Impact on profit or lossWe expect to post a gain on sale of investment securities in the fiscal year ending December 31, 2013.
(Decision on matters pertaining to purchase of treasury stock)At a board of directors’ meeting held on February 8, 2013, the Company decided to buy back the following treasury stock based on the provisions of Article 156 of Japan’s Companies Act as applied mutatis mutandis pursuant to Article 165, Paragraph 3 of said law. The aforementioned buyback has been completed.1. Reason for purchase of treasury stock
To implement a capital policy that can address changes in business environment flexibility.2. Details of purchase
① Types of stock to be purchased: Common stock of the Company② Total number of shares purchased: 3 million③ Total value of purchased shares: ¥928,096,000④ Purchase period: February 13, 2013 to February 22, 2013⑤ Purchase method: Purchased on the Tokyo Stock Exchange
(Issuance of corporate bonds)On March 14, 2013, the Company issued domestic straight corporate bonds based on the following conditions:27th Series of Unsecured Corporate Bonds1. Issuing company: Sapporo Holdings Ltd.2. Issuing amount: ¥10,000 million 3. Issue price: ¥100 with face value of ¥1004. Interest rate: 0.39% per annum5. Payment deadline: March 14, 20136. Maturity: March 14, 20187. Use of funds: Repayment of borrowings
Notes to Consolidated Financial Statements
68
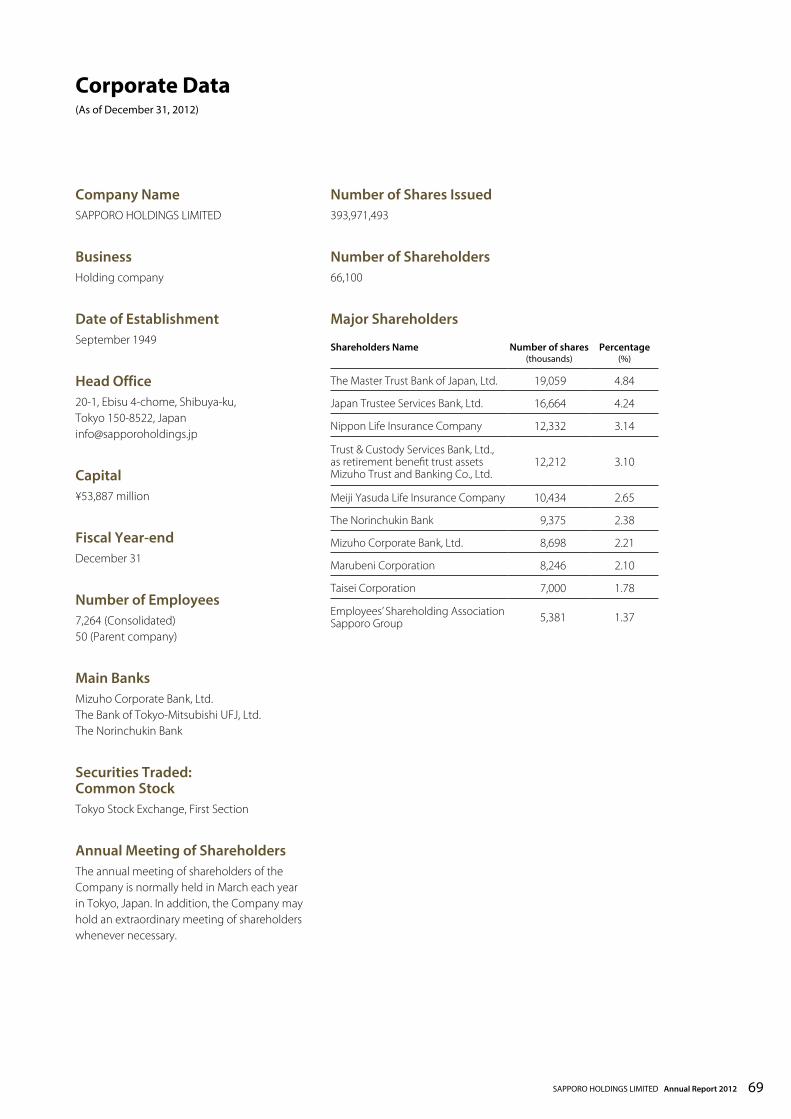
Company NameSAPPORO HOLDINGS LIMITED
BusinessHolding company
Date of EstablishmentSeptember 1949
Head Office20-1, Ebisu 4-chome, Shibuya-ku, Tokyo 150-8522, Japan [email protected]
Capital¥53,887 million
Fiscal Year-endDecember 31
Number of Employees7,264 (Consolidated) 50 (Parent company)
Main BanksMizuho Corporate Bank, Ltd. The Bank of Tokyo-Mitsubishi UFJ, Ltd. The Norinchukin Bank
Securities Traded: Common StockTokyo Stock Exchange, First Section
Annual Meeting of ShareholdersThe annual meeting of shareholders of the Company is normally held in March each year in Tokyo, Japan. In addition, the Company may hold an extraordinary meeting of shareholders whenever necessary.
Number of Shares Issued393,971,493
Number of Shareholders66,100
Major Shareholders
Corporate Data(As of December 31, 2012)
Shareholders Name Number of shares (thousands)
Percentage (%)
The Master Trust Bank of Japan, Ltd. 19,059 4.84
Japan Trustee Services Bank, Ltd. 16,664 4.24
Nippon Life Insurance Company 12,332 3.14
Trust & Custody Services Bank, Ltd.,as retirement benefit trust assetsMizuho Trust and Banking Co., Ltd.
12,212 3.10
Meiji Yasuda Life Insurance Company 10,434 2.65
The Norinchukin Bank 9,375 2.38
Mizuho Corporate Bank, Ltd. 8,698 2.21
Marubeni Corporation 8,246 2.10
Taisei Corporation 7,000 1.78
Employees’ Shareholding Association Sapporo Group 5,381 1.37

Printed in Japan
20-1, Ebisu 4-chome, Shibuya-ku,Tokyo 150-8522, Japan
SAPPORO HOLDINGS LIMITED
http://www.sapporoholdings.jp/english/