santa barbara county employees’
TRANSCRIPT

Santa Barbara County Employees’ Retirement System 2021 Private Real Return Strategic Plan

• Program Review 3
• Strategic Plan 9
• Appendix 15
Agenda

Program Review

SBCERS’ Private Real Return (“PRR”) Investment Policy has outlined the following:
Goal
To provide investment returns commensurate with the Program’s targets through participation in Private Real Return investment opportunities. To reach a target allocation of 9% of total plan assets.
Objectives
In addition, the Portfolio is focused on the following objectives:
• Preserve investment capital
• Provide diversification to SBCERS’ overall investment program
• Provide a hedge against inflation
• Provide cash yield as a component of the overall investment return
Benchmark:
• Achieve total returns that meet Portfolio’s benchmark, Consumer Price Index-All Urban Consumers (CPI-U) plus 4%
Investment Limitations as a % of Target Allocation:
• One manager – 25% maximum Multiple managers at 9%
• One co-investment – 10% maximum; total co-investments 40% maximum None to date
SBCERS’ PRR Portfolio Goals and Objectives
Hamilton Lane | Global Leader in the Private Markets Proprietary and Confidential | 4

SBCERS’ PRR Timeline
Hamilton Lane was hired in 2014 to select new investments, monitor, and provide advice for the private infrastructure and natural resources portfolio
Hamilton Lane | Global Leader in the Private Markets Proprietary and Confidential | 5
2012 – PRR Portfolio inception • SBCERS establishes 5% target allocation
2013 – Commitments made to two initial investments • Actis Energy 3 and U.S. Farming Realty Trust II
2014 – HL hired; allocation of $120 million over three years • Targeted annual commitments of $30 - $50 million
2015 – HL completed first investment • KKR Global Infrastructure Investors II, L.P.
2016 – Full investment year • Closed on $45 million to four partnerships
2017 – Target allocation increased to 9% • Investment tranche extended
2018 – Increased annual commitments to $90 million • PRR allocation reached 3.5%
2019 – Annual commitments reached $100 million • PRR allocation increased to 4.8%
2020 – Annual commitments surpassed $100 million • PRR allocation increased to 5.5%
SBCERS’ PRR AllocationAs of September 30, 2020
0%
1%
2%
3%
4%
5%
6%
7%
8%
9%
10%
$0
$10
$20
$30
$40
$50
$60
$70
$80
$90
$100
$110
2012 2013 2014 2015 2016 2017 2018 2019 2020
$ M
illio
n
Annual Commitment Allocation PRR Target Allocation Actual PRR Exposure

Strategically Building the Portfolio
Hamilton Lane | Global Leader in the Private Markets Proprietary and Confidential | 6
9/30/2015 9/30/2020 Long-Term Target
Strategic Diversification by Exposure
Str
ate
gy
Ge
og
rap
hy
Ind
us
try
Natural Resources
53%
Infrastructure47%
North America
57%
Europe23%
Asia3%
Rest of World16%
Natural Resources
79%
Infrastructure21%
North America
83%
Europe6%
Asia2%
Rest of World
9%
Oil & Gas23%
Power & Renewables
14%
Energy8%
Agriculture55%
NaturalResources
55-65%
Infrastructure35-45%
NorthAmerica40-80%
Europe10-50%
Asia0-20%
Rest of World0-20%
Oil & Gas19%
Power & Renewables
18%
Energy14%
Communications21%
Agriculture9%
Transport10%
Mining & Minerals4%
Timber2%
Other2%
Water1%
Oil & Gas10-25%
Power & Renewables
10-25%
Energy10-20%
Communications10-25%
Agriculture5-20%
Transport0-15%
Mining & Minerals
0-15%
Timber0-10%
Water0-10%

Activity Review
Hamilton Lane | Global Leader in the Private Markets Proprietary and Confidential | 7
• Expect contributions to outweigh distributions as build to target allocation
• Net cash outflow of $35.8M in 2020
• Record annual distribution activity in 2020
• Seven funds generated distributions greater than $1M during the year
Portfolio Cash Flow Activity
($60)
($50)
($40)
($30)
($20)
($10)
$0
$10
$20
$30
2013 2014 2015 2016 2017 2018 2019 2020
($ in
Mill
ion
s)
Contributions Distributions Net Cash Flow

Top Manager Exposure
Hamilton Lane | Global Leader in the Private Markets Proprietary and Confidential | 8
• Top five manager exposures are all generating positive since inception returns
• In aggregate the managers are generating an IRR of 8.2%
Investment Guidelines limits exposure to one manager to a maximum of 25% of total Program
• Portfolio is well diversified by manager with top exposure at 8.2% of the total Program
Top 5 GP Relationships by Total Exposure*As of September 30, 2020
General Partner Investment StrategyNumber of
FundsTotal Exposure
($M)% of TotalPortfolio
SinceInception IRR
Stonepeak Associates, LLC Infrastructure 2 $32.7 8.2% 21.6%
Global Infrastructure Partners Infrastructure 2 30.2 7.6% 1.9%
Brookfield Asset Management Infrastructure 2 30.1 7.6% 9.3%
GSO Capital Partners LP Natural Resources 2 28.3 7.1% 3.7%
EQT Limited Infrastructure 3 27.6 6.9% 13.0%
Total 11 $148.9 37.4% 8.2%
*Total Exposure defined as Reported Market Value plus Unfunded Commitment

Strategic Plan

2020 Strategic Plan Update
Hamilton Lane | Global Leader in the Private Markets Proprietary and Confidential | 10
Review of themes and objectives identified for 2020
Commitment Pacing• Met target commitment range with $108M in commitments; increased
allocation to 5.5%
Manager Concentration
• Committed to four existing manager relationships, while adding three new manager relationships (HitecVision, ISQ, Tiverton)
Short Term Performanceand Liquidity
• Seek potential j-curve mitigating strategies when available (e.g., cash yielding strategies)
Portfolio Diversification
• Prudent diversification by strategy and geography; 4 of 7 funds will target global investments
Board and Staff Education
• Co-Head of Real Assets provided Real Assets Market Overview at August Board Meeting

2020 Commitment Activity
• Total commitment activity of $108.4M in seven partnerships in-line with Strategic Plan objectives
• Four commitments to existing managers; three commitments to new managers
• Well diversified by strategy and geography
• Strong pipeline of opportunities for 2021
Hamilton Lane | Global Leader in the Private Markets Proprietary and Confidential | 11
Commitment Activity
Closing Date Partnership Investment Strategy Geographic FocusCommitment
($M)
2020 Allocation
2/27/2020 HitecVision North Sea Opportunity Fund, L.P. Natural Resources Western Europe $15.0
5/11/2020 Stonepeak Infrastructure Fund IV, L.P. Infrastructure North America $15.0
10/29/2020 EQT Infrastructure V, SCSp Infrastructure Global $18.4
10/30/2020 ISQ Global Infrastructure Fund III, L.P. Infrastructure Global $15.0
11/17/2020 Digital Colony Partners II, L.P. Infrastructure Global $15.0
1/27/2021 Tiverton AgriFinance II, L.P.1 Natural Resources North America $15.0
2/12/2021 Hancock Timberland and Farmland Fund, L.P.1 Natural Resources Global $15.0
Total $108.4
Note: Change in commitment amounts due to FX fluctuations.1 Legal process began in 2020 for Tiverton and Hancock; as such, counted towards 2020 allocation

Where Are We Headed?
Hamilton Lane | Global Leader in the Private Markets Proprietary and Confidential | 12
Identifying 2021 Portfolio Objectives
Commitment Pacing • Target annual commitments of $90M - $110M to reach long term target of 9%
Manager Concentration
• Commit to core manager relationships, while considering new managers
Short Term Performanceand Liquidity
• Seek potential j-curve mitigating strategies when available (e.g., cash yielding strategies)
Portfolio Diversification
• Consider target exposures (strategy and geography) in making investment decisions
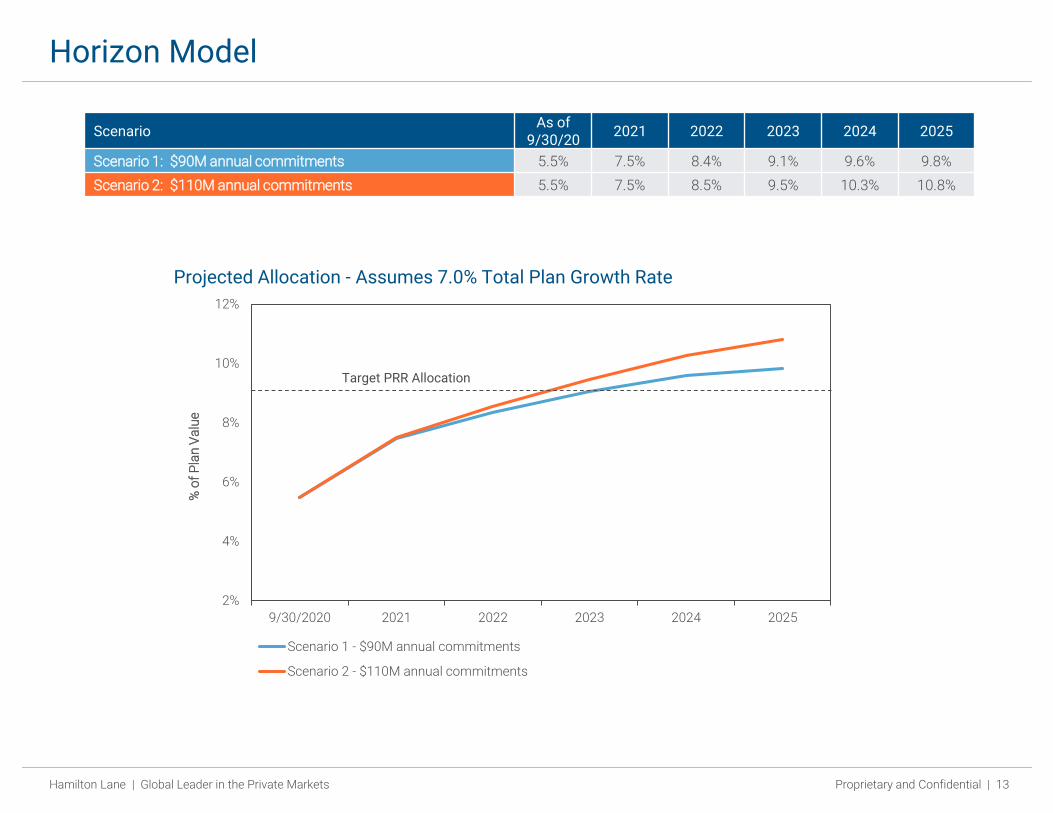
Horizon Model
Hamilton Lane | Global Leader in the Private Markets Proprietary and Confidential | 13
ScenarioAs of
9/30/202021 2022 2023 2024 2025
Scenario 1: $90M annual commitments 5.5% 7.5% 8.4% 9.1% 9.6% 9.8%
Scenario 2: $110M annual commitments 5.5% 7.5% 8.5% 9.5% 10.3% 10.8%
Projected Allocation - Assumes 7.0% Total Plan Growth Rate
2%
4%
6%
8%
10%
12%
9/30/2020 2021 2022 2023 2024 2025
% o
f P
lan
Va
lue
Scenario 1 - $90M annual commitments
Scenario 2 - $110M annual commitments
Target PRR Allocation

Forward Calendar
Hamilton Lane | Global Leader in the Private Markets Proprietary and Confidential | 14
• Existing managers back to market include two Infrastructure managers, diversified by size and geographic focus
• Will add new manager relationships in-line with Portfolio objectives
2021 Commitment Outlook
Partnership Investment Strategy Geographic FocusPrior Commitment
($M)
Existing Manager Relationships - likely to come back to market
Asterion Industrial Infra Fund II, FCR Infrastructure Western Europe $15.0
KKR Global Infrastructure Investors IV, L.P. Infrastructure Global $15.0
Total $30.0

Appendix

Philadelphia (Headquarters)One Presidential Blvd.4th FloorBala Cynwyd, PA 19004USA+1 610 934 2222
FrankfurtSchillerstr. 1260313 Frankfurt am MainGermany+49 89 954 537901
Scranton32 Scranton Office Park Suite 101Moosic, PA 18507USA+1 570 247 3739
Tokyo13F, Marunouchi Bldg.2-4-1, MarunouchiChiyoda-kuTokyo 100-6313, Japan+81 (0) 3 5860 3940
Hong KongRoom 1001-3, 10th FloorSt. George’s Building 2 Ice House StreetCentral Hong Kong, China+852 3987 7191
New York610 Fifth Avenue, Suite 401New York, NY 10020USA+1 212 752 7667
Seoul12F, Gangnam Finance Center152 Teheran-ro, Gangnam-guSeoul 06236Republic of Korea+82 2 6191 3200
Toronto150 King St. WestSuite 200Toronto, OntarioCanada M5H 1J9+1 647 715 9457
Las Vegas3753 Howard Hughes ParkwaySuite 200Las Vegas, NV 89169USA+1 702 784 7690
Portland15350 SW Sequoia PkwySuite 260Portland, OR 97224USA+1 503 624 9910
Singapore12 Marina ViewAsia Square Tower 2Suite 26-04Singapore, 018961 +65 6856 0920
London8-10 Great George StreetLondon SW1P 3AEUnited Kingdom+44 (0) 207 340 0100
San Diego7817 Ivanhoe AvenueSuite 310La Jolla, CA 92037USA+1 858 410 9967
SydneyLevel 33, Aurora Place88 Phillip StreetSydney NSW 2000Australia+61 2 9293 7950
Miami999 Brickell AvenueSuite 720Miami, Florida 33131USA+1 954 745 2780
San Francisco201 California Street, Suite 550San Francisco, CA 94111USA+1 415 365 1056
Tel Aviv6 Hahoshlim StreetBuilding C 7th FloorHertzelia Pituach, 4672201P.O. Box 12279Israel+972 73 2716610
Contact Information
Hamilton Lane | Global Leader in the Private Markets Proprietary and Confidential | 16
This presentation has been prepared solely for informational purposes and contains confidential and proprietary information, the disclosure of which could be harmful to Hamilton Lane. Accordingly, therecipients of this presentation are requested to maintain the confidentiality of the information contained herein. This presentation may not be copied or distributed, in whole or in part, without the prior writtenconsent of Hamilton Lane.
The information contained in this presentation may include forward-looking statements regarding returns, performance, opinions, the fund presented or its portfolio companies, or other events containedherein. Forward-looking statements include a number of risks, uncertainties and other factors beyond our control, or the control of the fund or the portfolio companies, which may result in material differencesin actual results, performance or other expectations. The opinions, estimates and analyses reflect our current judgment, which may change in the future.
All opinions, estimates and forecasts of future performance or other events contained herein are based on information available to Hamilton Lane as of the date of this presentation and are subject to change.Past performance of the investments described herein is not indicative of future results. In addition, nothing contained herein shall be deemed to be a prediction of future performance. The informationincluded in this presentation has not been reviewed or audited by independent public accountants. Certain information included herein has been obtained from sources that Hamilton Lane believes to bereliable, but the accuracy of such information cannot be guaranteed.
This presentation is not an offer to sell, or a solicitation of any offer to buy, any security or to enter into any agreement with Hamilton Lane or any of its affiliates. Any such offering will be made only at yourrequest. We do not intend that any public offering will be made by us at any time with respect to any potential transaction discussed in this presentation. Any offering or potential transaction will be madepursuant to separate documentation negotiated between us, which will supersede entirely the information contained herein.
Certain of the performance results included herein do not reflect the deduction of any applicable advisory or management fees, since it is not possible to allocate such fees accurately in a vintage yearpresentation or in a composite measured at different points in time. A client’s rate of return will be reduced by any applicable advisory or management fees, carried interest and any expenses incurred.Hamilton Lane’s fees are described in Part 2 of our Form ADV, a copy of which is available upon request.
The following hypothetical example illustrates the effect of fees on earned returns for both separate accounts and fund-of-funds investment vehicles. The example is solely for illustration purposes and is notintended as a guarantee or prediction of the actual returns that would be earned by similar investment vehicles having comparable features. The example is as follows: The hypothetical separate account orfund-of-funds consisted of $100 million in commitments with a fee structure of 1.0% on committed capital during the first four years of the term of the investment and then declining by 10% per yearthereafter for the 12-year life of the account. The commitments were made during the first three years in relatively equal increments and the assumption of returns was based on cash flow assumptionsderived from a historical database of actual private equity cash flows. Hamilton Lane modeled the impact of fees on four different return streams over a 12-year time period. In these examples, the effect ofthe fees reduced returns by approximately 2%. This does not include performance fees, since the performance of the account would determine the effect such fees would have on returns. Expenses also varybased on the particular investment vehicle and, therefore, were not included in this hypothetical example. Both performance fees and expenses would further decrease the return.
Hamilton Lane (UK) Limited is a wholly-owned subsidiary of Hamilton Lane Advisors, L.L.C. Hamilton Lane (UK) Limited is authorized and regulated by the Financial Conducts Authority. In the UK thiscommunication is directed solely at persons who would be classified as a professional client or eligible counterparty under the FCA Handbook of Rules and Guidance. Its contents are not directed at, may notbe suitable for and should not be relied upon by retail clients.
Hamilton Lane Advisors, L.L.C. is exempt from the requirement to hold an Australian financial services licence under the Corporations Act 2001 in respect of the financial services by operation of ASIC ClassOrder 03/1100: U.S. SEC regulated financial service providers. Hamilton Lane Advisors, L.L.C. is regulated by the SEC under U.S. laws, which differ from Australian laws.
Any tables, graphs or charts relating to past performance included in this presentation are intended only to illustrate the performance of the indices, composites, specific accounts or funds referred to for thehistorical periods shown. Such tables, graphs and charts are not intended to predict future performance and should not be used as the basis for an investment decision.
The information herein is not intended to provide, and should not be relied upon for, accounting, legal or tax advice, or investment recommendations. You should consult your accounting, legal, tax or otheradvisors about the matters discussed herein.
The calculations contained in this document are made by Hamilton Lane based on information provided by the general partner (e.g. cash flows and valuations), and have not been prepared, reviewed orapproved by the general partners.
Disclosures
Hamilton Lane | Global Leader in the Private Markets Proprietary and Confidential | 17
As of February 16, 2021