0 master file cafr - county of santa barbaracosb.countyofsb.org/uploadedfiles/sbcers/benefits/sbcers...
TRANSCRIPT
SBCERS
Comprehensive Annual
Financial Report
FOR FISCAL YEARS ENDED JUNE 30, 2016 AND 2015
SANTA BARBARA COUNTY EMPLOYEES’ RETIREMENT SYSTEM
A Pension Trust Fund for the County of Santa Barbara, California

This Page Intentionally Left Blank
Santa Barbara County Employees’ Re rement System
COMPREHENSIVE ANNUAL FINANCIAL REPORT FOR FISCAL YEARS ENDED JUNE 30, 2016 AND 2015
ISSUED BY:
Gregory E. Levin, Chief Executive Officer
Ellen Hung, Assistant Chief Executive Officer
Brian Richard, Assistant Chief Executive Officer
SBCERS
3916 State Street, Suite 100 Santa Barbara, CA 93105 805‐568‐2940
www.sbcers.org

This Page Intentionally Left Blank
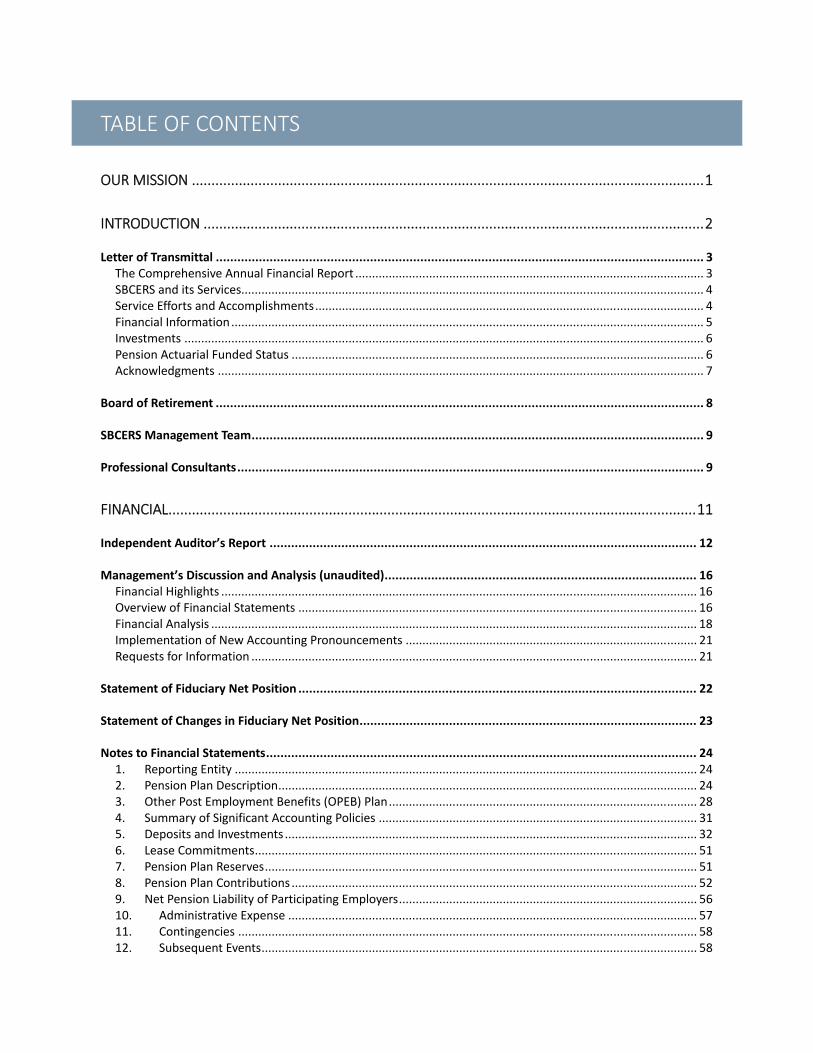
TABLE OF CONTENTS
OUR MISSION ................................................................................................................................... 1
INTRODUCTION ................................................................................................................................ 2
Letter of Transmittal ........................................................................................................................................ 3 The Comprehensive Annual Financial Report ........................................................................................................ 3 SBCERS and its Services.......................................................................................................................................... 4 Service Efforts and Accomplishments .................................................................................................................... 4 Financial Information ............................................................................................................................................. 5 Investments ........................................................................................................................................................... 6 Pension Actuarial Funded Status ........................................................................................................................... 6 Acknowledgments ................................................................................................................................................. 7
Board of Retirement ........................................................................................................................................ 8
SBCERS Management Team .............................................................................................................................. 9
Professional Consultants .................................................................................................................................. 9
FINANCIAL ....................................................................................................................................... 11
Independent Auditor’s Report ....................................................................................................................... 12
Management’s Discussion and Analysis (unaudited) ....................................................................................... 16 Financial Highlights .............................................................................................................................................. 16 Overview of Financial Statements ....................................................................................................................... 16 Financial Analysis ................................................................................................................................................. 18 Implementation of New Accounting Pronouncements ....................................................................................... 21 Requests for Information ..................................................................................................................................... 21
Statement of Fiduciary Net Position ............................................................................................................... 22
Statement of Changes in Fiduciary Net Position .............................................................................................. 23
Notes to Financial Statements ........................................................................................................................ 24 1. Reporting Entity .......................................................................................................................................... 24 2. Pension Plan Description ............................................................................................................................. 24 3. Other Post Employment Benefits (OPEB) Plan ............................................................................................ 28 4. Summary of Significant Accounting Policies ............................................................................................... 31 5. Deposits and Investments ........................................................................................................................... 32 6. Lease Commitments .................................................................................................................................... 51 7. Pension Plan Reserves ................................................................................................................................. 51 8. Pension Plan Contributions ......................................................................................................................... 52 9. Net Pension Liability of Participating Employers ......................................................................................... 56 10. Administrative Expense .......................................................................................................................... 57 11. Contingencies ......................................................................................................................................... 58 12. Subsequent Events .................................................................................................................................. 58

REQUIRED SUPPLEMENTARY INFORMATION .................................................................................. 59
Required Supplementary Information – Pension ............................................................................................ 60
Required Supplementary Information – (OPEB) .............................................................................................. 63
OTHER SUPPLEMENTARY INFORMATION ........................................................................................ 65
INVESTMENT ................................................................................................................................... 68
Investment Policies ........................................................................................................................................ 72
ACTUARIAL ...................................................................................................................................... 80
Summary of Actuarial Assumptions and Methods .......................................................................................... 87 Actuarial Assumptions and Methods ................................................................................................................... 87 Actuarial Cost Method ......................................................................................................................................... 87 Actuarial Asset Valuation Method ....................................................................................................................... 87 Amortization of Gains and Losses ........................................................................................................................ 87 Investment Rate of Return ................................................................................................................................... 88 Administrative Expenses ...................................................................................................................................... 88 Projected Salary Increases ................................................................................................................................... 88 Post‐Retirement Benefit Increases ....................................................................................................................... 88 Expectation of Life after Retirement .................................................................................................................... 88 Expectation of Life after Disability ....................................................................................................................... 89 Mortality Tables Impact on Employee Contribution Rates .................................................................................. 89
Probability of Separation from Active Service ................................................................................................. 90 Years of Life Expectancy ....................................................................................................................................... 91
Salary Increase Assumptions .......................................................................................................................... 95
Active Member Data ...................................................................................................................................... 97
Actuarial Sovency Test ................................................................................................................................... 99 Pension Plan ......................................................................................................................................................... 99
Summary of Major Pension Plan Provisions .................................................................................................. 102 Eligibility ............................................................................................................................................................. 102 Final Compensation ........................................................................................................................................... 103 Service Retirement ............................................................................................................................................. 103 Disability Retirement ......................................................................................................................................... 104 Death Before Retirement ................................................................................................................................... 104 Death After Retirement ..................................................................................................................................... 105 Vesting ............................................................................................................................................................... 105 Member’s Contributions .................................................................................................................................... 105 Maximum Benefit .............................................................................................................................................. 105 Cost‐Of‐Living ..................................................................................................................................................... 105
STATISTICAL ................................................................................................................................... 106

Introduction to the Statistical Section .......................................................................................................... 107
Statistical Schedules .................................................................................................................................... 108
GLOSSARY ..................................................................................................................................... 112

This Page Intentionally Left Blank

1
OUR MISSION
The Santa Barbara County Employees’ Retirement System is committed to fulfilling its fiduciary responsibility by providing the highest quality of service to all members and plan sponsors, and protecting promised benefits through prudent investing, while ensuring reasonable expenses of administration.

2
INTRODUCTION

3
LETTER OF TRANSMITTAL
Santa Barbara County Employees’ Retirement System Gregory E. Levin, Chief Executive Officer
January 23, 2017
Board of Retirement
Santa Barbara County Employees’ Retirement System
3916 State Street, Suite 100
Santa Barbara, CA 93105
Dear Board Members:
I am pleased to submit this Comprehensive Annual Financial Report (CAFR) of the Santa Barbara County Employees’ Retirement System (SBCERS or the System) for Fiscal Years Ended June 30, 2016 and June 30, 2015. This report is intended to provide readers with complete and reliable information about the SBCERS’ financial status, compliance with the law, and administrative consistency with policy.
As of June 30, 2016, the SBCERS Net Position Restricted for Benefits was $ 2.56 billion. Net position grew by $ 25.1 million during the fiscal year. The increase reflects the moderate performance of SBCERS’ investments combined with additions exceeding deductions for the current period. The retirement fund experienced a market rate of return of 1.38% (net of fees), underperforming its policy benchmark (2.33%) by approximately ‐0.95% (net of fees) for the year ended June 30, 2016.
The 401(h) Retiree Health Medical Trust Fund was established in September 2008. The assets of this fund are invested separately from pension assets. The activity in the 401(h) Retiree Health Medical Trust Fund is separate from the pension fund activity and is recorded as such in the financial statements.
THE COMPREHENSIVE ANNUAL FINANCIAL REPORT
Responsibility for both accuracy of the data and the completeness and fairness of the presentation rests with SBCERS’ management. It is our intent and belief that the enclosed data is accurate in all material respects and is reported in a manner designed to present fairly the financial position and results of operations of SBCERS.
SBCERS QUICK FACTS
Net Position: $ 2.56 billion
Net Investment Return: 1.38%
Number of Members:
9,910
4
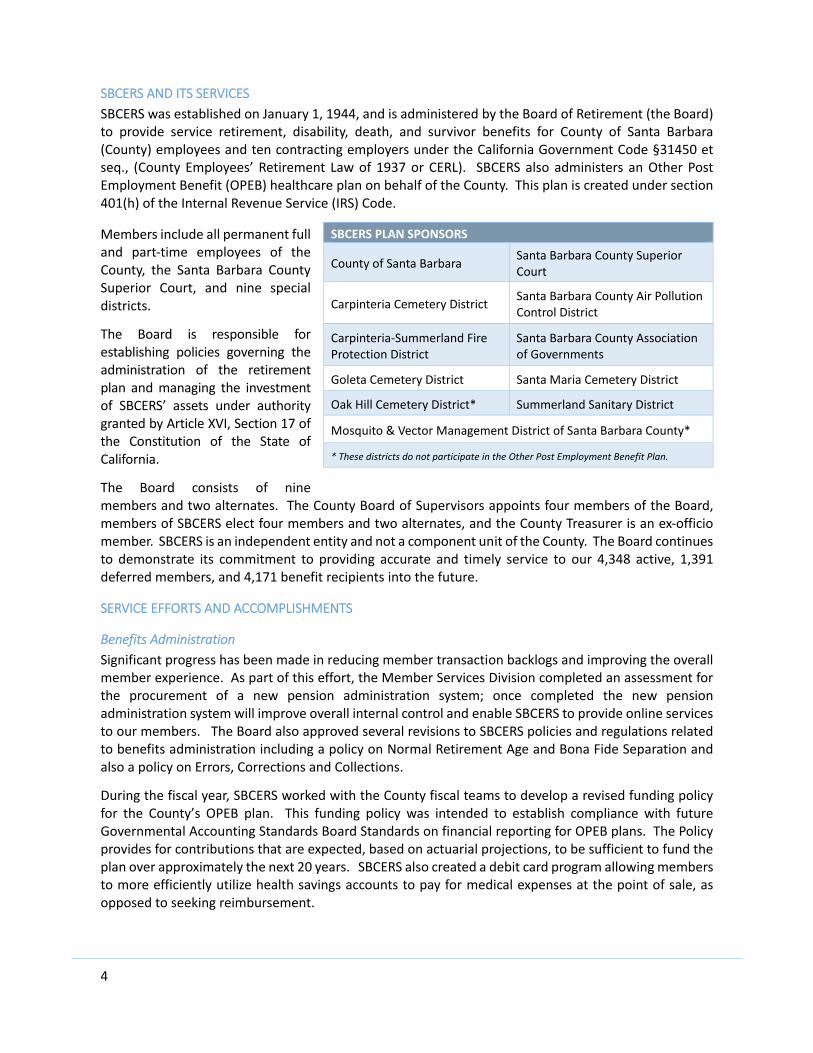
SBCERS AND ITS SERVICES
SBCERS was established on January 1, 1944, and is administered by the Board of Retirement (the Board) to provide service retirement, disability, death, and survivor benefits for County of Santa Barbara (County) employees and ten contracting employers under the California Government Code §31450 et seq., (County Employees’ Retirement Law of 1937 or CERL). SBCERS also administers an Other Post Employment Benefit (OPEB) healthcare plan on behalf of the County. This plan is created under section 401(h) of the Internal Revenue Service (IRS) Code.
Members include all permanent full and part‐time employees of the County, the Santa Barbara County Superior Court, and nine special districts.
The Board is responsible for establishing policies governing the administration of the retirement plan and managing the investment of SBCERS’ assets under authority granted by Article XVI, Section 17 of the Constitution of the State of California.
The Board consists of nine members and two alternates. The County Board of Supervisors appoints four members of the Board, members of SBCERS elect four members and two alternates, and the County Treasurer is an ex‐officio member. SBCERS is an independent entity and not a component unit of the County. The Board continues to demonstrate its commitment to providing accurate and timely service to our 4,348 active, 1,391 deferred members, and 4,171 benefit recipients into the future.
SERVICE EFFORTS AND ACCOMPLISHMENTS
Benefits Administration
Significant progress has been made in reducing member transaction backlogs and improving the overall member experience. As part of this effort, the Member Services Division completed an assessment for the procurement of a new pension administration system; once completed the new pension administration system will improve overall internal control and enable SBCERS to provide online services to our members. The Board also approved several revisions to SBCERS policies and regulations related to benefits administration including a policy on Normal Retirement Age and Bona Fide Separation and also a policy on Errors, Corrections and Collections.
During the fiscal year, SBCERS worked with the County fiscal teams to develop a revised funding policy for the County’s OPEB plan. This funding policy was intended to establish compliance with future Governmental Accounting Standards Board Standards on financial reporting for OPEB plans. The Policy provides for contributions that are expected, based on actuarial projections, to be sufficient to fund the plan over approximately the next 20 years. SBCERS also created a debit card program allowing members to more efficiently utilize health savings accounts to pay for medical expenses at the point of sale, as opposed to seeking reimbursement.
SBCERS PLAN SPONSORS
County of Santa Barbara Santa Barbara County Superior Court
Carpinteria Cemetery District Santa Barbara County Air Pollution Control District
Carpinteria‐Summerland Fire Protection District
Santa Barbara County Association of Governments
Goleta Cemetery District Santa Maria Cemetery District
Oak Hill Cemetery District* Summerland Sanitary District
Mosquito & Vector Management District of Santa Barbara County*
* These districts do not participate in the Other Post Employment Benefit Plan.
5
Investments
The investments team completed a request for proposal process for a new General Investment Consultant. At the conclusion of this process, the Board selected RVK, Inc. as the System’s new investment consultant tasked with assisting the Board to administer the portfolio and make determinations regarding asset allocation, manager selection, and secondary investment consultants beginning June 30, 2016. The investment team also completed several manager transitions during the year including the successful implementation of a low volatility equity strategy and the creation of a short‐term cash facility. Another significant achievement was considerable progress was made toward the implementation of SBCERS’ consultant oversight review policy, which provides for a process to document and improve on the fiduciary due diligence conducted by staff under the direction of the Board.
Finance
The SBCERS finance team received the GFOA award for CAFR reporting for its work on the fiscal year ended June 30, 2015 CAFR. In addition, the finance team significantly improved internal control over cash management by implementing a new cash flow analysis and reporting package for Quarterly review by the Board.
Legal and Compliance
The SBCERS legal team timely completed the filing of the System’s IRS determination letter filing during the fiscal year ended June 30, 2016. The determination letter filing reflects the System’s ongoing commitment to strong internal control and effective benefit plan management. In addition to completing the determination letter filing and approval, significant improvements were made to the Board’s policy framework with several new operating policies developed during the fiscal year.
Disability
The SBCERS disability team timely completed the review and appointment of its disability referee panel during the fiscal year ended June 30, 2016. Another significant accomplishment of the disability team was the development and reporting of historical data trends as they relate to the disability process. This effort provided the Board with an enhanced understanding of the disability process and enabled discussion of policy areas for further research by the Board.
FINANCIAL INFORMATION
SBCERS’ management is responsible for the accuracy of the data, the completeness and fairness of the presentation of financial information, including all disclosures, and establishing and maintaining an internal control structure designed to provide reasonable assurance regarding the safekeeping of assets and the reliability of financial records. SBCERS’ management is responsible for establishing and maintaining an internal control structure designed to ensure that SBCERS’ assets are protected from loss, theft, or misuse. Because the cost of the control should not exceed the benefits derived, the objective is to provide reasonable, rather than absolute assurance that the financial statements are free of any material misstatements. Brown Armstrong Accountancy Corporation, SBCERS’ independent auditors, have audited the financial statements and expressed their opinion that SBCERS’ financial statements are presented in conformity with accounting principles generally accepted in the United States of America and are free of material misstatement.
6
INVESTMENTS
The Board has exclusive control of all investments of SBCERS and is responsible for the establishment of investment objectives, strategies, and policies. Each member of the Board serves in a fiduciary capacity and the Board is authorized to invest in any form or type of investment it collectively deems prudent.
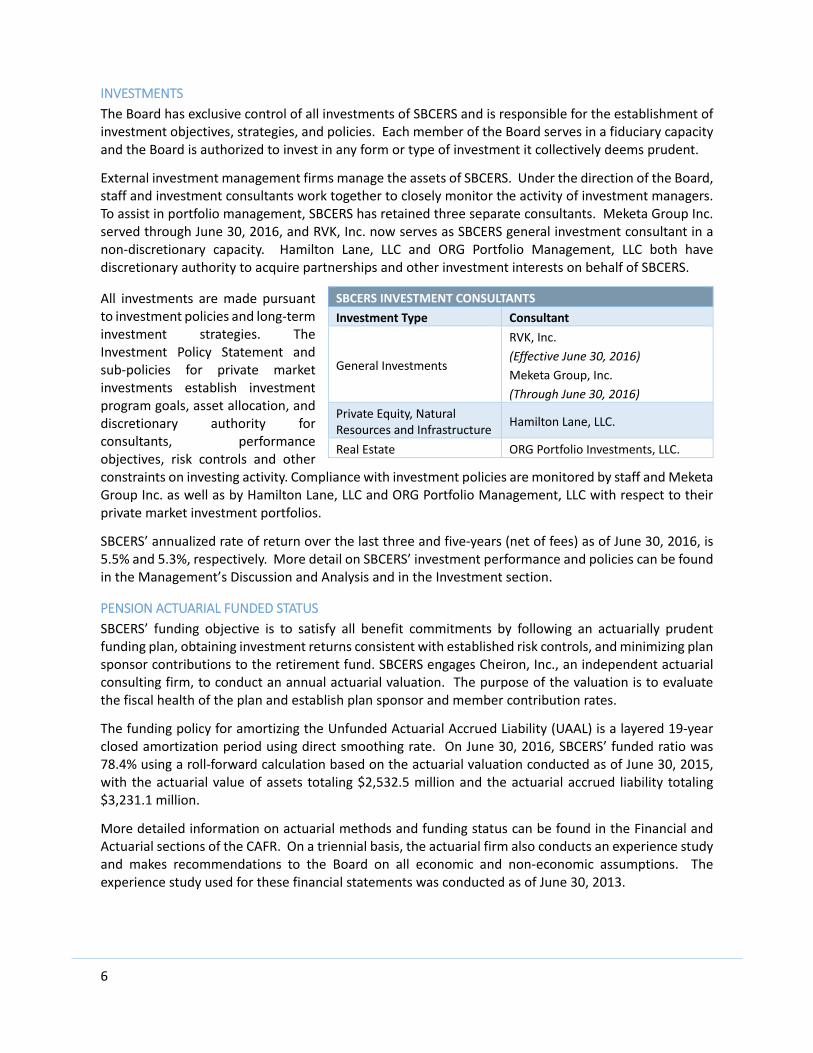
External investment management firms manage the assets of SBCERS. Under the direction of the Board, staff and investment consultants work together to closely monitor the activity of investment managers. To assist in portfolio management, SBCERS has retained three separate consultants. Meketa Group Inc. served through June 30, 2016, and RVK, Inc. now serves as SBCERS general investment consultant in a non‐discretionary capacity. Hamilton Lane, LLC and ORG Portfolio Management, LLC both have discretionary authority to acquire partnerships and other investment interests on behalf of SBCERS.
All investments are made pursuant to investment policies and long‐term investment strategies. The Investment Policy Statement and sub‐policies for private market investments establish investment program goals, asset allocation, and discretionary authority for consultants, performance objectives, risk controls and other constraints on investing activity. Compliance with investment policies are monitored by staff and Meketa Group Inc. as well as by Hamilton Lane, LLC and ORG Portfolio Management, LLC with respect to their private market investment portfolios.
SBCERS’ annualized rate of return over the last three and five‐years (net of fees) as of June 30, 2016, is 5.5% and 5.3%, respectively. More detail on SBCERS’ investment performance and policies can be found in the Management’s Discussion and Analysis and in the Investment section.
PENSION ACTUARIAL FUNDED STATUS
SBCERS’ funding objective is to satisfy all benefit commitments by following an actuarially prudent funding plan, obtaining investment returns consistent with established risk controls, and minimizing plan sponsor contributions to the retirement fund. SBCERS engages Cheiron, Inc., an independent actuarial consulting firm, to conduct an annual actuarial valuation. The purpose of the valuation is to evaluate the fiscal health of the plan and establish plan sponsor and member contribution rates.
The funding policy for amortizing the Unfunded Actuarial Accrued Liability (UAAL) is a layered 19‐year closed amortization period using direct smoothing rate. On June 30, 2016, SBCERS’ funded ratio was 78.4% using a roll‐forward calculation based on the actuarial valuation conducted as of June 30, 2015, with the actuarial value of assets totaling $2,532.5 million and the actuarial accrued liability totaling $3,231.1 million.
More detailed information on actuarial methods and funding status can be found in the Financial and Actuarial sections of the CAFR. On a triennial basis, the actuarial firm also conducts an experience study and makes recommendations to the Board on all economic and non‐economic assumptions. The experience study used for these financial statements was conducted as of June 30, 2013.
SBCERS INVESTMENT CONSULTANTS
Investment Type Consultant
General Investments
RVK, Inc.
(Effective June 30, 2016)
Meketa Group, Inc.
(Through June 30, 2016)
Private Equity, Natural Resources and Infrastructure
Hamilton Lane, LLC.
Real Estate ORG Portfolio Investments, LLC.
7
ACKNOWLEDGMENTS
I would like to express my appreciation for the dedication and efforts of the staff members who contributed to the preparation of the CAFR. Their combined efforts have produced a report that will enable the Board, members and the plan sponsors to better evaluate and understand SBCERS. I also want to express my thanks to the Board for its dedicated effort and to the retirement staff for its commitment to SBCERS, a combination that assures SBCERS’ continued successful operation.
Respectfully submitted,
Gregory E. Levin, CPA
Chief Executive Officer

8
BOARD OF RETIREMENT
Chair
General Member
Jennifer ChristensenVice Chair
Safety Member
Fredrick TanSecretary
General Member
Mark PaulCounty Treasurer
Ex Officio
Harry Hagen
Retired Member
Zandra Cholomondeley
Appointed Member
Al Rotella
Appointed Member
Janet Wolf
Appointed Member
Ward Rafferty
Safety Alternate
Steven Johnson
Retired Alternate
John McMillin
Appointed Member
Vacant

9
SBCERS MANAGEMENT TEAM
PROFESSIONAL CONSULTANTS
Actuary Cheiron, Inc.
Independent Auditor Brown Armstrong Accountancy Corporation
Investment Custodian BNY Mellon Global Securities Services
Investment Consultants
& Other Special Services:
General Investments Meketa Group Inc.
RVK Inc.
Real Estate Investments ORG Portfolio Management, LLC
Private Equity, Natural Resources,
and Infrastructure
Hamilton Lane, LLC
Legal Advisors:
General Counsel Reicker, Pfau, Pyle & McRoy, LLP
Investment and Fiduciary Counsel Reed Smith, LLP
Tax Counsel Steptoe & Johnson, LLP
A listing of Investment Managers is located in the Investment section.

10
This Page Intentionally Left Blank

11
FINANCIAL

INDEPENDENT AUDITOR’S REPORT Board of Retirement Santa Barbara County Employees’ Retirement System Report on the Financial Statements We have audited the accompanying Statement of Fiduciary Net Position of Santa Barbara County Employees’ Retirement System (SBCERS) as of June 30, 2016 and 2015, the related Statement of Changes in Fiduciary Net Position for the years then ended, and the related notes to the financial statements, which collectively comprise SBCERS’ basic financial statements as listed in the table of contents. Management’s Responsibility for the Financial Statements Management is responsible for the preparation and fair presentation of these financial statements in accordance with accounting principles generally accepted in the United States of America; this includes the design, implementation, and maintenance of internal control relevant to the preparation and fair presentation of financial statements that are free from material misstatement, whether due to fraud or error. Auditor’s Responsibility Our responsibility is to express an opinion on these financial statements and other information based on our audit. We conducted our audit in accordance with auditing standards generally accepted in the United States of America and the standards applicable to financial audits contained in Government Auditing Standards, issued by the Comptroller General of the United States. Those standards require that we plan and perform the audit to obtain reasonable assurance about whether the financial statements are free from material misstatement. An audit involves performing procedures to obtain audit evidence about the amounts and disclosures in the financial statements. The procedures selected depend on the auditor’s judgment, including the assessment of the risks of material misstatement of the financial statements, whether due to fraud or error. In making those risk assessments, the auditor considers internal control relevant to SBCERS’ preparation and fair presentation of the financial statements in order to design audit procedures that are appropriate in the circumstances, but not for the purpose of expressing an opinion on the effectiveness of SBCERS’ internal control. Accordingly, we express no such opinion. An audit also includes evaluating the appropriateness of accounting policies used and the reasonableness of significant accounting estimates made by management, as well as evaluating the overall presentation of the financial statements. We believe that the audit evidence we have obtained is sufficient and appropriate to provide a basis for our audit opinion.

Opinion In our opinion, the financial statements referred to above present fairly, in all material respects, the fiduciary net position of SBCERS as of June 30, 2016 and 2015, and the changes in fiduciary net position for the years then ended in accordance with accounting principles generally accepted in the United States of America. Emphasis of Matter As discussed in Note 9 to the basic financial statements, based on the actuarial valuation of the pension plan as of June 30, 2015, rolled forward to June 30, 2016, the total pension liability of the participating employers exceeded the pension plan’s fiduciary net position by $840,713,706. The fiduciary net position as a percentage of the total pension plan liability as of June 30, 2016, was 75.2%. The actuarial valuations are very sensitive to the underlying actuarial assumptions, including a discount rate of 7.50%, which represents the long-term expected rate of return. Additionally, as discussed in Note 4 to the basic financial statements, in 2016, SBCERS adopted Governmental Accounting Standards Board (GASB) Statement No. 72, Fair Value Measurement and Application. Our opinion is not modified with respect to these matters. Other Matters Required Supplementary Information Accounting principles generally accepted in the United States of America require that the Management’s Discussion and Analysis and Required Supplemental Information, as listed in the table of contents, be presented to supplement the basic financial statements. Such information, although not a part of the basic financial statements, is required by GASB, who considers it to be an essential part of financial reporting for placing the basic financial statements in an appropriate operational, economic, or historical context. We have applied certain limited procedures to the required supplementary information in accordance with auditing standards generally accepted in the United States of America, which consisted of inquiries of management about the methods of preparing the information and comparing the information for consistency with management’s responses to our inquiries, the basic financial statements, and other knowledge we obtained during our audit of the basic financial statements. We do not express an opinion or provide any assurance on the information because the limited procedures do not provide us with sufficient evidence to express an opinion or provide any assurance. Other Supplemental Information Our audit was conducted for the purpose of forming an opinion on the financial statements that collectively comprise SBCERS’ basic financial statements. The other supplementary information and introduction, investment, actuarial, statistical, and glossary sections, as noted in the table of contents, are presented for purposes of additional analysis and are not a required part of the basic financial statements. The other supplementary information is the responsibility of management and was derived from and relates directly to the underlying accounting and other records used to prepare the basic financial statements. Such information has been subjected to the auditing procedures applied in the audit of the basic financial statements and certain additional procedures, including comparing and reconciling such information directly to the underlying accounting and other records used to prepare the basic financial statements or to the basic financial statements themselves, and other additional procedures in accordance with auditing standards generally accepted in the United States of America. In our opinion, the other supplementary information is fairly stated, in all material respects, in relation to the basic financial statements as a whole.
The introduction, investment, actuarial, statistical, and glossary sections have not been subjected to the auditing procedures applied in the audit of the basic financial statements and, accordingly, we do not express an opinion or provide any assurance on them. Other Reporting Required by Government Auditing Standards In accordance with Government Auditing Standards, we have also issued our report dated January 23, 2017, on our consideration of SBCERS’ internal control over financial reporting and on our tests of its compliance with certain provisions of laws, regulations, contracts, and other matters. The purpose of that report is to describe the scope of our testing of internal control over financial reporting and compliance and the results of that testing, and not to provide an opinion on the internal control over financial reporting or on compliance. That report is an integral part of an audit performed in accordance with Government Auditing Standards in considering SBCERS’ internal control over financial reporting and compliance. BROWN ARMSTRONG ACCOUNTANCY CORPORATION Bakersfield, California January 23, 2017

15
This Page Intentionally Left Blank
16
MANAGEMENT’S DISCUSSION AND ANALYSIS (UNAUDITED) This Management’s Discussion and Analysis of the financial activities of Santa Barbara County Employees’ Retirement System (SBCERS) is an overview of fiscal operations for the fiscal years ended June 30, 2016 and June 30, 2015. Please review it in conjunction with the Financial Statements.
FINANCIAL HIGHLIGHTS
Pension Trust
Net Position Restricted for Benefits ‐ Pension, as reported in the Statement of Fiduciary Net Position, total $ 2.55 billion, an increase of $ 22 million or 0.9% from the prior year. This is due to an increase in overall investment return.
Net pension investment income (including securities lending) increased by $ 11.1 million from $ 20.4 million in the fiscal year ended June 30, 2015, to $ 31.4 million in the fiscal year ended June 30, 2016. The increase is related to market conditions favoring SBCERS investment allocation.
Pension contributions (member and plan sponsor) increased by $ 0.8 million from the fiscal year ended June 30, 2015, to $ 141.1 million in fiscal year ended June 30, 2016. The change is due to a decrease in plan sponsor and certain employee contribution rates from the 2014 Actuarial Valuation offset by an increase in covered payroll.
Pension benefit payments increased by $ 8.9 million or 6.5% from the fiscal year ended June 30, 2015 to $ 145.7 million in the fiscal year ended June 30, 2016. The increase is related to rising benefit rolls as the number of retirees continue to increase. Additionally, newer retirees generally have higher monthly stipends than members who have been retired for a long period of time.
On June 30, 2016, SBCERS’ funded ratio was 75.2%. The decrease in funded ratio reflected an asset value of $ 2.56 billion as of June 30, 2016 and a rolled‐forward total pension liability totaling $ 3.4 billion. This decrease is primarily due to the fact that actual investment return (on the fair value of assets net of investment expenses) was less than the assumed rate of return. The fiduciary net position as a percentage of total pension liability as of June 30, 2015, was 77.7%, based on the fair value of assets and a roll forward of the June 30, 2014 liability.
Other Post‐Employment Benefit (OPEB) Trust
Net Position Restricted for Benefits – Other Post‐Employment Benefits (OPEB), also reported in the Statement of Fiduciary Net Position totaled $ 8 million, an increase of $ 3 million or 61.2% from prior year. This is primarily due to a prefunding of contributions by the County of Santa Barbara (the County).
$ 11.7 million of OPEB contributions were received and used to provide for $ 9.2 million of OPEB benefits and administrative expenses paid in the fiscal year ended June 30, 2016.
OVERVIEW OF FINANCIAL STATEMENTS
This Management’s Discussion and Analysis serves as an introduction to the basic financial statements. SBCERS has two basic financial statements, the Notes to the Financial Statements (Notes), and additional required supplementary schedules of historical trend information. The basic financial statements and the

17
required disclosures are prepared in accordance with Governmental Accounting Standards Board’s (GASB) accounting principles and utilize the accrual basis of accounting.
The Statement of Fiduciary Net Position is the first basic financial report. This statement of account balances at fiscal year‐end reflects assets available for future payments to retirees and their beneficiaries and any current liabilities that are owed at fiscal year‐end. Net Position Restricted for Benefits, which is the assets less the liabilities, reflect the funds available for future use.
The Statement of Changes in Fiduciary Net Position is the second basic financial report. This report reflects all the activities that occurred during the fiscal year, and shows the impact of those activities as additions or deductions to the plan.
The Notes are an integral part of the basic financial statements. They provide detailed discussion of key policies, programs, and activities that occurred during the year.
The implementation of GASB Statement No. 67 (GASB 67) during the year ended June 30, 2014, increased the number of schedules in the Required Supplemental Information section. These new schedules provide a broad range of financial information including a pension liability measurement and changes to the liability, historical contributions, money‐weighted investment return, and additional actuarial related disclosures.
The Schedule of Funding Progress for OPEB, a required supplemental schedule, includes historical trend information about the funded status of the plan, and the progress made in accumulating sufficient assets to pay benefits when due.
The Schedule of Plan Sponsor Contributions for OPEB, also a required supplemental schedule, presents historical trend information about the annual required contributions of the employers and the actual contributions made.
18
FINANCIAL ANALYSIS
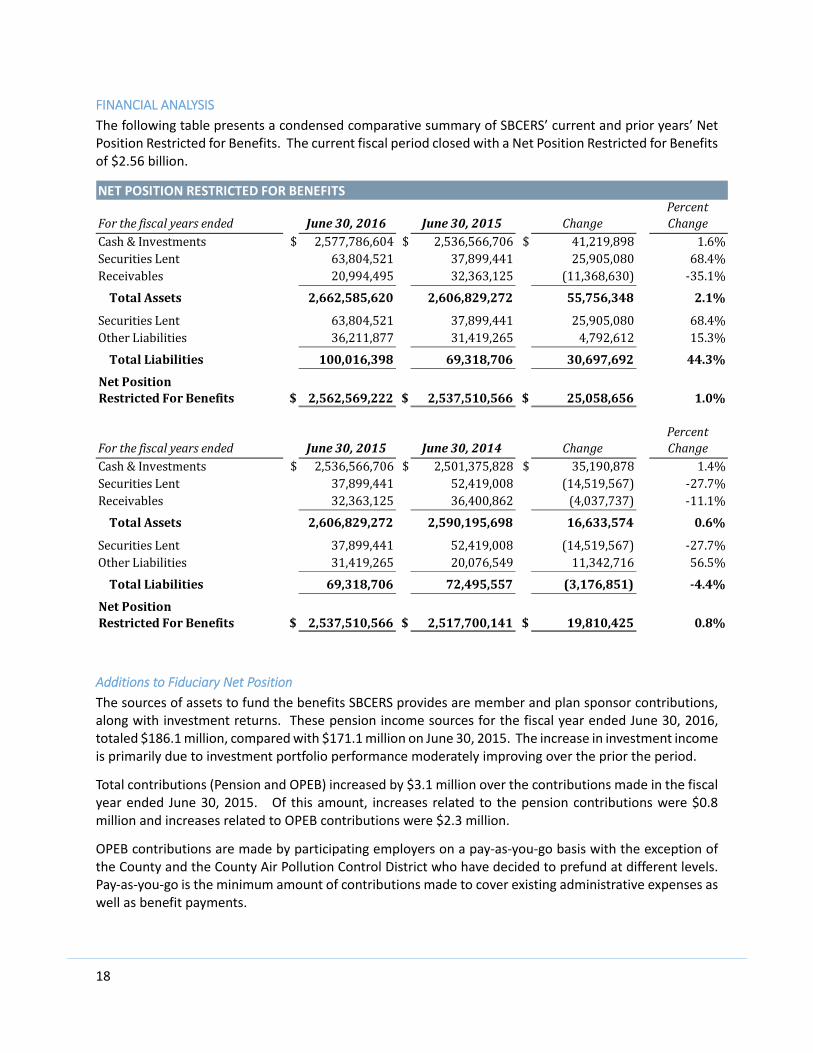
The following table presents a condensed comparative summary of SBCERS’ current and prior years’ Net Position Restricted for Benefits. The current fiscal period closed with a Net Position Restricted for Benefits of $2.56 billion.
Forthefiscalyearsended June30,2016 June30,2015 ChangePercentChange
Cash&Investments $ 2,577,786,604 $ 2,536,566,706 $ 41,219,898 1.6%SecuritiesLent 63,804,521 37,899,441 25,905,080 68.4%Receivables 20,994,495 32,363,125 (11,368,630) ‐35.1%
TotalAssets 2,662,585,620 2,606,829,272 55,756,348 2.1%
SecuritiesLent 63,804,521 37,899,441 25,905,080 68.4%OtherLiabilities 36,211,877 31,419,265 4,792,612 15.3%
TotalLiabilities 100,016,398 69,318,706 30,697,692 44.3%
NetPositionRestrictedForBenefits $ 2,562,569,222 $ 2,537,510,566 $ 25,058,656 1.0%
Forthefiscalyearsended June30,2015 June30,2014 ChangePercentChange
Cash&Investments $ 2,536,566,706 $ 2,501,375,828 $ 35,190,878 1.4%SecuritiesLent 37,899,441 52,419,008 (14,519,567) ‐27.7%Receivables 32,363,125 36,400,862 (4,037,737) ‐11.1%
TotalAssets 2,606,829,272 2,590,195,698 16,633,574 0.6%
SecuritiesLent 37,899,441 52,419,008 (14,519,567) ‐27.7%OtherLiabilities 31,419,265 20,076,549 11,342,716 56.5%
TotalLiabilities 69,318,706 72,495,557 (3,176,851) ‐4.4%
NetPositionRestrictedForBenefits $ 2,537,510,566 $ 2,517,700,141 $ 19,810,425 0.8%
NET POSITION RESTRICTED FOR BENEFITS
Additions to Fiduciary Net Position
The sources of assets to fund the benefits SBCERS provides are member and plan sponsor contributions, along with investment returns. These pension income sources for the fiscal year ended June 30, 2016, totaled $186.1 million, compared with $171.1 million on June 30, 2015. The increase in investment income is primarily due to investment portfolio performance moderately improving over the prior the period.
Total contributions (Pension and OPEB) increased by $3.1 million over the contributions made in the fiscal year ended June 30, 2015. Of this amount, increases related to the pension contributions were $0.8 million and increases related to OPEB contributions were $2.3 million.
OPEB contributions are made by participating employers on a pay‐as‐you‐go basis with the exception of the County and the County Air Pollution Control District who have decided to prefund at different levels. Pay‐as‐you‐go is the minimum amount of contributions made to cover existing administrative expenses as well as benefit payments.
19
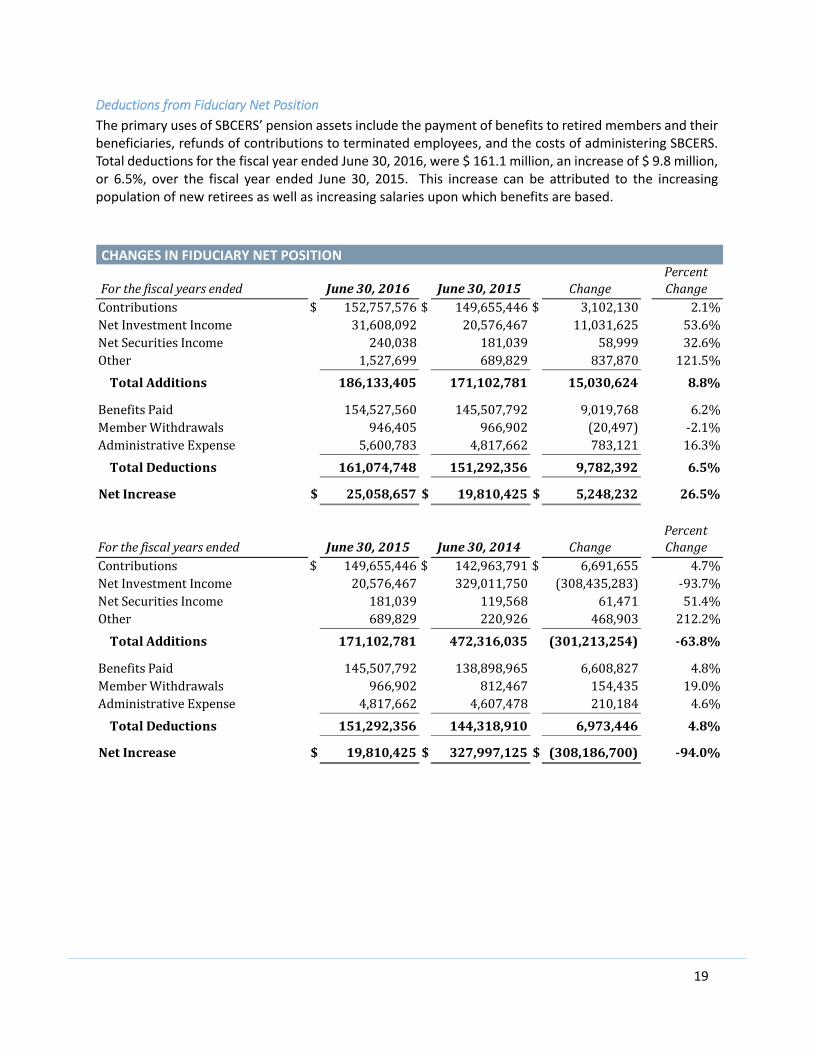
Deductions from Fiduciary Net Position
The primary uses of SBCERS’ pension assets include the payment of benefits to retired members and their beneficiaries, refunds of contributions to terminated employees, and the costs of administering SBCERS. Total deductions for the fiscal year ended June 30, 2016, were $ 161.1 million, an increase of $ 9.8 million, or 6.5%, over the fiscal year ended June 30, 2015. This increase can be attributed to the increasing population of new retirees as well as increasing salaries upon which benefits are based.
Forthefiscalyearsended June30,2016 June30,2015 ChangePercentChange
Contributions $ 152,757,576$ 149,655,446$ 3,102,130 2.1%NetInvestmentIncome 31,608,092 20,576,467 11,031,625 53.6%NetSecuritiesIncome 240,038 181,039 58,999 32.6%Other 1,527,699 689,829 837,870 121.5%
TotalAdditions 186,133,405 171,102,781 15,030,624 8.8%
BenefitsPaid 154,527,560 145,507,792 9,019,768 6.2%MemberWithdrawals 946,405 966,902 (20,497) ‐2.1%AdministrativeExpense 5,600,783 4,817,662 783,121 16.3%
TotalDeductions 161,074,748 151,292,356 9,782,392 6.5%
NetIncrease $ 25,058,657 $ 19,810,425 $ 5,248,232 26.5%
Forthefiscalyearsended June30,2015 June30,2014 ChangePercentChange
Contributions $ 149,655,446$ 142,963,791$ 6,691,655 4.7%NetInvestmentIncome 20,576,467 329,011,750 (308,435,283) ‐93.7%NetSecuritiesIncome 181,039 119,568 61,471 51.4%Other 689,829 220,926 468,903 212.2%
TotalAdditions 171,102,781 472,316,035 (301,213,254) ‐63.8%
BenefitsPaid 145,507,792 138,898,965 6,608,827 4.8%MemberWithdrawals 966,902 812,467 154,435 19.0%AdministrativeExpense 4,817,662 4,607,478 210,184 4.6%
TotalDeductions 151,292,356 144,318,910 6,973,446 4.8%
NetIncrease $ 19,810,425 $ 327,997,125 $ (308,186,700) ‐94.0%
CHANGES IN FIDUCIARY NET POSITION
20
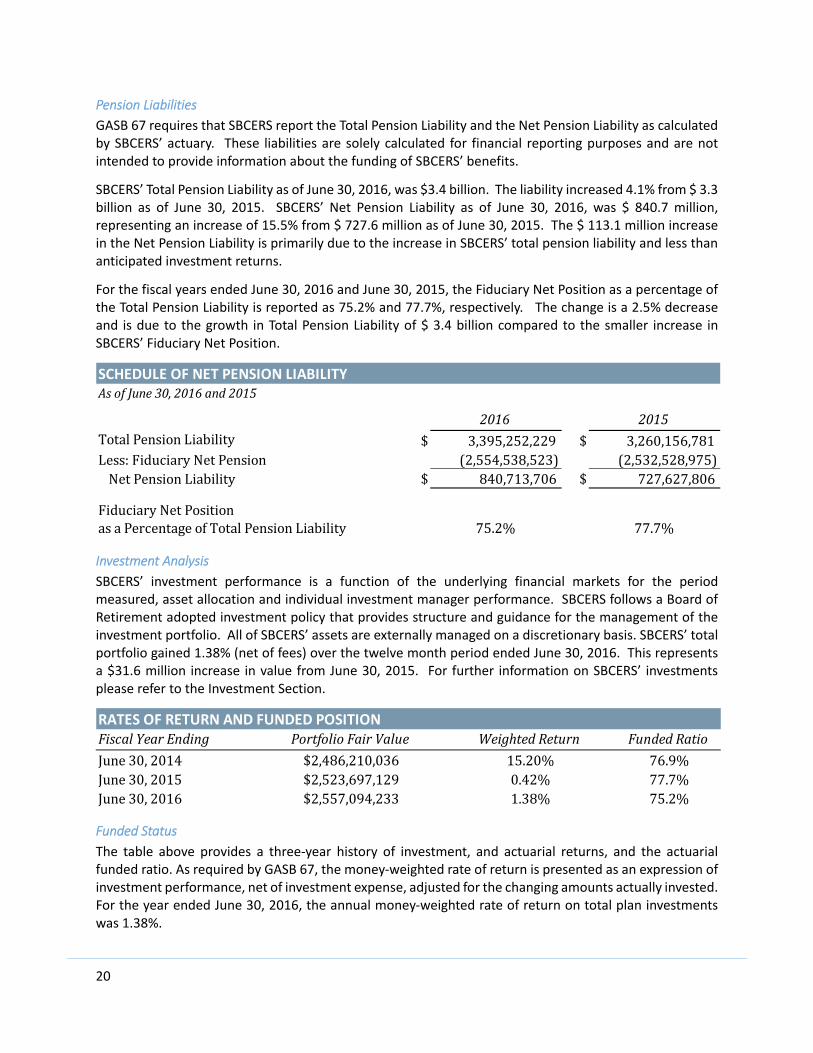
Pension Liabilities
GASB 67 requires that SBCERS report the Total Pension Liability and the Net Pension Liability as calculated by SBCERS’ actuary. These liabilities are solely calculated for financial reporting purposes and are not intended to provide information about the funding of SBCERS’ benefits.
SBCERS’ Total Pension Liability as of June 30, 2016, was $3.4 billion. The liability increased 4.1% from $ 3.3 billion as of June 30, 2015. SBCERS’ Net Pension Liability as of June 30, 2016, was $ 840.7 million, representing an increase of 15.5% from $ 727.6 million as of June 30, 2015. The $ 113.1 million increase in the Net Pension Liability is primarily due to the increase in SBCERS’ total pension liability and less than anticipated investment returns.
For the fiscal years ended June 30, 2016 and June 30, 2015, the Fiduciary Net Position as a percentage of the Total Pension Liability is reported as 75.2% and 77.7%, respectively. The change is a 2.5% decrease and is due to the growth in Total Pension Liability of $ 3.4 billion compared to the smaller increase in SBCERS’ Fiduciary Net Position.
2016 2015TotalPensionLiability $ 3,395,252,229 $ 3,260,156,781Less:FiduciaryNetPension (2,554,538,523) (2,532,528,975)NetPensionLiability $ 840,713,706 $ 727,627,806
FiduciaryNetPositionasaPercentageofTotalPensionLiability 75.2% 77.7%
AsofJune30,2016and2015SCHEDULE OF NET PENSION LIABILITY
Investment Analysis
SBCERS’ investment performance is a function of the underlying financial markets for the period measured, asset allocation and individual investment manager performance. SBCERS follows a Board of Retirement adopted investment policy that provides structure and guidance for the management of the investment portfolio. All of SBCERS’ assets are externally managed on a discretionary basis. SBCERS’ total portfolio gained 1.38% (net of fees) over the twelve month period ended June 30, 2016. This represents a $31.6 million increase in value from June 30, 2015. For further information on SBCERS’ investments please refer to the Investment Section.
FiscalYearEnding PortfolioFairValue WeightedReturn FundedRatio
June30,2014 $2,486,210,036 15.20% 76.9%June30,2015 $2,523,697,129 0.42% 77.7%June30,2016 $2,557,094,233 1.38% 75.2%
RATES OF RETURN AND FUNDED POSITION
Funded Status
The table above provides a three‐year history of investment, and actuarial returns, and the actuarial funded ratio. As required by GASB 67, the money‐weighted rate of return is presented as an expression of investment performance, net of investment expense, adjusted for the changing amounts actually invested. For the year ended June 30, 2016, the annual money‐weighted rate of return on total plan investments was 1.38%.
21
An indicator of funded status is the ratio of the actuarial value of the assets to the Unfunded Actuarial Accrued Liability (UAAL). An increase in the percentage over time usually indicates a plan is becoming financially stronger. However, a decrease will not necessarily indicate a plan is in financial decline. Changes in actuarial assumptions can significantly impact the UAAL. Performance in the capital markets can also have a material impact on the actuarial value of assets.
The fiduciary net position as a percentage of total pension liability as of June 30, 2016 was 75.2%, using a roll‐forward calculation based on the actuarial valuation conducted as of June 30, 2015. As of the fiscal year ended June 30, 2016, Net Position Restricted for Benefits was $ 2.56 billion and the Total Pension Liability was $ 3.4 billion. Of primary concern to most pension plan participants is the amount of money available to pay benefits. All Net Position is available to meet SBCERS’ respective obligations to plan participants and their beneficiaries. The next actuarial valuation will be completed as of June 30, 2016.
IMPLEMENTATION OF NEW ACCOUNTING PRONOUNCEMENTS
SBCERS adopted GASB Statement No. 72 (GASB 72), “Fair Value Measurement and Application,” effective at the beginning of fiscal year June 30, 2016. GASB 72 addresses accounting and financial reporting issues related to fair value measurements. It provides guidance for determining a fair value measurement for financial reporting purposes. The statement also provides guidance for applying fair value to certain investments and disclosures related to all fair value measurements. See Deposits and Investments (Note 5) in the Notes to the Financial Statements.
SBCERS adopted GASB Statement No. 73 (GASB 73), “Accounting and Financial Reporting for Pensions and Related Assets that are not within the Scope of GASB Statement 68, and Amendments to Certain Provisions of GASB Statements 67 and 68,”and GASB Statement No.76 (GASB 76), “The Hierarchy of Generally Accepted Accounting Principles for State and Local Governments,” for reporting as of fiscal year June 30, 2016. GASB 73 amends certain provisions, and clarifies the application of certain provisions of GASB Statements No. 67 and No. 68 in order to improve the usefulness of information about pensions included in the financial reports of state and local governments for making decisions and assessing accountability. GASB 76 establishes the hierarchy of GAAP for state and local governments, in the context of the current governmental financial reporting environment. SBCERS’ Plan fiduciary net position was not materially affected by the implementation of the Statements No. 73 and No. 76.
REQUESTS FOR INFORMATION
This comprehensive annual financial report is designed to provide the Board of Retirement, our membership, plan sponsors, taxpayers, and investment managers with a general overview of SBCERS’ finances and to show accountability for the money it receives.
Questions concerning any of the information provided in this report or requests for copies or additional financial information should be addressed to:
SBCERS 3916 State Street, Suite 100 Santa Barbara, California 93105
This report is also available on SBCERS’ website under “Forms and Publications” at www.sbcers.org.
Respectfully submitted,
Gregory E. Levin, CPA Chief Executive Officer
22
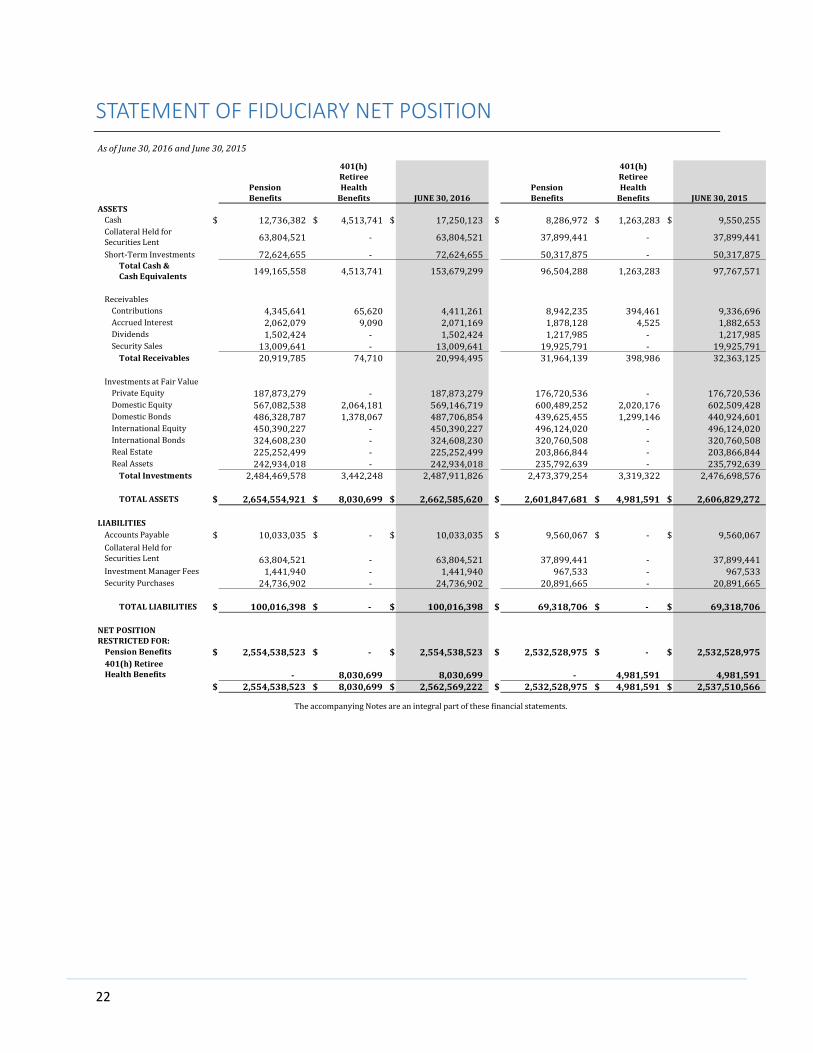
STATEMENT OF FIDUCIARY NET POSITION
AsofJune30,2016andJune30,2015
401(h) 401(h)Retiree Retiree
Pension Health Pension HealthBenefits Benefits JUNE30,2016 Benefits Benefits JUNE30,2015
$ 12,736,382 $ 4,513,741 $ 17,250,123 $ 8,286,972 $ 1,263,283 $ 9,550,255
63,804,521 ‐ 63,804,521 37,899,441 ‐ 37,899,441
Short‐TermInvestments 72,624,655 ‐ 72,624,655 50,317,875 ‐ 50,317,875TotalCash&CashEquivalents 149,165,558 4,513,741 153,679,299 96,504,288 1,263,283 97,767,571
Receivables4,345,641 65,620 4,411,261 8,942,235 394,461 9,336,6962,062,079 9,090 2,071,169 1,878,128 4,525 1,882,6531,502,424 ‐ 1,502,424 1,217,985 ‐ 1,217,98513,009,641 ‐ 13,009,641 19,925,791 ‐ 19,925,791
TotalReceivables 20,919,785 74,710 20,994,495 31,964,139 398,986 32,363,125
InvestmentsatFairValue187,873,279 ‐ 187,873,279 176,720,536 ‐ 176,720,536567,082,538 2,064,181 569,146,719 600,489,252 2,020,176 602,509,428486,328,787 1,378,067 487,706,854 439,625,455 1,299,146 440,924,601450,390,227 ‐ 450,390,227 496,124,020 ‐ 496,124,020324,608,230 ‐ 324,608,230 320,760,508 ‐ 320,760,508225,252,499 ‐ 225,252,499 203,866,844 ‐ 203,866,844242,934,018 ‐ 242,934,018 235,792,639 ‐ 235,792,639
TotalInvestments 2,484,469,578 3,442,248 2,487,911,826 2,473,379,254 3,319,322 2,476,698,576
TOTALASSETS $ 2,654,554,921 $ 8,030,699 $ 2,662,585,620 $ 2,601,847,681 $ 4,981,591 $ 2,606,829,272
$ 10,033,035 $ ‐ $ 10,033,035 $ 9,560,067 $ ‐ $ 9,560,067
63,804,521 ‐ 63,804,521 37,899,441 ‐ 37,899,4411,441,940 ‐ 1,441,940 967,533 ‐ 967,53324,736,902 ‐ 24,736,902 20,891,665 ‐ 20,891,665
TOTALLIABILITIES $ 100,016,398 $ ‐ $ 100,016,398 $ 69,318,706 $ ‐ $ 69,318,706
$ 2,554,538,523 $ ‐ $ 2,554,538,523 $ 2,532,528,975 $ ‐ $ 2,532,528,975
‐ 8,030,699 8,030,699 ‐ 4,981,591 4,981,591$ 2,554,538,523 $ 8,030,699 $ 2,562,569,222 $ 2,532,528,975 $ 4,981,591 $ 2,537,510,566
ASSETS
CollateralHeldforSecuritiesLent
InternationalBondsRealEstateRealAssets
Cash
DomesticEquityDomesticBondsInternationalEquity
LIABILITIESAccountsPayable
Contributions
SecuritySalesDividendsAccruedInterest
PrivateEquity
TheaccompanyingNotesareanintegralpartofthesefinancialstatements.
401(h)RetireeHealthBenefits
CollateralHeldforSecuritiesLent
InvestmentManagerFeesSecurityPurchases
NETPOSITIONRESTRICTEDFOR:PensionBenefits

23
STATEMENT OF CHANGES IN FIDUCIARY NET POSITION FortheFiscalYearsEndedJune30,2016andJune30,2015
401(h) 401(h)Retiree Retiree
Pension Health Pension HealthBenefits Benefits JUNE30,2016 Benefits Benefits JUNE30,2015
Employers $ 122,748,021 $ 11,697,909 $ 134,445,930 $ 123,612,352 $ 9,420,956 $ 133,033,308PlanMembers 18,311,646 ‐ 18,311,646 16,622,138 ‐ 16,622,138
141,059,667 11,697,909 152,757,576 140,234,490 9,420,956 149,655,446
11,762,368 141,653 11,904,021 6,119,783 178,235 6,298,0188,842,411 25,795 8,868,206 8,179,491 15,494 8,194,98518,601,843 ‐ 18,601,843 13,091,623 ‐ 13,091,62339,206,622 167,448 39,374,070 27,390,897 193,729 27,584,626
LessInvestmentExpense (7,765,979) ‐ (7,765,979) (7,008,159) ‐ (7,008,159)31,440,643 167,448 31,608,091 20,382,738 193,729 20,576,467
SecuritiesLentIncome 110,877 ‐ 110,877 72,105 ‐ 72,105
209,147 ‐ 209,147 169,261 ‐ 169,261(79,986) ‐ (79,986) (60,327) ‐ (60,327)240,038 ‐ 240,038 181,039 ‐ 181,039
519,620 ‐ 519,620 259,573 ‐ 259,573143,910 ‐ 143,910 13,150 ‐ 13,150456,192 407,977 864,169 3,787 413,319 417,106
1,119,722 407,977 1,527,699 276,510 413,319 689,829
$ 173,860,070 $ 12,273,334 $ 186,133,404 $ 161,074,777 $ 10,028,004 $ 171,102,781
145,711,311 8,816,249 154,527,560 136,804,317 8,703,475 145,507,792946,405 ‐ 946,405 966,902 ‐ 966,902
5,192,806 407,977 5,600,783 4,404,342 413,320 4,817,662
TOTALDEDUCTIONS $ 151,850,522 $ 9,224,226 $ 161,074,748 $ 142,175,561 $ 9,116,795 $ 151,292,356
22,009,548 3,049,108 25,058,656 18,899,216 911,209 19,810,425
2,532,528,975 4,981,591 2,537,510,566 2,513,629,759 4,070,382 2,517,700,14122,009,548 3,049,108 25,058,656 18,899,216 911,209 19,810,425
ENDOFYEAR $ 2,554,538,523 $ 8,030,699 $ 2,562,569,222 $ 2,532,528,975 $ 4,981,591 $ 2,537,510,566
ADDITIONS
TotalContributions
TotalInvestmentIncome
BenefitsPaid
NetIncreaseinFairValueofInvestments
DividendsInterest
BorrowerRebates
ClassActionSettlements
ManagementFees
DEDUCTIONS
Contributions
NetInvestmentIncome
SecuritiesLentExpense
NetSecuritiesIncome
InvestmentIncome
TheaccompanyingNotesareanintegralpartofthesefinancialstatements.
CommissionRecaptureMiscellaneousIncomeTotalMiscellaneousIncome
TOTALADDITIONS
NetIncreaseinNetPosition
NetIncreaseinNetPension
MemberWithdrawalsAdministrativeExpense
NETPOSITIONRESTRICTEDFORBENEFITSBeginningofYear
24
NOTES TO FINANCIAL STATEMENTS
1. REPORTING ENTITY
The Santa Barbara County Employees’ Retirement System (SBCERS or the System) is an independent public employee retirement system with its own governing board, separate and distinct from the County of Santa Barbara (the County). These financial statements cover the 401(a) pension plan (the Plan) and the 401(h) Other Post Employment Benefit (OPEB) plan; both plans are fiduciary funds defined as pension and other employee benefit trust funds, respectively, and are accounted for separately. SBCERS’ annual financial statements are referenced in the Notes to the Basic Financial Statements in the County’s Comprehensive Annual Financial Report available at www.countyofsb.org.
General
SBCERS was established on January 1, 1944, and is administered by the Board of Retirement (the Board) to provide service retirement, disability, death, and survivor benefits for employees of the County and 10 contracted agencies under the County Employees’ Retirement Law of 1937 (CERL), California Government Code §31450 et seq., and section 401(a) of the Internal Revenue Service Code (IRSC). SBCERS also administers an OPEB healthcare plan on behalf of the County and contracted agencies. The OPEB healthcare plan was created under section 401(h) of the IRSC.
Governance
The Board is composed of 9 voting members and two alternates. Four members are appointed by the County Board of Supervisors, two are elected by general members, a member and alternate are elected by safety members, a member and alternate are elected by retired members and one, the County Treasurer‐Tax Collector is ex officio. The County Board of Supervisors may adopt resolutions, as permitted by the CERL, which may affect the benefits of SBCERS members.
2. PENSION PLAN DESCRIPTION
Plan Sponsors
SBCERS operates as a cost‐sharing multiple‐plan sponsor defined benefit plan for the County, Santa Barbara County Superior Court and nine special districts. The following is a list of the nine special district sponsors:
Carpinteria Cemetery District
Carpinteria‐Summerland Fire Protection District
Goleta Cemetery District
Mosquito & Vector Management District of Santa Barbara County
Oak Hill Cemetery District
Santa Barbara County Air Pollution Control District (APCD)
Santa Barbara County Association of Governments
Santa Maria Cemetery District
Summerland Sanitary District
25
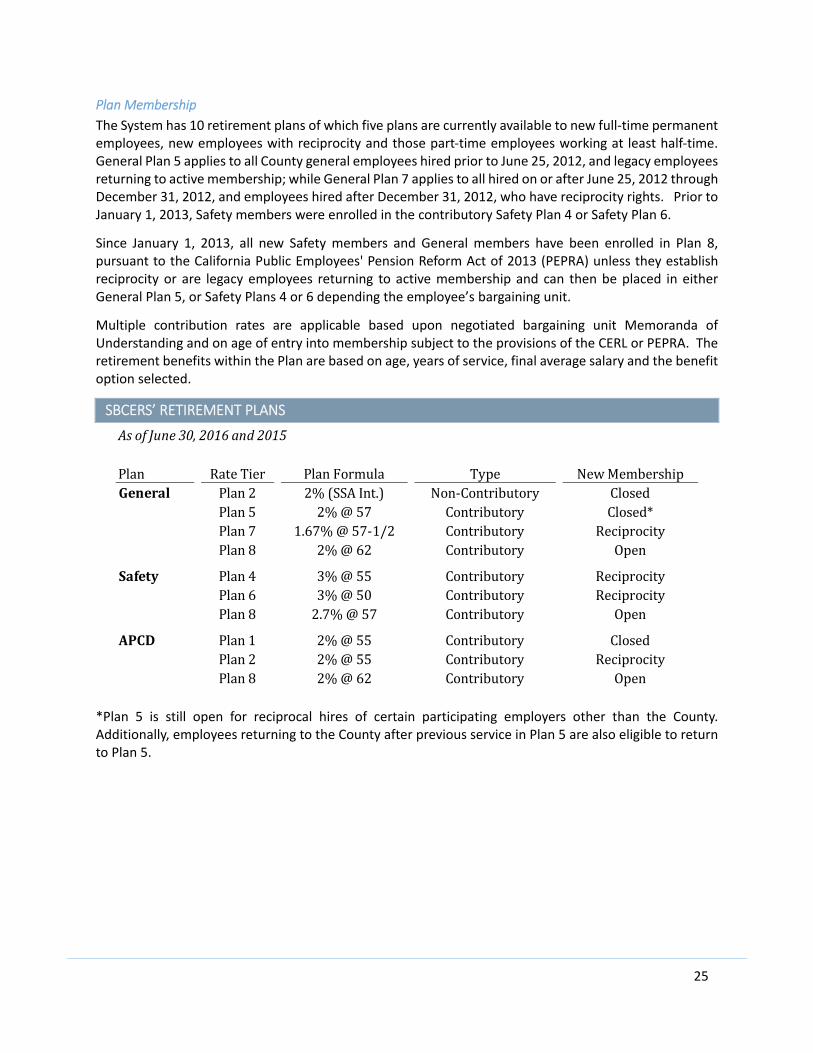
Plan Membership
The System has 10 retirement plans of which five plans are currently available to new full‐time permanent employees, new employees with reciprocity and those part‐time employees working at least half‐time. General Plan 5 applies to all County general employees hired prior to June 25, 2012, and legacy employees returning to active membership; while General Plan 7 applies to all hired on or after June 25, 2012 through December 31, 2012, and employees hired after December 31, 2012, who have reciprocity rights. Prior to January 1, 2013, Safety members were enrolled in the contributory Safety Plan 4 or Safety Plan 6.
Since January 1, 2013, all new Safety members and General members have been enrolled in Plan 8, pursuant to the California Public Employees' Pension Reform Act of 2013 (PEPRA) unless they establish reciprocity or are legacy employees returning to active membership and can then be placed in either General Plan 5, or Safety Plans 4 or 6 depending the employee’s bargaining unit.
Multiple contribution rates are applicable based upon negotiated bargaining unit Memoranda of Understanding and on age of entry into membership subject to the provisions of the CERL or PEPRA. The retirement benefits within the Plan are based on age, years of service, final average salary and the benefit option selected.
SBCERS’ RETIREMENT PLANS
Plan RateTier PlanFormula Type NewMembershipGeneral Plan2 2%(SSAInt.) Non‐Contributory Closed
Plan5 2%@57 Contributory Closed*Plan7 1.67%@57‐1/2 Contributory ReciprocityPlan8 2%@62 Contributory Open
Safety Plan4 3%@55 Contributory ReciprocityPlan6 3%@50 Contributory ReciprocityPlan8 2.7%@57 Contributory Open
APCD Plan1 2%@55 Contributory ClosedPlan2 2%@55 Contributory ReciprocityPlan8 2%@62 Contributory Open
AsofJune30,2016and2015
*Plan 5 is still open for reciprocal hires of certain participating employers other than the County. Additionally, employees returning to the County after previous service in Plan 5 are also eligible to return to Plan 5.

26
SBCERS’ RETIREMENT PLAN MEMBERSHIP
2016 2015MembersNowReceivingBenefits
ServiceRetirement 3,398 3,275DisabilityRetirement 243 244BeneficiariesandSurvivors 530 511Subtotal 4,171 4,030
ActiveMembersActiveVested 3,105 3,244ActiveNon‐Vested 1,243 1,034Subtotal 4,348 4,278
DeferredMembers 1,391 1,284
TotalMembership 9,910 9,592
AsofJune30,2016and2015
Benefit Provisions
All Plans (Except General Plan 2)
Pension benefits are based upon a combination of plan, age, years of service, average monthly salary for the highest one or three consecutive years’ covered compensation, and the benefit payment option selected by the member.
Disability benefits are based upon whether the disability was service or non‐service connected.
Death benefits are based upon whether the death occurred before or after retirement and whether the death was service or non‐service connected.
General Plan 2
Pension benefits are based upon a combination of age, years of service, and highest average monthly salary during any three years of employment and are coordinated with social security benefits.
A separate long‐term disability program is available for members who become disabled, regardless of length of service, or whether the disability is job related.
Death benefits are based upon whether the death occurred before or after retirement.
Cost‐of‐Living Adjustment (COLA)
All plans, excluding the County General Plans 2, provide for retirement benefits subject to cost‐of‐living adjustments (COLA) for retired members. COLA’s are granted to eligible retired members each April based upon the Bureau of Labor Statistics Average Consumer Price Index (CPI) for All Urban Consumers for the Los Angeles‐Riverside‐Orange County area as of the preceding January 1 and for most members is subject to a 3% maximum limitation. The portion of a CPI increase that exceeds 3% is accumulated for credit in future years.
General Plan 7 and General Plan 8 (County) is limited to an annual maximum 2% COLA.
General Plan 2 does not have a COLA.
27
Ad Hoc Cost‐of‐living Adjustment (Ad Hoc COLA)
The Interest Crediting and Undesignated Earnings Policy, available at www.sbcers.org, governs the calculation and use of available earnings and the conditions to be met prior to the award of an Ad Hoc COLA.
Vesting
All Plans (Except General Plan 2)
Upon completing five years of creditable service, employees have irrevocable rights to receive benefits attributable to a plan sponsor's contributions, provided their contributions have not been withdrawn.
Members are eligible to retire at age 50 with five years of creditable service and ten years of elapsed time since hire (including reciprocal time), or thirty years of creditable service (twenty years for safety members) regardless of age, or upon attaining age 70 for General Members or age 60 for Safety Members.
If an employee terminates employment before rendering five years of service, the employee is entitled to withdraw the employee contributions made, together with accumulated interest or may elect to leave contributions on deposit.
If a separated member enters a reciprocal retirement system within six months of separation and elects to leave their accumulated contributions on deposit with SBCERS, that member can vest reciprocally.
General Plan 2
Upon completing ten years of creditable service, Plan 2 members have irrevocable rights to receive benefits. Plan 2 members are eligible to retire at age fifty‐five with retirement credit of ten or more years of service. Once vested, Plan 2 members have a one‐time election to defer the accrued Plan 2 benefits and enter the contributory retirement plan in effect at that time. Contributions are based upon age at the time of transfer.
Pension Plan Actuarial Valuation
SBCERS retains an independent actuarial firm to conduct an annual actuarial valuation to monitor SBCERS’ funding status and funding integrity. The fiduciary net position as a percentage of total pension liability of the Plan was 75.2%. The pension liability was determined using a roll‐forward calculation based on the actuarial valuation conducted as of June 30, 2015.
The purpose of the valuation is to reassess the magnitude of SBCERS’ benefit commitments in comparison with the assets expected to be available to support those commitments, so plan sponsor and member contribution rates can be adjusted accordingly. The actuarial assumptions estimate as closely as possible what the actual cost of the Plan will be in order to determine rates for setting aside contributions today to provide benefits in the future.
Contribution requirements are determined under the individual entry age actuarial cost method. This method is designed to collect contributions as a level percentage of pay. Any gains or losses that occur under this method are amortized as a level percentage of pay. To reduce the contribution volatility caused by any new sources of Unfunded Actuarial Accrued Liability (UAAL) due to actuarial gains and losses, assumption changes, or method changes are amortized over a closed 19‐year period with a five‐year ramp up and down of the amortization payment at the beginning and end of the amortization period, and nine years of level payments as a percentage of payroll between ramping periods.
The Required Supplementary Information (RSI) section immediately following the Notes to the Financial Statements includes the Changes in Net Pension Liability schedule.

28
Plan Termination
There are no plan termination provisions under the CERL, which governs the operation of the Plan.
3. OTHER POST EMPLOYMENT BENEFITS (OPEB) PLAN
Plan Description
SBCERS administers an agent multiple‐employer OPEB plan that provides health care benefits for retired members and their eligible dependents. The OPEB plan is funded by the County and other plan sponsors, and is administered in accordance with §401(h) of the IRC. It was established on September 16, 2008, by the County Board of Supervisors who created a 401(h) Medical Trust. Also in 2008, an application for determination and a voluntary compliance plan was submitted to the Internal Revenue Service (IRS), and in October 2013, the IRS acted favorably on the application. SBCERS and its plan sponsors currently operate under the Voluntary Compliance Plan Statement and regulations adopted in 2013. On June 26, 2012, the County closed the OPEB plan to new general employees, and on June 20, 2016, the OPEB plan was closed to new County Safety members.
The County negotiates the health care insurance contracts with the carriers covering both active and retired members. Retirees are offered the same health plans as active employees, as well as plans for retirees on Medicare. Retiree premiums are calculated by the County and its consultants. 100% of eligible SBCERS’ retirees participated in this program during the fiscal years ended June 30, 2016 and June 30, 2015.
OPEB Benefit Provisions
SBCERS retirees who elect to purchase plan sponsor qualified health plans are eligible to receive an explicit subsidy for medical premiums funded by the County and other plan sponsors. The monthly subsidy is $15 per year of service. If the monthly premium for the health plan selected is less than $15 times the member’s years of service, the subsidy is limited to the entire premium. The health plans include coverage for eligible spouses and dependents. After the member’s death, a surviving spouse is eligible to continue health plan coverage. The subsidy benefit will be equal to $15 per year of service times the survivor continuation percentage applicable for pension benefits.
If a member is eligible for a disability retirement benefit, the member can receive a monthly health plan subsidy of $187 or $15 per year of service, whichever is greater. Retirees who choose not to participate in a plan sponsor qualified health plan receive a benefit of $4 per month per year of service. This benefit, known as a Healthcare Reimbursement Arrangement, reimburses qualified health care expenses through a health savings account.
Funding Policy
All OPEB Plan Sponsors Other than the County and APCD
Through the fiscal year ended June 30, 2016, the OPEB plan was funded on a “pay‐as‐you‐go” basis by all plan sponsors with the exception of the County and the Santa Barbara County Air Pollution Control District.
County of Santa Barbara
The County began increasing funding contributions beyond “Pay‐as‐you‐go” during the fiscal year ended June 30, 2014, when the County adopted a budget policy of increasing the contributions to the plan by .25% of covered payroll per fiscal year. On March 1, 2016, the County adopted a resolution approving an OPEB (401(h) Account) Funding Policy. This policy provides for funding the plan at 4% of Covered Payroll for the 401(a) Pension Plan (as opposed to the smaller covered payroll of the OPEB plan). This funding
29
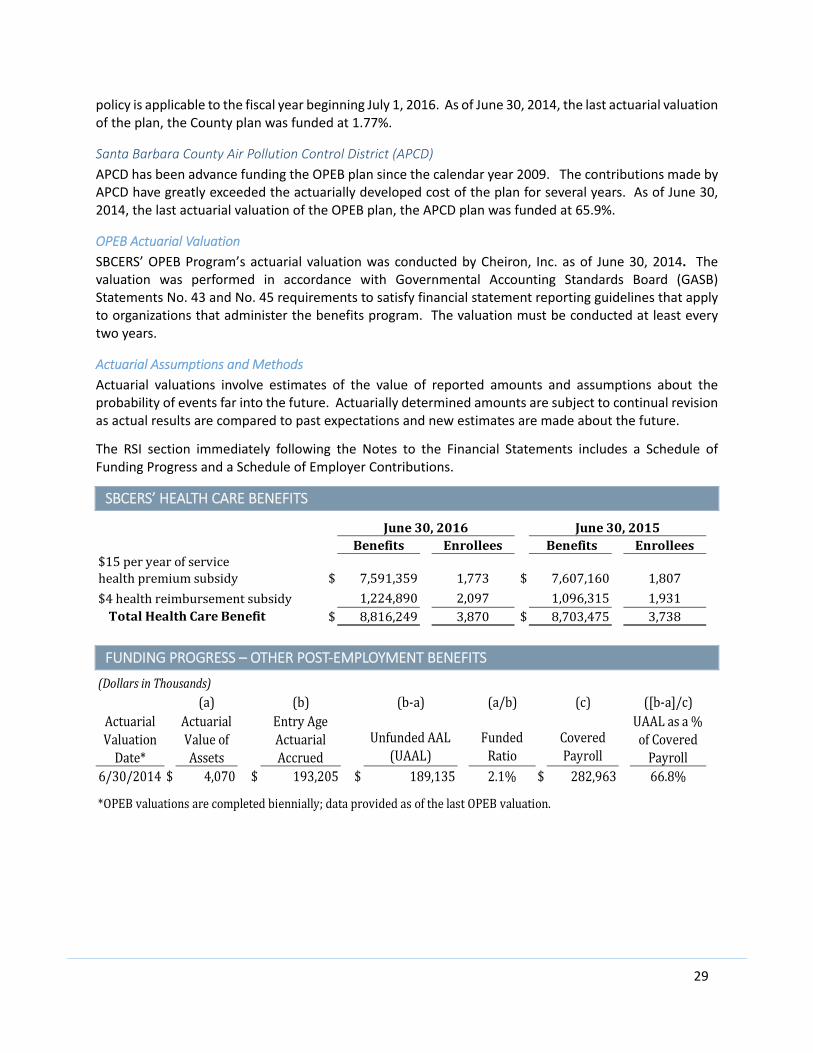
policy is applicable to the fiscal year beginning July 1, 2016. As of June 30, 2014, the last actuarial valuation of the plan, the County plan was funded at 1.77%.
Santa Barbara County Air Pollution Control District (APCD)
APCD has been advance funding the OPEB plan since the calendar year 2009. The contributions made by APCD have greatly exceeded the actuarially developed cost of the plan for several years. As of June 30, 2014, the last actuarial valuation of the OPEB plan, the APCD plan was funded at 65.9%.
OPEB Actuarial Valuation
SBCERS’ OPEB Program’s actuarial valuation was conducted by Cheiron, Inc. as of June 30, 2014. The valuation was performed in accordance with Governmental Accounting Standards Board (GASB) Statements No. 43 and No. 45 requirements to satisfy financial statement reporting guidelines that apply to organizations that administer the benefits program. The valuation must be conducted at least every two years.
Actuarial Assumptions and Methods
Actuarial valuations involve estimates of the value of reported amounts and assumptions about the probability of events far into the future. Actuarially determined amounts are subject to continual revision as actual results are compared to past expectations and new estimates are made about the future.
The RSI section immediately following the Notes to the Financial Statements includes a Schedule of Funding Progress and a Schedule of Employer Contributions.
SBCERS’ HEALTH CARE BENEFITS
June30,2016 June30,2015Benefits Enrollees Benefits Enrollees
$15peryearofservicehealthpremiumsubsidy $ 7,591,359 1,773 $ 7,607,160 1,807
$4healthreimbursementsubsidy 1,224,890 2,097 1,096,315 1,931TotalHealthCareBenefit $ 8,816,249 3,870 $ 8,703,475 3,738
FUNDING PROGRESS – OTHER POST‐EMPLOYMENT BENEFITS
(DollarsinThousands)(a) (b) (b‐a) (a/b) (c) ([b‐a]/c)
ActuarialValuationDate*
ActuarialValueofAssets
EntryAgeActuarialAccrued
UnfundedAAL(UAAL)
FundedRatio
CoveredPayroll
UAALasa%ofCoveredPayroll
6/30/2014 $ 4,070 $ 193,205 $ 189,135 2.1% $ 282,963 66.8%
*OPEBvaluationsarecompletedbiennially;dataprovidedasofthelastOPEBvaluation.

30
Additional Information OPEB actuarial valuation dated June 30, 2014 additional information: OPEB Valuation Date June 30, 2014
Actuarial Cost Method Entry age normal
Amortization Method For Santa Barbara County a 15‐year closed amortization period is used. As of June 30,2014, the period remaining was 7.5 years. For other employers this period is 30 years “open/rolling.”
Actuarial Assumptions: Expected Return on Trust Assets 7.50%
Expected Return Assets for Benefits 4.00%
Discount rate 4.33% Santa Barbara County 7.50% Air Pollution Control District 4.00% All others
Projected salary increases Future salary increases do not have an impact on OPEB benefit levels, but do have an impact on the annual required OPEB contribution (ARC), i.e. funding of the benefit.
Valuation of Subsidy The monthly Health Insurance Subsidy will be equal to the maximum subsidy of $15 per year of service.
Valuation of Assets The 401(h) account will be used to pay for the retiree health benefits.
Post‐Retirement Benefit Increases
Assumptions of no future increases granted in any of the following:
Monthly Health Insurance Subsidy of $15 per year of service.
Monthly Health Reimbursement of $4 per year of service for those electing to forego the health subsidy.
Monthly Subsidy of $187 for members receiving disability retirement benefits.
Health Plan Description Future Retirees are assumed to receive the following:
65% will receive the monthly health subsidy of $15 per year of service.
35% will receive the monthly cash benefit of $4 per year of service.
Healthcare Cost Trend Rate The Healthcare Cost Trend Rate is not applicable because the total cost of health benefits is not valued. Only the monthly health insurance subsidy of $15 per year of service is valued using the assumption that no future increase will be granted to the amount.
31
4. SUMMARY OF SIGNIFICANT ACCOUNTING POLICIES
Basis of Accounting, Revenue and Expense Recognition
For financial reporting purposes, SBCERS adheres to accounting principles generally accepted in the United States of America. SBCERS follows the accounting principles and reporting guidelines set forth by the GASB. SBCERS’ financial statements are prepared using the economic resources measurement focus and on an accrual basis of accounting.
Member and plan sponsor contributions are recognized as revenue in the period in which the contributions are due. Other revenues are recognized as available if they are estimated to be received within 60 days of the fiscal year end. Retirement benefits and member refunds are recognized as expenses when due and payable in accordance with the terms of the Plan. Other expenses are recognized when the corresponding liabilities are incurred.
The financial statements include certain prior year summarized comparative information in total. Such information does not include sufficient detail to constitute a presentation in conformity with accounting principles generally accepted in the United States of America. Accordingly, such information should be read in conjunction with the System’s financial statements for the year ended June 30, 2015, from which the summarized information was derived.
New Pension Accounting and Financial Reporting Standard For the fiscal year ended June 30, 2016, SBCERS implemented GASB Statement No. 72 (GASB 72), “Fair Value Measurement and Application.” This statement is effective for periods beginning after June 15, 2015. GASB 72 addresses accounting and financial reporting issues related to fair value measurements. It provides guidance for determining a fair value measurement for financial reporting purposes, and for applying fair value to certain investments and disclosures related to all fair value measurements. GASB 72 requires the use of valuation techniques which are appropriate under the circumstances and are either a market approach, a cost approach, or income approach. It establishes a hierarchy of inputs used to measure fair value consisting of three levels:
Level 1 inputs are quoted prices in active markets for identical assets or liabilities.
Level 2 inputs are inputs, other than quoted prices included within Level 1 that are observable for the asset or liability, either directly or indirectly.
Level 3 inputs are unobservable inputs, and typically reflect management’s estimates of assumptions that market participants would use in pricing the asset or liability.
GASB 72 also contains note disclosure requirements regarding the hierarchy of valuation inputs and valuation techniques that are used for the fair value measurements. There was no material impact on the System’s financial statements as a result of the implementation of GASB 72. Additionally for June 30, 2016, SBCERS applied the GASB Statement No. 73 (GASB 73), “Accounting and Financial Reporting for Pensions and Related Assets that are not within the Scope of GASB Statement 68, and Amendments to Certain Provisions of GASB Statements 67 and 68,” and GASB Statement No.76 (GASB 76), “The Hierarchy of Generally Accepted Accounting Principles for State and Local Governments.” GASB 73 amends specific provisions, and clarifies the application of certain provisions of GASB Statements No. 67 and No. 68, in order to improve the usefulness of information about pensions included in the financial reports of state and local governments for making decisions and
32
assessing accountability. GASB 76 establishes the hierarchy of GAAP for state and local governments, in the context of the current governmental financial reporting environment. SBCERS’ Plan fiduciary net position was not materially affected by the implementation of the GASB 73 and GASB 76.
Cash and Short‐Term Investments
Cash and short‐term investments consist of short‐term investments with fiscal agents as well as deposits in a pooled account with the County.
Investments
The Board adopts an investment policy statement and reviews that policy periodically. The investment policy statement sets forth the asset allocation and controls for the investment portfolio. The policy was not changed during the period reported herein. The policy statement is available on the SBCERS website www.sbcers.org.
Investments are reported at fair value. Investment income is recognized as revenue when earned. Net appreciation in fair value of investments held by the System is recorded as an increase to investment income based on valuation of investments at year‐end. Realized gains and losses are recognized upon the maturity or disposition of the security.
Debt and equity securities are reported at fair value. Securities traded on national or international exchanges are valued at the last reported sales price at current exchange rates. Fair value of investments in commingled funds is based on the fund share price provided by the fund manager, which is based on net asset value.
Related Party Transactions
By necessity, SBCERS is involved in various business transactions with the County, the primary plan sponsor. SBCERS reimburses the County for the cost of services provided by the following agencies: County Counsel, Auditor‐Controller, Purchasing, Human Resources, and County Treasurer. In addition, SBCERS reimburses the County for cost of services in the areas of information technology, telecommunications, motor pool services, and Board elections.
Estimates
The preparation of financial statements in accordance with accounting principles generally accepted in the United States requires management to make estimates and assumptions that affect certain reports’ amounts and disclosures. Accordingly, actual results may differ from those estimates.
Reclassification
Comparative data from the prior year has been presented in the selected sections and may have been reclassified. Such reclassifications had no effect on previously reported net plan assets.
5. DEPOSITS AND INVESTMENTS
SBCERS operates under the "Prudent Person Rule" which authorizes the Board of Retirement, at its discretion, to purchase, hold, or sell any form or type of investment, financial instrument, or enter into any financial transaction when prudent in the informed opinion of the Board.
Deposits and Short‐Term Investments
Amounts shown as Cash are held as a part of the County Treasurer’s investment pool. Amounts held as Short‐Term Investments are held with SBCERS Investment Custodian, BNY Mellon Global Securities Services (BNY Mellon) and also with StoneCastle, LLC. Short‐term investments consist of cash held in money market accounts, securities readily convertible to cash and amounts held in a Federally Insured

33
Cash Account (FICA) program. All cash, deposits, and short‐term investments are carried at cost, which approximates fair value.
Santa Barbara County Treasurer’s Investment Pool
The funds in the County Treasury are intended to provide for liquidity needed to meet benefit payroll and operating needs of the System. The balances in the County Treasury are funded by the plan sponsor and employee contributions and if necessary, transfers from the investment pool. All participants in the County pool share earnings and losses. The County Treasury Oversight Committee has regulatory oversight for all monies deposited into the County investment pool. Such amounts are invested in accordance with investment policy guidelines in compliance with California Government Code requirements, established by the County Treasurer and approved by the County Board of Supervisors. Interest earned on pooled investments is apportioned quarterly to participating funds based upon each fund’s average daily deposit balance. The County has not provided nor obtained any legally binding guarantees during the fiscal years ending June 30, 2016 and June 30, 2015, to support the value of shares in the pool. More information on the risk of the County Treasurer’s Investment pool and the Treasurer’s policies can be found on the County’s website available at www.countyofsb.org.
BNY Mellon Global Securities Services Employee Benefit Temporary Investment Fund (EBTF)
SBCERS’ short‐term investments include funds held with SBCERS investment custodian, BNY Mellon Global Securities Services, and also funds held in FICA. Balances held by the custodian are held in the BNY Mellon Global Securities Services EBTF. This fund is intended to provide liquidity to fund capital calls, portfolio rebalancing activities and, when needed, replenishment of the funds on account at the County Treasury. The primary sources of these accounts are cash transfers from other investments in the portfolio.
The EBTF is invested primarily in instruments issued by the U.S. Government, Federal agencies, sponsored agencies, and sponsored corporations. The fund must have 10% of its assets in “daily liquid assets,” defined as cash, direct obligations of the U.S. Government, or securities readily convertible to cash within one business day. 30% of the fund’s assets must be in “weekly liquid assets” defined as cash direct obligations of the U.S. Government, including certain government agency securities with remaining maturities of 60 days or less and securities readily convertible to cash within five business days. The fund may invest up to five percent of its assets in illiquid securities. The fund maintains prudent diversification across instruments, market sectors, industries, and specific issuers.
StoneCastle, LLC Cash Management Federally Insured Cash Account (FICA)
StoneCastle, LLC Cash Management FICA is used to manage short‐term cash positions that arise from tactical investment allocation decisions made pursuant the SBCERS investment policy which provides for a zero to two percent allocation to cash. The FICA fund provides for daily deposits and withdrawals twice weekly.

34
AsofJune30,2016and20152016 2015
CashHeldforPensionBenefits $ 12,736,382 $ 8,286,972
CashHeldforOPEBBenefits 4,513,741 1,263,283
Short‐TermInvestmentsforPensionBenefits 72,624,655 50,317,875Total $ 89,874,778 $ 59,868,130
SBCERS' DEPOSITS AND SHORT‐TERM INVESTMENTS
Custodial Credit Risk for Deposits and Short‐Term Investments
Custodial Credit Risk for deposits is the risk that, in the event of a financial institution's failure, SBCERS would not be able to recover its deposits. Deposits are exposed to custodial credit risk if they are not insured or not collateralized. SBCERS does not have a policy on Custodial Credit Risk for Deposits and Short‐Term Investments.
Santa Barbara County Treasury
SBCERS’ investments held in the name of the County are not specifically identifiable. On June 30, 2016, cost approximated fair value of the SBCERS’ share of pooled cash and investments. Deposits with the County Treasury are insured and/or collateralized to the extent the monies are held in its depository institution. The fair value of deposits approximated the bank balances on June 30, 2016 and June 30, 2015.
BNY Mellon Global Securities Services Employee Benefit Temporary Investment Fund (EBTF)
SBCERS maintains balances in EBTF to facilitate funding investment mandates and receiving distributions from investment mandates. Additionally, when underlying managers maintain a tactical position to cash, these amounts are also held in EBTF. Amounts held at SBCERS’ custodian bank are uninsured over $250,000 and uncollateralized.
StoneCastle, LLC in a Cash Management Federally Insured Cash Account (FICA)
SBCERS maintains balances in FICA when the Board has elected to maintain a cash position as part of its investment policy and asset allocation. These amounts are reported as short‐term investments and placed into federally insured cash accounts and are fully insured by the Federal Deposit Insurance Corporation FDIC.
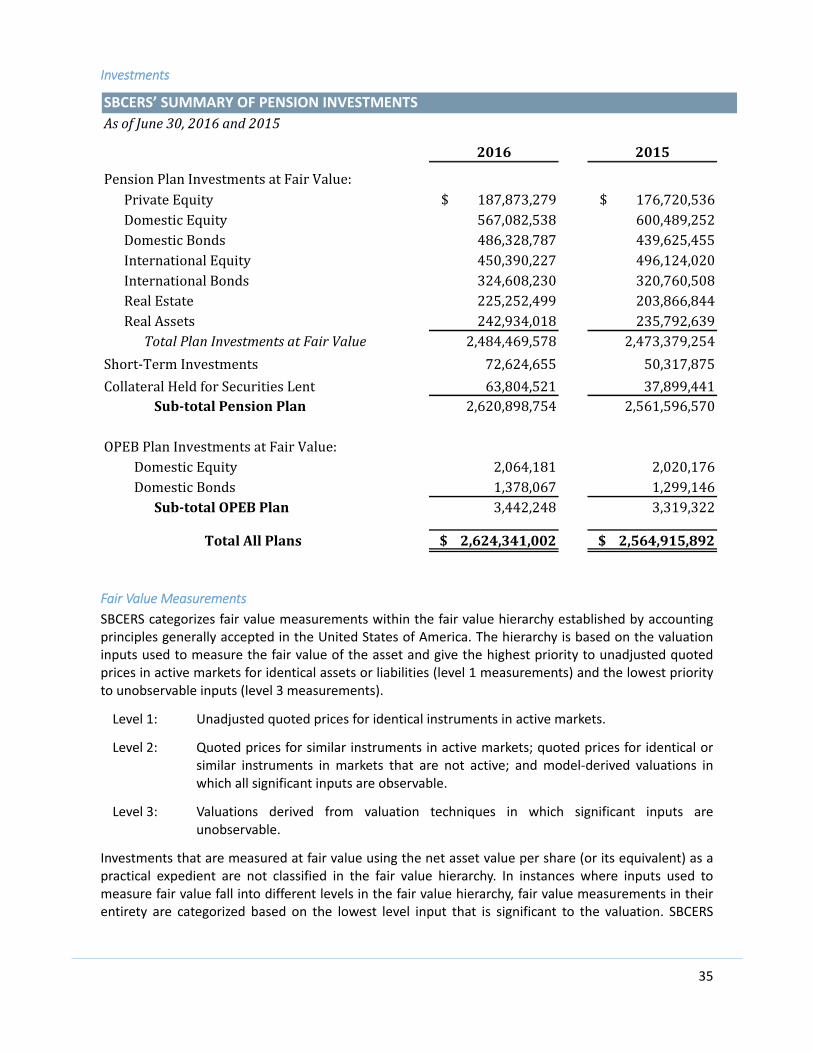
35
Investments
SBCERS’ SUMMARY OF PENSION INVESTMENTS
AsofJune30,2016and2015
2016 2015
PensionPlanInvestmentsatFairValue:PrivateEquity $187,873,279 $176,720,536DomesticEquity 567,082,538 600,489,252DomesticBonds 486,328,787 439,625,455InternationalEquity 450,390,227 496,124,020InternationalBonds 324,608,230 320,760,508RealEstate 225,252,499 203,866,844RealAssets 242,934,018 235,792,639
TotalPlanInvestmentsatFairValue 2,484,469,578 2,473,379,254
Short‐TermInvestments 72,624,655 50,317,875
CollateralHeldforSecuritiesLent 63,804,521 37,899,441Sub‐totalPensionPlan 2,620,898,754 2,561,596,570
OPEBPlanInvestmentsatFairValue:DomesticEquity 2,064,181 2,020,176DomesticBonds 1,378,067 1,299,146
Sub‐totalOPEBPlan 3,442,248 3,319,322
TotalAllPlans $2,624,341,002 $2,564,915,892
Fair Value Measurements
SBCERS categorizes fair value measurements within the fair value hierarchy established by accounting principles generally accepted in the United States of America. The hierarchy is based on the valuation inputs used to measure the fair value of the asset and give the highest priority to unadjusted quoted prices in active markets for identical assets or liabilities (level 1 measurements) and the lowest priority to unobservable inputs (level 3 measurements).
Level 1: Unadjusted quoted prices for identical instruments in active markets.
Level 2: Quoted prices for similar instruments in active markets; quoted prices for identical or similar instruments in markets that are not active; and model‐derived valuations in which all significant inputs are observable.
Level 3: Valuations derived from valuation techniques in which significant inputs are unobservable.
Investments that are measured at fair value using the net asset value per share (or its equivalent) as a practical expedient are not classified in the fair value hierarchy. In instances where inputs used to measure fair value fall into different levels in the fair value hierarchy, fair value measurements in their entirety are categorized based on the lowest level input that is significant to the valuation. SBCERS
36
The table Investments Measured at Fair Value in this footnote (presented on the next two pages) shows the fair value leveling of the investments for SBCERS.
Bid evaluations may include market quotations, yields, maturities, call features, and ratings.
Level 1 investments are valued using pricing derived from in active markets, examples of which include NYSE, NASDAQ, Chicago Board of Trade and Pink Sheets. US Government Treasury Securities are classified at level 1 due to the reduced risk component and because they are traded in more actively than other fixed income instruments. US Government Agency Notes are not classified in Level 1.
Level 2 Investments are evaluated using matrix pricing, market corroborated pricing and inputs such as yield curves and indices. Examples of Level 2 investments include Corporate Bonds and Asset Backed Securities and Government Bonds that are not US Treasury Securities.
Level 3 Investments are valued using pricing provided by Investment Managers and also information provided by investment management firms. Examples of Level 3 investments include pooled investment funds and term loans.

37
SCHEDULE OF INVESTMENTS BY FAIR VALUE HIERARCHY
June30,2016
QuotedPricesinActiveMarketsforIdenticalAssets:Level1
SignificantOther
ObservableInputs:Level2
SignificantUnobservable
Inputs:Level3
InvestmentsbyFairValueLevel:EquityConsumerDiscretionary $50,020,515 $50,020,515 ‐$ ‐$ConsumerStaples 77,265,959 77,265,959 ‐ ‐Financials 57,360,631 57,360,631 ‐ ‐HealthCare 51,139,929 51,139,929 ‐ ‐Industrials 39,443,228 39,443,228 ‐ ‐InformationTechnology 57,007,925 57,007,925 ‐ ‐Other 56,240,646 55,246,170 994,476 ‐InternationalEquity 158,367,069 157,744,442 ‐ 622,627TotalEquity $546,845,902 $545,228,799 $994,476 $622,627
FixedIncomeSecuritiesAssetBackedSecurities $14,932,909 ‐$ $14,932,909 ‐$CorporatesandOtherCredits 94,263,165 ‐ 93,624,074 639,091GovernmentSecurities 77,114,398 71,504,034 5,610,364 ‐Other 32,013,334 232,025 25,902,220 5,879,089PrivatePlacements 33,865,184 ‐ 33,865,184 ‐TotalFixedIncomeSecurities $252,188,990 $71,736,059 $173,934,751 $6,518,180
RealEstateREITS 30,163,273 30,163,273 ‐ ‐TotalRealEstate $30,163,273 $30,163,273 ‐$ ‐$
TotalInvestmentsatFairValueLevel $829,198,165 $647,128,131 $174,929,227 $7,140,807
InvestmentsMeasuredattheNetAssetValue(NAV):CommingledFunds $1,242,420,495PrivateRealEstateFunds 195,089,226PrivateEquityFunds 187,873,279RealAssetFunds 29,888,413
TotalInvestmentsMeasuredattheNAV $1,655,271,413
TotalInvestmentsMeasuredatFairValue $2,484,469,578
InvestmentDerivativeInstruments:Options $(411,410) ‐$ ‐$ $(411,410)SwapAgreements 115,520 ‐ ‐ 115,520FuturesContracts 25,244,300 ‐ ‐ 25,244,300ForwardContracts (2,236,850) ‐ ‐ (2,236,850)
TotalInvestmentDerivativeInstruments $22,711,560 ‐$ ‐$ $22,711,560
OPEBTrustInvestmentsMeasuredattheNetAssetValue(NAV):EquityCommingledFunds $2,064,181
DebtCommingledFunds 1,378,067TotalOPEBTrustInvestmentsMeasuredattheNAV $3,442,248
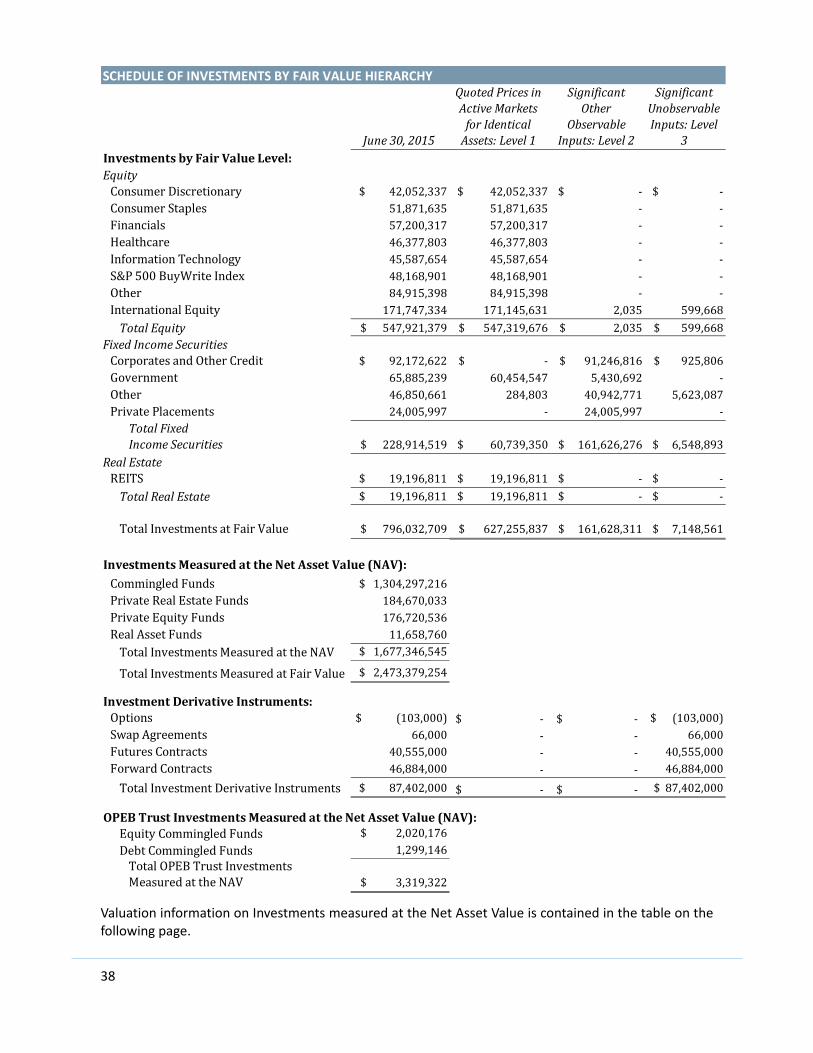
38
SCHEDULE OF INVESTMENTS BY FAIR VALUE HIERARCHY
June30,2015
QuotedPricesinActiveMarketsforIdenticalAssets:Level1
SignificantOther
ObservableInputs:Level2
SignificantUnobservableInputs:Level
3InvestmentsbyFairValueLevel:EquityConsumerDiscretionary $42,052,337 $42,052,337 $‐ $‐ConsumerStaples 51,871,635 51,871,635 ‐ ‐Financials 57,200,317 57,200,317 ‐ ‐Healthcare 46,377,803 46,377,803 ‐ ‐InformationTechnology 45,587,654 45,587,654 ‐ ‐S&P500BuyWriteIndex 48,168,901 48,168,901 ‐ ‐Other 84,915,398 84,915,398 ‐ ‐InternationalEquity 171,747,334 171,145,631 2,035 599,668
TotalEquity $547,921,379 $547,319,676 $2,035 $599,668FixedIncomeSecuritiesCorporatesandOtherCredit $92,172,622 $‐ $91,246,816 $925,806Government 65,885,239 60,454,547 5,430,692 ‐Other 46,850,661 284,803 40,942,771 5,623,087PrivatePlacements 24,005,997 ‐ 24,005,997 ‐
TotalFixedIncomeSecurities $228,914,519 $60,739,350 $161,626,276 $6,548,893
RealEstateREITS $19,196,811 $19,196,811 $‐ $‐
TotalRealEstate $19,196,811 $19,196,811 $‐ $‐
TotalInvestmentsatFairValue $796,032,709 $627,255,837 $161,628,311 $7,148,561
InvestmentsMeasuredattheNetAssetValue(NAV):CommingledFunds $1,304,297,216PrivateRealEstateFunds 184,670,033PrivateEquityFunds 176,720,536RealAssetFunds 11,658,760
TotalInvestmentsMeasuredattheNAV $1,677,346,545
TotalInvestmentsMeasuredatFairValue $2,473,379,254
InvestmentDerivativeInstruments:Options $(103,000) ‐$ ‐$ $(103,000)SwapAgreements 66,000 ‐ ‐ 66,000FuturesContracts 40,555,000 ‐ ‐ 40,555,000ForwardContracts 46,884,000 ‐ ‐ 46,884,000
TotalInvestmentDerivativeInstruments $87,402,000 ‐$ ‐$ $87,402,000
OPEBTrustInvestmentsMeasuredattheNetAssetValue(NAV):EquityCommingledFunds $2,020,176
DebtCommingledFunds 1,299,146TotalOPEBTrustInvestmentsMeasuredattheNAV $3,319,322
Valuation information on Investments measured at the Net Asset Value is contained in the table on the following page.

39
Investments Measured at the Net Asset Value
The fair values of investments in these types of funds have been determined using the Net Asset Value (NAV) per share of the investments.
PENSIONTRUSTINVESTMENTSMEASUREDATTHENETASSETVALUE(NAV)
Investments FairValueUnfunded
Commitments FairValueUnfunded
CommitmentsRedemptionFrequency
NoticePeriod
CommingledFunds(1) $1,242,420,495 $‐ $1,304,297,216 $‐DailytoMonthly
Dailyto90Days
PrivateRealEstateFunds(2) 195,089,226 50,400,000 184,670,033 55,800,000
QuarterlyAnnuallyorNot
RedeemableDailyto90Days
$ $
PrivateEquityFunds(3) 187,873,279 202,000,000 176,720,536 161,200,000Not
Redeemable
RealAssetFunds(4) 29,888,413 50,400,000 11,658,760 47,200,000Not
RedeemableTotalAssetsMeasured
atNetAssetValue $1,655,271,413 $1,677,346,545
June30,2015June30,2016
OPEBTRUSTINVESTMENTSMEASUREDATTHENETASSETVALUE(NAV)
Investments June30,2016 June30,2015RedemptionFrequency
NoticePeriod
EquityCommingledFunds(1) $2,064,181 $2,020,176 Daily 2DaysDebtCommingledFunds(1) 1,378,067 1,299,146 Daily 2Days
TotalAssetsMeasuredatNetAssetValue $3,442,248 $3,319,322
(1) Commingled Funds (Pension Trust Investments and OPEB)
This investment type consists of commingled funds that invest primarily in equity, debt, or real estate investments. There were 18 commingled funds as of June 30, 2016, and 19 commingled funds as of June 30, 2015 with difference being the termination of an emerging market fund. The commingled equity funds in this investment type include foreign, domestic, and emerging market investments. There were 8 commingled equity funds as of June 30, 2016 and 9 commingled equity funds as of June 30, 2015. The 7 commingled debt funds contain Treasury Inflation Protected Securities (TIPS), investment grade bonds, foreign bonds, emerging market debt, high yield bonds and bank loans. The real estate commingled funds consist of 3 commingled funds encompassing public infrastructure, global listed natural resources, and commodities businesses. The debt funds and real estate funds were the same for fiscal year ending June 30, 2016, and June 30, 2016. Each investment fund is benchmarked to an appropriate index and investments can be redeemed daily or monthly with daily to 90 day advance notice. The fair values of the investments in this type have been determined using the NAV per share (or its equivalent) of the investments.
(2) Private Real Estate Funds
This investment type is comprised of investments that are allocated to value added, core and opportunistic real estate strategies. Investments in this type are geographically diversified across the United States and Europe. The fair value of these investments have been determined by the investment

40
custodian bank by using the last capital account statement from the respective general partner and adjusting for capital calls, mgmt. fees inside the commitment, return of capital, gain or loss, and income.
For June 30, 2016, this investment type consists of 24 limited partnership investments ranging in commitment sizes from $ 4.7 million to $ 20 million. The remaining commitments outstanding on these funds as of June 30, 2016 are $ 50.4 million. For June 30, 2015, this investment type consists of 22 limited partnership investments ranging in commitment sizes from $ 4.7 million to $ 20 million. The remaining commitments outstanding on these funds as of June 30, 2015 are $ 55.8 million.
(3) Private Equity Funds
Investments of this type consist of corporate finance/buy out, distressed debt, venture capital, and secondary funds and are globally diversified. The fair value of these investments have been determined by the investment custodian bank by using the last capital account statement from the respective general partner and adjusting for capital calls, mgmt. fees inside the commitment, return of capital, gain or loss, and income
For June 30, 2016, this investment type consists of 55 limited partnership investments ranging in commitment size from approximately $ 2 million to $ 30 million with $ 202 million remaining commitments outstanding. For June 30, 2015, the investment type consisted of 48 limited partnerships investments ranging in commitment size from approximately $ 2 to $ 30 million with $ 161.2 million remaining in commitments outstanding.
(4) Real Asset Funds
Investments of this type include infrastructure and natural resources oriented partnerships and are globally diversified. The fair value of these investments have been determined by the custodian bank using monthly data from several vendors who provide various information that estimates a price that would likely prevail in a liquid market.
For June 30, 2016, these investment type of funds consists of 8 limited partnership investments ranging in commitment sizes from approximately $6 million to $15 million. The remaining commitments outstanding on these funds as of June 30, 2016 are $50.4 million. For June 30, 2015, these investment type of funds consists of 6 limited partnership investments ranging in commitment sizes from approximately $6 million to $15 million. Investments are allocated to infrastructure and natural resources oriented partnerships and are globally diversified. The remaining commitments outstanding on these funds as of June 30, 2015 were $ 47.2 million
Investment Risk
The Board’s investment policies and guidelines allocate the asset classes of the portfolio investments within ranges. The portfolio is maintained within the ranges and reported each month. The Board annually reviews the allocation model and the risk structure of the total portfolio. The investment policy does not address Credit Risk, Concentration of Credit Risk, Interest Rate Risk, or Foreign Currency Risk, as investment managers within their specific mandates are given risk parameters that would result in limiting these types of risk on a total portfolio level. GASB Statement No. 40 requires that investments be evaluated to give an indication of the level of risk assumed at year‐end.
Concentration Risk
The Plan does not hold investments in any one underlying security that represents 5% or more of the Plan’s fiduciary net position.
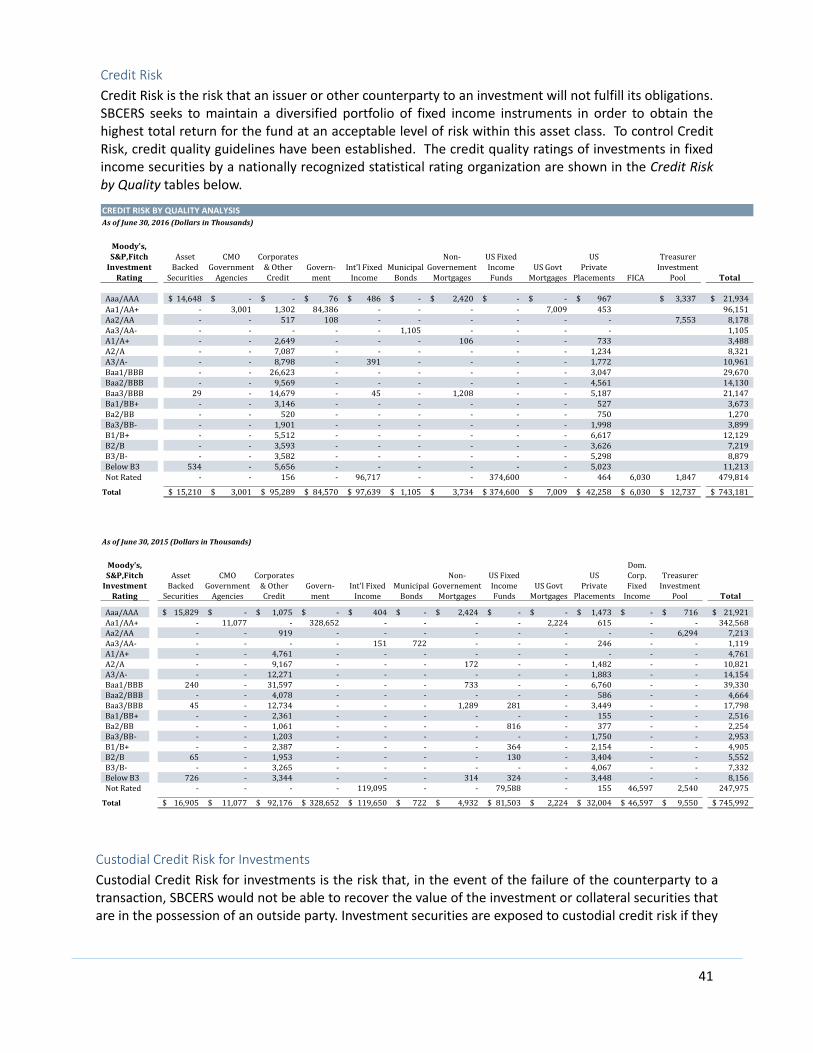
41
Credit Risk
Credit Risk is the risk that an issuer or other counterparty to an investment will not fulfill its obligations. SBCERS seeks to maintain a diversified portfolio of fixed income instruments in order to obtain the highest total return for the fund at an acceptable level of risk within this asset class. To control Credit Risk, credit quality guidelines have been established. The credit quality ratings of investments in fixed income securities by a nationally recognized statistical rating organization are shown in the Credit Risk by Quality tables below.
CREDIT RISK BY QUALITY ANALYSIS
AsofJune30,2016(DollarsinThousands)
Moody's,S&P,FitchInvestmentRating
AssetBackedSecurities
CMOGovernmentAgencies
Corporates&OtherCredit
Govern‐ment
Int'lFixedIncome
MunicipalBonds
Non‐GovernementMortgages
USFixedIncomeFunds
USGovtMortgages
USPrivate
Placements FICA
TreasurerInvestment
Pool Total
Aaa/AAA 14,648$ ‐$ ‐$ 76$ 486$ ‐$ 2,420$ ‐$ ‐$ 967$ 3,337$ 21,934$Aa1/AA+ ‐ 3,001 1,302 84,386 ‐ ‐ ‐ ‐ 7,009 453 96,151Aa2/AA ‐ ‐ 517 108 ‐ ‐ ‐ ‐ ‐ ‐ 7,553 8,178Aa3/AA‐ ‐ ‐ ‐ ‐ ‐ 1,105 ‐ ‐ ‐ ‐ 1,105A1/A+ ‐ ‐ 2,649 ‐ ‐ ‐ 106 ‐ ‐ 733 3,488A2/A ‐ ‐ 7,087 ‐ ‐ ‐ ‐ ‐ ‐ 1,234 8,321A3/A‐ ‐ ‐ 8,798 ‐ 391 ‐ ‐ ‐ ‐ 1,772 10,961Baa1/BBB ‐ ‐ 26,623 ‐ ‐ ‐ ‐ ‐ ‐ 3,047 29,670Baa2/BBB ‐ ‐ 9,569 ‐ ‐ ‐ ‐ ‐ ‐ 4,561 14,130Baa3/BBB 29 ‐ 14,679 ‐ 45 ‐ 1,208 ‐ ‐ 5,187 21,147Ba1/BB+ ‐ ‐ 3,146 ‐ ‐ ‐ ‐ ‐ ‐ 527 3,673Ba2/BB ‐ ‐ 520 ‐ ‐ ‐ ‐ ‐ ‐ 750 1,270Ba3/BB‐ ‐ ‐ 1,901 ‐ ‐ ‐ ‐ ‐ ‐ 1,998 3,899B1/B+ ‐ ‐ 5,512 ‐ ‐ ‐ ‐ ‐ ‐ 6,617 12,129B2/B ‐ ‐ 3,593 ‐ ‐ ‐ ‐ ‐ ‐ 3,626 7,219B3/B‐ ‐ ‐ 3,582 ‐ ‐ ‐ ‐ ‐ ‐ 5,298 8,879BelowB3 534 ‐ 5,656 ‐ ‐ ‐ ‐ ‐ ‐ 5,023 11,213NotRated ‐ ‐ 156 ‐ 96,717 ‐ ‐ 374,600 ‐ 464 6,030 1,847 479,814
Total 15,210$ 3,001$ 95,289$ 84,570$ 97,639$ 1,105$ 3,734$ 374,600$ 7,009$ 42,258$ 6,030$ 12,737$ 743,181$
AsofJune30,2015(DollarsinThousands)
Moody's,S&P,FitchInvestmentRating
AssetBackedSecurities
CMOGovernmentAgencies
Corporates&OtherCredit
Govern‐ment
Int'lFixedIncome
MunicipalBonds
Non‐GovernementMortgages
USFixedIncomeFunds
USGovtMortgages
USPrivate
Placements
Dom.Corp.FixedIncome
TreasurerInvestment
Pool Total
Aaa/AAA 15,829$ ‐$ 1,075$ ‐$ 404$ ‐$ 2,424$ ‐$ ‐$ 1,473$ ‐$ 716$ 21,921$Aa1/AA+ ‐ 11,077 ‐ 328,652 ‐ ‐ ‐ ‐ 2,224 615 ‐ ‐ 342,568Aa2/AA ‐ ‐ 919 ‐ ‐ ‐ ‐ ‐ ‐ ‐ ‐ 6,294 7,213Aa3/AA‐ ‐ ‐ ‐ ‐ 151 722 ‐ ‐ ‐ 246 ‐ ‐ 1,119A1/A+ ‐ ‐ 4,761 ‐ ‐ ‐ ‐ ‐ ‐ ‐ ‐ ‐ 4,761A2/A ‐ ‐ 9,167 ‐ ‐ ‐ 172 ‐ ‐ 1,482 ‐ ‐ 10,821A3/A‐ ‐ ‐ 12,271 ‐ ‐ ‐ ‐ ‐ ‐ 1,883 ‐ ‐ 14,154Baa1/BBB 240 ‐ 31,597 ‐ ‐ ‐ 733 ‐ ‐ 6,760 ‐ ‐ 39,330Baa2/BBB ‐ ‐ 4,078 ‐ ‐ ‐ ‐ ‐ ‐ 586 ‐ ‐ 4,664Baa3/BBB 45 ‐ 12,734 ‐ ‐ ‐ 1,289 281 ‐ 3,449 ‐ ‐ 17,798Ba1/BB+ ‐ ‐ 2,361 ‐ ‐ ‐ ‐ ‐ ‐ 155 ‐ ‐ 2,516Ba2/BB ‐ ‐ 1,061 ‐ ‐ ‐ ‐ 816 ‐ 377 ‐ ‐ 2,254Ba3/BB‐ ‐ ‐ 1,203 ‐ ‐ ‐ ‐ ‐ ‐ 1,750 ‐ ‐ 2,953B1/B+ ‐ ‐ 2,387 ‐ ‐ ‐ ‐ 364 ‐ 2,154 ‐ ‐ 4,905B2/B 65 ‐ 1,953 ‐ ‐ ‐ ‐ 130 ‐ 3,404 ‐ ‐ 5,552B3/B‐ ‐ ‐ 3,265 ‐ ‐ ‐ ‐ ‐ ‐ 4,067 ‐ ‐ 7,332BelowB3 726 ‐ 3,344 ‐ ‐ ‐ 314 324 ‐ 3,448 ‐ ‐ 8,156NotRated ‐ ‐ ‐ ‐ 119,095 ‐ ‐ 79,588 ‐ 155 46,597 2,540 247,975
Total 16,905$ 11,077$ 92,176$ 328,652$ 119,650$ 722$ 4,932$ 81,503$ 2,224$ 32,004$ 46,597$ 9,550$ 745,992$
Custodial Credit Risk for Investments
Custodial Credit Risk for investments is the risk that, in the event of the failure of the counterparty to a transaction, SBCERS would not be able to recover the value of the investment or collateral securities that are in the possession of an outside party. Investment securities are exposed to custodial credit risk if they

42
are uninsured, are not registered in SBCERS’ name, and held by a counter party. Generally, SBCERS’ securities are not exposed to custodial risk as they are held by our custodial bank in our nominee name.
Short‐term investments held in the FICA account are placed into federally insured cash accounts and are fully insured by the FDIC.
Short‐term investments held in the BNY Mellon Global Securities Services EBTF are uninsured over $250,000 and uncollateralized.
Concentrations of Credit Risk
As of June 30, 2016, and June 30, 2015, SBCERS’ investment portfolio contained no concentration of investments in any one entity (other than investments guaranteed by the U.S. Government, investments in mutual funds, and external investment pools) that represented 5 percent or more of the total investment portfolio.
Securities Lending
SBCERS is legally authorized to engage in securities lending transactions pursuant to the CERL, California Government Code §31594. SBCERS participates in securities lending through its custodian BNY Mellon to increase income. Securities are lent to brokers and dealers (borrower) and in turn, SBCERS receives collateral. Collateral can be in the forms of cash (both United States and foreign currency), securities issued or guaranteed by the U.S. Government, sovereign debt of foreign countries, or irrevocable bank letters of credit or such other forms as may be agreed upon. SBCERS pays the borrower a negotiated rebate rate on the collateral received and invests the collateral with the goal of earning a higher yield than the rebate rate paid to the borrower. Earnings generated above and beyond the rebate paid to the borrower represent the net income to SBCERS from the transaction.
At year end, SBCERS had no credit risk exposure to borrowers, because the amount of collateral received exceeded the value of securities on loan. As of June 30, 2016, and June 30, 2015, there were no violations of legal or contractual provisions. SBCERS had no losses on securities lending transactions resulting from the default of a borrower for the years ended June 30, 2016, and June 30, 2015.
Transactions are collateralized at no less than 100% of the security’s fair value. Collateral is marked to market daily. The custodian invests the collateral received in short‐term investment funds (maintained by the custodian), money market mutual funds, and other similar investments as the custodian may select.
The average term of all SBCERS’ loans is overnight or “on demand”. The custodian ensures that there is an absolute right to terminate the agreement without cause, upon short notice and without any penalty. SBCERS cannot pledge or sell collateral securities received unless the borrower defaults. In the event of a borrower default, BNY Mellon indemnifies SBCERS to the extent of replacing the securities loaned.
As of June 30, 2016, the fair value of securities on loan was $63.3 million and the value of collateral received for the securities on loan was $63.8 million of which $35.8 million was non‐cash collateral and $28.0 million was cash collateral from equity and fixed income securities. As of June 30, 2015, the fair value of securities on loan was $36.8 million and the value of collateral received for the securities on loan was $37.9 million of which $18.6 million was non‐cash collateral and $19.3 million was cash collateral from equity and fixed income securities. SBCERS’ income net of expense from securities lending was $240,038 and $181,039 for the years ended June 30, 2016 and June 30, 2015, respectively.

43
June30,2016 June30,2015FairValueof Collateral FairValueof Collateral
SecuritiesonLoan SecuritiesonLoan Received SecuritiesonLoan ReceivedDomesticEquities $ 15,041,631 $ 15,162,421 $ 7,437,950 $ 7,580,068InternationalEquities 5,762,184 6,238,248 6,628,582 6,950,845DomesticCorporateFixedIncome 13,489,953 13,773,736 4,626,363 4,770,203RealEstate 659,924 665,773 ‐ ‐TotalCash 34,953,692 35,840,178 18,692,895 19,301,116TotalNon‐Cash 28,395,985 27,964,343 18,103,109 18,598,325
TotalSecuritiesonLoan $ 63,349,677 $ 63,804,521 $ 36,796,004 $ 37,899,441
SBCERS' SECURITIES LENDING PROGRAM
Interest Rate Risk
Interest Rate Risk is the risk that changes in interest rates will adversely affect the fair value of an investment. Duration is a measure of the price sensitivity of a fixed income portfolio to changes in interest rates. It is calculated as the weighted average of time to receive a bond’s coupon and principal payments. The longer the duration of a portfolio, the greater its price sensitivity to changes in interest rates.

44
Foreign Currency Risk
Foreign Currency Risk is the risk that changes in exchange rates will adversely affect the fair value of an investment or deposit. SBCERS’ international equity managers are permitted to invest in authorized countries. Forward currency contract and currency futures (maturity ranging from at least 20 days and not to exceed one year for either instrument) are permitted for defensive currency hedging.
AsofJune30,2016
Currency NonU.S.Cash Equity FixedIncome TotalAustralianDollar $2,262 $5,067,782 $‐ $5,070,044BrazilianReal 1 31,707 ‐ 31,708CanadianDollar 737 1,321,834 75,661 1,398,232DanishKrone ‐ 2,739,369 ‐ 2,739,369EuroCurrencyUnit (593,215) 61,118,293 ‐ 60,525,078HongKongDollar 3 4,488,657 ‐ 4,488,660IndianRupee 59 ‐ ‐ 59IndonesianRupiah (160) ‐ 45,242 45,082IsraeliShekel 12,770 460,572 ‐ 473,342JapaneseYen (1,571,362) 31,776,589 ‐ 30,205,227MexicanPeso ‐ 243,405 391,081 634,486NewTaiwanDollar ‐ 772,781 ‐ 772,781NewZealandDollar 2,140 ‐ ‐ 2,140NorwegianKrone 10,309 731,524 ‐ 741,833BritishPoundSterling (152,075) 20,836,645 108,275 20,792,845SingaporeDollar (310) 1,155,648 485,830 1,641,168SouthAfricanRand 1 ‐ ‐ 1SouthKoreanWon 26 1,324,044 ‐ 1,324,070SwedishKrona 9,402 3,028,771 ‐ 3,038,173SwissFranc 157,146 12,358,010 ‐ 12,515,156ThaiBaht ‐ 359,048 ‐ 359,048TurkishLira 2 96,322 ‐ 96,324TotalSecuritiesHeldinForeignCurrency $(2,122,264) $147,911,001 $1,106,089 $146,894,826
FOREIGN CURRENCY RISK

45
AsofJune30,2015
Currency NonU.S.Cash Equity FixedIncome TotalAustralianDollar $12,559 $6,013,619 $‐ $6,026,178CanadianDollar 1,799 1,108,311 ‐ 1,110,110DanishKrone 2 2,916,169 ‐ 2,916,171EuroCurrencyUnit (281,851) 63,639,800 ‐ 63,357,949HongKongDollar 7,785 9,373,444 ‐ 9,381,229HungarianForint 1 ‐ ‐ 1IndianRupee ‐ 742,777 ‐ 742,777IndonesianRupiah 1,873 63,421 ‐ 65,294IsraeliShekel 7,514 534,690 ‐ 542,204JapaneseYen (447,989) 32,734,461 ‐ 32,286,472MexicanPeso 1,027,044 148,001 150,246 1,325,291NewTaiwanDollar ‐ 112,394 ‐ 112,394NewZealandDollar ‐ 237,852 ‐ 237,852NorwegianKrone ‐ 616,976 ‐ 616,976BritishPoundSterling (209,421) 24,333,130 ‐ 24,123,709SingaporeDollar 15,922 1,488,163 405,679 1,909,764SouthAfricanRand 861 254,211 ‐ 255,072SouthKoreanWon ‐ 1,292,734 ‐ 1,292,734SwedishKrona ‐ 3,599,263 ‐ 3,599,263SwissFranc 138,175 16,591,502 ‐ 16,729,677ThaiBaht (5,793) 380,501 ‐ 374,708TotalSecuritiesHeldinForeignCurrency $268,481 $166,181,419 $555,925 $167,005,825
FOREIGN CURRENCY RISK ‐ Continued
Derivatives
Derivatives are investments that derive their value, usefulness, and marketability from an underlying instrument, and represents direct ownership of an asset or obligation of an issuer whose payments are based on or “derived” from the performance of an agreed upon benchmark. The notional amount is the nominal or face amount that is used to calculate payments made on that instrument. As of June 30, 2016, and June 30, 2015, SBCERS’ derivatives investments were in Swap Agreements, Futures Contracts, Forward Contracts, and Options.
Swap Agreements
A swap is an agreement between two or more parties to exchange a sequence of cash flows over a period of time in the future. The swap agreement defines the dates when the cash flows are to be paid and the way they are calculated. The cash flows are calculated over a notional amount.
Futures Contracts
A futures contract represents an agreement to buy (long position) or sell (short position) an underlying asset at a specified future date for a specified price. Payment for the transaction is delayed until a future date. Futures contracts are standardized contracts traded on organized exchanges.
Forward Contracts
A forward contract represents an agreement to buy or sell an underlying asset at a specified date in the future at a specified price. Payment for the transaction is delayed until the settlement or expiration date.

46
Currency forward contracts are used to control currency exposure and facilitate the settlement of international security purchase and sale transactions.
Options
An option specifies a contract between two parties for a future transaction on an asset at a reference price. The seller incurs the obligation to fulfill the transaction while the buyer gains the right, but not the obligation, to engage in the transaction.
HOLDINGS OF DERIVATIVE SECURITIES
(Dollars in Thousands)
DerivativeTypeNotionalAmount
FairValueNotionalAmount
FairValueChangeinFairValue
Options $(4,330) $(411) $(531) $(103) $(308)SwapAgreements 7,530 116 5,538 66 50FuturesContracts 171,942 25,244 41,116 40,555 (15,311)ForwardContracts 255,915 (2,237) 212,066 46,884 (49,121)Totals $431,057 $22,712 $258,189 $87,402 $(64,690)
June30,2016 June30,2015

47
Derivative Credit Risk
SBCERS is exposed to credit risk on investment derivatives that are traded over the counter and are reported in asset positions. Derivatives exposed to derivative credit risk include collateralized mortgage obligations, swap agreements, and futures contracts. The following Derivative Credit Risk Analysis schedule discloses the counterparty ratings of SBCERS’ investment derivatives in asset positions by type, as of June 30, 2015, and June 30, 2016. These amounts represent the maximum loss that would be recognized if all counterparties fail to perform as contracted, without respect to any collateral or other security, or netting arrangement. The schedule displays the fair value of investments by credit rating. As of June 30, 2016, SBCERS’ has a net exposure to derivative credit risk of ($2.1 million).
DERIVATIVECREDITRISKAsofJune30,2016(DollarsinThousands)
Option
Contracts
Forward
Contracts
Futures
Contracts
Swap
Agreements
Total Fair
Value
Aaa/AAA ‐$ (229)$ ‐$ ‐$ (229)$
Aa2/AA ‐ ‐ 3,376 ‐ 3,376
A2/A ‐ (2,762) ‐ 76 (2,686)
Baa2/BBB ‐ (566) ‐ (29) (595)
Total Investment Grade ‐ (3,557) 3,376 47 (134)
Speculative Grade ‐
B2/B ‐ ‐ ‐ 69 69
Not Rated (88) (2,199) ‐ 212 (2,075)
Total Speculative Grade (88) (2,199) ‐ 281 (2,006)
Total Fair Value (88)$ (5,756)$ 3,376$ 328$ (2,140)$
Derivative Type
Moody's,S&P,FitchInvestmentRating
AsofJune30,2015(DollarsinThousands)
Forward
Contracts
Futures
Contracts
Swap
Agreements
Total Fair
Value
Aaa/AAA (15)$ ‐$ ‐$ (15)$
Aa2/AA 18 157 ‐ 175
A2/A (3) ‐ ‐ (3)
Baa2/BBB ‐ ‐ 2,836 2,836
tal Investment Grade ‐ 157 2,836 2,993
Speculative Grade
Ba2/BB ‐ ‐ 9 9
B2/B ‐ ‐ 557 557
Not Rated 45,789 ‐ 1 45,790
al Speculative Grade 45,789 ‐ 567 46,356
Total Fair Value 45,789$ 157$ 3,403$ 49,349$
Derivative Type
Moody's,S&P,FitchInvestmentRating
48
Derivative Interest Rate Risk
Interest rate risk is the risk that changes in interest rates will adversely affect the fair value of an investment. As of June 30, 2015, and June 30, 2016, SBCERS did not have any derivatives with material exposure to interest rate risk.
Derivative Foreign Currency Risk
For those dollar‐denominated securities issued by foreign countries, there is an exposure to a foreign currency risk. Currency forward contracts represent foreign exchange contracts that are used to control currency exposure and facilitate the settlement of international security purchase and sale transactions.
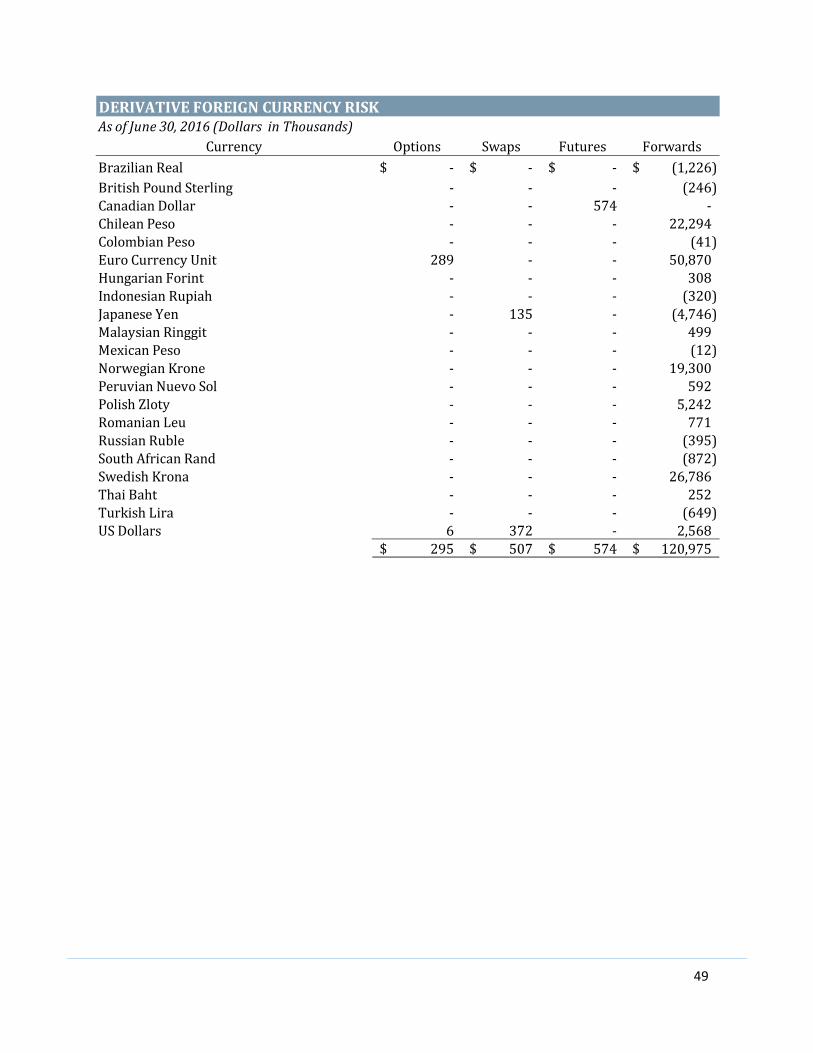
49
DERIVATIVEFOREIGNCURRENCYRISKAsofJune30,2016(DollarsinThousands)
Currency Options Swaps Futures ForwardsBrazilianReal ‐$ ‐$ ‐$ (1,226)$BritishPoundSterling ‐ ‐ ‐ (246)CanadianDollar ‐ ‐ 574 ‐ChileanPeso ‐ ‐ ‐ 22,294ColombianPeso ‐ ‐ ‐ (41)EuroCurrencyUnit 289 ‐ ‐ 50,870HungarianForint ‐ ‐ ‐ 308IndonesianRupiah ‐ ‐ ‐ (320)JapaneseYen ‐ 135 ‐ (4,746)MalaysianRinggit ‐ ‐ ‐ 499MexicanPeso ‐ ‐ ‐ (12)NorwegianKrone ‐ ‐ ‐ 19,300PeruvianNuevoSol ‐ ‐ ‐ 592PolishZloty ‐ ‐ ‐ 5,242RomanianLeu ‐ ‐ ‐ 771RussianRuble ‐ ‐ ‐ (395)SouthAfricanRand ‐ ‐ ‐ (872)SwedishKrona ‐ ‐ ‐ 26,786ThaiBaht ‐ ‐ ‐ 252TurkishLira ‐ ‐ ‐ (649)USDollars 6 372 ‐ 2,568
295$ 507$ 574$ 120,975$

50
DERIVATIVEFOREIGNCURRENCYRISK‐ContinuedAsofJune30,2015(DollarsinThousands)
Currency Sawps FuturesForwardContracts
BrazilianReal ‐$ ‐$ 40$BritishPoundSterling ‐ ‐ (6,911)CanadianDollar ‐ 1,381 1ChileanPeso ‐ ‐ 23,717ColombianPeso 584 ‐ (1)EuroCurrencyUnit ‐ ‐ 58,065IndianRupee ‐ ‐ (14)IndonesianRupiah 2,252 ‐ (1)JapaneseYen 155 ‐ (554)MexicanPeso ‐ ‐ 1,128NewZealandDollar ‐ ‐ (13,317)NorwegianKrone ‐ ‐ 21,364PhilippinePeso ‐ ‐ (3)PolishZloty ‐ ‐ 6,086RomanianLeu ‐ ‐ (2)RussianRuble ‐ ‐ 48SouthAfricanRand ‐ ‐ 5SwedishKrona ‐ ‐ 22,462SwissFranc ‐ ‐ (1)TurkishLira ‐ ‐ (13)USDollars (171) ‐ ‐
2,820$ 1,381$ 112,099$

51
6. LEASE COMMITMENTS
SBCERS leases property under lease agreements that expire in 2018. In 2014, SBCERS renewed its Santa Maria lease agreement for an additional four years effective August 15, 2014.
The Santa Barbara office lease was also renewed for an additional three years, extending to June 30, 2018. As part of this agreement, SBCERS acquired new space on the first floor of its existing Santa Barbara building and sub‐leased the space it previously occupied. The sub‐lease began January 1, 2015, and expires June 30, 2018. The monthly rent due under the sub‐lease was $4,882 along with common area expenses of $3,542, and a $5,000 deposit was provided.
The Santa Barbara office lease requires that SBCERS pay a portion of the building’s operating expenses based on square footage occupied. Lease expense, exclusive of common area maintenance fees, in fiscal years 2016 and 2015 was $183,184 and $184,099, respectively. Minimum non‐cancelable lease commitments net of sublease income as of June 30, 2016, are shown in the adjacent table.
7. PENSION PLAN RESERVES
The reserves represent the components of SBCERS’ fiduciary net position. Reserves are established from member and plan sponsor contributions and the accumulation of investment income after satisfying investment and administrative expenses. Following are brief explanations of the reserves and accounts used by SBCERS.
Member Contribution Reserve
Consists of contributions made by active and deferred members and accrued interest. Amounts are deducted from this reserve when a refund of member contributions is made or, when a member retires and amounts are transferred to the Retired Member Reserve.
Retired Member Reserve
Consists of funds accumulated to pay retirement benefits to retired members. Additions to this reserve consist of transfers from the Member Contribution Reserve and Plan sponsor Reserve, along with interest earnings. Benefit payments to retired members, beneficiaries and survivors reduce this reserve.
Plan Sponsor Advance Reserve
Consists of plan sponsor contributions for future retirement payments to current active members and deferred members. Additions to this reserve include plan sponsor contributions and interest earnings. Deductions to this reserve consist of transfers to the Retired Member Reserve, lump sum death benefits, and supplemental disability allowance payments. A refund of member contributions has no corresponding effect on the balance of the Plan Sponsor Advance Reserve because the plan sponsor contribution rates are based on assumptions that include an expected rate of member termination.
Contra Tracking Account
Represents the difference between the value of the reserves and the fair value of assets. This account is negative unless the fair value of assets exceeds the actuarially accrued liability.
FiscalYear Amount2016‐2017 $ 164,7562017‐2018 192,5932018‐2019 5,513Total $ 362,862
MINIMUM LEASE COMMITMENTS
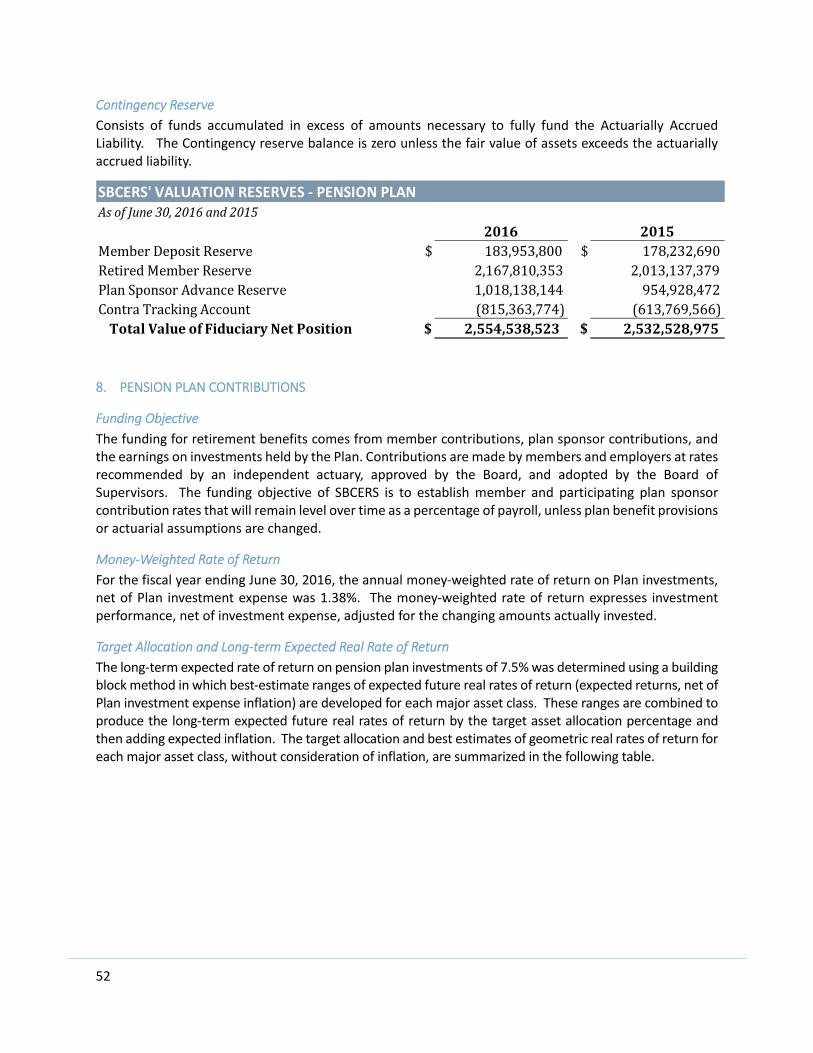
52
Contingency Reserve
Consists of funds accumulated in excess of amounts necessary to fully fund the Actuarially Accrued Liability. The Contingency reserve balance is zero unless the fair value of assets exceeds the actuarially accrued liability.
AsofJune30,2016and20152016 2015
MemberDepositReserve $ 183,953,800 $ 178,232,690RetiredMemberReserve 2,167,810,353 2,013,137,379PlanSponsorAdvanceReserve 1,018,138,144 954,928,472ContraTrackingAccount (815,363,774) (613,769,566)TotalValueofFiduciaryNetPosition $ 2,554,538,523 $ 2,532,528,975
SBCERS' VALUATION RESERVES ‐ PENSION PLAN
8. PENSION PLAN CONTRIBUTIONS
Funding Objective
The funding for retirement benefits comes from member contributions, plan sponsor contributions, and the earnings on investments held by the Plan. Contributions are made by members and employers at rates recommended by an independent actuary, approved by the Board, and adopted by the Board of Supervisors. The funding objective of SBCERS is to establish member and participating plan sponsor contribution rates that will remain level over time as a percentage of payroll, unless plan benefit provisions or actuarial assumptions are changed.
Money‐Weighted Rate of Return
For the fiscal year ending June 30, 2016, the annual money‐weighted rate of return on Plan investments, net of Plan investment expense was 1.38%. The money‐weighted rate of return expresses investment performance, net of investment expense, adjusted for the changing amounts actually invested.
Target Allocation and Long‐term Expected Real Rate of Return
The long‐term expected rate of return on pension plan investments of 7.5% was determined using a building block method in which best‐estimate ranges of expected future real rates of return (expected returns, net of Plan investment expense inflation) are developed for each major asset class. These ranges are combined to produce the long‐term expected future real rates of return by the target asset allocation percentage and then adding expected inflation. The target allocation and best estimates of geometric real rates of return for each major asset class, without consideration of inflation, are summarized in the following table.
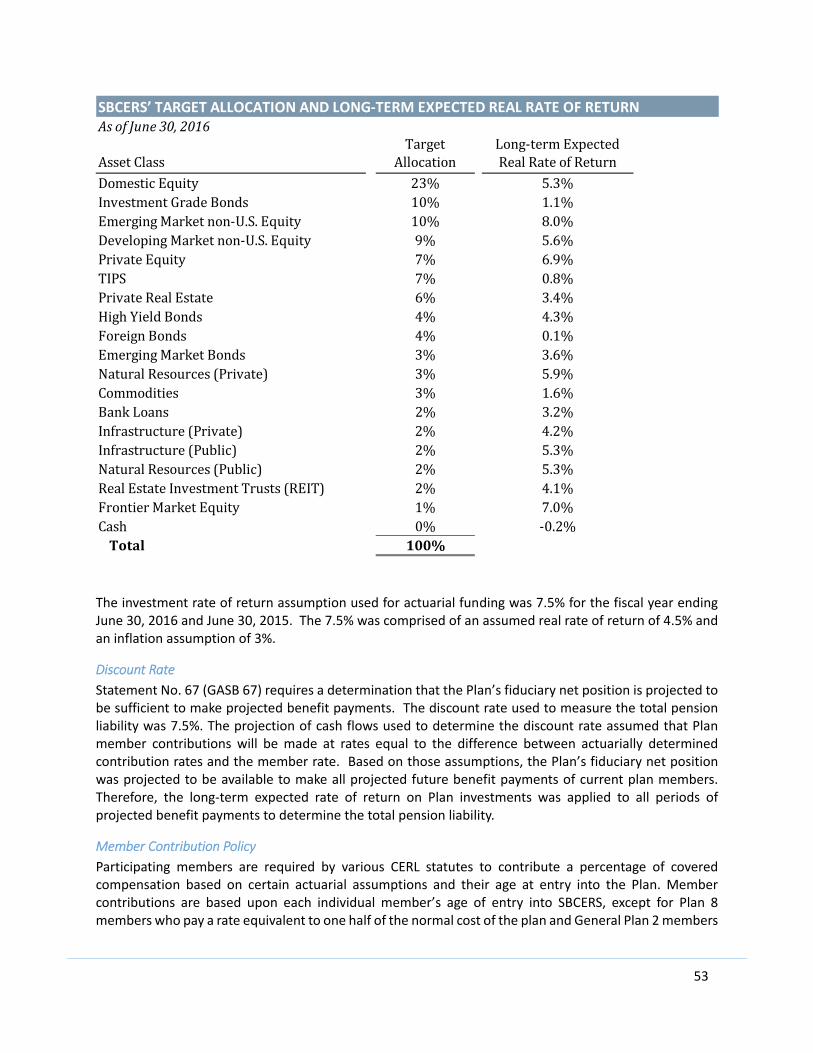
53
SBCERS’ TARGET ALLOCATION AND LONG‐TERM EXPECTED REAL RATE OF RETURNAsofJune30,2016
AssetClassTarget
AllocationLong‐termExpectedRealRateofReturn
DomesticEquity 23% 5.3%InvestmentGradeBonds 10% 1.1%EmergingMarketnon‐U.S.Equity 10% 8.0%DevelopingMarketnon‐U.S.Equity 9% 5.6%PrivateEquity 7% 6.9%TIPS 7% 0.8%PrivateRealEstate 6% 3.4%HighYieldBonds 4% 4.3%ForeignBonds 4% 0.1%EmergingMarketBonds 3% 3.6%NaturalResources(Private) 3% 5.9%Commodities 3% 1.6%BankLoans 2% 3.2%Infrastructure(Private) 2% 4.2%Infrastructure(Public) 2% 5.3%NaturalResources(Public) 2% 5.3%RealEstateInvestmentTrusts(REIT) 2% 4.1%FrontierMarketEquity 1% 7.0%Cash 0% ‐0.2%Total 100%
The investment rate of return assumption used for actuarial funding was 7.5% for the fiscal year ending June 30, 2016 and June 30, 2015. The 7.5% was comprised of an assumed real rate of return of 4.5% and an inflation assumption of 3%.
Discount Rate
Statement No. 67 (GASB 67) requires a determination that the Plan’s fiduciary net position is projected to be sufficient to make projected benefit payments. The discount rate used to measure the total pension liability was 7.5%. The projection of cash flows used to determine the discount rate assumed that Plan member contributions will be made at rates equal to the difference between actuarially determined contribution rates and the member rate. Based on those assumptions, the Plan’s fiduciary net position was projected to be available to make all projected future benefit payments of current plan members. Therefore, the long‐term expected rate of return on Plan investments was applied to all periods of projected benefit payments to determine the total pension liability.
Member Contribution Policy
Participating members are required by various CERL statutes to contribute a percentage of covered compensation based on certain actuarial assumptions and their age at entry into the Plan. Member contributions are based upon each individual member’s age of entry into SBCERS, except for Plan 8 members who pay a rate equivalent to one half of the normal cost of the plan and General Plan 2 members
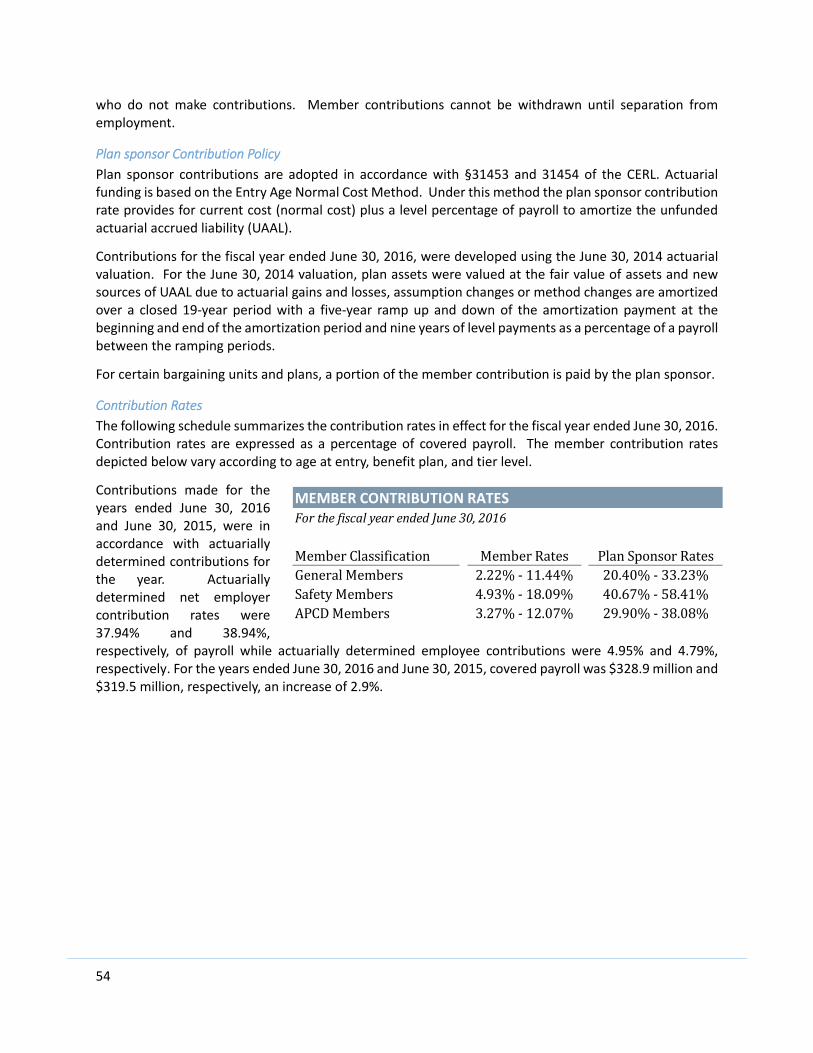
54
who do not make contributions. Member contributions cannot be withdrawn until separation from employment.
Plan sponsor Contribution Policy
Plan sponsor contributions are adopted in accordance with §31453 and 31454 of the CERL. Actuarial funding is based on the Entry Age Normal Cost Method. Under this method the plan sponsor contribution rate provides for current cost (normal cost) plus a level percentage of payroll to amortize the unfunded actuarial accrued liability (UAAL).
Contributions for the fiscal year ended June 30, 2016, were developed using the June 30, 2014 actuarial valuation. For the June 30, 2014 valuation, plan assets were valued at the fair value of assets and new sources of UAAL due to actuarial gains and losses, assumption changes or method changes are amortized over a closed 19‐year period with a five‐year ramp up and down of the amortization payment at the beginning and end of the amortization period and nine years of level payments as a percentage of a payroll between the ramping periods.
For certain bargaining units and plans, a portion of the member contribution is paid by the plan sponsor.
Contribution Rates
The following schedule summarizes the contribution rates in effect for the fiscal year ended June 30, 2016. Contribution rates are expressed as a percentage of covered payroll. The member contribution rates depicted below vary according to age at entry, benefit plan, and tier level.
Contributions made for the years ended June 30, 2016 and June 30, 2015, were in accordance with actuarially determined contributions for the year. Actuarially determined net employer contribution rates were 37.94% and 38.94%, respectively, of payroll while actuarially determined employee contributions were 4.95% and 4.79%, respectively. For the years ended June 30, 2016 and June 30, 2015, covered payroll was $328.9 million and $319.5 million, respectively, an increase of 2.9%.
MEMBER CONTRIBUTION RATESForthefiscalyearendedJune30,2016
MemberClassification MemberRates PlanSponsorRatesGeneralMembers 2.22%‐11.44% 20.40%‐33.23%SafetyMembers 4.93%‐18.09% 40.67%‐58.41%APCDMembers 3.27%‐12.07% 29.90%‐38.08%
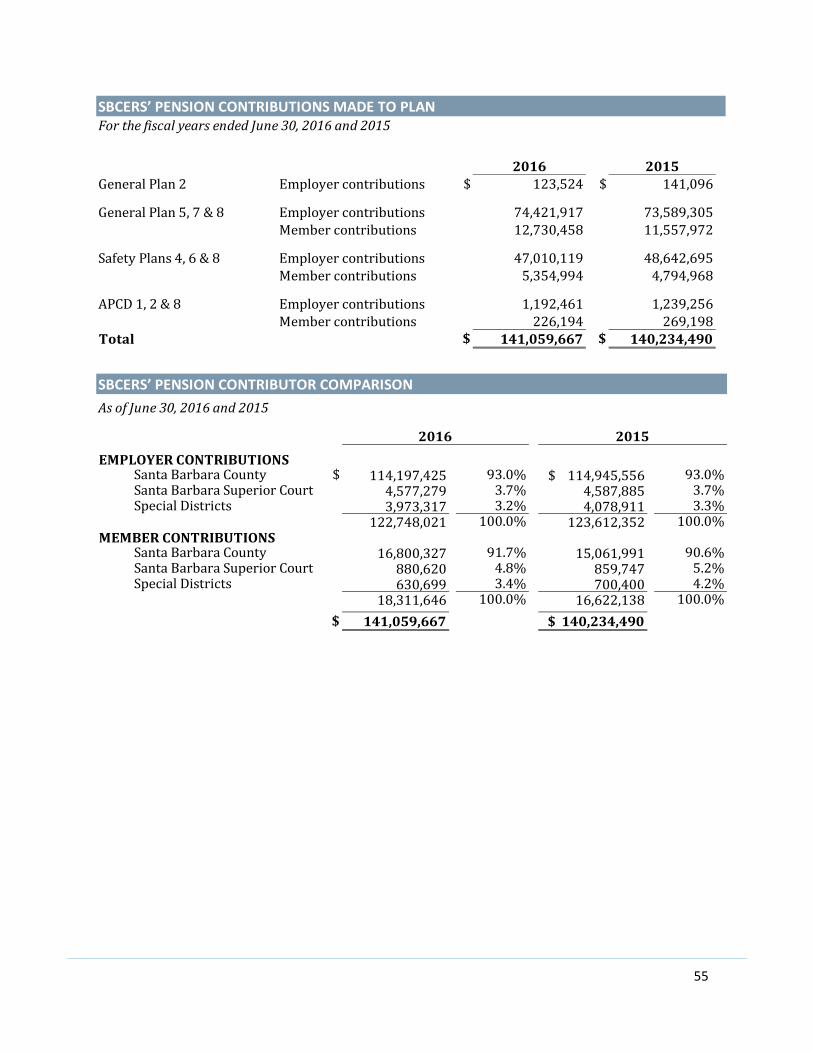
55
SBCERS’ PENSION CONTRIBUTIONS MADE TO PLAN
2016 2015GeneralPlan2 Employercontributions $ 123,524 $ 141,096
GeneralPlan5,7&8 Employercontributions 74,421,917 73,589,305 Membercontributions 12,730,458 11,557,972
SafetyPlans4,6&8 Employercontributions 47,010,119 48,642,695 Membercontributions 5,354,994 4,794,968
APCD1,2&8 Employercontributions 1,192,461 1,239,256 Membercontributions 226,194 269,198Total $ 141,059,667 $ 140,234,490
ForthefiscalyearsendedJune30,2016and2015
SBCERS’ PENSION CONTRIBUTOR COMPARISON
2016 2015
EMPLOYERCONTRIBUTIONSSantaBarbaraCounty $ 114,197,425 93.0% $114,945,556 93.0%SantaBarbaraSuperiorCourt 4,577,279 3.7% 4,587,885 3.7%SpecialDistricts 3,973,317 3.2% 4,078,911 3.3%
122,748,021 100.0% 123,612,352 100.0%MEMBERCONTRIBUTIONS
SantaBarbaraCounty 16,800,327 91.7% 15,061,991 90.6%SantaBarbaraSuperiorCourt 880,620 4.8% 859,747 5.2%SpecialDistricts 630,699 3.4% 700,400 4.2%
18,311,646 100.0% 16,622,138 100.0%
$ 141,059,667 $140,234,490
AsofJune30,2016and2015

56
9. NET PENSION LIABILITY OF PARTICIPATING EMPLOYERS
Employers’ Net Pension Liability
The net pension liability is measured as the total pension liability less the amount of the Plan’s fiduciary net position. The net pension liability is an accounting measurement for financial statement reporting purposes. The components of the Plan’s net pension liability on June 30, 2016 and June 30, 2015, were as follows:
2016 2015TotalPensionLiability $ 3,395,252,229 $ 3,260,156,781Less:FiduciaryNetPension (2,554,538,523) (2,532,528,975)NetPensionLiability $ 840,713,706 $ 727,627,806
FiduciaryNetPositionasaPercentageofTotalPensionLiability 75.2% 77.7%
AsofJune30,2016and2015SCHEDULE OF NET PENSION LIABILITY
Actuarial Assumptions
ValuationDate June30,2015ActuarialCostMethod Individualentry‐ageAmortizationMethod LevelpercentofpayAmortizationPeriod Nineteenyears(closed)AssetValuationMethod Directratesmoothing
InvestmentRateofReturn(AsofJune30,2016)
7.5%,netofinvestmentexpenses(3.0%forCPIand4.5%forrealincreasesaboveinflation)
ProjectedSalaryIncrease VariablepercentagebasedonserviceWageInflation 3.50%
2.75%(allplansexceptAPCDPlan8andGeneralPlan7&8)2.00%(APCDPlan8andGeneralPlan7&8)
MortalityRates
Mortalityratesforactives,retirees,beneficiaries,terminatedvested,andreciprocalsarebasedonthesexdistinctretiredpension(RP)2000CombinedHealthyTablespublishedbytheSocietyofActuaries,withGenerationalImprovementusingProjectionScaleBB
SUMMARY ACTUARIAL INFORMATION
SUMMARY OF VALUATION ASSUMPTIONS
Cost‐of‐LivingAdjustmentsforRetirees

57
Sensitivity Analysis
The net pension liability is calculated using the discount rate. The following table presents the net pension liability change when a modification (increase and decrease) of .01 is applied to the current discount rate of 0.075. The sensitivity schedule calculates what the net pension liability would be if it were calculated using a discount rate that is 1‐percent point lower or 1‐percent point higher than the current rate:
1% Discount 1%Decrease Rate Increase6.50% 7.50% 8.50%
TotalPensionLiability $ 3,867,075,921 $ 3,395,252,229 $ 3,008,572,999Less:FiduciaryNetPension (2,554,538,523) (2,554,538,523) (2,554,538,523)NetPensionLiability $ 1,312,537,398 $ 840,713,706 $ 454,034,476
FiduciaryNetPositionasaPercentageofTotalPensionLiability 66.1% 75.2% 84.9%
AsofJune30,2016SCHEDULE OF NET PENSION LIABILITY SENSITIVITY
10. ADMINISTRATIVE EXPENSE
The Board adopted an annual budget for the year ended June 30, 2016, that covers the administration expense of the System with the earnings of the retirement fund. Such expenditures are subject to limitations imposed by statute, California Government Code §31580.2. Expenditures for computer software, computer hardware, and computer technology consulting services in support of these computer products shall not be considered a cost of administration of the retirement system for purposes of this code section.
SBCERS has been in compliance with the rules governing administrative expense in prior years. The actuarial accrued liability was used to calculate the statutory budget amount. Total administrative expense subject to the limit for the years ended June 30, 2016, and June 30, 2015, were $ 5.2 million and $ 4.4 million. In accordance with government code section §31580.2, the limit for each year was $ 6.5 million and $ 6.2 million, calculated using the actuarial liability for respective periods.
AsofJune30,2016and2015
2016 2015 ExpenseSubjecttoStatutoryLimitation
EmployeeSalariesandBenefits $ 2,741,350 $ 2,551,188OperatingExpenses 1,044,900 717,311ProfessionalServices 576,564 268,917ActuarialCosts 122,609 178,596LegalCosts 441,284 446,363TotalExpenseSubjecttoStatutoryLimitation 4,926,707 4,162,375
ExpenseNotSubjecttoStatutoryLimitationComputerSoftwareServicesandSupport 174,071 168,696ComputerEquipmentandSupplies 92,028 73,271
TotalExpenseNotSubjecttoStatutoryLimitation
266,099 241,967
TotalPensionAdministrativeExpense $ 5,192,806 $ 4,404,342
SBCERS’ ADMINISTRATIVE EXPENSE
58
Administrative expenses for OPEB are allocated back to the participating employers based on level of participation in the program. These administrative costs are billed to these employers and are therefore not paid for by the Plan.
11. CONTINGENCIES
In the normal course of business, denials of applications for benefits are appealed to the Superior Court. The outcome of these decisions will have no material impact on the financial status of SBCERS.
12. SUBSEQUENT EVENTS
Management has reviewed and identified, up to the date of the Independent Auditor’s Report of January 23, 2017, and the subsequent events described below.
On October 26, 2016 the Board of Retirement took action and on December 14, 2016, adopted a discount rate of 7.0% for use in determining contributions. This discount rate was developed using the building block method. The inflation assumption was reduced 25 bps to 2.75% and real return assumption was reduced 25 bps to 4.25%. The Board reduced its estimated wage growth assumption from 50 bps above inflation to 25 bps above inflation. The adjustment in discount or assumption rate will be reflected in the financial statements for the fiscal year ended June 30, 2017.
SBCERS completed the hiring of a Controller to fill the Accounting Manager position dedicated to accounting and financial operations and financial reporting.

59
REQUIRED SUPPLEMENTARY INFORMATION

60
REQUIRED SUPPLEMENTARY INFORMATION – PENSION
CHANGES IN NET PENSION LIABILITYFiscalYearEnded
2016 2015 2014Totalpensionliability ServiceCost(MOY) $ 71,218,683 $ 70,056,133 $ 66,696,324Interest(includesinterestonservicecost) 241,733,937 231,804,221 220,238,560Differencesbetweenexpected&actualexperience
(31,199,454) (27,900,755) ‐Benefitpayments,includingrefundsofmembercontributions
(146,657,716) (137,771,219) (131,100,585)Netchangeintotalpensionliability 135,095,450 136,188,380 155,834,299
Totalpensionliability‐beginning 3,260,156,781 3,123,968,401 2,968,134,102
Totalpensionliability‐ending 3,395,252,231 3,260,156,781 3,123,968,401 Planfiduciarynetposition Contributions‐employer 122,748,021 123,612,352 119,227,652Contributions‐member 18,311,646 16,622,138 14,514,010Netinvestmentincome 32,800,406 20,840,286 328,852,388
Benefitpayments,includingrefundsofmembercontributions
(146,657,718) (137,771,219) (131,100,585)
Administrativeexpense (5,192,806) (4,404,342) (4,288,603)Netchangeinplanfiduciarynetposition 22,009,549 18,899,215 327,204,862
Planfiduciarynetposition‐beginning 2,532,528,974 2,513,629,759 2,186,424,897
Planfiduciarynetposition‐ending 2,554,538,523 2,532,528,974 2,513,629,759
Netpensionliability‐ending $ 840,713,706 $ 727,627,807 $ 610,338,642 Planfiduciarynetpositionasapercentageofthetotalpensionliability
75.2% 77.7% 80.5%
Coveredemployeepayroll $ 328,934,766 $ 319,547,370 $ 307,421,818
Netpensionliabilityasapercentageofcoveredpayroll
255.6% 227.7% 198.5%
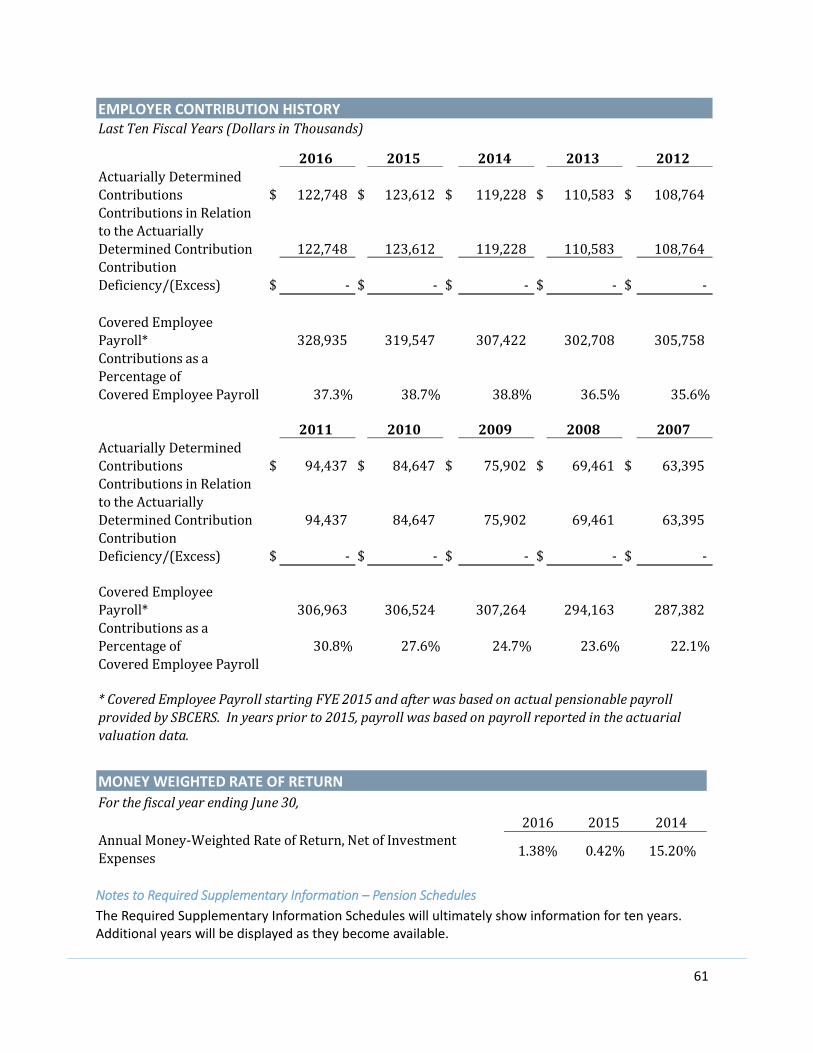
61
EMPLOYER CONTRIBUTION HISTORYLastTenFiscalYears(DollarsinThousands)
2016 2015 2014 2013 2012ActuariallyDeterminedContributions $ 122,748 $ 123,612 $ 119,228 $ 110,583 $ 108,764ContributionsinRelationtotheActuariallyDeterminedContribution
122,748 123,612 119,228 110,583 108,764
ContributionDeficiency/(Excess) $ ‐ $ ‐ $ ‐ $ ‐ $ ‐ CoveredEmployeePayroll*
328,935
319,547
307,422
302,708
305,758
ContributionsasaPercentageofCoveredEmployeePayroll
37.3% 38.7% 38.8% 36.5% 35.6%
2011 2010 2009 2008 2007ActuariallyDeterminedContributions $ 94,437 $ 84,647 $ 75,902 $ 69,461 $ 63,395ContributionsinRelationtotheActuariallyDeterminedContribution
94,437 84,647 75,902 69,461 63,395
ContributionDeficiency/(Excess) $ ‐ $ ‐ $ ‐ $ ‐ $ ‐ CoveredEmployeePayroll*
306,963
306,524
307,264
294,163
287,382
ContributionsasaPercentageofCoveredEmployeePayroll
30.8% 27.6% 24.7% 23.6% 22.1%
*CoveredEmployeePayrollstartingFYE2015andafterwasbasedonactualpensionablepayrollprovidedbySBCERS.Inyearspriorto2015,payrollwasbasedonpayrollreportedintheactuarialvaluationdata.
MONEY WEIGHTED RATE OF RETURN
ForthefiscalyearendingJune30, 2016 2015 2014AnnualMoney‐WeightedRateofReturn,NetofInvestmentExpenses 1.38% 0.42% 15.20%
Notes to Required Supplementary Information – Pension Schedules
The Required Supplementary Information Schedules will ultimately show information for ten years. Additional years will be displayed as they become available.
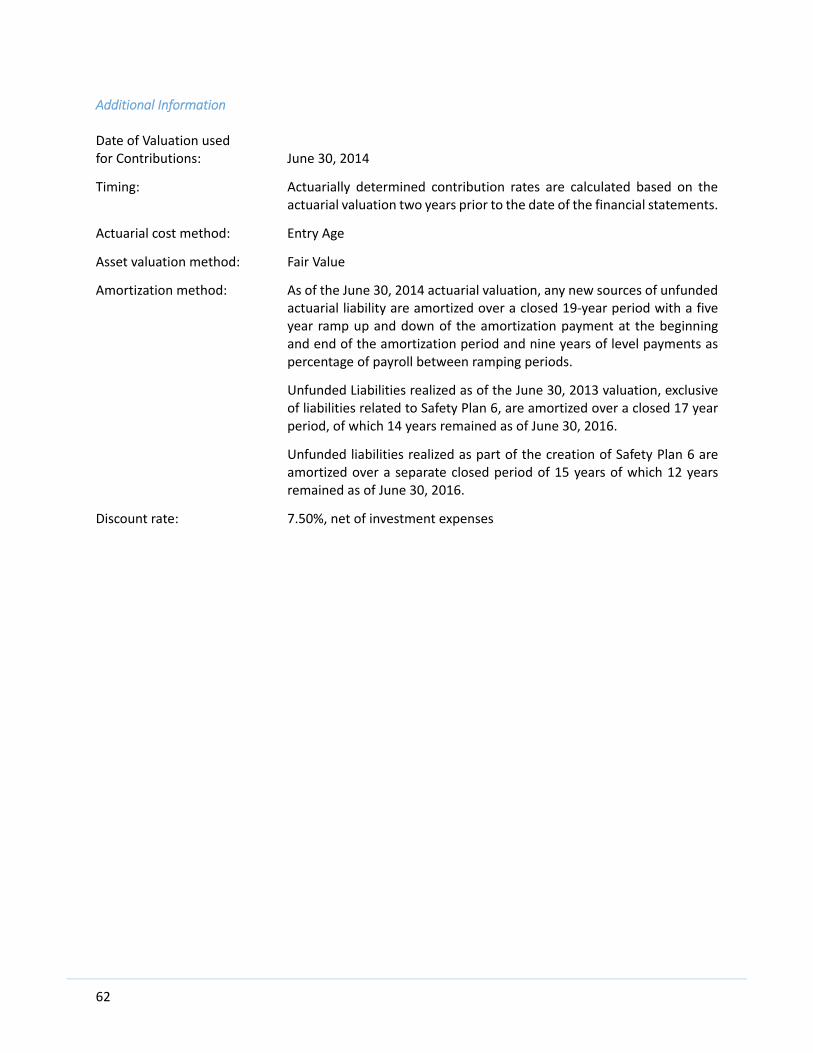
62
Additional Information Date of Valuation used for Contributions: June 30, 2014
Timing: Actuarially determined contribution rates are calculated based on the actuarial valuation two years prior to the date of the financial statements.
Actuarial cost method: Entry Age
Asset valuation method: Fair Value
Amortization method: As of the June 30, 2014 actuarial valuation, any new sources of unfunded actuarial liability are amortized over a closed 19‐year period with a five year ramp up and down of the amortization payment at the beginning and end of the amortization period and nine years of level payments as percentage of payroll between ramping periods.
Unfunded Liabilities realized as of the June 30, 2013 valuation, exclusive of liabilities related to Safety Plan 6, are amortized over a closed 17 year period, of which 14 years remained as of June 30, 2016.
Unfunded liabilities realized as part of the creation of Safety Plan 6 are amortized over a separate closed period of 15 years of which 12 years remained as of June 30, 2016.
Discount rate: 7.50%, net of investment expenses

63
REQUIRED SUPPLEMENTARY INFORMATION – (OPEB) Other Post Employment Benefits (OPEB)
SCHEDULE OF FUNDING PROGRESS
(DollarsinThousands)
(a) (b) (b‐a) (a/b) (c) ([b‐a]/c)
*ActuarialValuationDate
ActuarialValueofAssets
EntryAgeActuarialAccruedLiability(AAL)
UnfundedAAL(UAAL)
FundedRatio
CoveredPayroll
UAALasa%of
CoveredPayroll
6/30/2009 $ 1,169 $ 174,532 $ 173,363 0.7% $ 306,524 56.6%6/30/2010 $ 2,153 $ 187,220 $ 185,067 1.1% $ 306,357 60.4%6/30/2012 $ 3,035 $ 190,179 $ 187,144 1.6% $ 302,379 61.9%6/30/2014 $ 4,070 $ 193,205 $ 189,135 2.1% $ 282,963 66.8%
*OPEBvaluationsarecompletedbiennially;dataprovidedasofthelastOPEBvaluation.
SCHEDULE OF EMPLOYER CONTRIBUTIONS
(DollarsinThousands)
FiscalYearEnded
AnnualRequiredContributions
(ARC)
ActualEmployer
Contributions%ofARCContributed
6/30/2009 $ 13,353 $ 7,251 54.3%6/30/2010 $ 19,791 $ 8,782 44.4%6/30/2011 $ 21,784 $ 8,666 39.8%6/30/2012 $ 22,601 $ 8,362 37.0%6/30/2013 $ 25,226 $ 8,358 33.1%6/30/2014 $ 28,155 $ 8,899 31.6%6/30/2015* $ 30,363 $ 9,421 31.0%
ContributiondataisderivedfromtheBasicFinancialStatementsandActuarialData.
*SBCERSconductsbiennialvaluations,ARCamountisprojectedbasedoffofJune30,2014Valuation
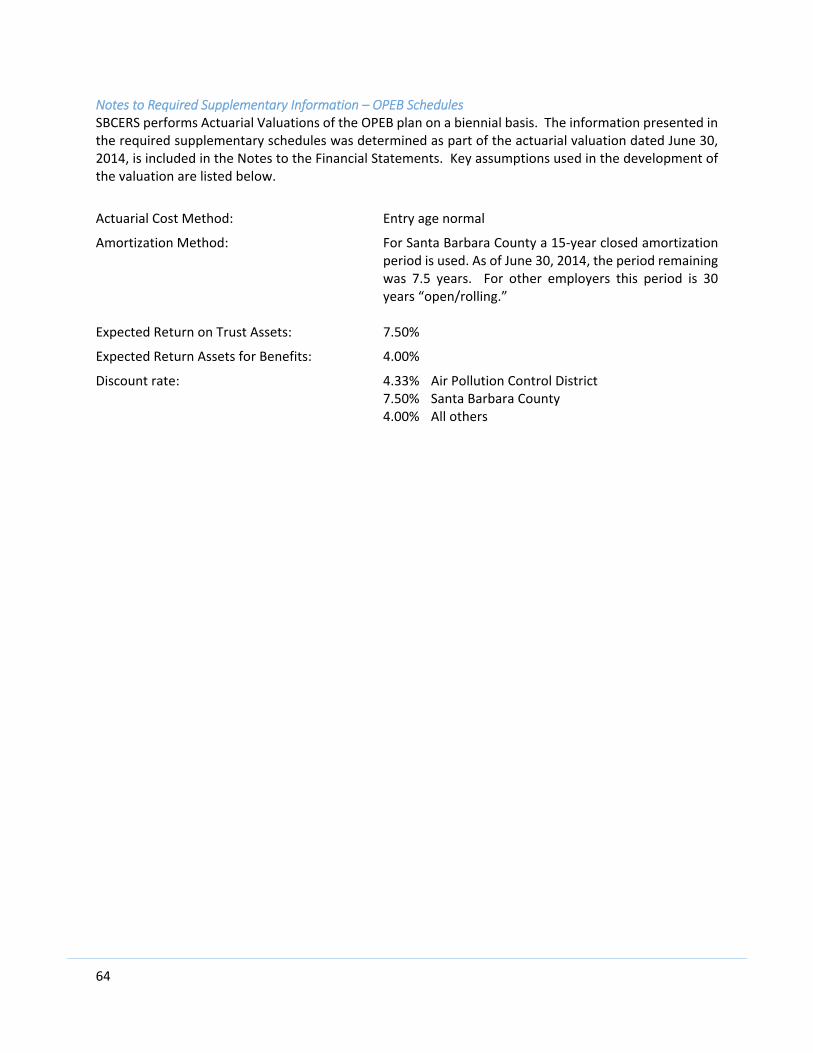
64
Notes to Required Supplementary Information – OPEB Schedules SBCERS performs Actuarial Valuations of the OPEB plan on a biennial basis. The information presented in the required supplementary schedules was determined as part of the actuarial valuation dated June 30, 2014, is included in the Notes to the Financial Statements. Key assumptions used in the development of the valuation are listed below.
Actuarial Cost Method: Entry age normal
Amortization Method: For Santa Barbara County a 15‐year closed amortization period is used. As of June 30, 2014, the period remaining was 7.5 years. For other employers this period is 30 years “open/rolling.”
Expected Return on Trust Assets: 7.50%
Expected Return Assets for Benefits: 4.00%
Discount rate: 4.33% Air Pollution Control District 7.50% Santa Barbara County 4.00% All others

65
OTHER SUPPLEMENTARY INFORMATION

66
OTHER SUPPLEMENTARY INFORMATION
SCHEDULE OF PENSION ADMINSTRATION EXPENSE
2016 2015PersonnelServicesSalariesandEmployeeBenefits $ 2,741,350 $ 2,551,188
TotalPersonnelServices 2,741,350 2,551,188
ProfessionalServicesActuarialCosts 122,609 178,596LegalCosts 441,284 446,363ComputerSoftwareServicesandSupport 174,071 168,696CountyCostAllocation 25,173 4,445DisabilityHearingOfficerFees 6,619 45,808DisabilityMedicalFees 119,889 53,371DisabilityTranscriptionFees 11,580 8,749ExternalAuditFees 59,475 55,078OtherProfessionalServices 353,828 101,466
TotalProfessionalServices 1,314,529 1,062,572
CommunicationPostage 44,028 46,271Telecommunication 39,594 42,462Training 94,370 89,775TransportationandTravel 37,604 39,268
TotalCommunication 215,596 217,776
Rents/Leases/StructuresRents/Leases/Structure 251,599 292,082Furniture&Fixtures 12,012 45,436BuildingMaintenance 3,694 46,516Equipment ‐ 250
TotalRents/Leases/Structures 267,305 384,284
MiscellaneousFundTransfers 452,287 ‐ComputerEquipmentandSupplies 92,028 73,271OtherOfficeExpenses 59,225 67,070Insurance 50,486 48,181
TotalMiscellaneous 654,026 188,522
TotalAdministrativeExpense $ 5,192,806 $ 4,404,342
FortheYearsEndedJune30,2016and2015
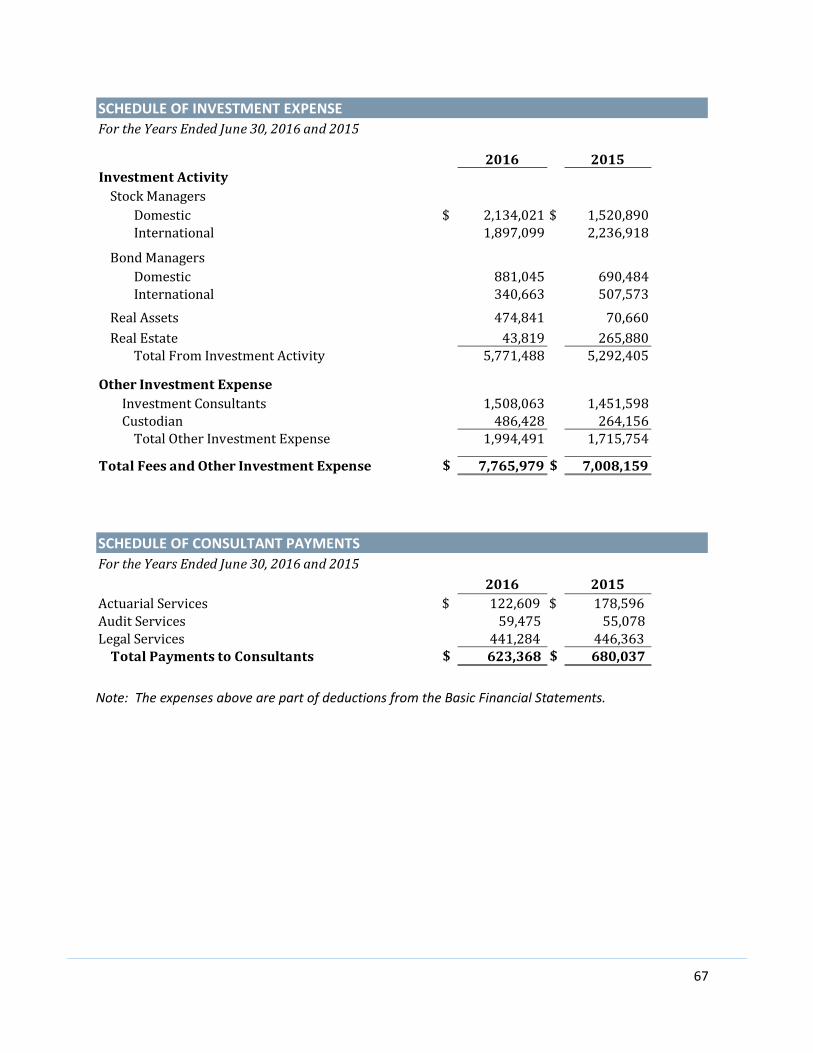
67
SCHEDULE OF INVESTMENT EXPENSE
FortheYearsEndedJune30,2016and2015
2016 2015InvestmentActivityStockManagers
Domestic $ 2,134,021$ 1,520,890International 1,897,099 2,236,918
BondManagersDomestic 881,045 690,484International 340,663 507,573
RealAssets 474,841 70,660RealEstate 43,819 265,880
TotalFromInvestmentActivity 5,771,488 5,292,405
OtherInvestmentExpenseInvestmentConsultants 1,508,063 1,451,598Custodian 486,428 264,156TotalOtherInvestmentExpense 1,994,491 1,715,754
TotalFeesandOtherInvestmentExpense $ 7,765,979$ 7,008,159
SCHEDULE OF CONSULTANT PAYMENTS
FortheYearsEndedJune30,2016and20152016 2015
ActuarialServices $ 122,609 $ 178,596AuditServices 59,475 55,078LegalServices 441,284 446,363TotalPaymentstoConsultants $ 623,368 $ 680,037
Note: The expenses above are part of deductions from the Basic Financial Statements.

68
INVESTMENT
69
70

71
72
INVESTMENT POLICIES External investment management firms manage Santa Barbara County Employees’ Retirement System (SBCERS) investment assets. Professional investment consultants, along with staff, closely monitor the activity of these managers and assist the Board of Retirement (the Board) with the implementation of investment policies and long‐term investment strategies.
The Board, having sole and exclusive authority and fiduciary responsibility for the investment and administration of the System, has adopted various investment policies which cover various investment types. These documents reflect the Board’s policies for management of the System’s investments.
The Board recognizes that a prudent, well‐articulated investment policy is crucial to the long‐term success of the System. As such, the Board has developed these investment policies with the following goals in mind:
To clearly and explicitly establish the objectives and parameters that govern the investment of the System’s assets.
To establish a target asset allocation designed to satisfy the System’s long‐term objective of funding the benefits promised to members and beneficiaries.
To establish the guidelines by which the Board will delegate a portion of its authority over investment of the assets of the System to consultants, managers, and partners, and will monitor their performance to assure compliance with the investment policies.
The following general investment goals broadly articulate the philosophy by which the Board will manage the assets of the System in accordance with the law.
The Board seeks to achieve a return on investment relative to acceptable levels of liquidity and investment risk that are prudent and reasonable, given capital market conditions from time to time. While the Board recognizes the importance of the preservation of capital, it also acknowledges the theory of capital market pricing which maintains that varying degrees of investment risk should be rewarded with compensating returns. Consequently, prudent risk‐taking is appropriate.
The Board’s investment policies and practice shall at all times comply with all applicable state and federal laws and regulations.
The Board’s investment strategy is designed to ensure the prudent and diversified investment of assets in such a manner as to provide real growth of assets over time while protecting the value of such assets from undue risk of loss, at the minimum possible cost, and without sacrificing return.
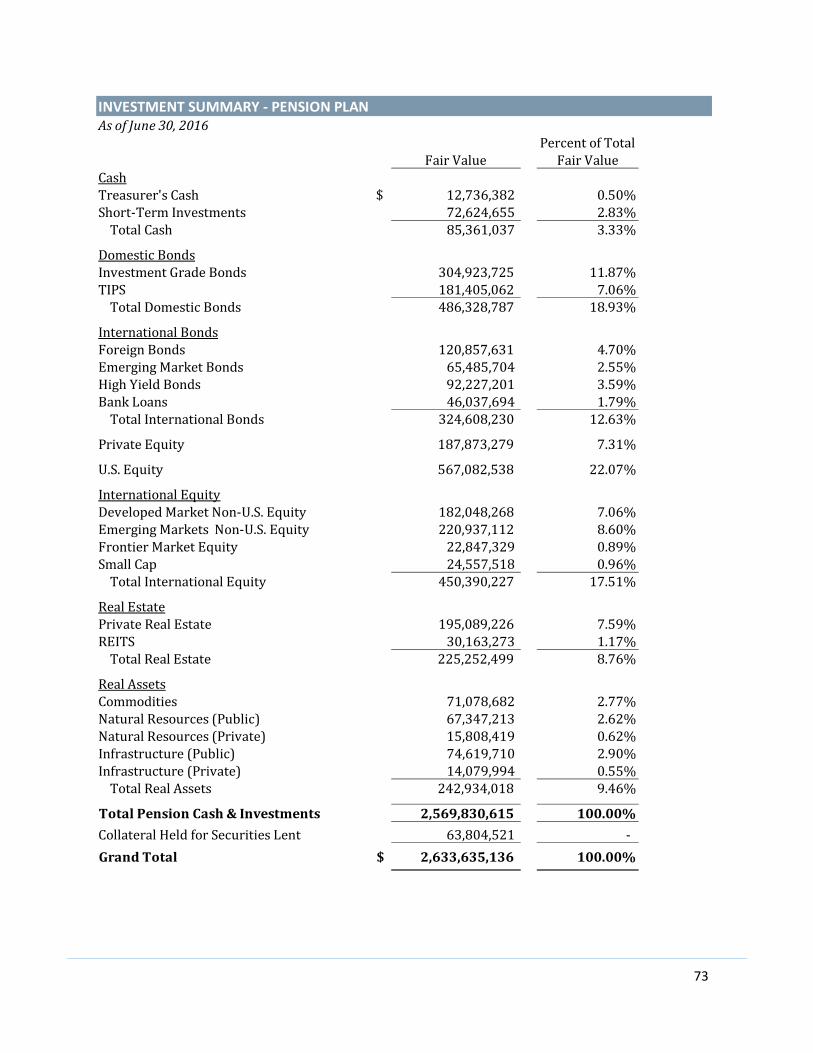
73
AsofJune30,2016
FairValuePercentofTotalFairValue
CashTreasurer'sCash $ 12,736,382 0.50%Short‐TermInvestments 72,624,655 2.83%TotalCash 85,361,037 3.33%
DomesticBondsInvestmentGradeBonds 304,923,725 11.87%TIPS 181,405,062 7.06%TotalDomesticBonds 486,328,787 18.93%
InternationalBondsForeignBonds 120,857,631 4.70%EmergingMarketBonds 65,485,704 2.55%HighYieldBonds 92,227,201 3.59%BankLoans 46,037,694 1.79%TotalInternationalBonds 324,608,230 12.63%
PrivateEquity 187,873,279 7.31%U.S.Equity 567,082,538 22.07%InternationalEquityDevelopedMarketNon‐U.S.Equity 182,048,268 7.06%EmergingMarketsNon‐U.S.Equity 220,937,112 8.60%FrontierMarketEquity 22,847,329 0.89%SmallCap 24,557,518 0.96%TotalInternationalEquity 450,390,227 17.51%
RealEstatePrivateRealEstate 195,089,226 7.59%REITS 30,163,273 1.17%TotalRealEstate 225,252,499 8.76%
RealAssetsCommodities 71,078,682 2.77%NaturalResources(Public) 67,347,213 2.62%NaturalResources(Private) 15,808,419 0.62%Infrastructure(Public) 74,619,710 2.90%Infrastructure(Private) 14,079,994 0.55%TotalRealAssets 242,934,018 9.46%
TotalPensionCash&Investments 2,569,830,615 100.00%CollateralHeldforSecuritiesLent 63,804,521 ‐
GrandTotal $ 2,633,635,136 100.00%
INVESTMENT SUMMARY ‐ PENSION PLAN
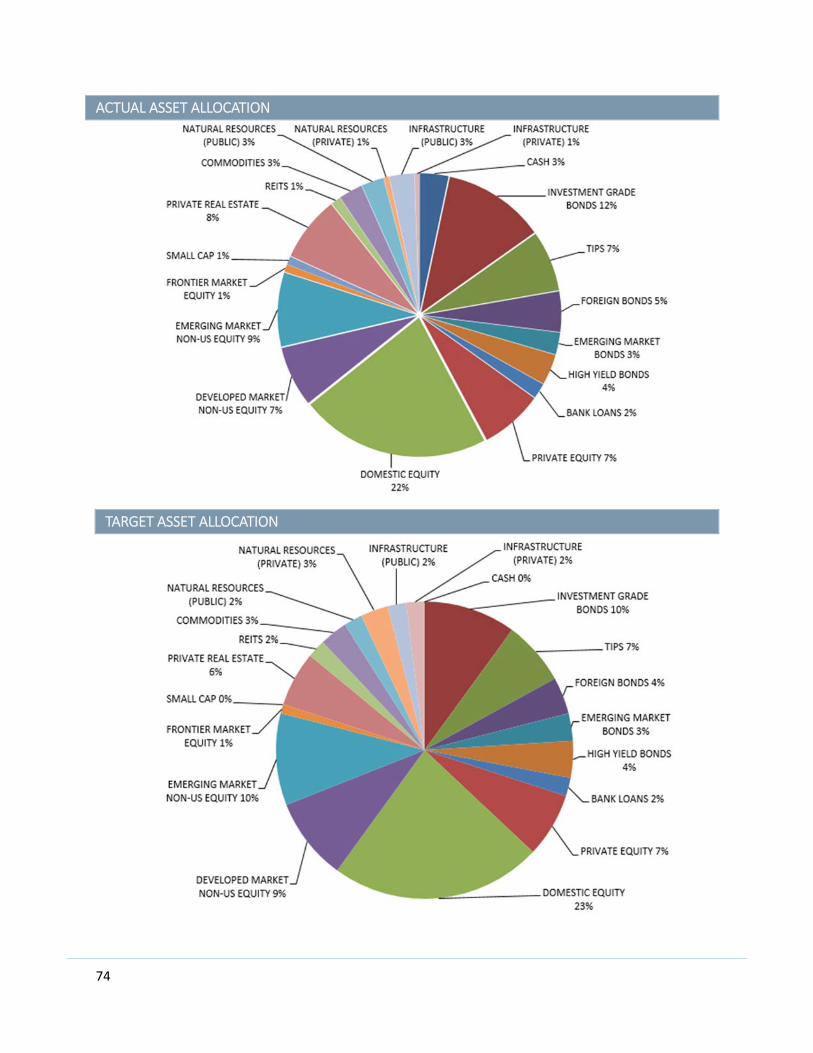
74
ACTUAL ASSET ALLOCATION
TARGET ASSET ALLOCATION

75
AsofJune30,2016
InvestmentsCurrentYear 3‐year 5‐year
DomesticEquity 3.23% 11.11% 10.62%Russell3000Benchmark 2.14% 11.12% 11.60%DevelopedMarketNon‐U.S.Equity ‐6.62% 4.55% N/A%MSCIEAFE ‐10.16% 2.06% 1.68%EmergingMarketsEquity ‐9.97% ‐1.74% N/A%MSCIEmergingMarkets ‐12.05% ‐1.56% ‐3.78%FrontierMarketEquity ‐13.33% ‐3.25% N/A%MSCIFrontierMarkets ‐12.09% 1.00% 1.45%InvestmentGradeBonds 5.49% 4.05% 4.59%InvestmentGradeBondsBlendedIndex 6.00% 4.06% 3.70%ForeignBonds 6.81% 4.36% N/A%JPMorganGlobalBond(ex.U.S.Index) 14.84% 2.77% 0.48%EmergingMarketBonds 4.95% 0.14% N/A%JPMGBI‐EMGlobalDiversified 1.99% 3.57% ‐2.23%TIPS 4.32% 2.29% N/A%BarclaysU.S.TIPS 4.35% 2.31% 2.63%HighYieldBonds ‐1.58% 2.58% N/A%BarclaysHighYield 1.62% 4.18% 5.84%BankLoans 2.92% 3.96% N/A%CSFBLeveragedLoan 0.93% 3.04% 4.00%Commodities ‐5.68% ‐5.31% N/A%BbrgCmdtyIndex(TR) ‐13.34% ‐10.56% ‐10.83%NaturalResourcesPublic ‐9.32% ‐4.25% N/A%S&PGlobalLargeMidCapCommodities&Resources ‐9.16% ‐4.01% ‐6.93%NaturalResourcesPrivate 1.44% N/A% N/A%CPI+4%(1‐QuarterLagged) 4.89% 4.79% 5.33%InfrastructurePublic ‐0.07% 5.59% N/A%DJBrookfieldGlobalInfrastructureIndex 3.22% 8.46% 9.61%InfrastructurePrivate ‐18.21% N/A% N/A%CPI+4%(1‐QuarterLagged) 5.05% 5.11% 5.37%PrivateEquity 4.69% 11.85% 11.40%Russell3000+3%(1‐QuarterLagged) 2.65% 14.48% 14.34%PrivateRealEstate 11.94% 12.07% N/A%NCREIFODCE‐Index(AWA)(Net)(1‐QuarterLagged) 12.62% 12.59% 12.20%REITS 25.37% 11.54% N/A%FTSENAREITAllEqREITsTRIndex 23.62% 13.31% 12.52%Cash 0.4% 0.2% 0.2%T‐Bills(90daylagged) 0.1% 0.1% 0.1%TotalFund 1.38% 5.47% 5.28%SBCERSPolicyBenchmark 2.33% 6.14% 5.70%
INVESTMENT RESULTS BASED ON FAIR VALUE
Annualized
Calculations were prepared using a time‐weighted rate of return based on the market rate of return in accordance with Global Investment Performance Standards (BIPs).

76
Returns shown here for SBCERS are net of fees.
AsofJune30,2016
Shares SecurityName FairValue127,561 AltriaGroupInc. $ 8,796,607115,520 GeneralMillsInc. 8,238,887109,327 VerizonComminicationsInc. 6,104,82041,391 Johnson&Johnson 5,020,72859,396 NestleSA 4,581,820100,646 AT&TInc. 4,348,91440,623 PepsiCoInc. 4,303,60193,753 Coca‐ColaCo. 4,249,823119,280 PfizerInc. 4,199,84940,199 PhillipMorrisInternational 4,089,042
SCHEDULE OF TOP TEN EQUITY SECURITIES
AsofJune30,2016
Par SecurityName FairValue20,205,000 U.S.TreasuryNote1.375%maturitydate09/30/2020 $ 20,571,92312,841,000 U.S.TreasuryNote1.625%maturitydate05/15/2026 12,998,0457,030,000 U.S.TreasuryNote1.750%maturitydate09/30/2022 7,252,7107,000,000 U.S.TreasuryBill0.000%maturitydate08/11/2016 6,996,2895,465,000 U.S.TreasuryBond2.500%maturitydate02/15/2046 5,690,6504,871,000 U.S.TreasuryNote1.625%maturitydate07/31/2020 5,008,9474,259,000 U.S.TreasuryBond3.000%maturitydate05/15/2045 4,895,3374,750,000 U.S.TreasuryNote0.875%maturitydate07/31/2020 4,772,6573,940,000 U.S.TreasuryNote0.875%maturitydate03/31/2018 3,959,2272,900,000 U.S.TreasuryNote0.625%maturitydate07/31/2017 2,902,842
Acompletelistofportfolioholdingsisavailableuponrequest.
SCHEDULE OF TOP TEN BOND HOLDINGS

77
AsofJune30,2016
TypeOfInvestment FairValue %OfPortfolioPRIVATEEQUITY 187,873,279$ 7.30%
PrivateEquityTotal 187,873,279$ 7.30%EQUITY
Aerospace 10,582,577$ 0.42%BasicIndustries 29,710,432 1.16%BusinessServices 30,915,473 1.20%CapitalGoods 2,682,427 0.10%Chemicals 10,053,317 0.39%CommercialServices 22,555,438 0.88%CommingledFunds‐US/Int'l 448,652,573 17.46%ConsumerDurables 23,341,169 0.91%ConsumerNon‐Durables 13,953,269 0.54%Energy 8,460,357 0.33%FinancialServices 32,224,913 1.25%HealthCare 23,008,593 0.90%Industrial 24,693,361 0.96%Insurance 42,608,781 1.66%Media 8,097,768 0.32%Other 98,537,563 3.83%Pharmaceuticals 41,376,104 1.61%RealEstate 12,416,017 0.48%Technology 108,455,763 4.22%Transportation 24,324,250 0.95%Utilities 822,620 0.03%
EquityTotal 1,017,472,765$ 39.60%BONDS
AssetBackedSecurities 15,172,960$ 0.59%Banking&Finance 32,961,000 1.28%CollateralizedMortgageObligations 61,567,910 2.40%CommingledFundsUSDebt 467,909,822 18.21%GovernmentBonds‐US 72,595,587 2.82%GovernmentBonds‐Int'l 32,149,388 1.25%HealthCare 5,856,589 0.23%Housing 15,930,070 0.62%Industrial 10,837,614 0.42%Insurance 4,303,459 0.17%OtherCorporateBonds 25,988,953 1.01%PrivatePlacements 41,303,537 1.61%Utilities 24,360,128 0.95%
BondsTotal 810,937,017$ 31.56%REALESTATE/REALASSETS
PrivateRealEstate 225,252,499 8.77%RealAssets 242,934,018 9.45%
RealEstate/RealAssetsTotal 468,186,517$ 18.22%CASHANDSHORT‐TERMINVESTMENTS 85,361,037 3.32%
GrandTotal 2,569,830,615$ 100.00%
INVESTMENT HOLDINGS ‐ PENSION

78
LIST OF INVESTMENT MANAGERS
DomesticEquity InternationalEquity RealEstate
USEquity DevelopedMarkets PrivateRealEstate
•AnalyticInvestors •ArtisanPartners •ORGRealEstate
•ArtisanPartners •FirstEagle REITS
•DimensionalFundAdvisors •Panagora •HarrisonStreet
•NicholsAssetManagement •StateStreetGlobalAdvisors RealAssets
•Rampart EmergingMarkets Commodities
•RBCGlobalAssetManagement •BlackRock •BlackRock
•Rhumbline •DimensionalFundAdvisors •MountLucas
•RiceHallJames •Vontobel DomesticBonds
•StateStreetGlobalAdvisors FrontierMarkets InvestmentGradeBonds
•TheLondonCompany •Aberdeen •Aberdeen
InternationalBonds SmallCap •BlackRock
ForeignBonds •CopperRock •Reams
•Aberdeen NaturalResources(Public) •Schroders
•BlackRock •StateStreetGlobalAdvisors TIPS
•Brandywine NaturalResources(Private) •BlackRock
EmergingMarketDebt •HamiltonLane PrivateEquity
•StoneHarbor Infrastructure(Public) •HamiltonLane
HighYieldBonds •RareInfrastructure
•Aberdeen Infrastructure(Private)
•Hotchkis&Wiley •HamiltonLane
BankLoans
•BeachPoint

79
AsofJune30,2016AssetsUnderManagement Fees*
BasisPoints
InvestmentManagers:BondManagers $ 812,315,084 $ 1,221,707 4.74EquityManagers 1,019,536,946 4,031,121 15.64RealAssets 242,934,018 474,841 1.84RealEstate 225,252,499 43,819 0.17Short‐TermInvestments 72,624,655 ‐ ‐AlternativeEquity 187,873,279 ‐ ‐TotalInvestmentManagers 2,560,536,481 5,771,488 22.39
Other:Cash 17,250,123 ‐ ‐CustodianFees ‐ 486,428 1.89InvestmentConsultantsFees ‐ 1,508,063 5.85TotalOther 17,250,123 1,994,491 7.74
Total $ 2,577,786,604 $ 7,765,979 30.13
*Note:Somefeesarenetteddirectlyagainstassetsundermanagement.
SCHEDULE OF PROFESSIONAL FEES AND SERVICES

80
ACTUARIAL
Via Electronic Mail
December 5, 2016
Actuarial Certification
This is the Actuary’s Certification Letter for the Actuarial Section of the Comprehensive Annual
Financial Report (CAFR) for the Santa Barbara County Employees’ Retirement System (the
Plan) as of June 30, 2016. This letter includes references to two documents produced by Cheiron
for the Plan: the Actuarial Valuation Report as of June 30, 2015 (transmitted December 8, 2015)
and the Governmental Accounting Standards Board (GASB) 67/68 Report as of June 30, 2016
(transmitted October 20, 2016).
Actuarial Valuation Report as of June 30, 2015
The purpose of the annual Actuarial Valuation Report as of June 30, 2015 is to determine the
actuarial funding status of the Plan on that date and to calculate recommended contribution rates
for the participating employers and Plan members for the Fiscal Year 2016-2017. The prior
review was conducted as of June 30, 2014, and included recommended contribution rates for the
Fiscal Year 2015-2016.
Actuarial funding is based on the Entry Age Normal Cost Method. Under this method, the
employer contribution rate provides for current cost (normal cost and expected administrative
expenses) plus a contribution to amortize the Unfunded Actuarial Liability (UAL). At a special
meeting held on September 5, 2014, the Board of Retirement adopted a new funding policy for
any subsequent unexpected change in the Unfunded Actuarial Liability after June 30, 2013.
Effective with the June 30, 2014 valuation, any new sources of UAL due to actuarial gains and
losses, assumption changes, or method changes are amortized over a closed 19-year period, with
a five-year ramp up and down of the amortization payment at the beginning and end of the
amortization period and nine years of level payments as a percentage of payroll between the
ramping periods. The Board also adopted a policy to replace the smoothed Actuarial Value of
Assets with the Market Value of Assets for valuation purposes. These new amortization and
funding policies in conjunction are a type of policy known as direct rate smoothing.
The funding objective of the Plan is to accumulate sufficient assets over each Member’s working
life to provide for Plan benefits after termination of employment or retirement. For actuarial
valuation purposes beginning June 30, 2014, Plan assets are valued at market value. Prior
valuations measured the assets using a smoothed Actuarial Value, wherein the assets used to
determine employer contribution rates took into account market value by spreading all
investment gains and losses (returns above or below expected returns) over a period of five
years, limited by a corridor that restrained the Actuarial Value to within 20% of the Market
Value of Assets. Beginning with the June 30, 2014 valuation, the smoothing on the contribution
rates occurs directly through the determination of the amortization payments as described above,
rather than using a smoothed asset value.
The Board of Retirement is responsible for establishing and maintaining the funding policy of
the Plan.
Santa Barbara County Employees’ Retirement System
December 5, 2016
Page 2
We prepared the following schedules, which we understand will be used in the Actuarial Section
of the CAFR, based on the June 30, 2015 actuarial valuation. All historical information prior to
the June 30, 2013 actuarial valuation shown in these schedules is based on information reported
by Milliman, who served as the Actuary prior to 2013.
Statement of Current Actuarial Assumptions and Methods
Change in Unfunded Actuarial Liability (Actuarial Analysis of Financial Experience)
Solvency Test
Schedule of Funding Progress
Summary of Plan Provisions
The following schedules are based on the June 30, 2016 actuarial valuation data.
Schedule of Active Member Valuation Data
Schedule of Retirees and Beneficiaries Added to and Removed from Retirement
Payroll
The assumptions used in this report reflect the results of an Experience Study performed by
Cheiron covering the period from July 1, 2010 through June 30, 2013, and adopted by the Board
on November 20, 2013. The assumptions used in the most recent valuation are intended to
produce results that, in the aggregate, reasonably approximate the anticipated future experience
of the Plan. The next experience analysis will cover the years through 2016.
We certify that the valuation was performed in accordance with generally accepted actuarial
principles and practices. In particular, the assumptions and methods used for funding purposes
meet the requirements of the Actuarial Standards of Practice, in particular Standards No. 4, 27,
35, and 44.
GASB 67/68 Report as of June 30, 2016
The purpose of GASB 67/68 Report as of June 30, 2016 is to provide accounting and financial
reporting information under GASB 67 for the Plan and under GASB 68 for the County of Santa
Barbara and other participating employers. This report is not appropriate for other purposes,
including the measurement of funding requirements for the Plan.
For financial reporting purposes, the Total Pension Liability is based on the June 30, 2015
actuarial valuation updated to the measurement date of June 30, 2016. There were no significant
events between the valuation date and the measurement date of which we are aware, so the
update procedures only include the addition of service cost and interest cost offset by actual
benefit payments.
Beginning of year measurements are based on the actuarial valuation as of June 30, 2015 updated
to the measurement date of June 30, 2016. The June 30, 2016 Total Pension Liability presented
in the GASB 67/68 Report was based upon the same data, plan provisions, actuarial methods and
assumptions as were used in the Actuarial Valuation Report as of June 30, 2015.

Santa Barbara County Employees’ Retirement System
December 5, 2016
Page 3
Please refer to our GASB 67 report as of June 30, 2016 for additional information related to the
financial reporting of the System. We prepared the following schedules for inclusion in the
Financial Section of the CAFR based on the June 30, 2016, GASB 67/68 Report:
Change in Net Pension Liability
Sensitivity of Net Pension Liability to Changes in Discount Rate
Schedule of Changes in Net Pension Liability and Related Ratios
Schedule of Employer Contributions
Notes to the Schedule of Employer Contribution
We certify that the report was performed in accordance with generally accepted actuarial
principles and practices. In particular, the assumptions and methods used for disclosure purposes
have been prepared in accordance with our understanding of generally accepted accounting
principles as promulgated by the GASB.
Disclaimers
In preparing our reports, we relied on information (some oral and some written) supplied by the
Plan. This information includes, but is not limited to, the plan provisions, employee data, and
financial information. We performed an informal examination of the obvious characteristics of
the data for reasonableness and consistency in accordance with Actuarial Standard of Practice
No. 23.
Future actuarial measurements may differ significantly from the current measurements due to
such factors as the following: plan experience differing from that anticipated by the economic or
demographic assumptions; changes in economic or demographic assumptions; and, changes in
plan provisions or applicable law.
These reports are for the use of the Plan, the participating employers, and their auditors in
preparing financial reports in accordance with applicable law and accounting requirements. Any
other user of these reports is not an intended user and is considered a third party.
Cheiron’s reports were prepared solely for the Plan for the purposes described herein, except that
the Plan and participating employers’ auditors may rely on these reports solely for the purpose of
completing an audit related to the matters herein. They are not intended to benefit any third
party, and Cheiron assumes no duty or liability to any such party.
We are members of the American Academy of Actuaries and meet the Qualification Standards to
render the actuarial opinion contained herein. These reports do not address any contractual or
legal issues. We are not attorneys, and our firm does not provide any legal services or advice.
Santa Barbara County Employees’ Retirement System
December 5, 2016
Page 4
Respectfully Submitted,
Graham A. Schmidt, ASA, EA, FCA, MAAA Anne D. Harper, FSA, EA, MAAA
Consulting Actuary Consulting Actuary
703-893-1456 x1137 703-893-1456 x1107


87
SUMMARY OF ACTUARIAL ASSUMPTIONS AND METHODS
ACTUARIAL ASSUMPTIONS AND METHODS
Recommended by the actuary and adopted by the Board of Retirement (the Board), the actuarial assumptions used to determine the liabilities are based on the results of the June 30, 2013 Experience Study. The Board adopted the new assumptions on November 20, 2013. The total pension liability at June 30, 2016, was determined by completing a roll‐forward calculation based on an actuarial valuation conducted as of June 30, 2015, using the actuarial assumptions from that valuation applied to all prior periods included in the measurement in accordance with the requirements of Governmental Accounting Standards Board (GASB) Statement No. 67 (GASB 67). All actuarial methods and assumptions used for this GASB analysis were the same as those used for the June 30, 2015 funding valuation. The actuarial methods and assumptions for Other Post Employment Benefits (OPEB) can be found in the Notes to the Financial Statements.
ACTUARIAL COST METHOD
SBCERS uses the entry age normal actuarial cost method, with the total normal cost based on the sum of the normal costs for each individual active member (adopted November 20, 2013). The Unfunded Actuarial Accrued Liability (UAAL), if any, is amortized as a level of percentage of the projected salaries of present and future members of Santa Barbara County Employees Retirement System (SBCERS) over specified fixed periods of time. The Board of Retirement adopted a layered 19 year amortization with direct rate smoothing during its June 30, 2014 valuation which remains in effect for June 30, 2015, and June 30, 2016. The UAAL for periods prior to June 30, 2014 is being amortized as a single layer and funded over a “closed” 17 year period effective beginning the June 30, 2013 valuation (adopted November 20, 2013). The exception is that the additional UAAL attributable to the creation of Safety Plan 6 which is being amortized over a closed period and that period was 14 years as of the June 30, 2014 valuation. The amortization factors will change each year as the amortization periods decline, and will also change when the discount rate or salary assumptions are changed. Because the discount rate (investment return) and salary scale did change from prior valuation due to the Investigation of Experience, the amortization factors have changed from the previous valuation.
ACTUARIAL ASSET VALUATION METHOD
Effective with the June 30, 2014 valuation, the assets are valued at fair value. Prior to the June 30, 2014 valuation, assets were valued using a five year smoothing method based on the difference between expected and actual fair value of assets.
AMORTIZATION OF GAINS AND LOSSES
Actuarial gains and losses reflected in the current UAAL are amortized over a closed seventeen year period effective June 30, 2013 (adopted November 20, 2013). Effective with the June 30, 2014 valuation any new sources of UAAL due to actuarial gains and losses, assumption changes or method changes is amortized over a closed 19 year period, with five year ramp up period at the beginning of the period, a four year ramp down at the end of the period and 10 years of level payments as a percentage of payroll. This new method is a type of direct rate smoothing.
88
INVESTMENT RATE OF RETURN
Future investment earnings are assumed to accrue at an annual rate of 7.50%, compounded annually, exclusive of both investment, but not administrative, expenses effective June 30, 2013 (adopted November 20, 2013). The investment rate of return of 7.50% is comprised of 3.00% for Consumer Price Index (CPI) and 4.50% real investment return.
ADMINISTRATIVE EXPENSES
Beginning with the June 30, 2013 actuarial valuation, the cost of expected administrative expenses are reflected directly in the employer and employee contribution rates, rather than being implicitly allocated based on a discount rate net of administrative expenses. For the June 30, 2014 actuarial valuation, a load of 3.1% has been applied to the employer and employee contribution rates, based on an assumed administrative expense amount of $ 4.25 million for the current Plan year.
PROJECTED SALARY INCREASES
Rates of annual salary increases (adopted November 20, 2013) assumed for the purpose of the valuation are:
Variable percentage annually for merit and longevity based on service (duration) and
3.50% for inflation (cost‐of‐living adjustments – comprised of 3.00% for consumer price inflation and 0.5% for real wage inflation)
POST‐RETIREMENT BENEFIT INCREASES
Cost‐of‐Living benefit increases of 2.75% per year are assumed for the valuation in accordance with the maximum benefits provided for General Plan 5, Safety Plan 4, Safety Plan 6, Safety Plan 8 Public Employee’ Pension Reform Act (PEPRA) and Air Pollution Control District (APCD) Plans 1 and 2 (adopted November 20, 2013).
General Plan 7, General Plan 8 (PEPRA) and APCD Plan 8 (PEPRA) are limited to a maximum 2.0% cost of living adjustment.
General Plan 2 is not eligible to receive these adjustments (adopted February 21, 2001).
EXPECTATION OF LIFE AFTER RETIREMENT
RP‐2000 Combined Healthy Mortality Table, Projected using generational improvements based on Scale BB, with no set back or forward for any members (adopted November 20, 2013):
Note: No set back means that the table is used as published. When the table is set forward one year, the member’s life expectancy is that of someone one year older. When the table is set back one year, the member’s life expectancy is that of someone one year younger.

89
EXPECTATION OF LIFE AFTER DISABILITY
RP‐2000 Combined Healthy Mortality Table, Projected using generational improvements based on Scale BB (adopted November 20, 2013):
For male members, set forward five years
For female members, set forward five years
Note: No set back means that the table is used as published. When the table is set forward one year, the member’s life expectancy is that of someone one year older. When the table is set back one year, the member’s life expectancy is that of someone one year younger.
MORTALITY TABLES IMPACT ON EMPLOYEE CONTRIBUTION RATES
Member contribution rates will be based on the following sex distinct mortality tables adjusted by ages and used regardless of gender:
RP‐2000 Combined Mortality Table Projected to 2037 Using Scale BB assumptions (adopted November 20, 2013):
For General members, a blending of 35% of the Male table and 65% of the Female table
For Safety members, a blending of 80% of the Male table and 20% of the Female table
Note: No set back means that the table is used as published. When the table is set forward one year, the member’s life expectancy is that of someone one year older. When the table is set back one year, the member’s life expectancy is that of someone one year younger.
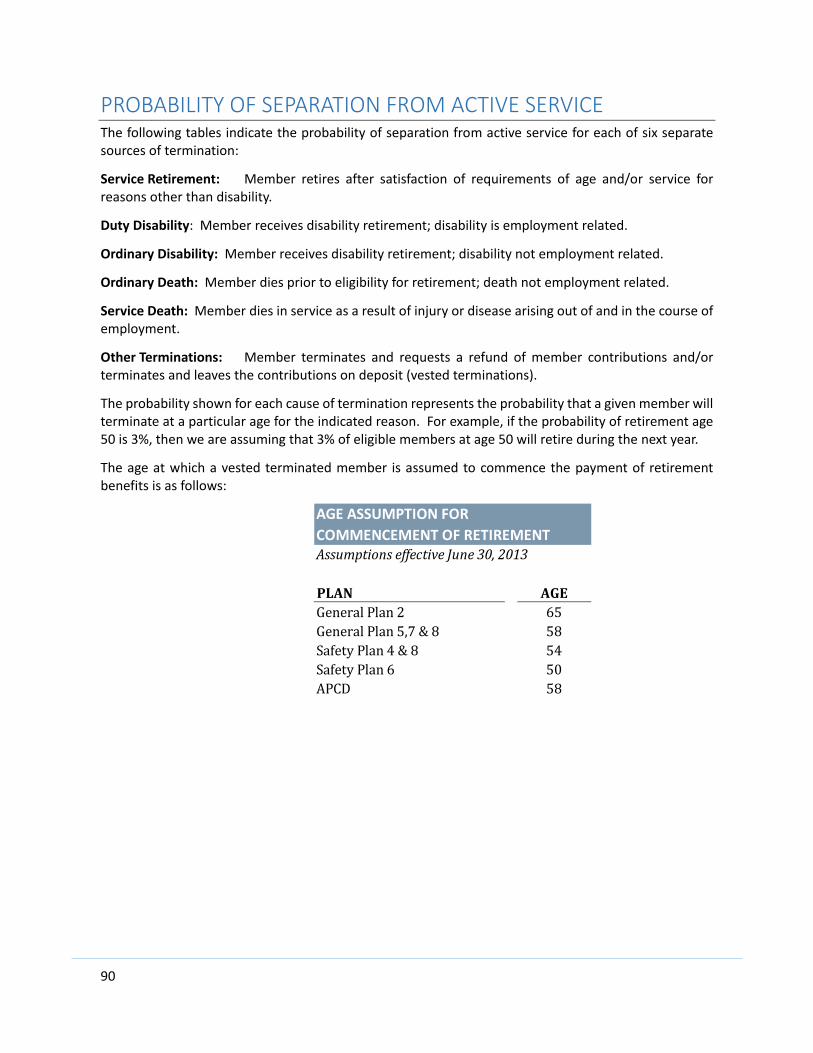
90
PROBABILITY OF SEPARATION FROM ACTIVE SERVICE The following tables indicate the probability of separation from active service for each of six separate sources of termination:
Service Retirement: Member retires after satisfaction of requirements of age and/or service for reasons other than disability.
Duty Disability: Member receives disability retirement; disability is employment related.
Ordinary Disability: Member receives disability retirement; disability not employment related.
Ordinary Death: Member dies prior to eligibility for retirement; death not employment related.
Service Death: Member dies in service as a result of injury or disease arising out of and in the course of employment.
Other Terminations: Member terminates and requests a refund of member contributions and/or terminates and leaves the contributions on deposit (vested terminations).
The probability shown for each cause of termination represents the probability that a given member will terminate at a particular age for the indicated reason. For example, if the probability of retirement age 50 is 3%, then we are assuming that 3% of eligible members at age 50 will retire during the next year.
The age at which a vested terminated member is assumed to commence the payment of retirement benefits is as follows:
AssumptionseffectiveJune30,2013
PLAN AGEGeneralPlan2 65GeneralPlan5,7&8 58SafetyPlan4&8 54SafetyPlan6 50APCD 58
AGE ASSUMPTION FOR
COMMENCEMENT OF RETIREMENT
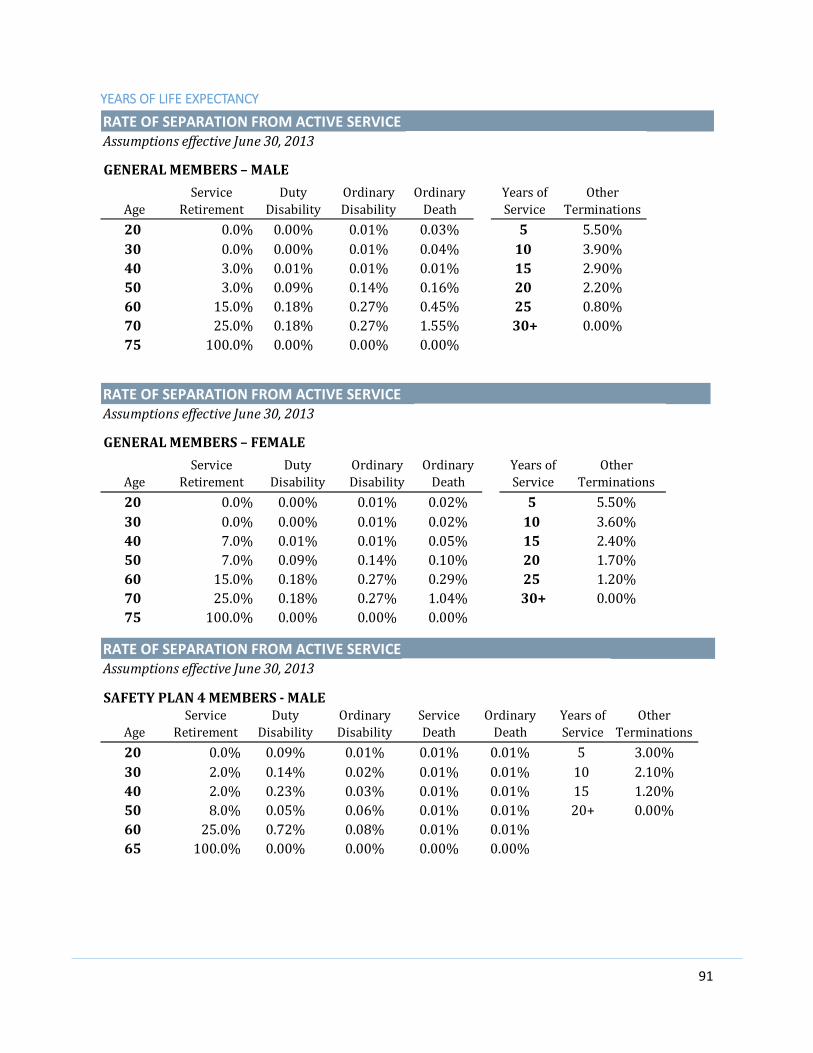
91
YEARS OF LIFE EXPECTANCY
RATE OF SEPARATION FROM ACTIVE SERVICEAssumptionseffectiveJune30,2013
AgeService
RetirementDuty
DisabilityOrdinaryDisability
OrdinaryDeath
YearsofService
OtherTerminations
20 0.0% 0.00% 0.01% 0.03% 5 5.50%30 0.0% 0.00% 0.01% 0.04% 10 3.90%40 3.0% 0.01% 0.01% 0.01% 15 2.90%50 3.0% 0.09% 0.14% 0.16% 20 2.20%60 15.0% 0.18% 0.27% 0.45% 25 0.80%70 25.0% 0.18% 0.27% 1.55% 30+ 0.00%75 100.0% 0.00% 0.00% 0.00%
GENERALMEMBERS–MALE
RATE OF SEPARATION FROM ACTIVE SERVICEAssumptionseffectiveJune30,2013
AgeService
RetirementDuty
DisabilityOrdinaryDisability
OrdinaryDeath
YearsofService
OtherTerminations
20 0.0% 0.00% 0.01% 0.02% 5 5.50%30 0.0% 0.00% 0.01% 0.02% 10 3.60%40 7.0% 0.01% 0.01% 0.05% 15 2.40%50 7.0% 0.09% 0.14% 0.10% 20 1.70%60 15.0% 0.18% 0.27% 0.29% 25 1.20%70 25.0% 0.18% 0.27% 1.04% 30+ 0.00%75 100.0% 0.00% 0.00% 0.00%
GENERALMEMBERS–FEMALE
RATE OF SEPARATION FROM ACTIVE SERVICEAssumptionseffectiveJune30,2013
SAFETYPLAN4MEMBERS‐MALE
AgeService
RetirementDuty
DisabilityOrdinaryDisability
ServiceDeath
OrdinaryDeath
YearsofService
OtherTerminations
20 0.0% 0.09% 0.01% 0.01% 0.01% 5 3.00%30 2.0% 0.14% 0.02% 0.01% 0.01% 10 2.10%40 2.0% 0.23% 0.03% 0.01% 0.01% 15 1.20%50 8.0% 0.05% 0.06% 0.01% 0.01% 20+ 0.00%60 25.0% 0.72% 0.08% 0.01% 0.01% 65 100.0% 0.00% 0.00% 0.00% 0.00%
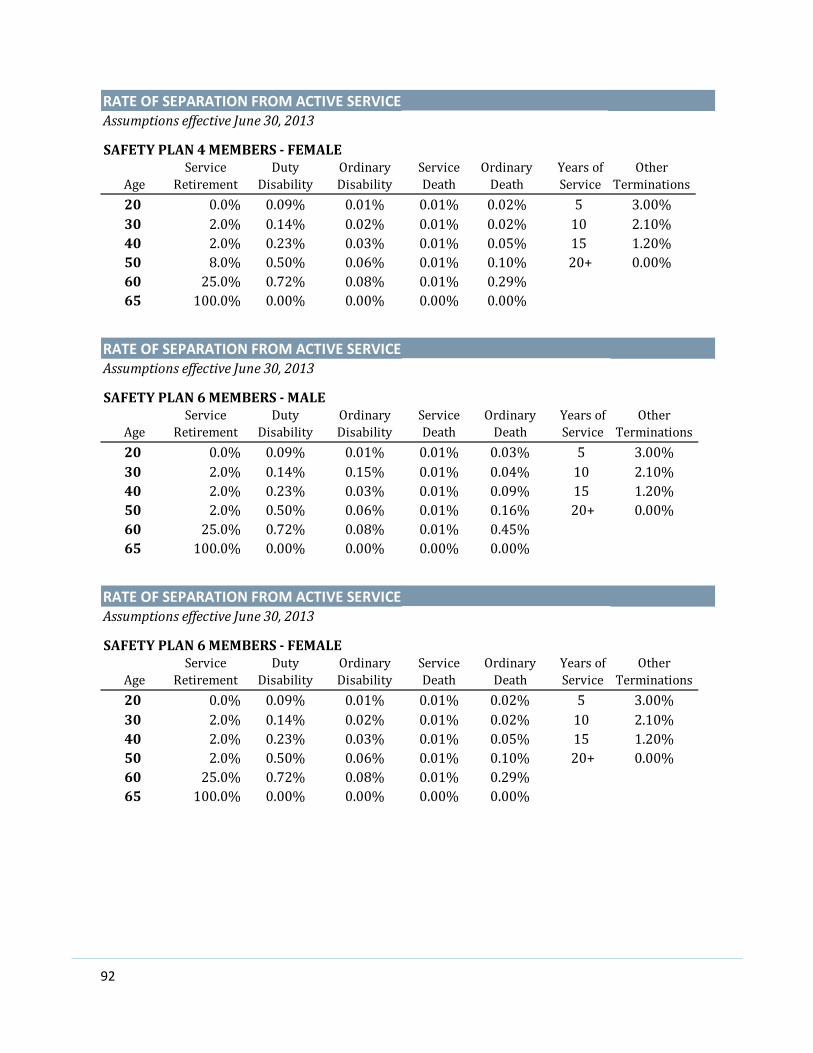
92
RATE OF SEPARATION FROM ACTIVE SERVICEAssumptionseffectiveJune30,2013
SAFETYPLAN4MEMBERS‐FEMALE
AgeService
RetirementDuty
DisabilityOrdinaryDisability
ServiceDeath
OrdinaryDeath
YearsofService
OtherTerminations
20 0.0% 0.09% 0.01% 0.01% 0.02% 5 3.00%30 2.0% 0.14% 0.02% 0.01% 0.02% 10 2.10%40 2.0% 0.23% 0.03% 0.01% 0.05% 15 1.20%50 8.0% 0.50% 0.06% 0.01% 0.10% 20+ 0.00%60 25.0% 0.72% 0.08% 0.01% 0.29% 65 100.0% 0.00% 0.00% 0.00% 0.00%
RATE OF SEPARATION FROM ACTIVE SERVICEAssumptionseffectiveJune30,2013
SAFETYPLAN6MEMBERS‐MALE
AgeService
RetirementDuty
DisabilityOrdinaryDisability
ServiceDeath
OrdinaryDeath
YearsofService
OtherTerminations
20 0.0% 0.09% 0.01% 0.01% 0.03% 5 3.00%30 2.0% 0.14% 0.15% 0.01% 0.04% 10 2.10%40 2.0% 0.23% 0.03% 0.01% 0.09% 15 1.20%50 2.0% 0.50% 0.06% 0.01% 0.16% 20+ 0.00%60 25.0% 0.72% 0.08% 0.01% 0.45% 65 100.0% 0.00% 0.00% 0.00% 0.00%
RATE OF SEPARATION FROM ACTIVE SERVICEAssumptionseffectiveJune30,2013
SAFETYPLAN6MEMBERS‐FEMALE
AgeService
RetirementDuty
DisabilityOrdinaryDisability
ServiceDeath
OrdinaryDeath
YearsofService
OtherTerminations
20 0.0% 0.09% 0.01% 0.01% 0.02% 5 3.00%30 2.0% 0.14% 0.02% 0.01% 0.02% 10 2.10%40 2.0% 0.23% 0.03% 0.01% 0.05% 15 1.20%50 2.0% 0.50% 0.06% 0.01% 0.10% 20+ 0.00%60 25.0% 0.72% 0.08% 0.01% 0.29% 65 100.0% 0.00% 0.00% 0.00% 0.00%

93
MORTALITY FOR MEMBERS ‐ RETIRED FOR SERVICEAssumptionseffectiveJune30,2013(fortheyear2013)
Age Male Female Male Female20 0.03% 0.02% 0.03% 0.02%25 0.03% 0.02% 0.03% 0.02%30 0.04% 0.02% 0.04% 0.02%35 0.06% 0.03% 0.06% 0.03%40 0.09% 0.05% 0.09% 0.05%45 0.12% 0.07% 0.12% 0.07%50 0.16% 0.10% 0.16% 0.10%55 0.24% 0.16% 0.24% 0.16%60 0.45% 0.29% 0.45% 0.29%65 0.87% 0.55% 0.87% 0.55%70 1.55% 1.04% 1.55% 1.04%75 2.61% 1.75% 2.61% 1.75%80 4.62% 2.86% 4.62% 2.86%85 8.28% 4.73% 8.28% 4.73%90 14.32% 8.22% 14.32% 8.22%
GENERAL SAFETY

94
MORTALITY FOR MEMBERS ‐ RETIRED FOR DISABILITYAssumptionseffectiveJune30,2013(fortheyear2013)
Age Male Female Male Female20 0.03% 0.02% 0.03% 0.02%25 0.03% 0.02% 0.03% 0.02%30 0.04% 0.02% 0.04% 0.02%35 0.07% 0.04% 0.07% 0.04%40 0.10% 0.06% 0.10% 0.06%45 0.13% 0.10% 0.13% 0.10%50 0.18% 0.14% 0.18% 0.14%55 0.30% 0.25% 0.30% 0.25%60 0.57% 0.48% 0.57% 0.48%65 1.11% 0.92% 1.11% 0.92%70 1.91% 1.59% 1.91% 1.59%75 3.29% 2.59% 3.29% 2.59%80 5.82% 4.28% 5.82% 4.28%85 10.32% 7.29% 10.32% 7.29%90 17.62% 12.78% 17.62% 12.78%
GENERAL SAFETY

95
SALARY INCREASE ASSUMPTIONS
SALARY INCREASE ASSUMPTIONSAssumptionseffectiveJune30,2013
GENERALMEMBERS
YearsofService
DuetoPromotion&Longevity
TotalAnnualIncrease
YearsofService
DuetoPromotion&Longevity
TotalAnnualIncrease
<1 4.75% 8.68% 16 0.50% 4.27%1 4.00% 7.90% 17 0.48% 4.25%2 3.25% 7.12% 18 0.46% 4.23%3 2.50% 6.34% 19 0.44% 4.21%4 2.00% 5.83% 20 0.42% 4.19%5 1.50% 5.31% 21 0.40% 4.16%6 1.25% 5.05% 22 0.38% 4.14%7 1.00% 4.79% 23 0.36% 4.12%8 0.90% 4.68% 24 0.34% 4.10%9 0.80% 4.58% 25 0.32% 4.08%10 0.78% 4.55% 26 0.30% 4.06%11 0.75% 4.53% 27 0.28% 4.04%12 0.70% 4.48% 28 0.26% 4.02%13 0.65% 4.42% 29 0.25% 4.01%14 0.60% 4.37% 30+ 0.25% 4.01%15 0.55% 4.32%
Thetotalexpectedincreaseinsalaryistheincreaseduetopromotionsandlongevity,adjustedforanassumed3.50%perannumincreaseinthegeneralwagelevelofthemembership.Thetotalresultiscompoundedratherthanadditive.
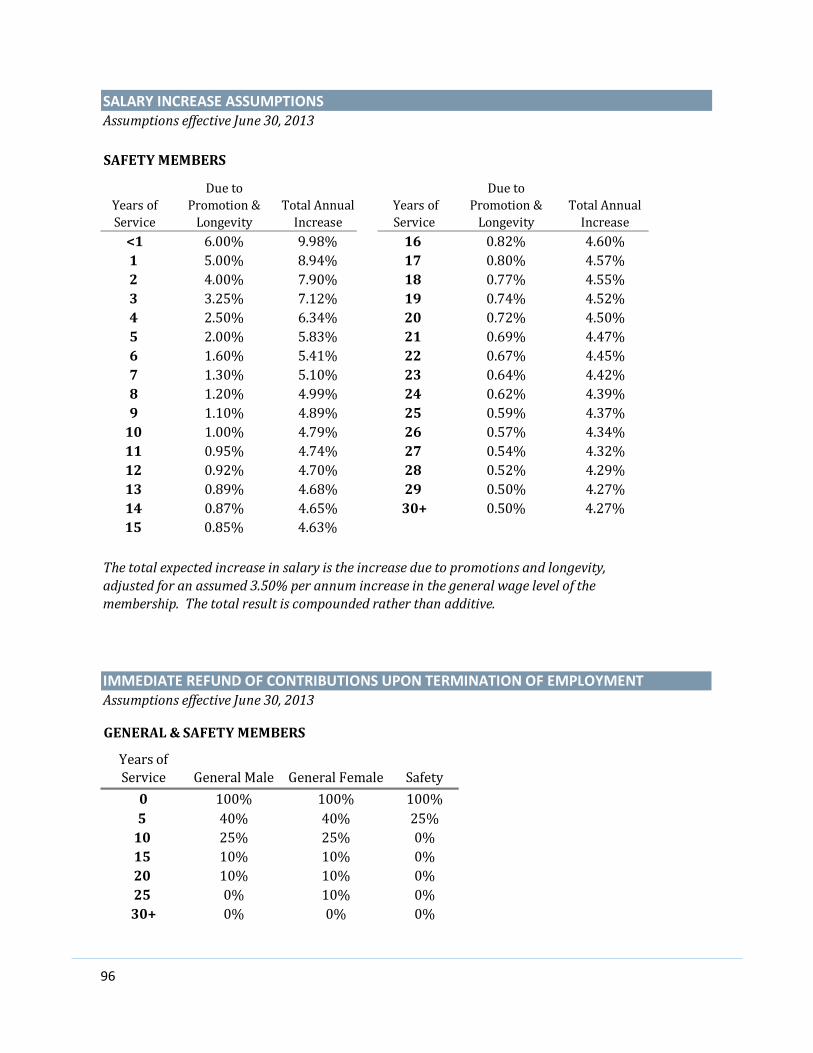
96
SALARY INCREASE ASSUMPTIONSAssumptionseffectiveJune30,2013
SAFETYMEMBERS
YearsofService
DuetoPromotion&Longevity
TotalAnnualIncrease
YearsofService
DuetoPromotion&Longevity
TotalAnnualIncrease
<1 6.00% 9.98% 16 0.82% 4.60%1 5.00% 8.94% 17 0.80% 4.57%2 4.00% 7.90% 18 0.77% 4.55%3 3.25% 7.12% 19 0.74% 4.52%4 2.50% 6.34% 20 0.72% 4.50%5 2.00% 5.83% 21 0.69% 4.47%6 1.60% 5.41% 22 0.67% 4.45%7 1.30% 5.10% 23 0.64% 4.42%8 1.20% 4.99% 24 0.62% 4.39%9 1.10% 4.89% 25 0.59% 4.37%10 1.00% 4.79% 26 0.57% 4.34%11 0.95% 4.74% 27 0.54% 4.32%12 0.92% 4.70% 28 0.52% 4.29%13 0.89% 4.68% 29 0.50% 4.27%14 0.87% 4.65% 30+ 0.50% 4.27%15 0.85% 4.63%
Thetotalexpectedincreaseinsalaryistheincreaseduetopromotionsandlongevity,adjustedforanassumed3.50%perannumincreaseinthegeneralwagelevelofthemembership.Thetotalresultiscompoundedratherthanadditive.
AssumptionseffectiveJune30,2013
YearsofService GeneralMale GeneralFemale Safety
0 100% 100% 100%5 40% 40% 25%10 25% 25% 0%15 10% 10% 0%20 10% 10% 0%25 0% 10% 0%30+ 0% 0% 0%
GENERAL&SAFETYMEMBERS
IMMEDIATE REFUND OF CONTRIBUTIONS UPON TERMINATION OF EMPLOYMENT
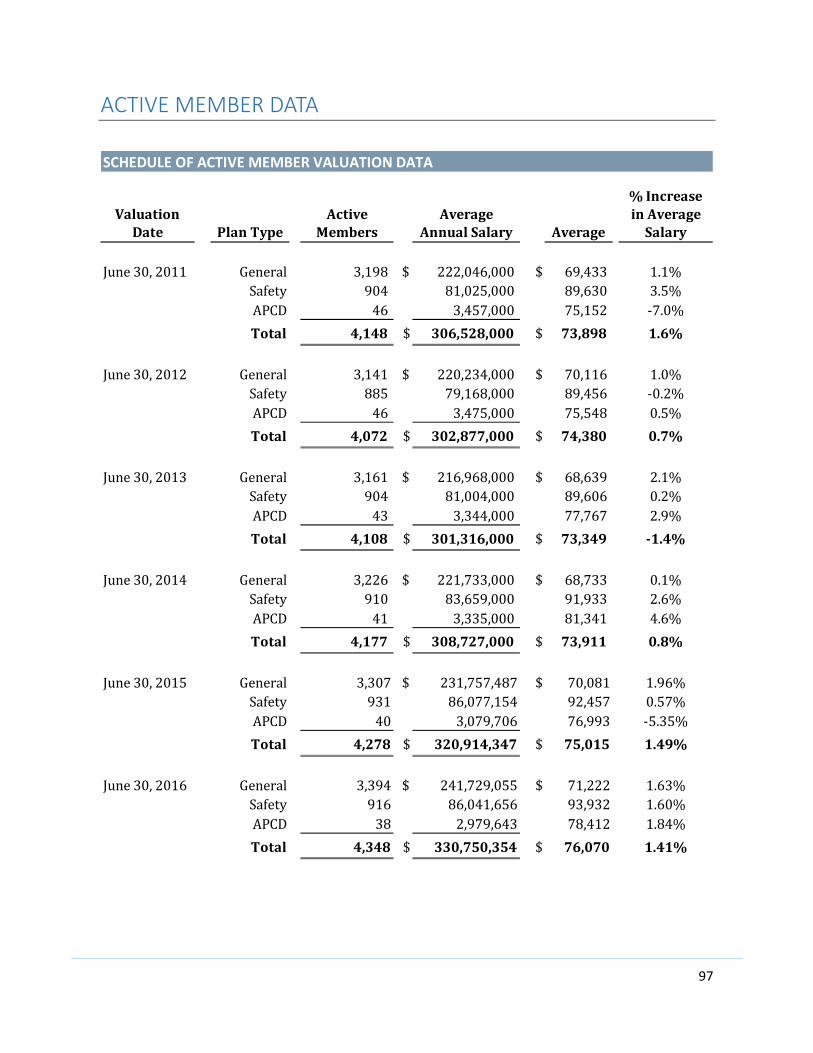
97
ACTIVE MEMBER DATA
SCHEDULE OF ACTIVE MEMBER VALUATION DATA
June30,2011 General 3,198 $ 222,046,000 $ 69,433 1.1%
Safety 904 81,025,000 89,630 3.5% APCD 46 3,457,000 75,152 ‐7.0%
Total 4,148 $ 306,528,000 $ 73,898 1.6%
June30,2012 General 3,141 $ 220,234,000 $ 70,116 1.0%
Safety 885 79,168,000 89,456 ‐0.2% APCD 46 3,475,000 75,548 0.5%
Total 4,072 $ 302,877,000 $ 74,380 0.7%
June30,2013 General 3,161 $ 216,968,000 $ 68,639 2.1%
Safety 904 81,004,000 89,606 0.2% APCD 43 3,344,000 77,767 2.9%
Total 4,108 $ 301,316,000 $ 73,349 ‐1.4%
June30,2014 General 3,226 $ 221,733,000 $ 68,733 0.1%
Safety 910 83,659,000 91,933 2.6% APCD 41 3,335,000 81,341 4.6%
Total 4,177 $ 308,727,000 $ 73,911 0.8%
June30,2015 General 3,307 $ 231,757,487 $ 70,081 1.96% Safety 931 86,077,154 92,457 0.57% APCD 40 3,079,706 76,993 ‐5.35%
Total 4,278 $ 320,914,347 $ 75,015 1.49%
June30,2016 General 3,394 $ 241,729,055 $ 71,222 1.63% Safety 916 86,041,656 93,932 1.60% APCD 38 2,979,643 78,412 1.84%
Total 4,348 $ 330,750,354 $ 76,070 1.41%
Average
%IncreaseinAverageSalary
ValuationDate PlanType
ActiveMembers
AverageAnnualSalary
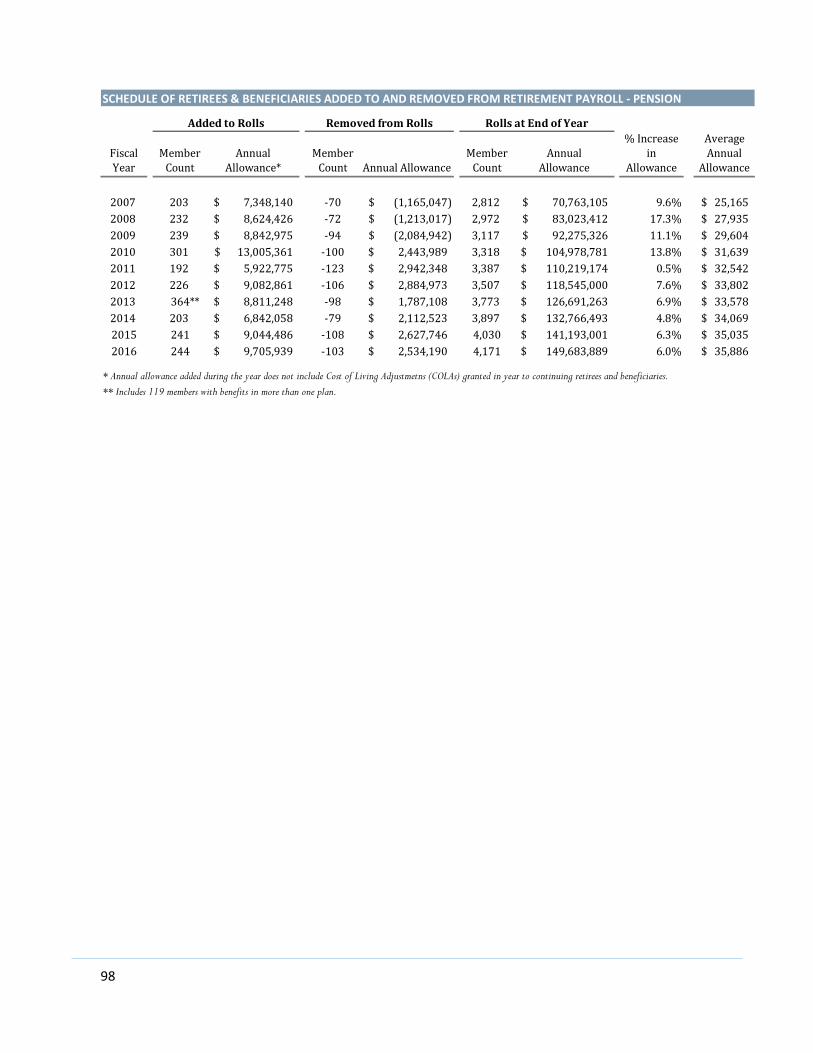
98
FiscalYear
MemberCount
AnnualAllowance*
MemberCount AnnualAllowance
MemberCount
AnnualAllowance
%Increasein
Allowance
AverageAnnual
Allowance
2007 203 7,348,140$ ‐70 (1,165,047)$ 2,812 70,763,105$ 9.6% 25,165$2008 232 8,624,426$ ‐72 (1,213,017)$ 2,972 83,023,412$ 17.3% 27,935$2009 239 8,842,975$ ‐94 (2,084,942)$ 3,117 92,275,326$ 11.1% 29,604$2010 301 13,005,361$ ‐100 2,443,989$ 3,318 104,978,781$ 13.8% 31,639$2011 192 5,922,775$ ‐123 2,942,348$ 3,387 110,219,174$ 0.5% 32,542$2012 226 9,082,861$ ‐106 2,884,973$ 3,507 118,545,000$ 7.6% 33,802$2013 364** 8,811,248$ ‐98 1,787,108$ 3,773 126,691,263$ 6.9% 33,578$2014 203 6,842,058$ ‐79 2,112,523$ 3,897 132,766,493$ 4.8% 34,069$2015 241 9,044,486$ ‐108 2,627,746$ 4,030 141,193,001$ 6.3% 35,035$2016 244 9,705,939$ ‐103 2,534,190$ 4,171 149,683,889$ 6.0% 35,886$
SCHEDULE OF RETIREES & BENEFICIARIES ADDED TO AND REMOVED FROM RETIREMENT PAYROLL ‐ PENSION
AddedtoRolls RemovedfromRolls RollsatEndofYear
* Annual allowance added during the year does not include Cost of Living Adjustmetns (COLAs) granted in year to continuing retirees and beneficiaries.
** Includes 119 members with benefits in more than one plan.
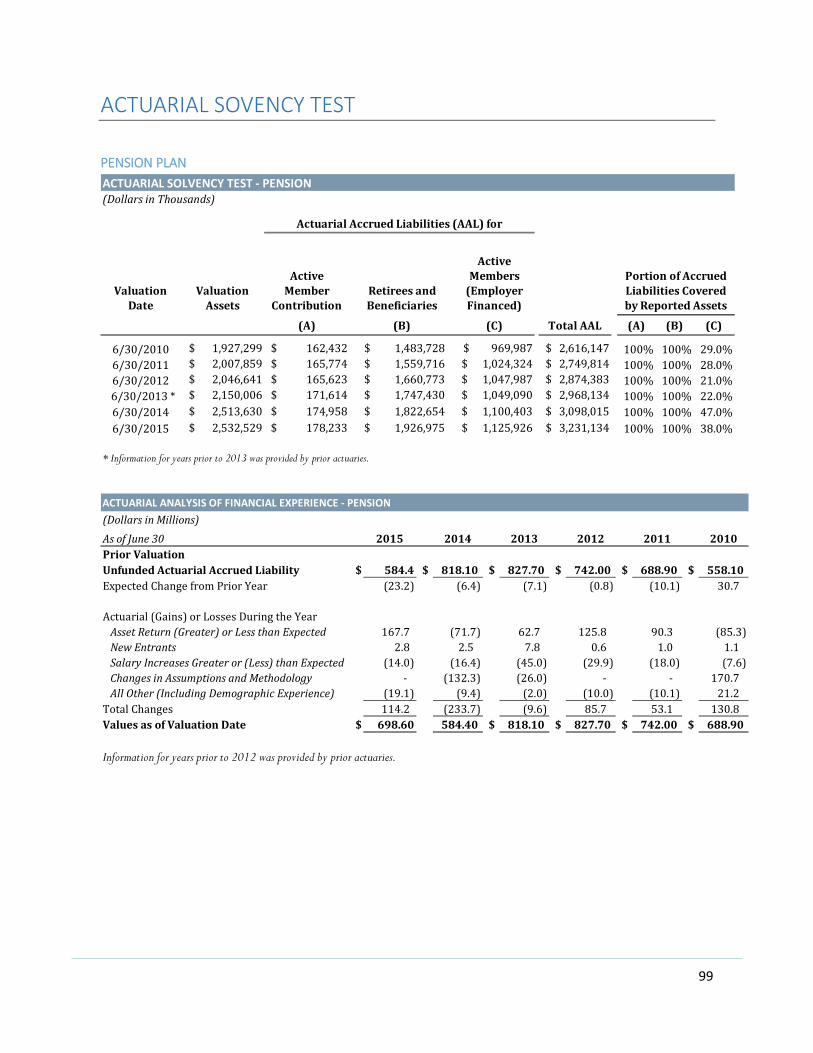
99
ACTUARIAL SOVENCY TEST
PENSION PLAN
ValuationDate
ValuationAssets
ActiveMember
Contribution RetireesandBeneficiaries
ActiveMembers(EmployerFinanced)
PortionofAccruedLiabilitiesCoveredbyReportedAssets
(A) (B) (C) TotalAAL (A) (B) (C)
6/30/2010 $1,927,299 $162,432 $1,483,728 $969,987 $2,616,147 100% 100% 29.0%6/30/2011 $2,007,859 $165,774 $1,559,716 $1,024,324 $2,749,814 100% 100% 28.0%6/30/2012 $2,046,641 $165,623 $1,660,773 $1,047,987 $2,874,383 100% 100% 21.0%6/30/2013* $2,150,006 $171,614 $1,747,430 $1,049,090 $2,968,134 100% 100% 22.0%6/30/2014 $2,513,630 $174,958 $1,822,654 $1,100,403 $3,098,015 100% 100% 47.0%6/30/2015 $2,532,529 $178,233 $1,926,975 $1,125,926 $3,231,134 100% 100% 38.0%
* Information for years prior to 2013 was provided by prior actuaries.
ACTUARIAL SOLVENCY TEST ‐ PENSION(DollarsinThousands)
ActuarialAccruedLiabilities(AAL)for
(DollarsinMillions)
AsofJune30 2015 2014 2013 2012 2011 2010PriorValuation UnfundedActuarialAccruedLiability $ 584.4 $ 818.10 $ 827.70 $ 742.00 $ 688.90 $ 558.10ExpectedChangefromPriorYear (23.2) (6.4) (7.1) (0.8) (10.1) 30.7 Actuarial(Gains)orLossesDuringtheYear AssetReturn(Greater)orLessthanExpected 167.7 (71.7) 62.7 125.8 90.3 (85.3)NewEntrants 2.8 2.5 7.8 0.6 1.0 1.1SalaryIncreasesGreateror(Less)thanExpected (14.0) (16.4) (45.0) (29.9) (18.0) (7.6)ChangesinAssumptionsandMethodology ‐ (132.3) (26.0) ‐ ‐ 170.7AllOther(IncludingDemographicExperience) (19.1) (9.4) (2.0) (10.0) (10.1) 21.2TotalChanges 114.2 (233.7) (9.6) 85.7 53.1 130.8ValuesasofValuationDate $ 698.60 584.40 $ 818.10 $ 827.70 $ 742.00 $ 688.90 Information for years prior to 2012 was provided by prior actuaries.
ACTUARIAL ANALYSIS OF FINANCIAL EXPERIENCE ‐ PENSION

100
ValuationDate
ActiveMemberContribution
RetireesandBeneficiaries
RemainingMembers'Liabilities
PortionofAccrued
LiabilitiesCoveredbyReportedAssets
(A) (B) (C)ReportedAssets
(A) (B) (C)
6/30/2012 N/A $119,488 $70,691 $3,035 N/A 3% 0.0%6/30/2014* N/A $121,241 $71,964 $4,070 N/A 3% 0.0%
* Information for years prior to 2014 was provided by prior actuaries.
(DollarsinThousands)ACTUARIAL SOLVENCY TEST ‐ OPEB
(DollarsinMillions)
AsofJune30 2014 PriorValuation UnfundedActuarialAccruedLiability $ 187.1 ExpectedChangefromPriorYear (25.7) Actuarial(Gains)orLossesDuringtheYear AssetReturn(Greater)orLessthanExpected 0.6 ShortfallinContributionvs.ARC 34.8 ChangesinAssumptionsandMethodology (10.7) AllOther(IncludingDemographicExperience) 3.0 TotalChanges 2.0 ValuesasofValuationDate $ 189.1
ACTUARIAL ANALYSIS OF FINANCIAL EXPERIENCE ‐ OPEB

101
SCHEDULE OF RETIREES & BENEFICIARIES ADDED TO & REMOVED FROM ROLL ‐ OPEB
July1,2012 June30,2014%
Change
ActiveEmployees*MemberCount 4,063.00 3,707.00 ‐8.76%AverageAge 45.80 46.80 2.18%AverageService 12.00 13.80 15.00%TotalPayroll 302,378,528$ 282,962,944$ ‐6.42%
TerminatedVestedParticipantsCount 878 890 1.37%AverageAge 48.1 48.5 0.83%
InactiveParticipantsRetiredParticipantsCount 2,767 3,246 17.31%AverageAge 69.1 69.2 0.14%
DisabledParticipantsCount 238 240 0.84%AverageAge 65.3 65.5 0.31%
SurvivingSpousesCount 358 408 13.97%AverageAge 74.8 74.6 ‐0.27%
TotalCountofInactiveParticipants 3,363 3,894 15.79%
* Active census and salary information includes only those eligible for the OPEB benefit, and as a result
will not match the SBCERS pension census information for the same period.
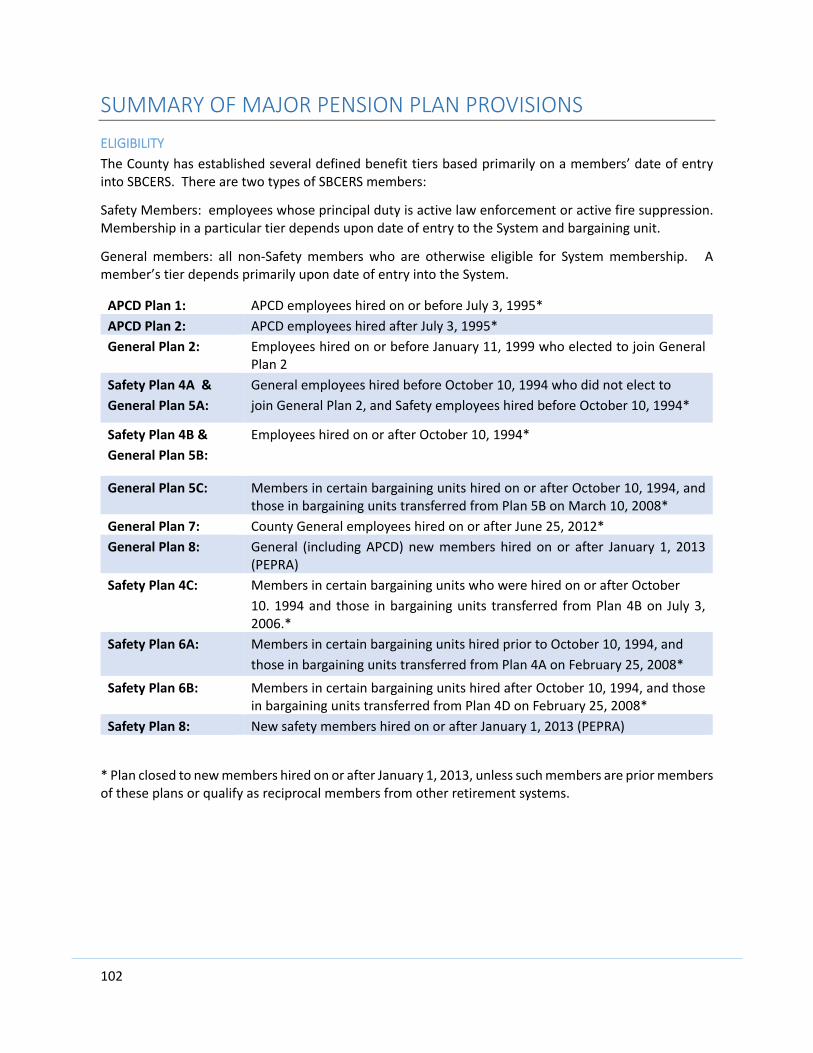
102
SUMMARY OF MAJOR PENSION PLAN PROVISIONS
ELIGIBILITY
The County has established several defined benefit tiers based primarily on a members’ date of entry into SBCERS. There are two types of SBCERS members:
Safety Members: employees whose principal duty is active law enforcement or active fire suppression. Membership in a particular tier depends upon date of entry to the System and bargaining unit.
General members: all non‐Safety members who are otherwise eligible for System membership. A member’s tier depends primarily upon date of entry into the System.
APCD Plan 1: APCD employees hired on or before July 3, 1995*
APCD Plan 2: APCD employees hired after July 3, 1995*
General Plan 2: Employees hired on or before January 11, 1999 who elected to join General Plan 2
Safety Plan 4A &
General Plan 5A:
General employees hired before October 10, 1994 who did not elect to
join General Plan 2, and Safety employees hired before October 10, 1994*
Safety Plan 4B &
General Plan 5B:
Employees hired on or after October 10, 1994*
General Plan 5C: Members in certain bargaining units hired on or after October 10, 1994, and those in bargaining units transferred from Plan 5B on March 10, 2008*
General Plan 7: County General employees hired on or after June 25, 2012*
General Plan 8: General (including APCD) new members hired on or after January 1, 2013 (PEPRA)
Safety Plan 4C: Members in certain bargaining units who were hired on or after October
10. 1994 and those in bargaining units transferred from Plan 4B on July 3, 2006.*
Safety Plan 6A: Members in certain bargaining units hired prior to October 10, 1994, and
those in bargaining units transferred from Plan 4A on February 25, 2008*
Safety Plan 6B: Members in certain bargaining units hired after October 10, 1994, and those in bargaining units transferred from Plan 4D on February 25, 2008*
Safety Plan 8: New safety members hired on or after January 1, 2013 (PEPRA)
* Plan closed to new members hired on or after January 1, 2013, unless such members are prior members of these plans or qualify as reciprocal members from other retirement systems.
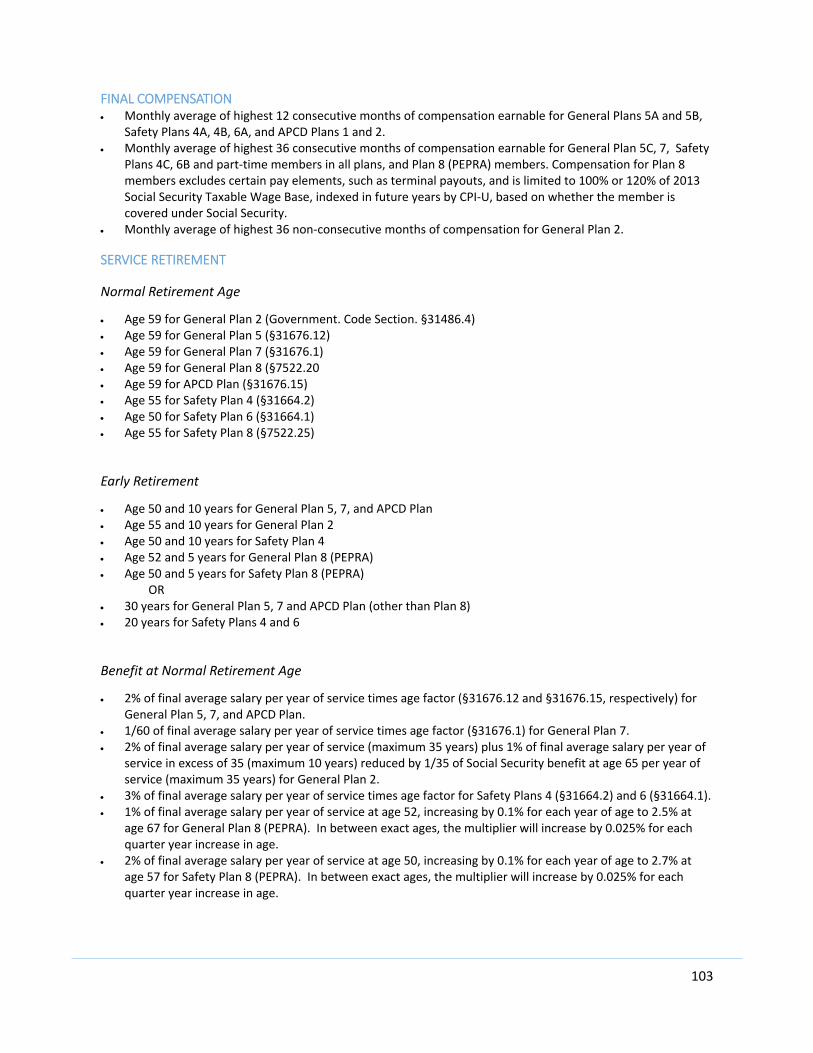
103
FINAL COMPENSATION Monthly average of highest 12 consecutive months of compensation earnable for General Plans 5A and 5B,
Safety Plans 4A, 4B, 6A, and APCD Plans 1 and 2. Monthly average of highest 36 consecutive months of compensation earnable for General Plan 5C, 7, Safety
Plans 4C, 6B and part‐time members in all plans, and Plan 8 (PEPRA) members. Compensation for Plan 8 members excludes certain pay elements, such as terminal payouts, and is limited to 100% or 120% of 2013 Social Security Taxable Wage Base, indexed in future years by CPI‐U, based on whether the member is covered under Social Security.
Monthly average of highest 36 non‐consecutive months of compensation for General Plan 2.
SERVICE RETIREMENT
Normal Retirement Age
Age 59 for General Plan 2 (Government. Code Section. §31486.4) Age 59 for General Plan 5 (§31676.12) Age 59 for General Plan 7 (§31676.1) Age 59 for General Plan 8 (§7522.20 Age 59 for APCD Plan (§31676.15) Age 55 for Safety Plan 4 (§31664.2) Age 50 for Safety Plan 6 (§31664.1) Age 55 for Safety Plan 8 (§7522.25)
Early Retirement
Age 50 and 10 years for General Plan 5, 7, and APCD Plan Age 55 and 10 years for General Plan 2 Age 50 and 10 years for Safety Plan 4 Age 52 and 5 years for General Plan 8 (PEPRA) Age 50 and 5 years for Safety Plan 8 (PEPRA)
OR 30 years for General Plan 5, 7 and APCD Plan (other than Plan 8) 20 years for Safety Plans 4 and 6
Benefit at Normal Retirement Age
2% of final average salary per year of service times age factor (§31676.12 and §31676.15, respectively) for General Plan 5, 7, and APCD Plan.
1/60 of final average salary per year of service times age factor (§31676.1) for General Plan 7. 2% of final average salary per year of service (maximum 35 years) plus 1% of final average salary per year of
service in excess of 35 (maximum 10 years) reduced by 1/35 of Social Security benefit at age 65 per year of service (maximum 35 years) for General Plan 2.
3% of final average salary per year of service times age factor for Safety Plans 4 (§31664.2) and 6 (§31664.1). 1% of final average salary per year of service at age 52, increasing by 0.1% for each year of age to 2.5% at
age 67 for General Plan 8 (PEPRA). In between exact ages, the multiplier will increase by 0.025% for each quarter year increase in age.
2% of final average salary per year of service at age 50, increasing by 0.1% for each year of age to 2.7% at age 57 for Safety Plan 8 (PEPRA). In between exact ages, the multiplier will increase by 0.025% for each quarter year increase in age.
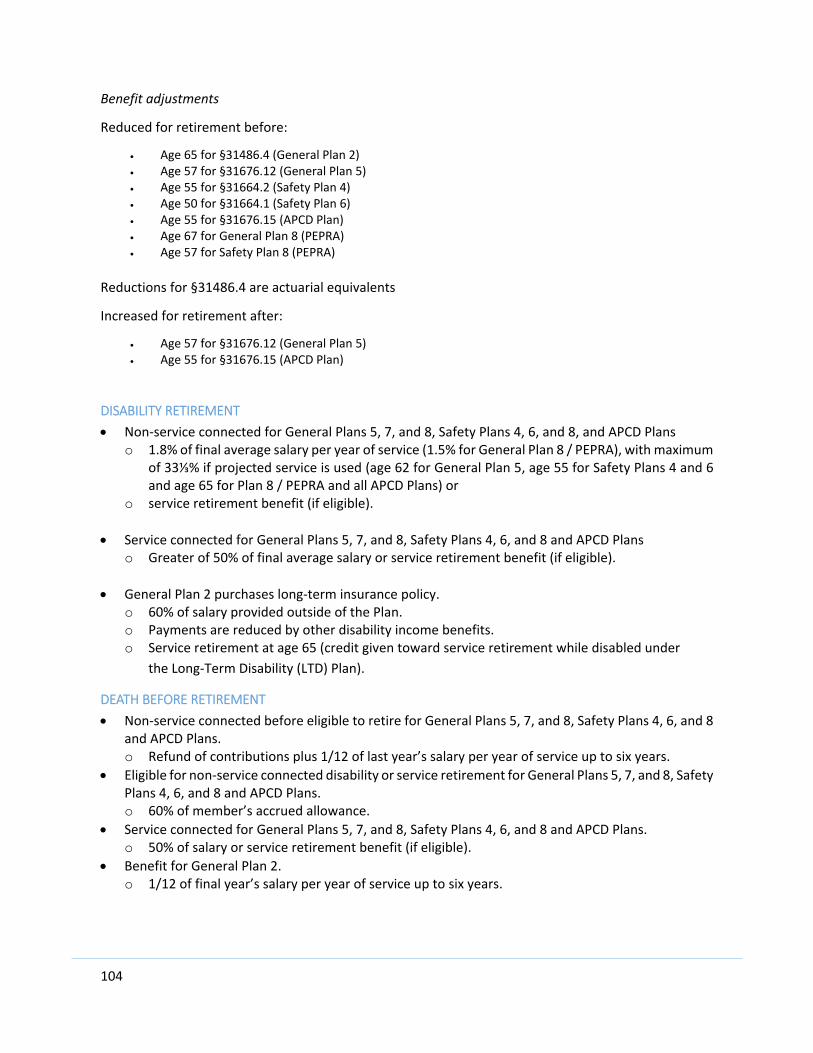
104
Benefit adjustments
Reduced for retirement before:
Age 65 for §31486.4 (General Plan 2) Age 57 for §31676.12 (General Plan 5) Age 55 for §31664.2 (Safety Plan 4) Age 50 for §31664.1 (Safety Plan 6) Age 55 for §31676.15 (APCD Plan) Age 67 for General Plan 8 (PEPRA) Age 57 for Safety Plan 8 (PEPRA)
Reductions for §31486.4 are actuarial equivalents
Increased for retirement after:
Age 57 for §31676.12 (General Plan 5) Age 55 for §31676.15 (APCD Plan)
DISABILITY RETIREMENT
Non‐service connected for General Plans 5, 7, and 8, Safety Plans 4, 6, and 8, and APCD Plans o 1.8% of final average salary per year of service (1.5% for General Plan 8 / PEPRA), with maximum
of 33⅓% if projected service is used (age 62 for General Plan 5, age 55 for Safety Plans 4 and 6 and age 65 for Plan 8 / PEPRA and all APCD Plans) or
o service retirement benefit (if eligible).
Service connected for General Plans 5, 7, and 8, Safety Plans 4, 6, and 8 and APCD Plans o Greater of 50% of final average salary or service retirement benefit (if eligible).
General Plan 2 purchases long‐term insurance policy. o 60% of salary provided outside of the Plan. o Payments are reduced by other disability income benefits. o Service retirement at age 65 (credit given toward service retirement while disabled under
the Long‐Term Disability (LTD) Plan).
DEATH BEFORE RETIREMENT
Non‐service connected before eligible to retire for General Plans 5, 7, and 8, Safety Plans 4, 6, and 8 and APCD Plans. o Refund of contributions plus 1/12 of last year’s salary per year of service up to six years.
Eligible for non‐service connected disability or service retirement for General Plans 5, 7, and 8, Safety Plans 4, 6, and 8 and APCD Plans. o 60% of member’s accrued allowance.
Service connected for General Plans 5, 7, and 8, Safety Plans 4, 6, and 8 and APCD Plans. o 50% of salary or service retirement benefit (if eligible).
Benefit for General Plan 2. o 1/12 of final year’s salary per year of service up to six years.

105
DEATH AFTER RETIREMENT
$5,000 lump sum death benefit for General Plans 5, 7, and 8, Safety Plans 4, 6, and 8, and APCD Plans.
Service retirement or non‐service connected disability. o 60% of member’s allowance payable to an eligible spouse for General Plans 5, 7, and 8,
Safety Plans 4, 6, and 8 and APCD Plans. o 50% of member’s allowance payable to an eligible spouse for General Plan 2.
Service connected disability o 100% of member’s allowance payable to an eligible spouse for General Plans 5, 7, and 8,
Safety Plans 4, 6, and 8 and APCD Plans. o 50% of member’s allowance payable to an eligible spouse for General Plan 2.
VESTING
Must leave contributions on deposit.
Five years of service for General Plan 5, 7, and 8, Safety Plans 4, 6, and 8 and APCD Plans.
Ten years of service for General Plan 2.
MEMBER’S CONTRIBUTIONS
Based on entry age (except Plan 8 / PEPRA).
Half rates for General Plans 5A and 5C, 7, Safety Plans 4A, 4C, 6A and 6B, and APCD Plan 1.
Full rates for General Plan 5B, Safety Plan 4B, and APCD Plan 2.
Half of total normal cost for Plan 8 / PEPRA members, with covered compensation limited to 100% or 120% of 2013 Taxable Wage Base (indexed based on CPI‐U).
General Plan 2 is noncontributory.
MAXIMUM BENEFIT
100% of final average salary for General Plans 5, 7, Safety Plans 4 and 6, and APCD Plans.
No maximum for Plan 8 / PEPRA, other than limits on compensation specified in final average compensation provisions.
Benefit and Social Security combined cannot exceed 70% of final average salary if service is less than 35 years, otherwise 80% for General Plan 2.
COST‐OF‐LIVING
Up to 2.75% cost‐of‐living adjustment for General Plans 5, Safety Plans 4, 6, and 8 (PEPRA), and APCD Plans 1 and 2.
Limited to a maximum 2% cost‐of‐living adjustment for General Plan 7 and any General Plan 8 members where the employer had adopted Plan 7 for new hires.
None for General Plan 2.

106
STATISTICAL
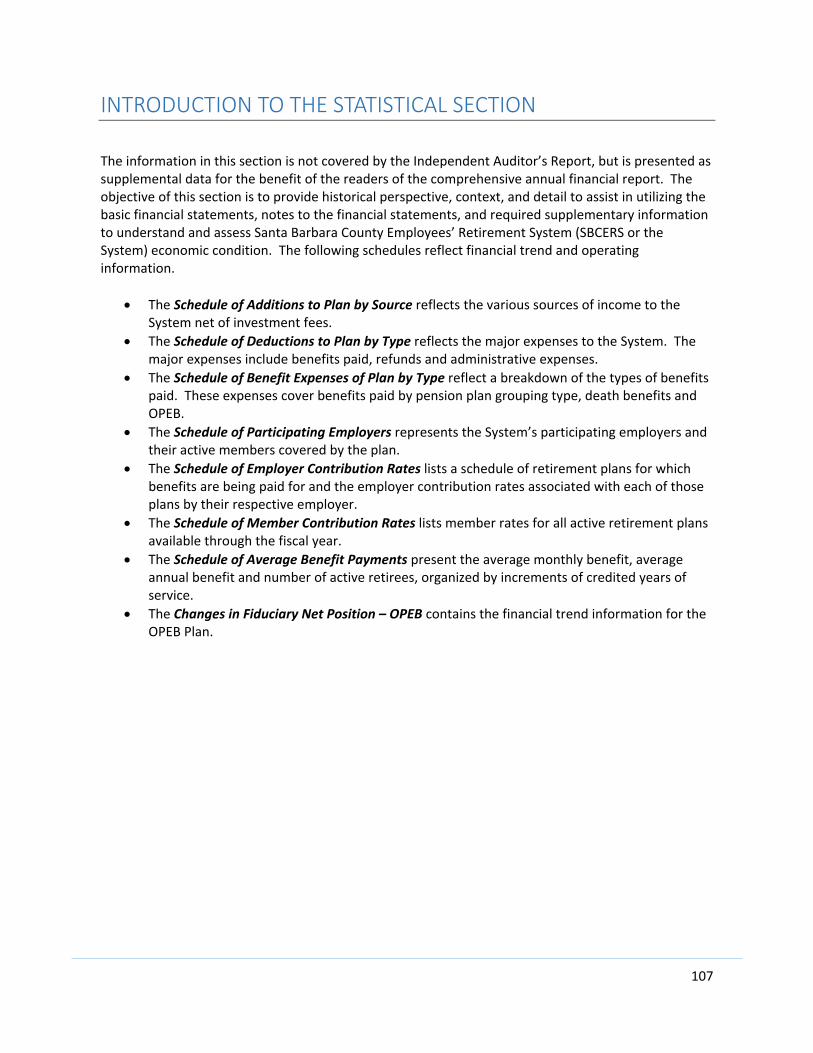
107
INTRODUCTION TO THE STATISTICAL SECTION
The information in this section is not covered by the Independent Auditor’s Report, but is presented as supplemental data for the benefit of the readers of the comprehensive annual financial report. The objective of this section is to provide historical perspective, context, and detail to assist in utilizing the basic financial statements, notes to the financial statements, and required supplementary information to understand and assess Santa Barbara County Employees’ Retirement System (SBCERS or the System) economic condition. The following schedules reflect financial trend and operating information.
The Schedule of Additions to Plan by Source reflects the various sources of income to the System net of investment fees.
The Schedule of Deductions to Plan by Type reflects the major expenses to the System. The major expenses include benefits paid, refunds and administrative expenses.
The Schedule of Benefit Expenses of Plan by Type reflect a breakdown of the types of benefits paid. These expenses cover benefits paid by pension plan grouping type, death benefits and OPEB.
The Schedule of Participating Employers represents the System’s participating employers and their active members covered by the plan.
The Schedule of Employer Contribution Rates lists a schedule of retirement plans for which benefits are being paid for and the employer contribution rates associated with each of those plans by their respective employer.
The Schedule of Member Contribution Rates lists member rates for all active retirement plans available through the fiscal year.
The Schedule of Average Benefit Payments present the average monthly benefit, average annual benefit and number of active retirees, organized by increments of credited years of service.
The Changes in Fiduciary Net Position – OPEB contains the financial trend information for the OPEB Plan.

108
STATISTICAL SCHEDULES
Gross
FiscalYear
MemberContributions
EmployerContributions
ReturnonInvestments
InvestmentExpenses OtherIncome Total
2007 $15,853,139 $63,395,296 $285,497,505 $(13,887,027) $2,233,265 $353,092,1782008 15,479,629 69,460,616 (122,988,456) (10,260,776) 629,238 (47,679,749)2009 11,083,461 83,118,559 (328,434,883) (5,321,065) 63,736 (239,490,192)2010 11,648,995 93,429,332 198,920,921 (4,306,777) 228,877 299,921,3482011 10,843,091 103,102,443 350,862,466 (5,141,373) 23,724,517 483,391,1442012 14,524,627 117,126,395 44,319,664 (5,935,784) 223,470 170,258,3722013 19,023,527 118,940,302 174,387,739 (6,175,490) 395,294 306,571,3722014 14,514,010 128,126,717 335,037,717 (5,906,399) 543,990 472,316,0352015 16,622,138 133,033,308 27,656,731 (6,899,225) 689,829 171,102,7812016 18,311,646 134,445,930 39,484,948 (7,636,818) 1,527,699 186,133,405
SCHEDULE OF ADDITONS TO PLAN BY SOURCE
FiscalYear BenefitsPaid
MemberWithdrawals
AdministrativeExpenses Total
2007 $ 76,846,452 $ 1,883,614 $ 5,619,908 $ 84,349,9742008 84,409,181 1,819,710 3,604,096 89,832,9872009 95,259,946 1,609,893 3,900,782 100,770,6212010 105,642,308 1,319,448 4,045,903 111,007,6592011 114,697,730 1,476,583 4,112,150 120,286,4632012 121,684,623 1,071,850 4,023,062 126,779,5352013 130,222,106 591,490 4,239,711 135,053,3072014 138,898,965 812,467 4,607,478 144,318,9102015 145,507,792 966,902 4,817,662 151,292,3562016 154,527,560 946,405 5,600,783 161,074,748
SCHEDULE OF DEDUCTIONS TO PLAN BY TYPE
FiscalYear
BenefitsPaidGeneral
BenefitsPaidSafety
BenefitsPaidAPCD
DeathBenefits
OPEBBenefits Total
2007 $ 46,357,692 $ 29,787,719 $ 418,508 $ 282,533 $ ‐ $76,846,4522008 50,680,926 32,900,009 596,896 231,350 ‐ 84,409,1812009 50,499,643 37,495,522 710,087 475,527 6,079,167 95,259,9462010 55,347,535 41,389,618 793,023 283,040 7,829,092 105,642,3082011 59,908,869 45,400,748 980,330 371,566 8,036,217 114,697,7302012 66,495,891 45,227,106 1,113,117 689,875 8,158,634 121,684,6232013 64,629,373 55,375,280 1,520,394 330,305 8,366,754 130,222,1062014 73,086,778 55,050,002 1,738,768 412,570 8,610,847 138,898,9652015 76,809,418 57,519,938 2,051,853 423,108 8,703,475 145,507,7922016 81,831,563 61,167,215 2,324,366 388,167 8,816,249 154,527,560
SCHEDULE OF BENEFIT EXPENSES OF PLAN BY TYPE
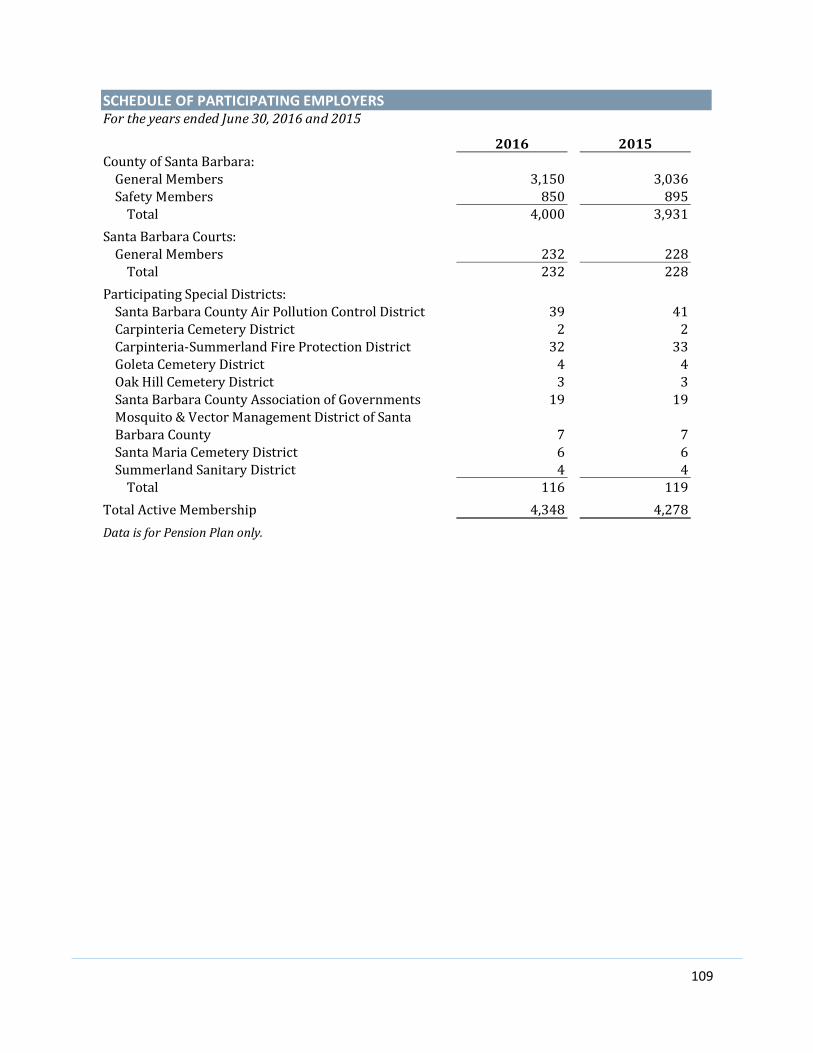
109
SCHEDULE OF PARTICIPATING EMPLOYERSFortheyearsendedJune30,2016and2015
2016 2015CountyofSantaBarbara:GeneralMembers 3,150 3,036SafetyMembers 850 895Total 4,000 3,931
SantaBarbaraCourts:GeneralMembers 232 228Total 232 228
ParticipatingSpecialDistricts:SantaBarbaraCountyAirPollutionControlDistrict 39 41
CarpinteriaCemeteryDistrict 2 2Carpinteria‐SummerlandFireProtectionDistrict 32 33GoletaCemeteryDistrict 4 4OakHillCemeteryDistrict 3 3SantaBarbaraCountyAssociationofGovernments 19 19Mosquito&VectorManagementDistrictofSantaBarbaraCounty 7 7
SantaMariaCemeteryDistrict 6 6SummerlandSanitaryDistrict 4 4Total 116 119
TotalActiveMembership 4,348 4,278
DataisforPensionPlanonly.

110
Plan APCDSBCounty&SBCourts SpecialDistricts
General APCD1 38.08%APCD2 36.84%APCD8 29.90%
General Plan2 20.40%Plan5A 31.64% * 31.64%Plan5B 32.08%Plan5C 33.23%Plan7 30.16%Plan8 25.35%
Safety Plan4A 52.00% 52.00% Plan4B 49.95% Plan4C 51.44% Plan6A 58.29% Plan6B 58.41% Plan8 40.67%
*GeneralPlan7wasnotadoptedbySantaBarbaraCourts.
SCHEDULE OF EMPLOYER CONTRIBUTION RATES
EffectiveJuly2015

111
SCHEDULE OF AVERAGE BENEFIT PAYMENTS
YearsofRetirement0‐9 10‐14 15‐19 20‐24 25‐29 30+
June30,2007AverageMonthlyBenefit $ 2,462 $ 2,045 $ 1,906 $ 1,510 $ 1,056 $ 1,113AverageAnnualBenefit $ 29,544 $ 24,540 $ 22,872 $ 18,120 $ 12,672 $ 13,356NumberofActiveRetirees 1,566 349 314 232 207 144
June30,2008AverageMonthlyBenefit $ 2,651 $ 2,176 $ 2,106 $ 1,764 $ 1,310 $ 1,332AverageAnnualBenefit $ 31,812 $ 26,112 $ 25,272 $ 21,168 $ 15,720 $ 15,984NumberofActiveRetirees 1,776 340 305 228 192 131
June30,2009AverageMonthlyBenefit $ 2,835 $ 2,321 $ 2,232 $ 1,960 $ 1,603 $ 1,378AverageAnnualBenefit $ 34,020 $ 27,852 $ 26,784 $ 23,520 $ 19,236 $ 16,536NumberofActiveRetirees 1,742 485 296 228 177 207
June30,2010AverageMonthlyBenefit $ 3,049 $ 2,419 $ 2,213 $ 2,180 $ 1,733 $ 1,406AverageAnnualBenefit $ 36,588 $ 29,028 $ 26,556 $ 26,160 $ 20,796 $ 16,872NumberofActiveRetirees 1,858 537 320 221 173 209
June30,2011AverageMonthlyBenefit $ 3,099 $ 2,455 $ 2,350 $ 2,326 $ 1,894 $ 1,448AverageAnnualBenefit $ 37,188 $ 29,460 $ 28,200 $ 27,912 $ 22,728 $ 17,376NumberofActiveRetirees 1,912 556 308 244 162 205
June30,2012AverageMonthlyBenefit $ 3,202 $ 2,673 $ 2,374 $ 2,363 $ 1,968 $ 1,545AverageAnnualBenefit $ 38,424 $ 32,076 $ 24,488 $ 28,356 $ 23,616 $ 18,540NumberofActiveRetirees 1,949 612 311 264 157 214
June30,2013AverageMonthlyBenefit $ 3,082 $ 2,856 $ 2,282 $ 2,518 $ 2,028 $ 1,625AverageAnnualBenefit $ 36,987 $ 34,271 $ 27,387 $ 30,212 $ 24,334 $ 19,503NumberofActiveRetirees 2,080 692 361 270 162 208
June30,2014AverageMonthlyBenefit $ 3,121 $ 2,838 $ 2,552 $ 2,402 $ 2,222 $ 1,716AverageAnnualBenefit $ 37,452 $ 34,056 $ 30,624 $ 28,824 $ 26,664 $ 20,592NumberofActiveRetirees 2,097 731 423 247 175 224
June30,2015AverageMonthlyBenefit $ 3,173 $ 3,040 $ 2,632 $ 2,354 $ 2,387 $ 1,779AverageAnnualBenefit $ 38,076 $ 36,480 $ 31,584 $ 28,248 $ 28,644 $ 21,348NumberofActiveRetirees 2,128 766 473 273 172 218
June30,2016AverageMonthlyBenefit $ 3,270 $ 3,079 $ 2,633 $ 2,441 $ 2,421 $ 1,850AverageAnnualBenefit $ 39,240 $ 36,948 $ 31,596 $ 29,292 $ 29,052 $ 22,200NumberofActiveRetirees 2,170 832 496 271 185 217

112
GLOSSARY
113
ACCUMULATED PLAN BENEFITS: Benefits attributable under the provisions of a pension plan to employees for services rendered to the benefit information date. ACTUARIAL ASSUMPTIONS: Assumptions used in the actuarial valuation process as to the occurrence of future events affecting pension costs, such as mortality, withdrawal, disablement and retirement; changes in compensation and national pension benefits; rates of investment earnings and asset appreciation or depreciation; procedures used to determine the actuarial value of assets; characteristics of future entrants for open group actuarial cost methods and other relevant items. ACCRUAL BASIS: The recording of the financial effects on a government of transactions and other events and circumstances that have cash consequences for the government in the periods in which those transactions, events and circumstances occur, rather than only in the periods in which cash is received or paid by the government. ACTUARIAL ACCRUED LIABILITY: The portion, as determined by a particular cost method, of the total present value of benefits that is attributable to past service credit. ACTUARIAL GAIN (LOSS): A measure of the difference between actual and expected experience based upon a set of actuarial assumptions. Examples include a higher return on fund assets than anticipated (gain), and higher than expected salary increases (loss). ACTUARIAL PRESENT VALUE: The discounted value of an amount or series of amounts payable or receivable at various times, determined as of a given date by the application of a particular set of actuarial assumptions. AMORTIZATION: (1) The portion of the cost of a limited‐life or intangible asset charged as an expense during a particular period. (2) The reduction of debt by regular payments of principal and interest sufficient to retire the debt by maturity. AUDITOR’S REPORT: In the context of a financial audit, a statement by the auditor describing the scope of the audit and the auditing standards applied in the examination, and setting forth the auditor's opinion on the fairness of presentation of the financial information in conformity with accounting principles generally accepted in the United States of America (GAAP) or other comprehensive basis of accounting. COMPREHENSIVE ANNUAL FINANCIAL REPORT (CAFR): The official annual report of a government. It includes (a) the five combined financial statements in the combined statements ‐ overview and their related notes (the "liftable" General Purpose Financial Statements) and (b) combining statements by fund type and individual fund and account group financial statements prepared in conformity with GAAP and organized into a financial reporting pyramid. It also includes supporting schedules necessary to demonstrate compliance with finance‐related legal and contractual provisions, required supplementary information, extensive introductory material and a detailed statistical section. Every government reporting entity should prepare a CAFR.
114
ENTRY AGE ACTUARIAL COST METHOD: A method under which the actuarial present value of the projected benefits of each individual included in an actuarial valuation is allocated on a level basis over the earnings or service of the individual between entry age and assumed exit age(s). The portion of this actuarial present value allocated to a valuation year is called the normal cost. The portion of this actuarial present value not provided for at a valuation date by the actuarial present value of future normal costs is called the actuarial accrued liability. NORMAL COST: The ongoing annual cost allocated to the System by a particular actuarial cost method for providing benefits (future cost). Normal cost payments are made during the working lifetime of the member. OTHER POST EMPLOYMENT BENEFITS (OPEB): Post‐employment benefits that an employee will begin to receive at the start of retirement which does not include pension benefits paid. These other post‐employment benefits can include life insurance premiums, health care premiums and deferred‐compensation agreements. PENSION CONTRIBUTION: The amount paid into a pension plan by an employer (or employee), pursuant to the terms of the plan, state law, actuarial calculations or some other basis for determinations. PENSION TRUST FUND: A trust fund used to account for a public employees’ retirement system. Pension trust funds, like nonexpendable trust funds, use the accrual basis of accounting and have a capital maintenance focus. UNFUNDED ACTUARIAL ACCRUED LIABILITY (UAAL): The excess of the actuarial accrued liability over the actuarial value of assets. UAAL AMORTIZATION PAYMENT: The portion of the pension plan contribution, which is designed to pay off (amortize) the unfunded actuarial accrued liability in a systematic fashion. Equivalently, it is a series of periodic payments required to pay off a debt.

