sampling and laboratory analysis of retail … · sampling and laboratory analysis of retail...
TRANSCRIPT
Sampling and Laboratory Analysis of Retail Gasoline and Diesel Fuel for Selected Texas Cities – Summer 2007 FINAL REPORT Prepared for: Texas Commission of Environmental Quality (TCEQ) August 31, 2007
ERG No. 0230.00.003.001 TCEQ Contract No. 582-7-84004 Work Order No. 03 SAMPLING AND LABORATORY ANALYSIS OF RETAIL GASOLINE AND DIESEL
FUEL FOR SELECTED TEXAS CITIES – SUMMER 2007
FINAL REPORT
Prepared for:
Mr. Peter Ogbeide Technical Analysis Division
Texas Commission of Environmental Quality (TCEQ) Bldg. E, Room 341
P. O. Box 13087 Austin, TX 78711-3087
Prepared by:
Rick Baker Diane Preusse
Eastern Research Group, Inc. 5608 Parkcrest Drive, Suite 100
Austin, TX 78731
Michelle Ratchford Southwest Research Institute
6220 Culebra Road San Antonio, Texas 78238-5166
August 31, 2007
i
Table of Contents
EXECUTIVE SUMMARY ....................................................................................................ES-1 Gasoline Sampling and Findings ............................................................................................ES-3 Diesel Sampling and Findings ................................................................................................ES-9 Project Overview ...................................................................................................................1 Site Selection ...................................................................................................................2 Fuel Sampling Plan and Site Selection .........................................................................................2 Sampling and Laboratory Analysis...............................................................................................5
Objective ...............................................................................................................................5 Retail Station and Sample Collection and Handling Procedures..................................................5 Sample Locations and Grades of Fuel ..........................................................................................6 Laboratory Testing ...................................................................................................................6
Gasoline Testing ...................................................................................................................6 Diesel Testing .......................................................................................................................7
Updated MOBILE6 Fuel Parameter Input Files for Texas Counties............................................8 Overview ...................................................................................................................8
Methodology.........................................................................................................................8 Findings - Gasoline .............................................................................................................12 Findings - Diesel .................................................................................................................18 Supplemental Testing – Houston Area Stations .................................................................25
Gasoline Results .................................................................................................................26 Diesel Results .................................................................................................................28 Conclusions .................................................................................................................30
List of Tables Table ES-1. Gasoline Properties, 2007 ........................................................................................4 Table ES-2. Diesel Fuel Properties, 2007..................................................................................10 Table 1. Sampling Plan Summary Table .....................................................................................4 Table 2. Uncertainty Estimates on Composite Data Results ........................................................7 Table 3. Gasoline Properties, 2007 ............................................................................................12 Table 4. Gasoline Comparison of 2007 with 2005 Findings* ...................................................17 Table 5. Diesel Fuel Properties, 2007........................................................................................19 Table 6. HGB Station IDs..........................................................................................................25 Table 7. Station-Specific Gasoline Sampling, Round 1 vs. Round 2 ........................................26 Table 8. Station-Specific Diesel Sampling, Round 1 vs. Round 2 ............................................28
ii
List of Figures Figure ES-1. Gasoline RVP Trends ............................................................................................... 5 Figure ES-2. Gasoline Sulfur Trends............................................................................................. 5 Figure ES-3. Gasoline Olefins Trends ........................................................................................... 6 Figure ES-4. Gasoline Aromatics Trends ...................................................................................... 6 Figure ES-5. Gasoline Benzene Trends ......................................................................................... 7 Figure ES-6. Gasoline MTBE Trends............................................................................................ 7 Figure ES-7. Gasoline ETBE Trends............................................................................................. 8 Figure ES-8. Gasoline Ethanol Trends .......................................................................................... 8 Figure ES-9. Diesel Aromatics Trends ........................................................................................ 11 Figure ES-10. Diesel Olefins Trends ........................................................................................... 11 Figure ES-11. Diesel Saturates Trends ........................................................................................ 12 Figure ES-12. Diesel Sulfur Trends............................................................................................. 12 Figure ES-13. Diesel Cetane Trends............................................................................................ 13 Figure ES-14. Diesel Specific Gravity Trends ............................................................................ 13 Figure ES-15. Diesel T50 Trends ................................................................................................ 14 Figure 1. TxDOT Districts and Sampling Areas .......................................................................... 11 Figure 2. Gasoline RVP Trends ................................................................................................... 13 Figure 3. Gasoline Sulfur Trends................................................................................................. 13 Figure 4. Gasoline Olefins Trends ............................................................................................... 14 Figure 5. Gasoline Aromatics Trends .......................................................................................... 14 Figure 6. Gasoline Benzene Trends ............................................................................................. 15 Figure 7. Gasoline MTBE Trends................................................................................................ 15 Figure 8. Gasoline ETBE Trends................................................................................................. 16 Figure 9. Gasoline Ethanol Trends .............................................................................................. 16 Figure 10. Diesel Aromatics Trends ............................................................................................ 21 Figure 11. Diesel Olefins Trends ................................................................................................. 21 Figure 12. Diesel Saturates Trends .............................................................................................. 22 Figure 13. Diesel Sulfur Trends................................................................................................... 22 Figure 14. Diesel Cetane Trends.................................................................................................. 23 Figure 15. Diesel Specific Gravity Trends .................................................................................. 23 Figure 16. Diesel T50 Trends ...................................................................................................... 24
ES-1
EXECUTIVE SUMMARY
The purpose of this Work Order was to develop physical properties and speciation profiles, and to report laboratory test results for samples of gasoline and diesel fuel collected from retail stations across Texas. Testing of various properties was completed in an approved laboratory which included speciation of volatile organic compounds (VOC) including oxygenates, determination of Reid vapor pressure (RVP), and estimation of sulfur in gasoline, and quantification of aromatics, cetane and sulfur in diesel fuel. The properties and speciation profiles of gasoline and diesel fuel will be used in the development of mobile source episodic state implementation plans (SIPs), Periodic, Rate of Progress, and toxic emissions inventories, trend analysis, and control strategy analysis. Resulting emissions data will also be used in photochemical air quality dispersion modeling, conformity and other sensitivity analysis.
The samples of regular, mid-grade, and premium gasoline, and diesel fuel were taken from 92 retail gas stations, from the twenty-five areas selected by the TCEQ project representative. The 25 areas corresponded to the 25 Texas Department of Transportation (TxDOT) Districts.
A Sampling Plan was developed to specify the minimum number of samples per area, the total number of samples (including number of diesel and gas samples, across gas grades), and the allocation of samples across the different areas. The following sampling plan specifications were established in consultation with the TCEQ Project Representative:
• Each fuel sampling area had a minimum of three sample sites;
• Both diesel and gasoline samples were to be collected at each location;
• Regular, mid-grade, and premium gasoline grades were to be sampled at each location;
• Gasoline and diesel samples were to be collected separately.
To identify specific fuel stations for sampling, petroleum storage tank (PST) data was
obtained from the TCEQ. The list was first narrowed down by extracting only those facilities that had tank capacities over 10,000 gallons to focus data collection on larger volume stations.
Since each area required a minimum of three stations (92 total across 25 districts), stations were selected for each area using a weighted random sample. The resulting list was then sorted by the assigned weighted random number in descending order for station selection.
ES-2
Southwest Research Institute (SwRI) provided containers and packaging, gasoline and diesel sample acquisition services for retail fuel sampling, shipping, sample handling and analytical testing. Four fuel samples were acquired at each station visited, including 3 grades of gasoline and one diesel sample. Sampling took place at a minimum of three retail stations for each of the 25 districts of the state, as discussed above. Attachment 2 of this report contains the listing of all samples acquired, date of sampling, location name, brand of fuel, address, gasoline grades acquired, posted octane, temperature of flushed sample and pad cover of sampling location.
Gasoline testing was performed on individual regular, mid-grade, and premium unleaded samples in each city. There was no compositing of samples.
For gasoline samples, testing included:
• Reid Vapor Pressure (American Society for Testing and Materials (ASTM) D 5191-04 standards)
• Sulfur (ASTM D2622-05)
• Distillation (ASTM D86-05)
• Detailed Hydrocarbon Analysis (ASTM D6729-04)
• Chemical Abstracts Services (CAS) number (ASTM D 5134)
Test results are provided electronically as Attachment 2 for gasoline samples.
Diesel testing included:
• Cetane number (ASTM D613-05)
• Calculated cetane index (ASTM D976-06)
• API Gravity (ASTM D287-92)
• Aromaticity (ASTM D1319-03e1)
• Sulfur (ASTM D5453-06)
• Nitrogen content (ASTM D4629-02)
• Specific gravity (ASTM D1298-99)
• Distillation (ASTM D86-07)
• Polycyclic aromatic content (ASTM D5186-03)
• Flash point (ASTM D93-06)
ES-3
Test results are provided electronically as Attachment 3 for diesel samples.
Gasoline Sampling and Findings
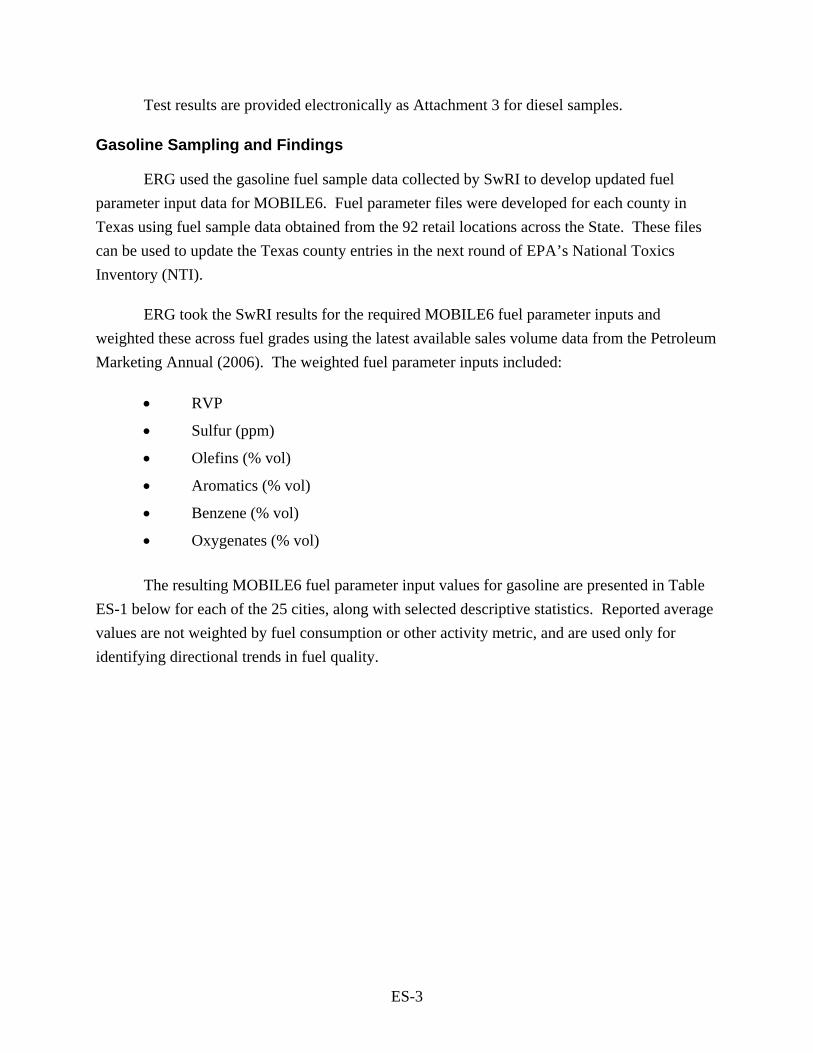
ERG used the gasoline fuel sample data collected by SwRI to develop updated fuel parameter input data for MOBILE6. Fuel parameter files were developed for each county in Texas using fuel sample data obtained from the 92 retail locations across the State. These files can be used to update the Texas county entries in the next round of EPA’s National Toxics Inventory (NTI).
ERG took the SwRI results for the required MOBILE6 fuel parameter inputs and weighted these across fuel grades using the latest available sales volume data from the Petroleum Marketing Annual (2006). The weighted fuel parameter inputs included:
• RVP
• Sulfur (ppm)
• Olefins (% vol)
• Aromatics (% vol)
• Benzene (% vol)
• Oxygenates (% vol)
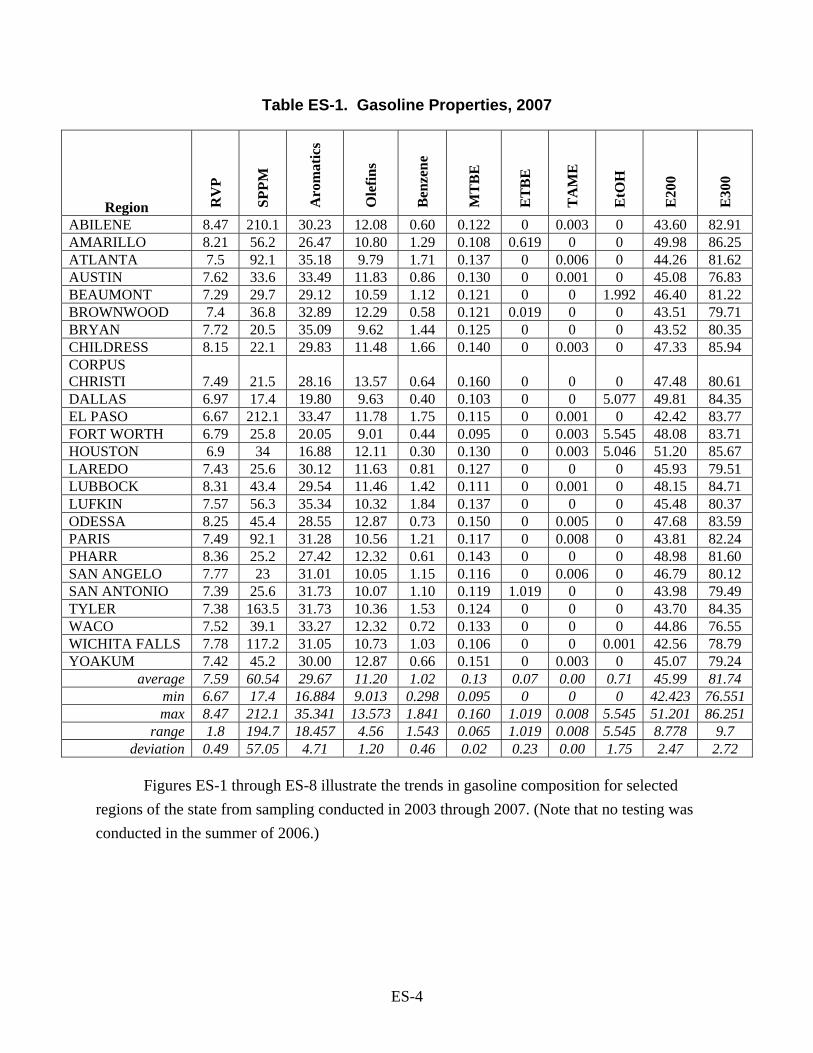
The resulting MOBILE6 fuel parameter input values for gasoline are presented in Table
ES-1 below for each of the 25 cities, along with selected descriptive statistics. Reported average values are not weighted by fuel consumption or other activity metric, and are used only for identifying directional trends in fuel quality.
ES-4
Table ES-1. Gasoline Properties, 2007
Region RV
P
SPPM
Aro
mat
ics
Ole
fins
Ben
zene
MT
BE
ET
BE
TA
ME
EtO
H
E20
0
E30
0
ABILENE 8.47 210.1 30.23 12.08 0.60 0.122 0 0.003 0 43.60 82.91 AMARILLO 8.21 56.2 26.47 10.80 1.29 0.108 0.619 0 0 49.98 86.25 ATLANTA 7.5 92.1 35.18 9.79 1.71 0.137 0 0.006 0 44.26 81.62 AUSTIN 7.62 33.6 33.49 11.83 0.86 0.130 0 0.001 0 45.08 76.83 BEAUMONT 7.29 29.7 29.12 10.59 1.12 0.121 0 0 1.992 46.40 81.22 BROWNWOOD 7.4 36.8 32.89 12.29 0.58 0.121 0.019 0 0 43.51 79.71 BRYAN 7.72 20.5 35.09 9.62 1.44 0.125 0 0 0 43.52 80.35 CHILDRESS 8.15 22.1 29.83 11.48 1.66 0.140 0 0.003 0 47.33 85.94 CORPUS CHRISTI 7.49 21.5 28.16 13.57 0.64 0.160 0 0 0 47.48 80.61 DALLAS 6.97 17.4 19.80 9.63 0.40 0.103 0 0 5.077 49.81 84.35 EL PASO 6.67 212.1 33.47 11.78 1.75 0.115 0 0.001 0 42.42 83.77 FORT WORTH 6.79 25.8 20.05 9.01 0.44 0.095 0 0.003 5.545 48.08 83.71 HOUSTON 6.9 34 16.88 12.11 0.30 0.130 0 0.003 5.046 51.20 85.67 LAREDO 7.43 25.6 30.12 11.63 0.81 0.127 0 0 0 45.93 79.51 LUBBOCK 8.31 43.4 29.54 11.46 1.42 0.111 0 0.001 0 48.15 84.71 LUFKIN 7.57 56.3 35.34 10.32 1.84 0.137 0 0 0 45.48 80.37 ODESSA 8.25 45.4 28.55 12.87 0.73 0.150 0 0.005 0 47.68 83.59 PARIS 7.49 92.1 31.28 10.56 1.21 0.117 0 0.008 0 43.81 82.24 PHARR 8.36 25.2 27.42 12.32 0.61 0.143 0 0 0 48.98 81.60 SAN ANGELO 7.77 23 31.01 10.05 1.15 0.116 0 0.006 0 46.79 80.12 SAN ANTONIO 7.39 25.6 31.73 10.07 1.10 0.119 1.019 0 0 43.98 79.49 TYLER 7.38 163.5 31.73 10.36 1.53 0.124 0 0 0 43.70 84.35 WACO 7.52 39.1 33.27 12.32 0.72 0.133 0 0 0 44.86 76.55 WICHITA FALLS 7.78 117.2 31.05 10.73 1.03 0.106 0 0 0.001 42.56 78.79 YOAKUM 7.42 45.2 30.00 12.87 0.66 0.151 0 0.003 0 45.07 79.24
average 7.59 60.54 29.67 11.20 1.02 0.13 0.07 0.00 0.71 45.99 81.74 min 6.67 17.4 16.884 9.013 0.298 0.095 0 0 0 42.423 76.551max 8.47 212.1 35.341 13.573 1.841 0.160 1.019 0.008 5.545 51.201 86.251
range 1.8 194.7 18.457 4.56 1.543 0.065 1.019 0.008 5.545 8.778 9.7 deviation 0.49 57.05 4.71 1.20 0.46 0.02 0.23 0.00 1.75 2.47 2.72
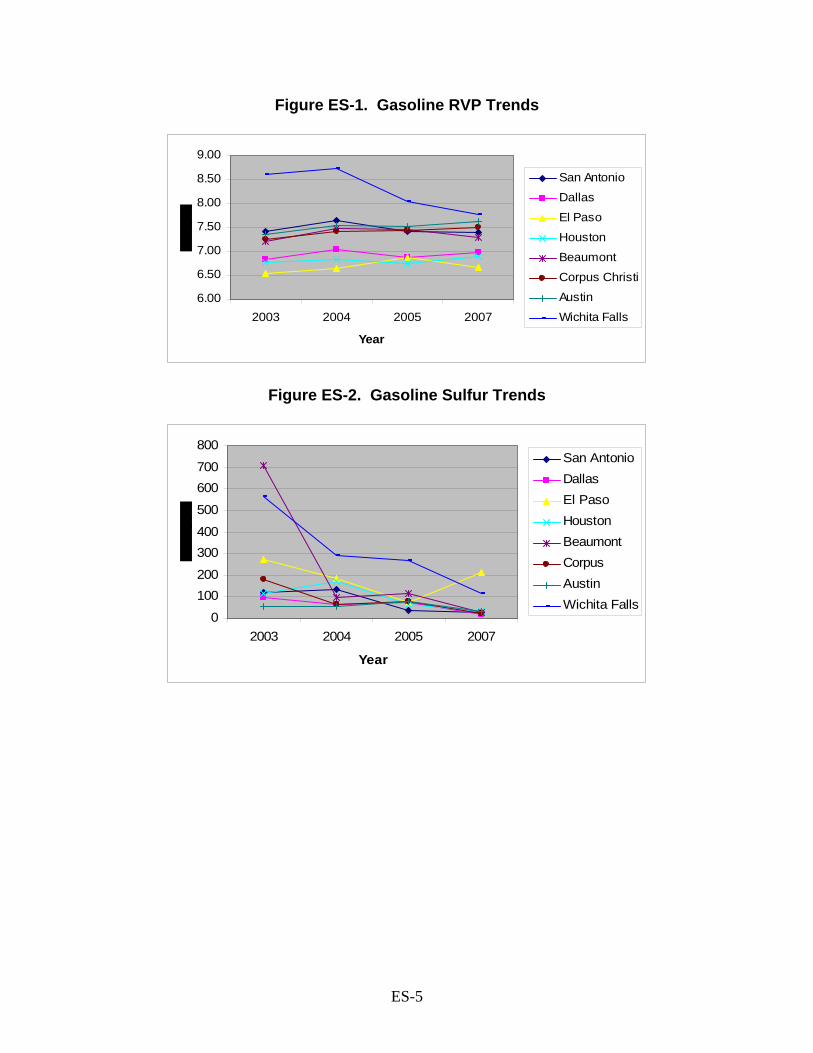
Figures ES-1 through ES-8 illustrate the trends in gasoline composition for selected
regions of the state from sampling conducted in 2003 through 2007. (Note that no testing was conducted in the summer of 2006.)
ES-5
Figure ES-1. Gasoline RVP Trends
6.00
6.50
7.00
7.50
8.00
8.50
9.00
2003 2004 2005 2007
Year
San Antonio
Dallas
El Paso
Houston
Beaumont
Corpus Christi
Austin
Wichita Falls
Figure ES-2. Gasoline Sulfur Trends
0
100200
300400
500
600700
800
2003 2004 2005 2007
Year
San AntonioDallasEl PasoHoustonBeaumontCorpusAustinWichita Falls

ES-6
Figure ES-3. Gasoline Olefins Trends
8
910
1112
13
1415
16
2003 2004 2005 2007
Year
San AntonioDallasEl PasoHoustonBeaumontCorpusAustinWichita Falls
Figure ES-4. Gasoline Aromatics Trends
15.00
20.00
25.00
30.00
35.00
40.00
2003 2004 2005 2007
Year
San AntonioDallasEl PasoHoustonBeaumontCorpusAustinWichita Falls

ES-7
Figure ES-5. Gasoline Benzene Trends
0.00
0.50
1.00
1.50
2.00
2.50
3.00
2003 2004 2005 2007
Year
San AntonioDallasEl PasoHoustonBeaumontCorpusAustinWichita Falls
Figure ES-6. Gasoline MTBE Trends
0.00
2.00
4.00
6.00
8.00
10.00
12.00
14.00
2003 2004 2005 2007
Year
San AntonioDallasEl PasoHoustonBeaumontCorpusAustinWichita Falls
ES-8
Figure ES-7. Gasoline ETBE Trends
0.00
0.50
1.00
1.50
2.00
2.50
3.00
2003 2004 2005 2007
Year
San AntonioDallasEl PasoHoustonBeaumontCorpusAustinWichita Falls
Figure ES-8. Gasoline Ethanol Trends
0.00
1.00
2.00
3.00
4.00
5.00
6.00
2003 2004 2005 2007
Year
San AntonioDallasEl PasoHoustonBeaumontCorpusAustinWichita Falls
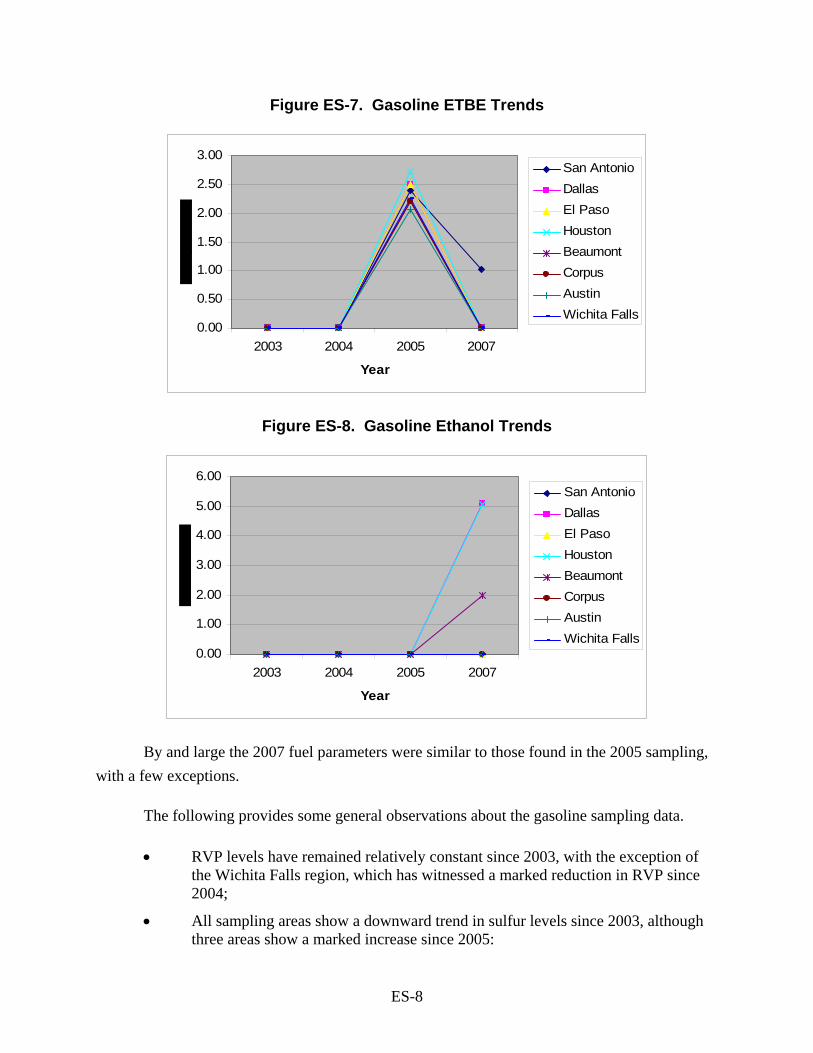
By and large the 2007 fuel parameters were similar to those found in the 2005 sampling, with a few exceptions.
The following provides some general observations about the gasoline sampling data.
• RVP levels have remained relatively constant since 2003, with the exception of the Wichita Falls region, which has witnessed a marked reduction in RVP since 2004;
• All sampling areas show a downward trend in sulfur levels since 2003, although three areas show a marked increase since 2005:
ES-9
° Abilene ° El Paso ° Tyler
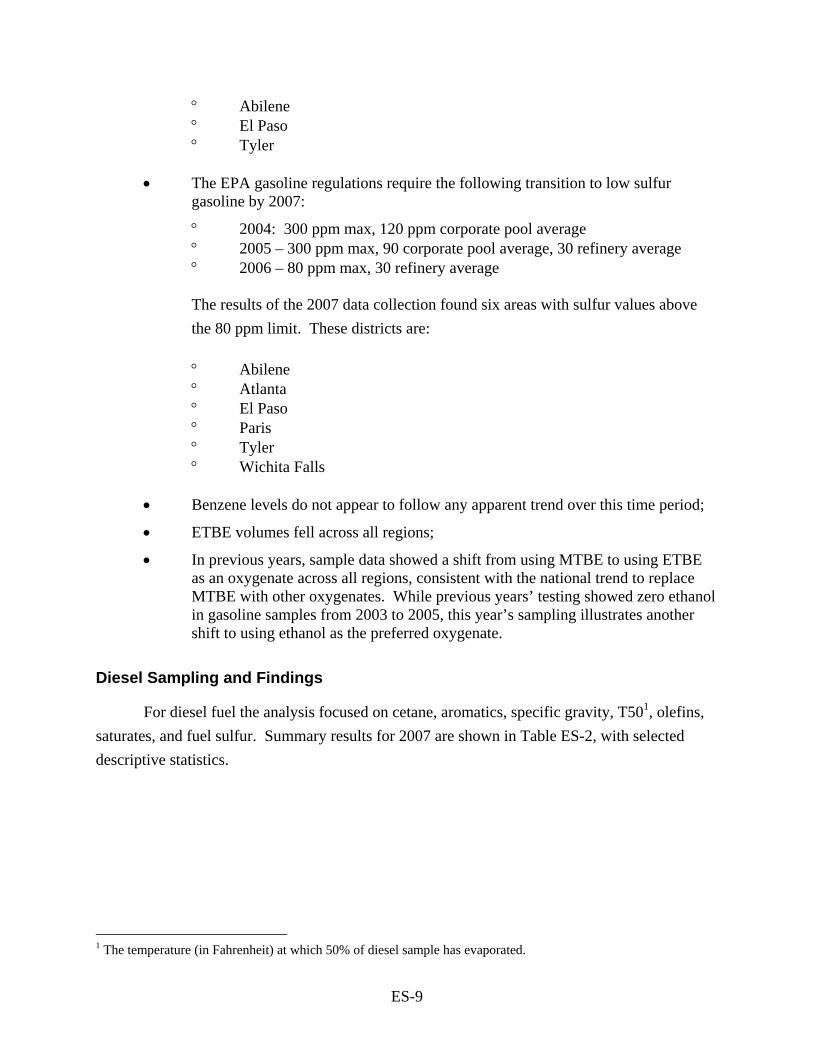
• The EPA gasoline regulations require the following transition to low sulfur
gasoline by 2007:
° 2004: 300 ppm max, 120 ppm corporate pool average ° 2005 – 300 ppm max, 90 corporate pool average, 30 refinery average ° 2006 – 80 ppm max, 30 refinery average
The results of the 2007 data collection found six areas with sulfur values above the 80 ppm limit. These districts are:
° Abilene ° Atlanta ° El Paso ° Paris ° Tyler ° Wichita Falls
• Benzene levels do not appear to follow any apparent trend over this time period;
• ETBE volumes fell across all regions;
• In previous years, sample data showed a shift from using MTBE to using ETBE as an oxygenate across all regions, consistent with the national trend to replace MTBE with other oxygenates. While previous years’ testing showed zero ethanol in gasoline samples from 2003 to 2005, this year’s sampling illustrates another shift to using ethanol as the preferred oxygenate.
Diesel Sampling and Findings
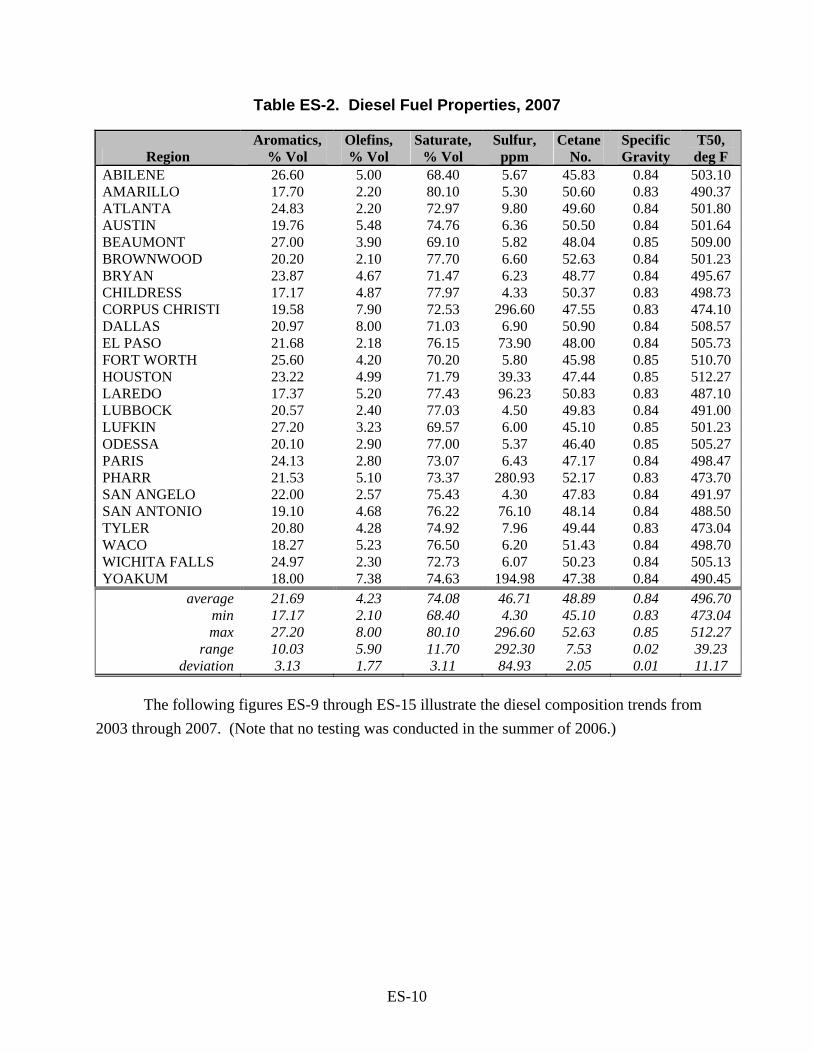
For diesel fuel the analysis focused on cetane, aromatics, specific gravity, T501, olefins, saturates, and fuel sulfur. Summary results for 2007 are shown in Table ES-2, with selected descriptive statistics.
1 The temperature (in Fahrenheit) at which 50% of diesel sample has evaporated.
ES-10
Table ES-2. Diesel Fuel Properties, 2007
Region Aromatics,
% Vol Olefins, % Vol
Saturate, % Vol
Sulfur, ppm
Cetane No.
Specific Gravity
T50, deg F
ABILENE 26.60 5.00 68.40 5.67 45.83 0.84 503.10 AMARILLO 17.70 2.20 80.10 5.30 50.60 0.83 490.37 ATLANTA 24.83 2.20 72.97 9.80 49.60 0.84 501.80 AUSTIN 19.76 5.48 74.76 6.36 50.50 0.84 501.64 BEAUMONT 27.00 3.90 69.10 5.82 48.04 0.85 509.00 BROWNWOOD 20.20 2.10 77.70 6.60 52.63 0.84 501.23 BRYAN 23.87 4.67 71.47 6.23 48.77 0.84 495.67 CHILDRESS 17.17 4.87 77.97 4.33 50.37 0.83 498.73 CORPUS CHRISTI 19.58 7.90 72.53 296.60 47.55 0.83 474.10 DALLAS 20.97 8.00 71.03 6.90 50.90 0.84 508.57 EL PASO 21.68 2.18 76.15 73.90 48.00 0.84 505.73 FORT WORTH 25.60 4.20 70.20 5.80 45.98 0.85 510.70 HOUSTON 23.22 4.99 71.79 39.33 47.44 0.85 512.27 LAREDO 17.37 5.20 77.43 96.23 50.83 0.83 487.10 LUBBOCK 20.57 2.40 77.03 4.50 49.83 0.84 491.00 LUFKIN 27.20 3.23 69.57 6.00 45.10 0.85 501.23 ODESSA 20.10 2.90 77.00 5.37 46.40 0.85 505.27 PARIS 24.13 2.80 73.07 6.43 47.17 0.84 498.47 PHARR 21.53 5.10 73.37 280.93 52.17 0.83 473.70 SAN ANGELO 22.00 2.57 75.43 4.30 47.83 0.84 491.97 SAN ANTONIO 19.10 4.68 76.22 76.10 48.14 0.84 488.50 TYLER 20.80 4.28 74.92 7.96 49.44 0.83 473.04 WACO 18.27 5.23 76.50 6.20 51.43 0.84 498.70 WICHITA FALLS 24.97 2.30 72.73 6.07 50.23 0.84 505.13 YOAKUM 18.00 7.38 74.63 194.98 47.38 0.84 490.45
average 21.69 4.23 74.08 46.71 48.89 0.84 496.70 min 17.17 2.10 68.40 4.30 45.10 0.83 473.04 max 27.20 8.00 80.10 296.60 52.63 0.85 512.27
range 10.03 5.90 11.70 292.30 7.53 0.02 39.23 deviation 3.13 1.77 3.11 84.93 2.05 0.01 11.17
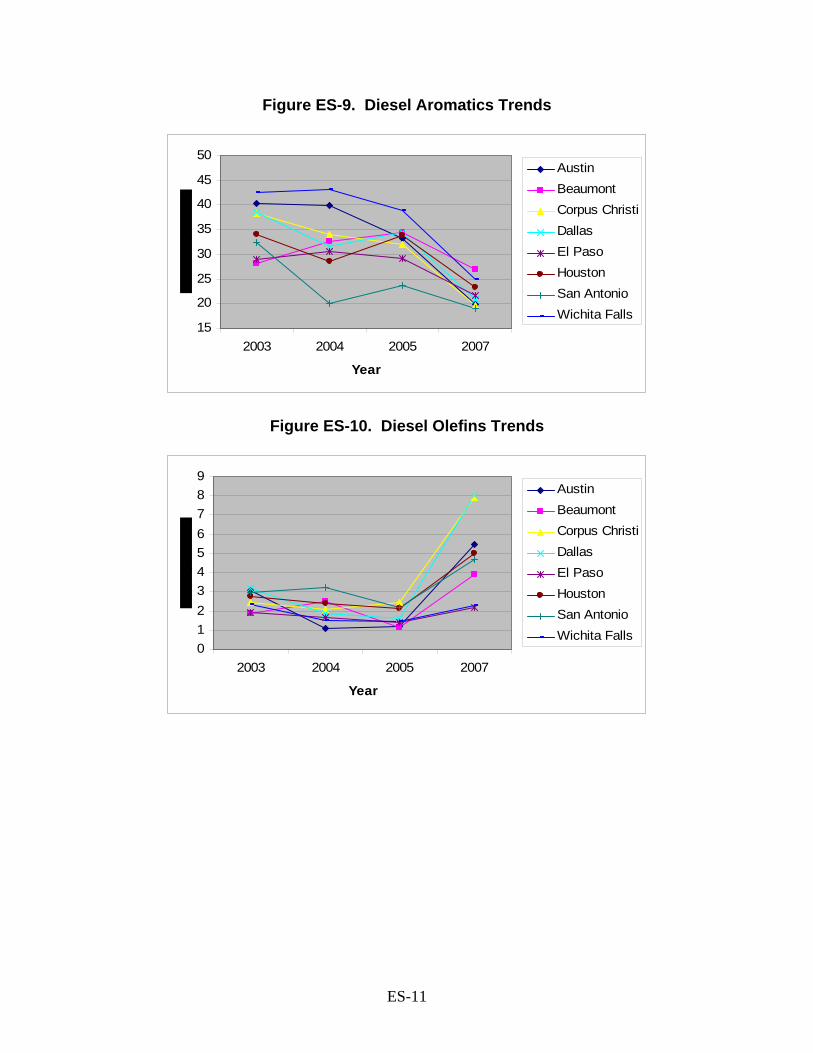
The following figures ES-9 through ES-15 illustrate the diesel composition trends from
2003 through 2007. (Note that no testing was conducted in the summer of 2006.)
ES-11
Figure ES-9. Diesel Aromatics Trends
15
20
25
30
35
40
45
50
2003 2004 2005 2007
Year
AustinBeaumontCorpus ChristiDallasEl PasoHoustonSan AntonioWichita Falls
Figure ES-10. Diesel Olefins Trends
0123456789
2003 2004 2005 2007
Year
AustinBeaumontCorpus ChristiDallasEl PasoHoustonSan AntonioWichita Falls
ES-12
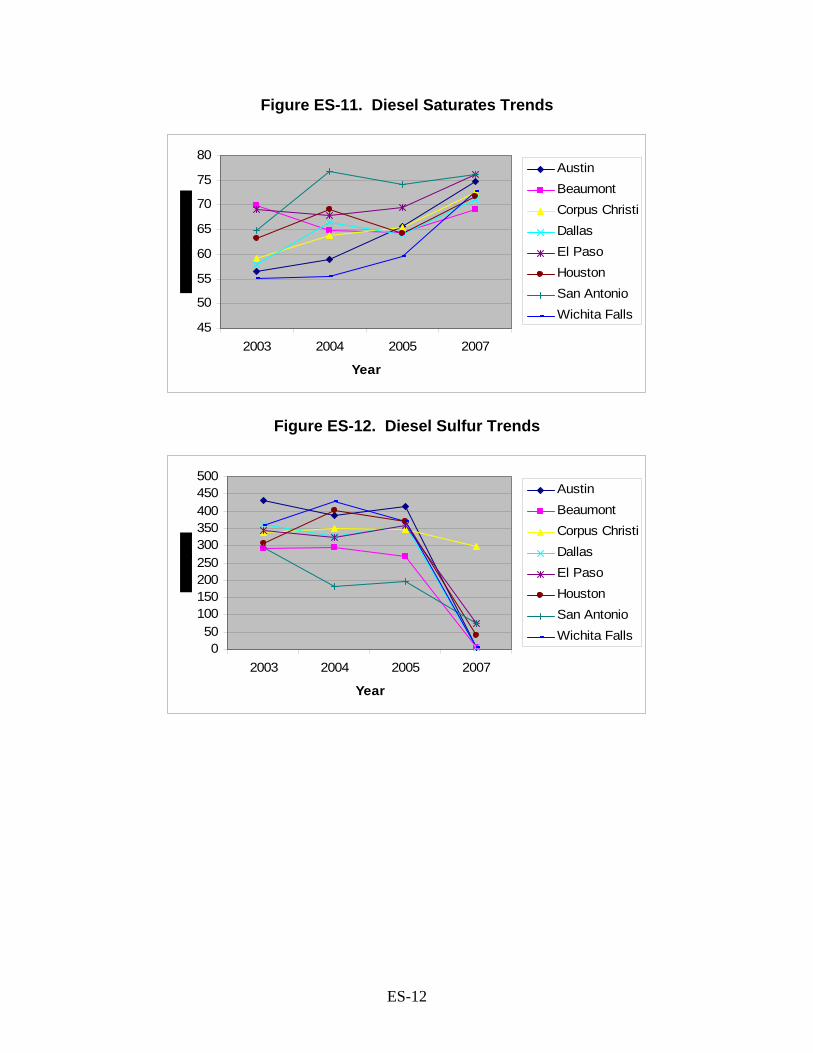
Figure ES-11. Diesel Saturates Trends
45
50
55
60
65
70
75
80
2003 2004 2005 2007
Year
AustinBeaumontCorpus ChristiDallasEl PasoHoustonSan AntonioWichita Falls
Figure ES-12. Diesel Sulfur Trends
050
100150200250300350400450500
2003 2004 2005 2007
Year
AustinBeaumontCorpus ChristiDallasEl PasoHoustonSan AntonioWichita Falls
ES-13
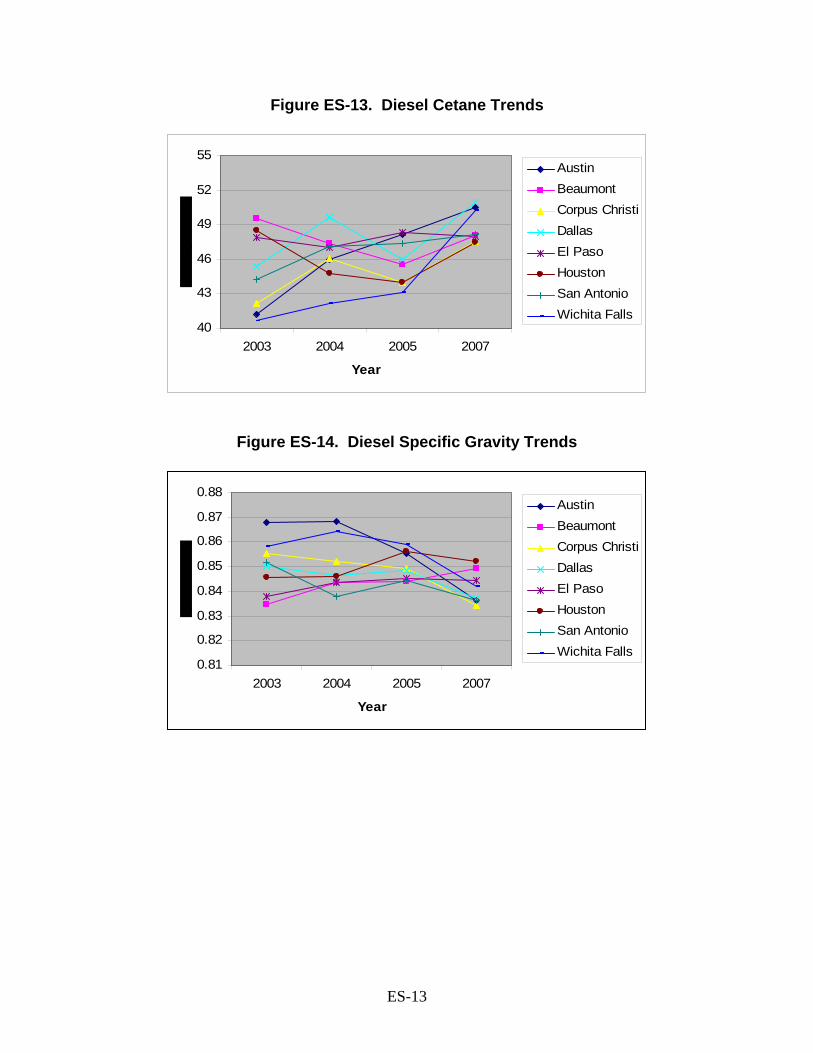
Figure ES-13. Diesel Cetane Trends
40
43
46
49
52
55
2003 2004 2005 2007
Year
AustinBeaumontCorpus ChristiDallasEl PasoHoustonSan AntonioWichita Falls
Figure ES-14. Diesel Specific Gravity Trends
0.81
0.82
0.83
0.84
0.85
0.86
0.87
0.88
2003 2004 2005 2007
Year
AustinBeaumontCorpus ChristiDallasEl PasoHoustonSan AntonioWichita Falls
ES-14
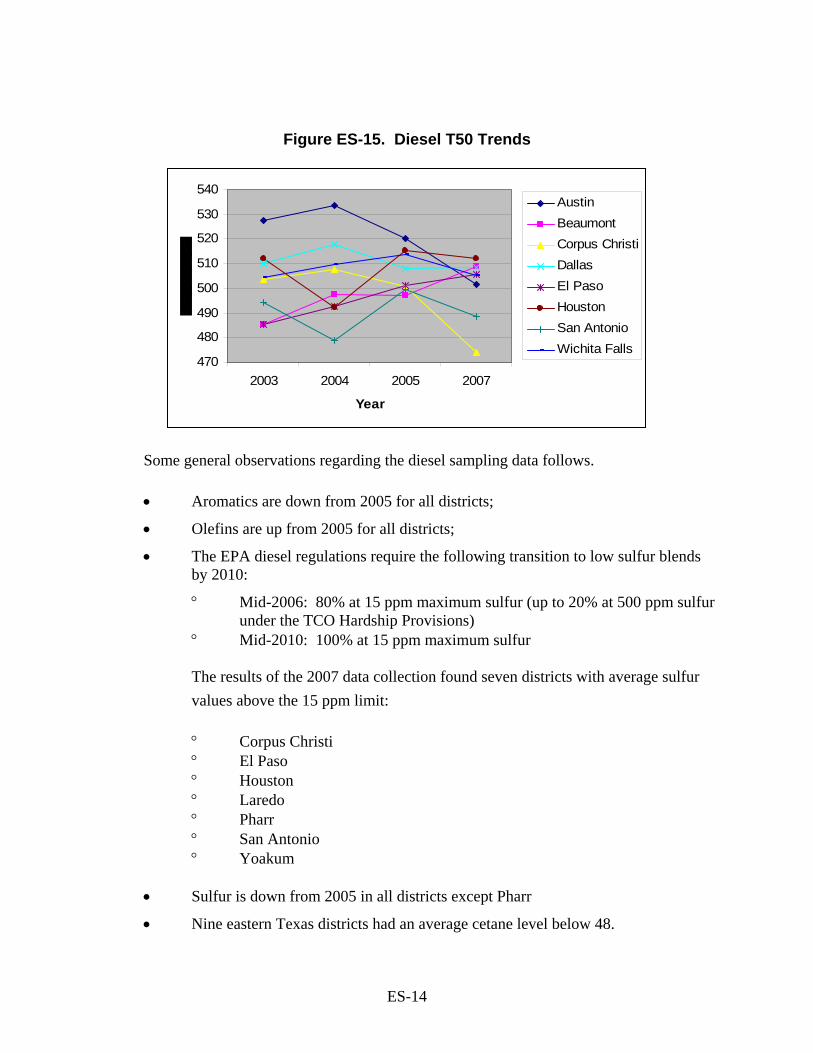
Figure ES-15. Diesel T50 Trends
470
480
490
500
510
520
530
540
2003 2004 2005 2007
Year
AustinBeaumontCorpus ChristiDallasEl PasoHoustonSan AntonioWichita Falls
Some general observations regarding the diesel sampling data follows.
• Aromatics are down from 2005 for all districts;
• Olefins are up from 2005 for all districts;
• The EPA diesel regulations require the following transition to low sulfur blends by 2010:
° Mid-2006: 80% at 15 ppm maximum sulfur (up to 20% at 500 ppm sulfur under the TCO Hardship Provisions)
° Mid-2010: 100% at 15 ppm maximum sulfur
The results of the 2007 data collection found seven districts with average sulfur values above the 15 ppm limit:
° Corpus Christi ° El Paso ° Houston ° Laredo ° Pharr ° San Antonio ° Yoakum
• Sulfur is down from 2005 in all districts except Pharr
• Nine eastern Texas districts had an average cetane level below 48.
ES-15
These results may have implications for the Texas Low Emission Diesel Rule (30 TAC
114.312) that requires a nominal 10% aromatic cap and a minimum cetane number of 48 for counties located in eastern Texas, in addition to the national sulfur requirements (e.g., 15 ppm in 2006; 500 ppm is allowed until then). However, the Texas Low Emission Diesel Rule does have provisions for alternative diesel fuel formulations that may account for lower cetane levels, especially since these districts have average cetane levels only slightly less than the required 48 of the TxLED rule.
These findings also indicate that TCEQ should perhaps re-evaluate the emission reductions claimed by the original rule. The original rule assumed an average base cetane number of 43, which would be increased to a minimum of 48. The data from the 2003, 2004, 2005, and 2007 sampling seem to indicate that average base cetane levels are higher than 43.
Supplemental Testing – Houston Area Stations
In addition to the testing described above, a second round of sampling and testing was conducted for a subset of fueling stations (the seven located in the Houston area). This testing took place approximately one month after the first round of sampling, to ensure complete tank turnover. Previous fuel sampling and analysis studies have gone to great lengths to assess geographic variation in fuel parameters, but little is known about how fuel quality varies over a season at a given station. Therefore this second round of sampling was intended to make a preliminary assessment of the temporal variability of fuel parameters at the station level.
Some general observations about the second round of test results are discussed below.
• Even though there is substantial variation between stations, testing shows little variability for the same station between Round 1 and Round 2.
• Diesel fuel sulfur levels are much more variable for a number of parameters:
° Aromatics levels varied by roughly 10% between sampling rounds for 5 of
the 7 stations; ° Cetane number showed substantial variation for two stations(between 8
and 9 points); ° Sulfur content was quite stable for 5 of the 7 stations, but varied
dramatically (> 100 ppm) for two stations.
1
Project Overview
The purpose of this Work Order was to develop physical properties and speciation profiles, and to report laboratory test results for samples of gasoline and diesel fuel collected from retail stations across Texas. Testing of various properties was completed in an approved laboratory which included speciation of volatile organic compounds (VOC) including oxygenates, determination of Reid vapor pressure (RVP), and estimation of sulfur in gasoline, and quantification of aromatics, cetane and sulfur in diesel fuel. The properties and speciation profiles of gasoline and diesel fuel will be used in the development of mobile source episodic state implementation plans (SIPs), Periodic, Rate of Progress, and toxic emissions inventories, trend analysis, and control strategy analysis. Resulting emissions data will also be used in photochemical air quality dispersion modeling, conformity and other sensitivity analysis.
The samples of regular, mid-grade, and premium gasoline, and diesel fuel were taken from 92 retail gas stations, from the twenty-five areas across the state. The 25 areas corresponded to the 25 Texas Department of Transportation (TxDOT) Districts.
In order to maintain a high confidence level in the fuel parameters used in the development of on-road emission inventories, trend analysis and control strategy analysis, TCEQ has undertaken a program to periodically collect and analyze fuel samples. The data will ensure the accuracy of local specific fuel information and also provide the best data available to be used for analysis to support Texas State Implementation Plan (SIP) and control strategy development.
The following summarizes the results of this study, including sample collection and lab analysis, the development of fuel parameter files for use in MOBILE6 based on this data, and recommendations for future fuel sampling activities. Detailed electronic files with supporting data and analysis are provided separately on CD.
2
Site Selection
In this task, ERG developed a fuel sampling plan to be implemented by Southwest Research Institute (SwRI) during the summer of 2007. ERG first obtained background information to help assess the geographic and temporal boundaries for sampling at retail stations. This information included:
1) The geographic boundaries of the twenty-five TxDOT districts throughout the state;
2) Surrogates for estimating sales volumes from readily available data, such as underground storage tank numbers and sizes (obtained from TCEQ Petroleum Storage Tank Database).
ERG used this information to develop the strata for the fuel sampling task, specifying the
areas within the districts and station sizes.
Fuel Sampling Plan and Site Selection
A Sampling Plan was developed to specify the minimum number of samples per area, the total number of samples (including number of diesel and gas samples, across gas grades), and the allocation of samples across the different areas. The following sampling plan specifications were established in consultation with the TCEQ Project Representative:
• Each fuel sampling city had a minimum of three sample sites;
• Both diesel and gasoline samples were to be collected at each location;
• Regular, mid-grade, and premium gasoline grades were to be sampled;
• Gasoline and diesel samples were to be collected separately.
This approach requires a lab test of every sample, and is therefore more costly and limits
the total number of stations. However, it does provide an indication of differences within areas that would not be discernable using the compositing approach. Specifically, this approach enables the determination of minimum, maximum and average fuel parameter values, not just averages for each region. This characterization is more consistent with MOBILE modeling, in that it would allow TCEQ to specify maximum and average parameter values for inputs like fuel sulfur levels.
To identify specific fuel stations for sampling, petroleum storage tank (PST) data was obtained from the TCEQ, consisting of several large text files. The files obtained from TCEQ were:
3
• Facility – contains location, number of tanks, facility type
• Tanks – contains tank size information and status (active or inactive)
• Composition – contains tank-specific information including fuel type
These files were merged into one master file for site selection purposes. Next, only retail
establishments were selected where the status was “active” within the PST database. (Note that retail service stations are only one type of facility that can have tanks; others include bulk fuel terminals, state agency fleet tanks, municipal fleet tanks, and so forth.) This filter yielded 37,003 gasoline stations, and 7,614 establishments that sold diesel. To ensure that the larger service stations were sampled – used as a surrogate for high throughput since actual throughput data is only available at the wholesale level -- the list was narrowed down by extracting only those facilities that had tank capacities over 10,000 gallons. Furthermore, ERG obtained a list of stations with enforcement actions against them from the TCEQ,2 and any stations with enforcement actions against them were eliminated. This yielded two lists from which fuel samples could be selected:
• 6,426 gasoline stations
• 2,471 diesel stations
The above data lists were merged to only consider stations providing both gasoline and
diesel (as an efficiency measure for sampling), resulting in a list of approximately 2,300 gas stations that were candidates for sampling. Each of these gas stations was assigned to a TXDOT district based on the area where they were located.
ERG assigned a core city to each of the 25 TXDOT districts for the purpose of this analysis. Using Geographical Information Systems (GIS), a map depicting Texas cities was overlaid on a map containing Texas counties.3 The county metadata was then merged with the TXDOT district data such that each county now had a corresponding city. ERG selected core cities from the Texas cities map, and applied a 50-mile buffer from the centroid of the city. Gas stations that were located in the cities within the 50-mile buffer from the core city centroid were selected for that particular TXDOT district.
2 Anne Dobbs, TCEQ Enforcement Division, 6/26/07. 3 ESRI, 2003. ESRI Data & Maps - 2003. Texas Dataset. Provided by the Environmental Systems Research Institute, Redlands, California.
4
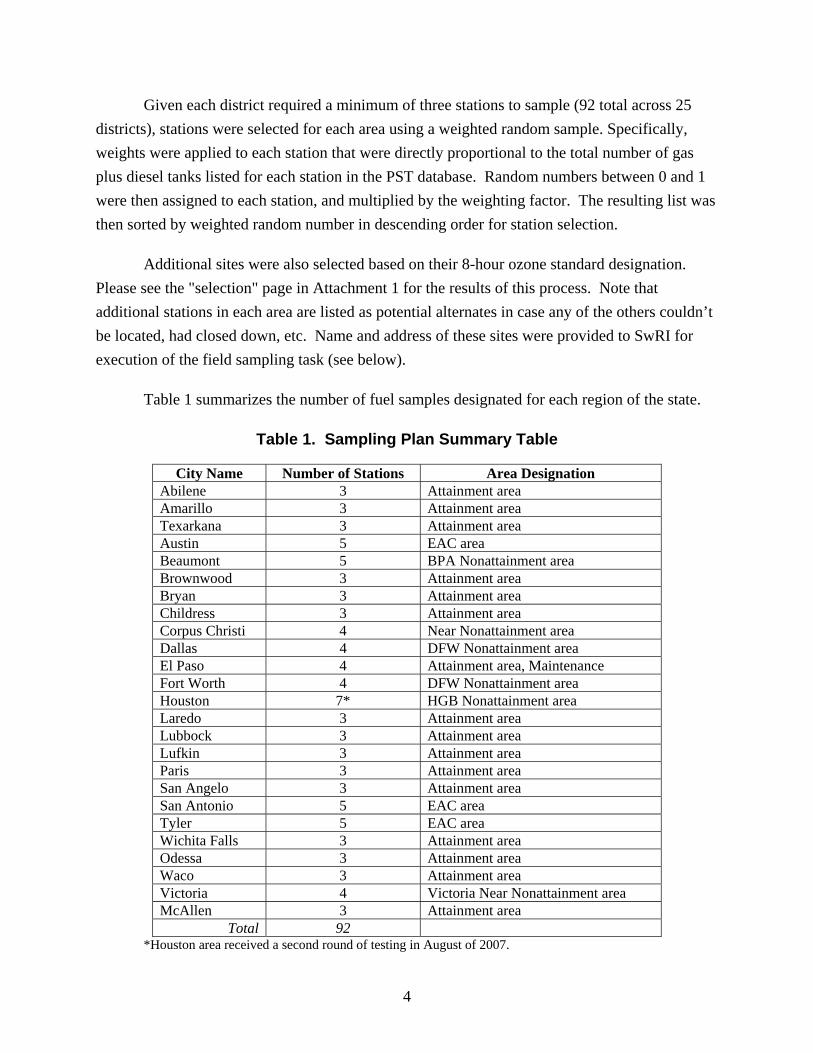
Given each district required a minimum of three stations to sample (92 total across 25 districts), stations were selected for each area using a weighted random sample. Specifically, weights were applied to each station that were directly proportional to the total number of gas plus diesel tanks listed for each station in the PST database. Random numbers between 0 and 1 were then assigned to each station, and multiplied by the weighting factor. The resulting list was then sorted by weighted random number in descending order for station selection.
Additional sites were also selected based on their 8-hour ozone standard designation. Please see the "selection" page in Attachment 1 for the results of this process. Note that additional stations in each area are listed as potential alternates in case any of the others couldn’t be located, had closed down, etc. Name and address of these sites were provided to SwRI for execution of the field sampling task (see below).
Table 1 summarizes the number of fuel samples designated for each region of the state.
Table 1. Sampling Plan Summary Table
City Name Number of Stations Area Designation Abilene 3 Attainment area Amarillo 3 Attainment area Texarkana 3 Attainment area Austin 5 EAC area Beaumont 5 BPA Nonattainment area Brownwood 3 Attainment area Bryan 3 Attainment area Childress 3 Attainment area Corpus Christi 4 Near Nonattainment area Dallas 4 DFW Nonattainment area El Paso 4 Attainment area, Maintenance Fort Worth 4 DFW Nonattainment area Houston 7* HGB Nonattainment area Laredo 3 Attainment area Lubbock 3 Attainment area Lufkin 3 Attainment area Paris 3 Attainment area San Angelo 3 Attainment area San Antonio 5 EAC area Tyler 5 EAC area Wichita Falls 3 Attainment area Odessa 3 Attainment area Waco 3 Attainment area Victoria 4 Victoria Near Nonattainment area McAllen 3 Attainment area
Total 92 *Houston area received a second round of testing in August of 2007.

5
In addition to this initial round of sampling, a second round of testing was conducted in
an attempt to obtain a better understanding of temporal variability of fuel composition within a region. For a subset of fueling stations (the seven located in the Houston area), SwRI conducted a second round of sampling, approximately one month after the first round of sampling, to ensure complete tank turnover. This second round of sampling was intended to make a preliminary assessment of the temporal variability of fuel parameters at the station level.
Sampling and Laboratory Analysis
Objective
This section contains the sampling protocol and laboratory test results for this project.
Under this project, SwRI provided containers and packaging, gasoline and diesel sample acquisition service from retail station pump nozzles, shipping, sample handling and testing for summer fuels in 2007. Service station locations were identified by ERG, as described above.
Retail Station and Sample Collection and Handling Procedures
Independent contractors (IC) working with SwRI acquired the fuels from retail stations. Each IC received written instructions, service station sampling procedures, sample containers, shipping instructions, etc. All contractors were instructed on retail station sample acquisition with special emphasis on sample handling, and safe disposal of flushed gasoline.
SwRI used U.S. Department of Transportation (DOT) and International Air Transport Association (IATA) approved fuel sample containers and shipping cartons. Each carton held four aluminum containers. Boxes are assembled at SwRI by trained staff, and all appropriate shipping materials are provided to IC along with Airborne approved instructions for shipment of hazardous materials.
The containers were delivered cleaned and dried to the independent contractors. IC purged three gallons of gasoline product through the pump nozzle before obtaining a sample or purged ½ gallon of the appropriate fuel immediately after the appropriate grade was purchased by the previous customer. When possible the temperature of the flushed sample was recorded. Immediately after the fuel was flushed from the pump, IC attached a spacer, if needed, to the pump nozzle. The nozzle extension was inserted into the sample container. The pump nozzle was inserted into the extension with slot over the air bleed hole. Sample container was slowly filled through the nozzle extension to 70 to 85% full. The nozzle extension was removed. The seal and
6
cap were inserted in the sample container at once. Checks were performed for leaks. The sample was prepared for air shipment. Contractors recorded the ground cover around the pumps at each station.
When diesel samples were acquired, the independent contractors filled the sample container slowly to 70 to 85% full. The seal and cap was inserted into the sample container at once. Checks for leaks were performed and then the sample was prepared for air shipment.
SwRI used Airborne for sample shipment return to SwRI. Members of the SwRI shipping and receiving team meet regularly with Airborne and attend IATA and International Civil Aviation Association (ICAO) hazardous materials shipping and handling training sessions to keep abreast of current regulations. All samples were chilled.
Sample Locations and Grades of Fuel
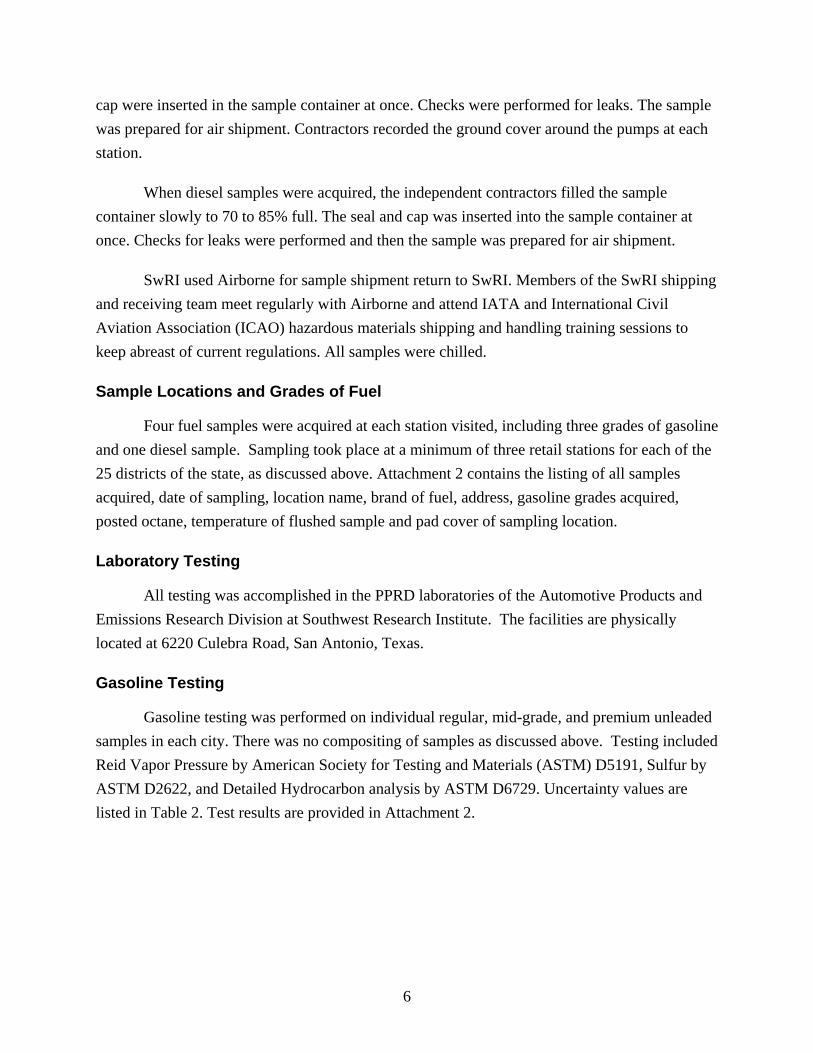
Four fuel samples were acquired at each station visited, including three grades of gasoline and one diesel sample. Sampling took place at a minimum of three retail stations for each of the 25 districts of the state, as discussed above. Attachment 2 contains the listing of all samples acquired, date of sampling, location name, brand of fuel, address, gasoline grades acquired, posted octane, temperature of flushed sample and pad cover of sampling location.
Laboratory Testing
All testing was accomplished in the PPRD laboratories of the Automotive Products and Emissions Research Division at Southwest Research Institute. The facilities are physically located at 6220 Culebra Road, San Antonio, Texas.
Gasoline Testing
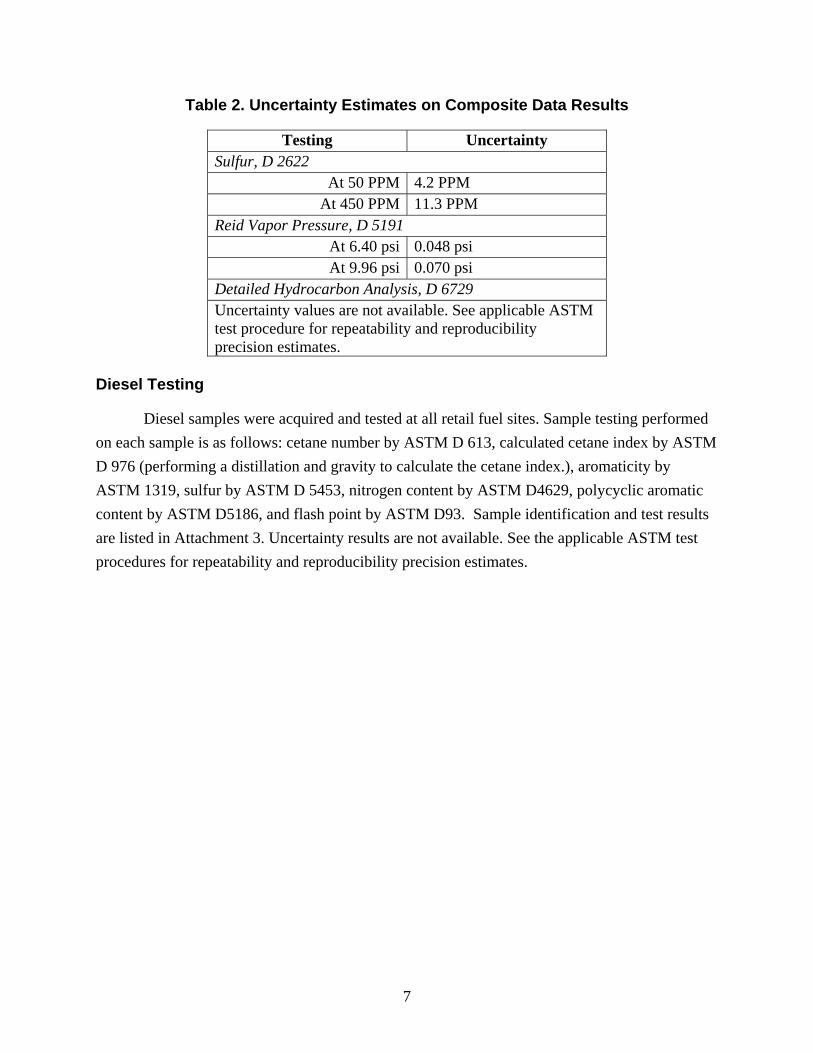
Gasoline testing was performed on individual regular, mid-grade, and premium unleaded samples in each city. There was no compositing of samples as discussed above. Testing included Reid Vapor Pressure by American Society for Testing and Materials (ASTM) D5191, Sulfur by ASTM D2622, and Detailed Hydrocarbon analysis by ASTM D6729. Uncertainty values are listed in Table 2. Test results are provided in Attachment 2.
7
Table 2. Uncertainty Estimates on Composite Data Results
Testing Uncertainty Sulfur, D 2622
At 50 PPM 4.2 PPM At 450 PPM 11.3 PPM
Reid Vapor Pressure, D 5191 At 6.40 psi 0.048 psi At 9.96 psi 0.070 psi
Detailed Hydrocarbon Analysis, D 6729 Uncertainty values are not available. See applicable ASTM test procedure for repeatability and reproducibility precision estimates.
Diesel Testing
Diesel samples were acquired and tested at all retail fuel sites. Sample testing performed on each sample is as follows: cetane number by ASTM D 613, calculated cetane index by ASTM D 976 (performing a distillation and gravity to calculate the cetane index.), aromaticity by ASTM 1319, sulfur by ASTM D 5453, nitrogen content by ASTM D4629, polycyclic aromatic content by ASTM D5186, and flash point by ASTM D93. Sample identification and test results are listed in Attachment 3. Uncertainty results are not available. See the applicable ASTM test procedures for repeatability and reproducibility precision estimates.
8
Updated MOBILE6 Fuel Parameter Input Files for Texas Counties
Overview
ERG used gasoline fuel sample data collected by SwRI to develop updated fuel parameter input data for MOBILE6. Fuel parameter files were developed for each county in Texas using fuel sample data obtained from 92 gasoline and diesel retail locations across the State in the summer of 2007. These files can be used to update the Texas county entries in the next round of EPA’s National Toxics Inventory (NTI).
Methodology
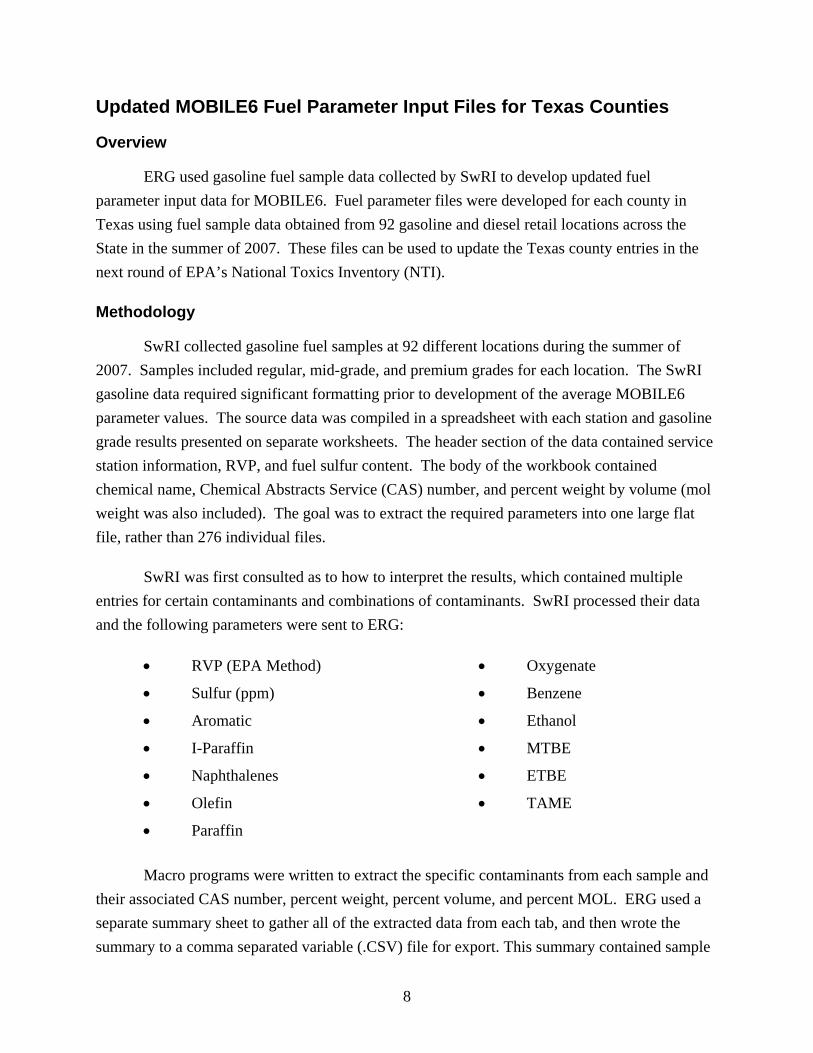
SwRI collected gasoline fuel samples at 92 different locations during the summer of 2007. Samples included regular, mid-grade, and premium grades for each location. The SwRI gasoline data required significant formatting prior to development of the average MOBILE6 parameter values. The source data was compiled in a spreadsheet with each station and gasoline grade results presented on separate worksheets. The header section of the data contained service station information, RVP, and fuel sulfur content. The body of the workbook contained chemical name, Chemical Abstracts Service (CAS) number, and percent weight by volume (mol weight was also included). The goal was to extract the required parameters into one large flat file, rather than 276 individual files.
SwRI was first consulted as to how to interpret the results, which contained multiple entries for certain contaminants and combinations of contaminants. SwRI processed their data and the following parameters were sent to ERG:
• RVP (EPA Method)
• Sulfur (ppm)
• Aromatic
• I-Paraffin
• Naphthalenes
• Olefin
• Paraffin
• Oxygenate
• Benzene
• Ethanol
• MTBE
• ETBE
• TAME
Macro programs were written to extract the specific contaminants from each sample and
their associated CAS number, percent weight, percent volume, and percent MOL. ERG used a separate summary sheet to gather all of the extracted data from each tab, and then wrote the summary to a comma separated variable (.CSV) file for export. This summary contained sample
9
identification number (ID), sample date, survey area, location name, city, zip code, fuel grade, RVP, and sulfur content (ppm).
To extract component data, ERG set up a filter to display compounds of interest (e.g., benzene, ETBE, MTBE, TAME, and EtOH) on each tab. ERG then copied the filtered data into a separate summary sheet (titled “Contams”), and subsequently exported the data to a .CSV file. This summary included sample ID, group code, compound name, CAS #, weight percent, volume percent, and MOL percent.
These files were then processed for further manipulation using SAS™. A query was written to extract station information and along with fuel parameters, resulting in several dependent tables. Six dependent tables were then merged by the station sample ID number assigned by SwRI. Attachment 5 provides the SAS program used.
Since three grades of gasoline were sampled, regular, mid-grade, and premium blend data were extracted from the master file separately. Parameters for RVP, fuel sulfur, benzene, ethanol, MTBE, ETBE, and TAME were then averaged by geographic area. For example, benzene for gasoline was averaged for each of the 25 cities, for regular, mid-grade, and premium blends. Such a process was used for each of the desired parameters.
Next ERG took the SwRI results for the required MOBILE6 fuel parameter inputs and weighted across fuel grades using the latest available sales data from the Petroleum Marketing Annual (Energy Information Administration 2006). This data is available from: http://www.eia.doe.gov/oil_gas/petroleum/data_publications/petroleum_marketing_annual/pma.html
According to Energy Information Administration (EIA) data for Texas in 2006, regular gasoline comprised 88.7% of the market, mid-grade gasoline comprised 3.6% of the market, and premium gasoline comprised 7.7% of the market. These weighting factors were applied to each of the geographic areas for each parameter.
Such a process can easily be modified to include any of the over 50 chemical compounds evaluated in the SwRI sampling program.
The resulting weighted fuel parameter inputs included:
• RVP
• Sulfur (ppm)
10
• Olefins (% vol)
• Aromtaics (% vol)
• Benzene (% vol)
• Oxygentates (% vol)
Additional MOBILE6 fuel input requirements include E200, E300, and oxygenate market
share. SwRI performed distillate analysis, providing the temperatures corresponding to specific sample fractions (e.g., 5%, 10%, 20%, etc.), as shown in Attachment 2. In order to estimate E200 and E300 fractions as required by the MOBILE6 model, ERG performed a simple interpolation of the SwRI distillation data.
However, oxygenate market share information was not available from the SwRI survey, since the number of samples taken were too few to be statistically representative of overall fuel sales volumes in any given area. Therefore MOBILE6 default NTI oxygenate market share data were used for this parameter.
ERG then used the TxDOT mappings, assigning each county in the state to a unique TxDOT district. The county assignments were identical to those developed for the 2005. Figure 1 indicates the TxDOT District boundaries and major city locations.

11
Figure 1. TxDOT Districts and Sampling Areas
12
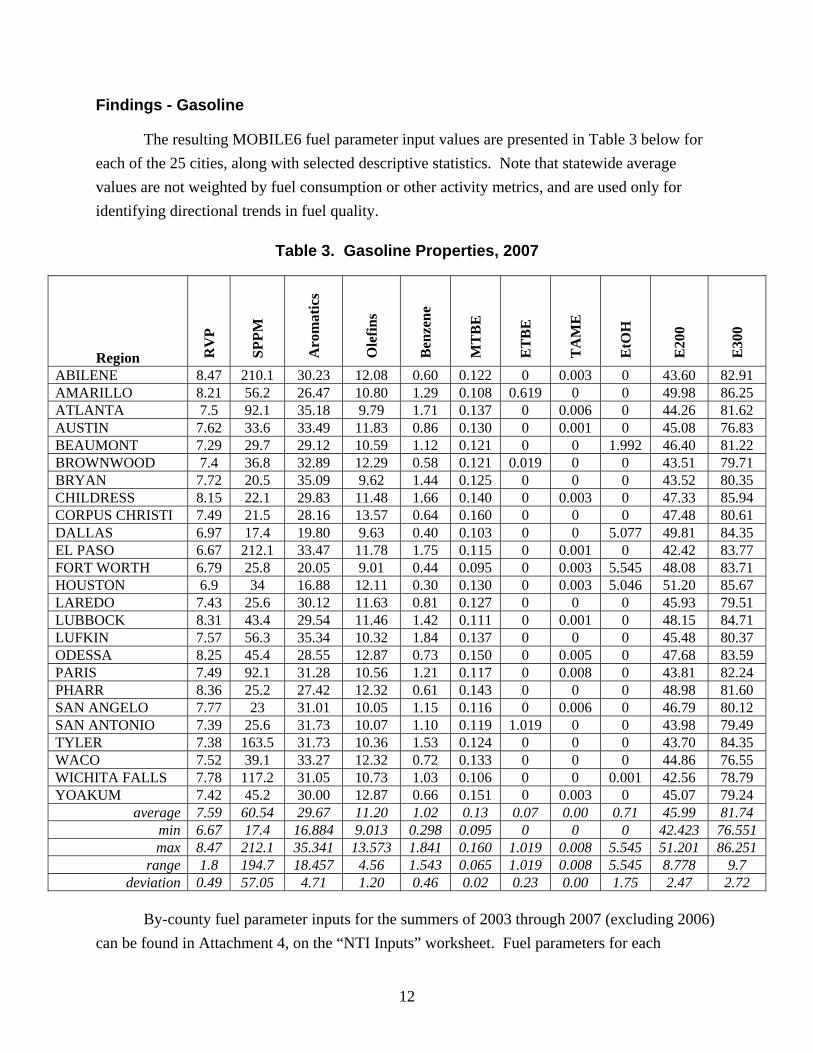
Findings - Gasoline
The resulting MOBILE6 fuel parameter input values are presented in Table 3 below for each of the 25 cities, along with selected descriptive statistics. Note that statewide average values are not weighted by fuel consumption or other activity metrics, and are used only for identifying directional trends in fuel quality.
Table 3. Gasoline Properties, 2007
Region RV
P
SPPM
Aro
mat
ics
Ole
fins
Ben
zene
MT
BE
ET
BE
TA
ME
EtO
H
E20
0
E30
0
ABILENE 8.47 210.1 30.23 12.08 0.60 0.122 0 0.003 0 43.60 82.91 AMARILLO 8.21 56.2 26.47 10.80 1.29 0.108 0.619 0 0 49.98 86.25 ATLANTA 7.5 92.1 35.18 9.79 1.71 0.137 0 0.006 0 44.26 81.62 AUSTIN 7.62 33.6 33.49 11.83 0.86 0.130 0 0.001 0 45.08 76.83 BEAUMONT 7.29 29.7 29.12 10.59 1.12 0.121 0 0 1.992 46.40 81.22 BROWNWOOD 7.4 36.8 32.89 12.29 0.58 0.121 0.019 0 0 43.51 79.71 BRYAN 7.72 20.5 35.09 9.62 1.44 0.125 0 0 0 43.52 80.35 CHILDRESS 8.15 22.1 29.83 11.48 1.66 0.140 0 0.003 0 47.33 85.94 CORPUS CHRISTI 7.49 21.5 28.16 13.57 0.64 0.160 0 0 0 47.48 80.61 DALLAS 6.97 17.4 19.80 9.63 0.40 0.103 0 0 5.077 49.81 84.35 EL PASO 6.67 212.1 33.47 11.78 1.75 0.115 0 0.001 0 42.42 83.77 FORT WORTH 6.79 25.8 20.05 9.01 0.44 0.095 0 0.003 5.545 48.08 83.71 HOUSTON 6.9 34 16.88 12.11 0.30 0.130 0 0.003 5.046 51.20 85.67 LAREDO 7.43 25.6 30.12 11.63 0.81 0.127 0 0 0 45.93 79.51 LUBBOCK 8.31 43.4 29.54 11.46 1.42 0.111 0 0.001 0 48.15 84.71 LUFKIN 7.57 56.3 35.34 10.32 1.84 0.137 0 0 0 45.48 80.37 ODESSA 8.25 45.4 28.55 12.87 0.73 0.150 0 0.005 0 47.68 83.59 PARIS 7.49 92.1 31.28 10.56 1.21 0.117 0 0.008 0 43.81 82.24 PHARR 8.36 25.2 27.42 12.32 0.61 0.143 0 0 0 48.98 81.60 SAN ANGELO 7.77 23 31.01 10.05 1.15 0.116 0 0.006 0 46.79 80.12 SAN ANTONIO 7.39 25.6 31.73 10.07 1.10 0.119 1.019 0 0 43.98 79.49 TYLER 7.38 163.5 31.73 10.36 1.53 0.124 0 0 0 43.70 84.35 WACO 7.52 39.1 33.27 12.32 0.72 0.133 0 0 0 44.86 76.55 WICHITA FALLS 7.78 117.2 31.05 10.73 1.03 0.106 0 0 0.001 42.56 78.79 YOAKUM 7.42 45.2 30.00 12.87 0.66 0.151 0 0.003 0 45.07 79.24
average 7.59 60.54 29.67 11.20 1.02 0.13 0.07 0.00 0.71 45.99 81.74 min 6.67 17.4 16.884 9.013 0.298 0.095 0 0 0 42.423 76.551 max 8.47 212.1 35.341 13.573 1.841 0.160 1.019 0.008 5.545 51.201 86.251
range 1.8 194.7 18.457 4.56 1.543 0.065 1.019 0.008 5.545 8.778 9.7 deviation 0.49 57.05 4.71 1.20 0.46 0.02 0.23 0.00 1.75 2.47 2.72
By-county fuel parameter inputs for the summers of 2003 through 2007 (excluding 2006)
can be found in Attachment 4, on the “NTI Inputs” worksheet. Fuel parameters for each
13
sampling location, weighted across fuel grades and the specific sampling location/county assignments can be found on the “Master_output from SAS program” worksheet.
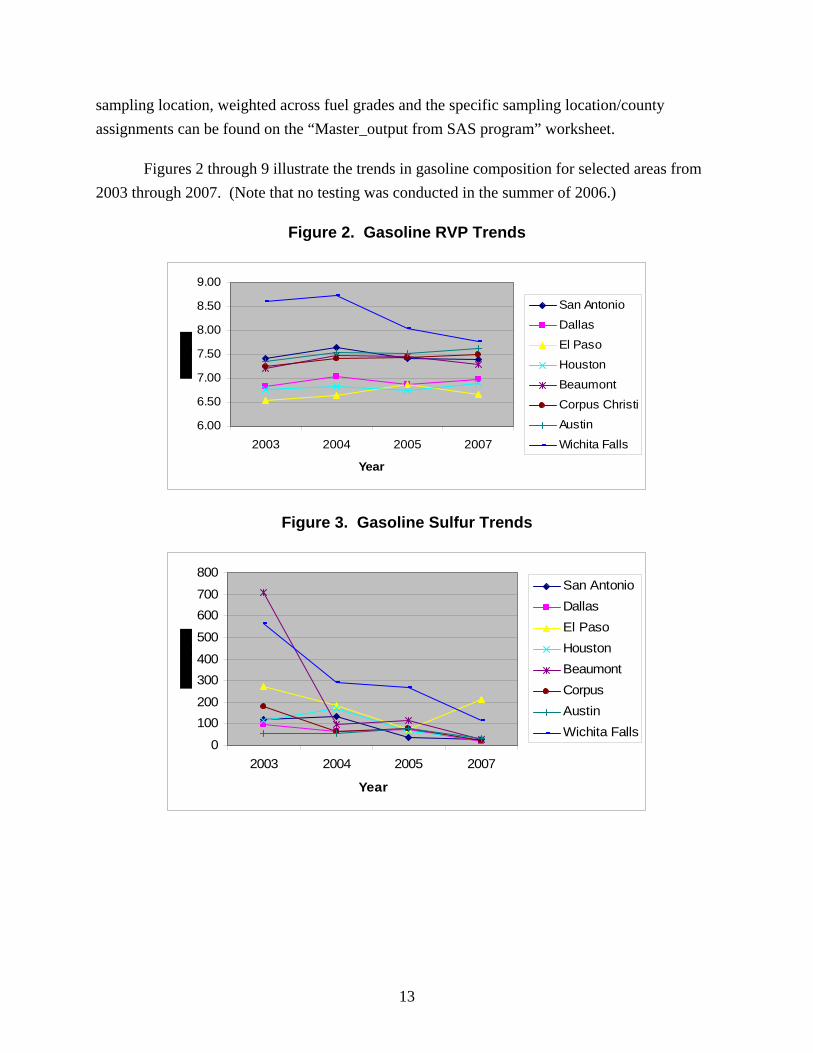
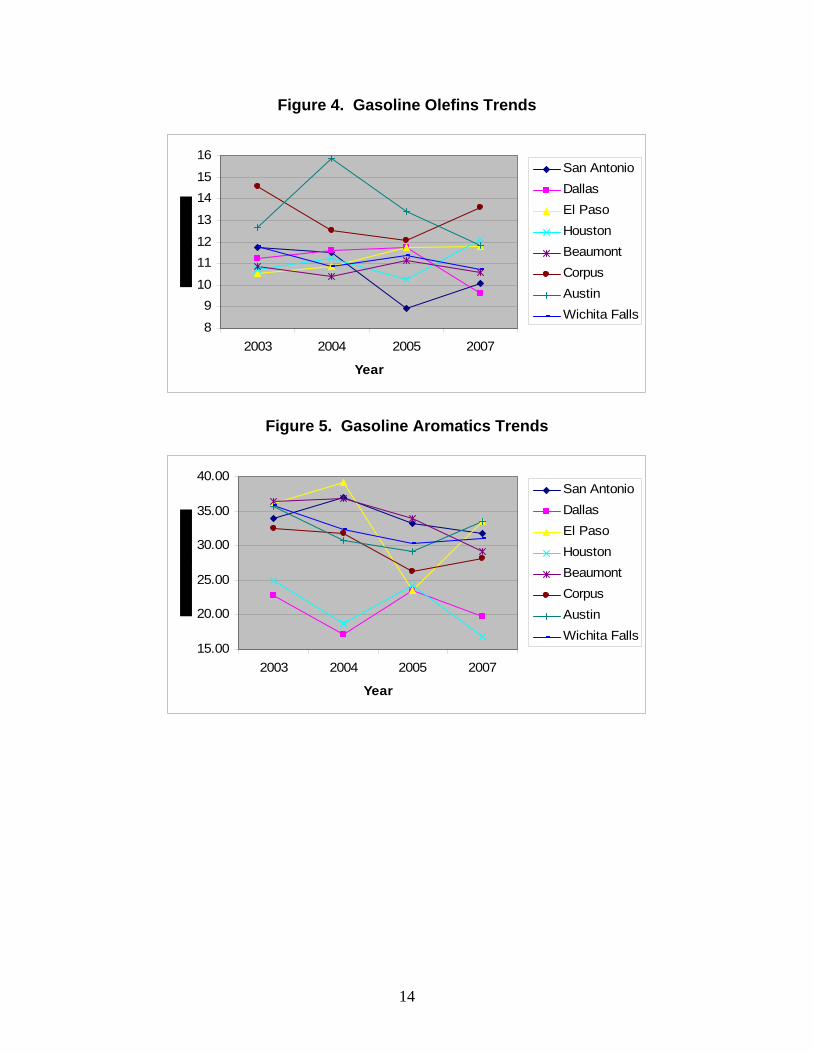
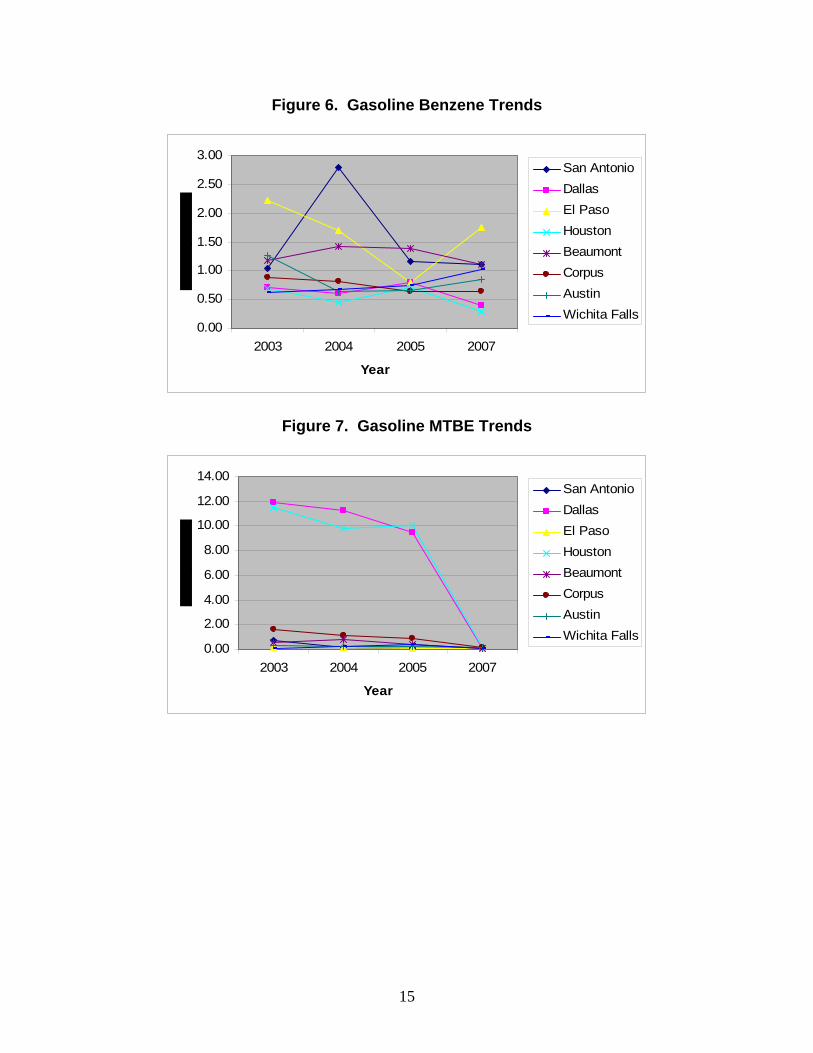
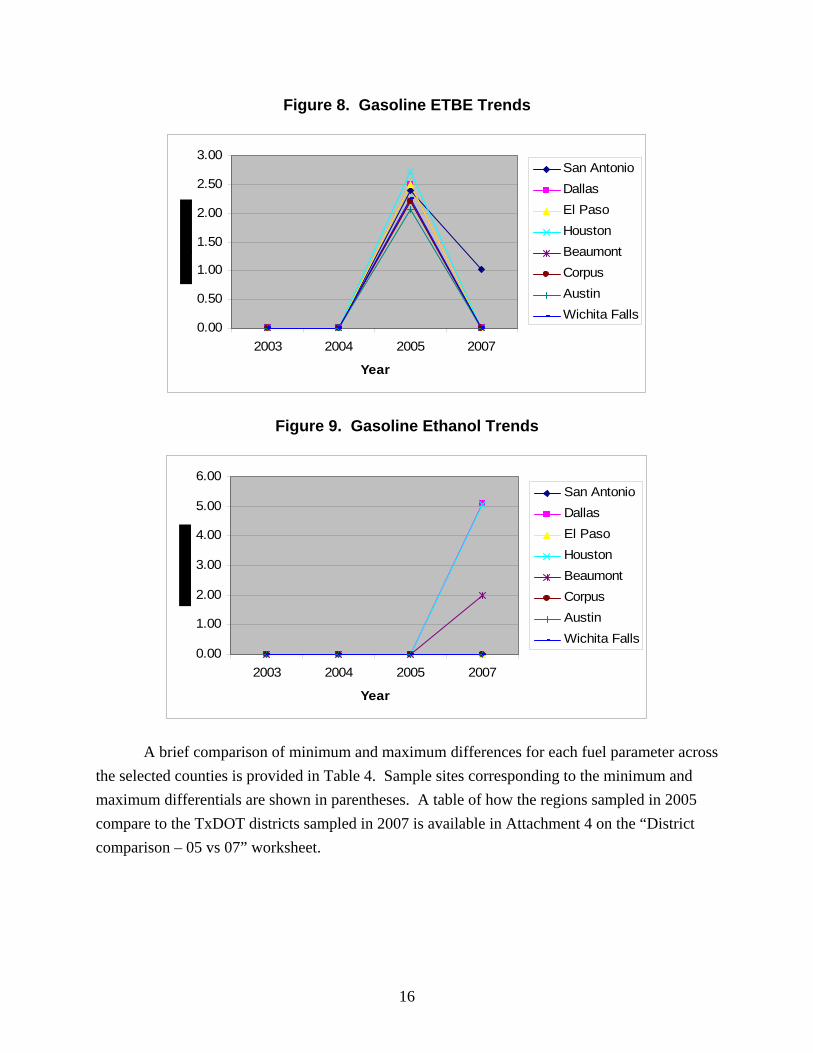
Figures 2 through 9 illustrate the trends in gasoline composition for selected areas from 2003 through 2007. (Note that no testing was conducted in the summer of 2006.)
Figure 2. Gasoline RVP Trends
6.00
6.50
7.00
7.50
8.00
8.50
9.00
2003 2004 2005 2007
Year
San Antonio
Dallas
El Paso
Houston
Beaumont
Corpus Christi
Austin
Wichita Falls
Figure 3. Gasoline Sulfur Trends
0
100200
300400
500
600700
800
2003 2004 2005 2007
Year
San AntonioDallasEl PasoHoustonBeaumontCorpusAustinWichita Falls
14
Figure 4. Gasoline Olefins Trends
8
910
1112
13
1415
16
2003 2004 2005 2007
Year
San AntonioDallasEl PasoHoustonBeaumontCorpusAustinWichita Falls
Figure 5. Gasoline Aromatics Trends
15.00
20.00
25.00
30.00
35.00
40.00
2003 2004 2005 2007
Year
San AntonioDallasEl PasoHoustonBeaumontCorpusAustinWichita Falls
15
Figure 6. Gasoline Benzene Trends
0.00
0.50
1.00
1.50
2.00
2.50
3.00
2003 2004 2005 2007
Year
San AntonioDallasEl PasoHoustonBeaumontCorpusAustinWichita Falls
Figure 7. Gasoline MTBE Trends
0.00
2.00
4.00
6.00
8.00
10.00
12.00
14.00
2003 2004 2005 2007
Year
San AntonioDallasEl PasoHoustonBeaumontCorpusAustinWichita Falls
16
Figure 8. Gasoline ETBE Trends
0.00
0.50
1.00
1.50
2.00
2.50
3.00
2003 2004 2005 2007
Year
San AntonioDallasEl PasoHoustonBeaumontCorpusAustinWichita Falls
Figure 9. Gasoline Ethanol Trends
0.00
1.00
2.00
3.00
4.00
5.00
6.00
2003 2004 2005 2007
Year
San AntonioDallasEl PasoHoustonBeaumontCorpusAustinWichita Falls
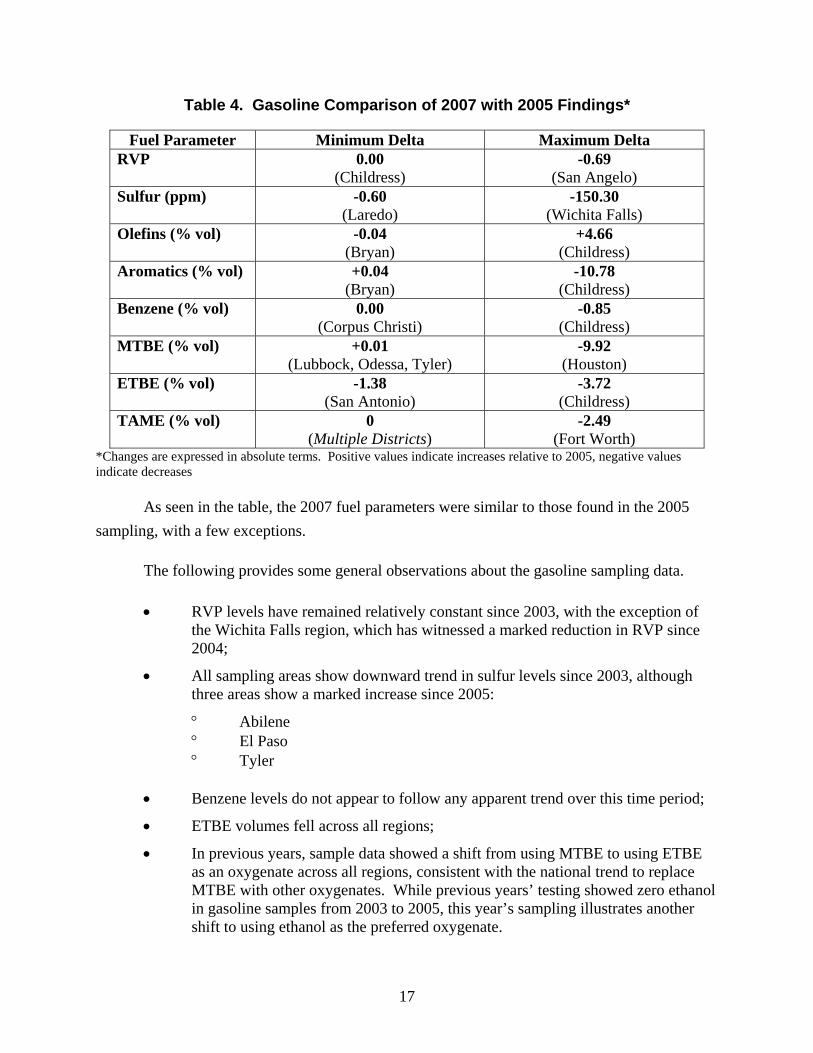
A brief comparison of minimum and maximum differences for each fuel parameter across the selected counties is provided in Table 4. Sample sites corresponding to the minimum and maximum differentials are shown in parentheses. A table of how the regions sampled in 2005 compare to the TxDOT districts sampled in 2007 is available in Attachment 4 on the “District comparison – 05 vs 07” worksheet.
17
Table 4. Gasoline Comparison of 2007 with 2005 Findings*
Fuel Parameter Minimum Delta Maximum Delta RVP 0.00
(Childress) -0.69
(San Angelo) Sulfur (ppm) -0.60
(Laredo) -150.30
(Wichita Falls) Olefins (% vol) -0.04
(Bryan) +4.66
(Childress) Aromatics (% vol) +0.04
(Bryan) -10.78
(Childress) Benzene (% vol) 0.00
(Corpus Christi) -0.85
(Childress) MTBE (% vol) +0.01
(Lubbock, Odessa, Tyler) -9.92
(Houston) ETBE (% vol) -1.38
(San Antonio) -3.72
(Childress) TAME (% vol) 0
(Multiple Districts) -2.49
(Fort Worth) *Changes are expressed in absolute terms. Positive values indicate increases relative to 2005, negative values indicate decreases
As seen in the table, the 2007 fuel parameters were similar to those found in the 2005 sampling, with a few exceptions.
The following provides some general observations about the gasoline sampling data.
• RVP levels have remained relatively constant since 2003, with the exception of the Wichita Falls region, which has witnessed a marked reduction in RVP since 2004;
• All sampling areas show downward trend in sulfur levels since 2003, although three areas show a marked increase since 2005:
° Abilene ° El Paso ° Tyler
• Benzene levels do not appear to follow any apparent trend over this time period;
• ETBE volumes fell across all regions;
• In previous years, sample data showed a shift from using MTBE to using ETBE as an oxygenate across all regions, consistent with the national trend to replace MTBE with other oxygenates. While previous years’ testing showed zero ethanol in gasoline samples from 2003 to 2005, this year’s sampling illustrates another shift to using ethanol as the preferred oxygenate.

18
Findings - Diesel
For diesel fuel the analysis focused on cetane, aromatics, specific gravity, T50 (ºF), olefins, saturates, and fuel sulfur. Summary results for 2007 are shown in Table 5, with selected descriptive statistics.

19
Table 5. Diesel Fuel Properties, 2007
Region Aromatics,
% Vol Olefins, % Vol
Saturate, % Vol
Sulfur, ppm
Cetane No.
Specific Gravity
T50, deg F
ABILENE 26.60 5.00 68.40 5.67 45.83 0.84 503.10 AMARILLO 17.70 2.20 80.10 5.30 50.60 0.83 490.37 ATLANTA 24.83 2.20 72.97 9.80 49.60 0.84 501.80 AUSTIN 19.76 5.48 74.76 6.36 50.50 0.84 501.64 BEAUMONT 27.00 3.90 69.10 5.82 48.04 0.85 509.00 BROWNWOOD 20.20 2.10 77.70 6.60 52.63 0.84 501.23 BRYAN 23.87 4.67 71.47 6.23 48.77 0.84 495.67 CHILDRESS 17.17 4.87 77.97 4.33 50.37 0.83 498.73 CORPUS CHRISTI 19.58 7.90 72.53 296.60 47.55 0.83 474.10 DALLAS 20.97 8.00 71.03 6.90 50.90 0.84 508.57 EL PASO 21.68 2.18 76.15 73.90 48.00 0.84 505.73 FORT WORTH 25.60 4.20 70.20 5.80 45.98 0.85 510.70 HOUSTON 23.22 4.99 71.79 39.33 47.44 0.85 512.27 LAREDO 17.37 5.20 77.43 96.23 50.83 0.83 487.10 LUBBOCK 20.57 2.40 77.03 4.50 49.83 0.84 491.00 LUFKIN 27.20 3.23 69.57 6.00 45.10 0.85 501.23 ODESSA 20.10 2.90 77.00 5.37 46.40 0.85 505.27 PARIS 24.13 2.80 73.07 6.43 47.17 0.84 498.47 PHARR 21.53 5.10 73.37 280.93 52.17 0.83 473.70 SAN ANGELO 22.00 2.57 75.43 4.30 47.83 0.84 491.97 SAN ANTONIO 19.10 4.68 76.22 76.10 48.14 0.84 488.50 TYLER 20.80 4.28 74.92 7.96 49.44 0.83 473.04 WACO 18.27 5.23 76.50 6.20 51.43 0.84 498.70 WICHITA FALLS 24.97 2.30 72.73 6.07 50.23 0.84 505.13 YOAKUM 18.00 7.38 74.63 194.98 47.38 0.84 490.45
average 21.69 4.23 74.08 46.71 48.89 0.84 496.70 min 17.17 2.10 68.40 4.30 45.10 0.83 473.04 max 27.20 8.00 80.10 296.60 52.63 0.85 512.27
range 10.03 5.90 11.70 292.30 7.53 0.02 39.23 deviation 3.13 1.77 3.11 84.93 2.05 0.01 11.17
Figures 10 through 16 illustrate the diesel composition trends from 2003 through 2007.
(Note that no testing was conducted in the summer of 2006.)


21
Figure 10. Diesel Aromatics Trends
15
20
25
30
35
40
45
50
2003 2004 2005 2007
Year
AustinBeaumontCorpus ChristiDallasEl PasoHoustonSan AntonioWichita Falls
Figure 11. Diesel Olefins Trends
0123456789
2003 2004 2005 2007
Year
AustinBeaumontCorpus ChristiDallasEl PasoHoustonSan AntonioWichita Falls
22
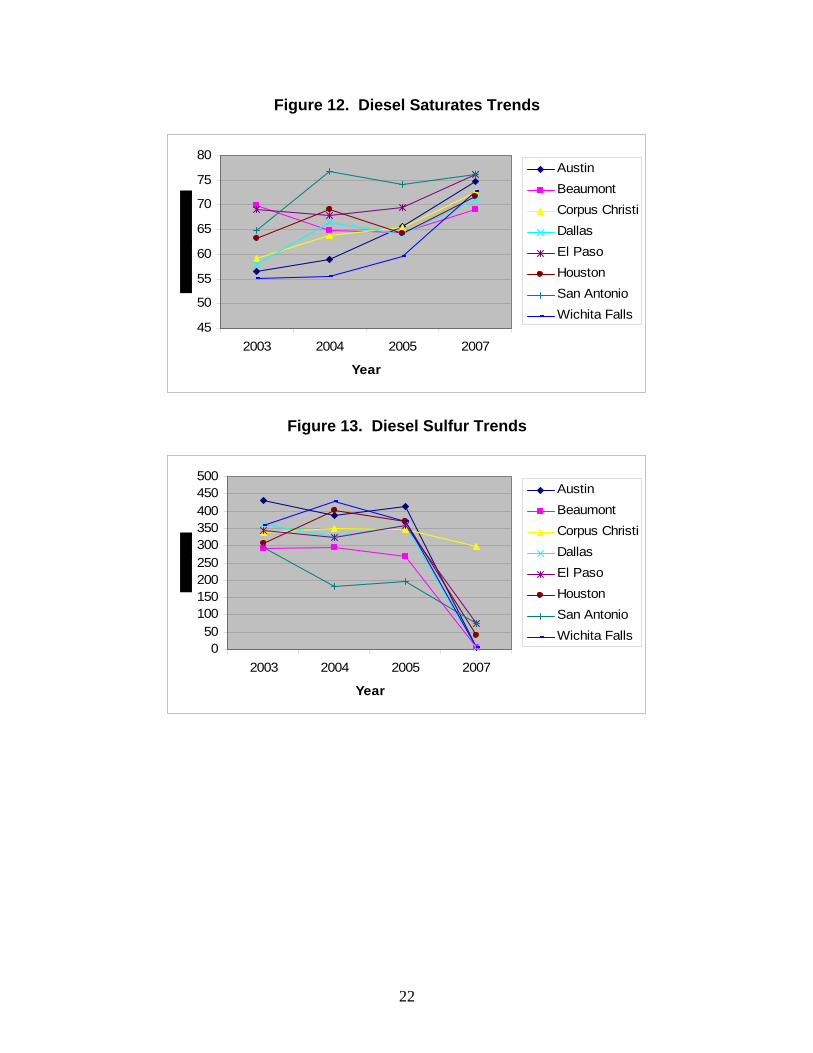
Figure 12. Diesel Saturates Trends
45
50
55
60
65
70
75
80
2003 2004 2005 2007
Year
AustinBeaumontCorpus ChristiDallasEl PasoHoustonSan AntonioWichita Falls
Figure 13. Diesel Sulfur Trends
050
100150200250300350400450500
2003 2004 2005 2007
Year
AustinBeaumontCorpus ChristiDallasEl PasoHoustonSan AntonioWichita Falls

23
Figure 14. Diesel Cetane Trends
40
43
46
49
52
55
2003 2004 2005 2007
Year
AustinBeaumontCorpus ChristiDallasEl PasoHoustonSan AntonioWichita Falls
Figure 15. Diesel Specific Gravity Trends
0.81
0.82
0.83
0.84
0.85
0.86
0.87
0.88
2003 2004 2005 2007
Year
AustinBeaumontCorpus ChristiDallasEl PasoHoustonSan AntonioWichita Falls
24
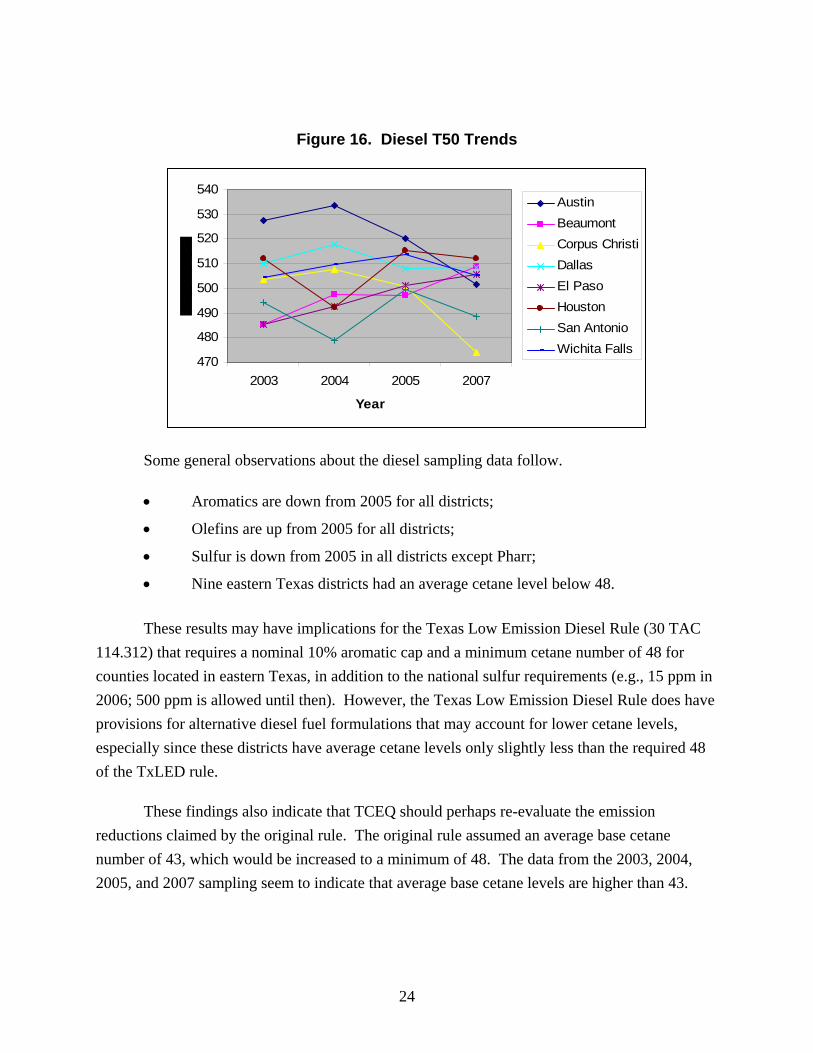
Figure 16. Diesel T50 Trends
470
480
490
500
510
520
530
540
2003 2004 2005 2007
Year
AustinBeaumontCorpus ChristiDallasEl PasoHoustonSan AntonioWichita Falls
Some general observations about the diesel sampling data follow.
• Aromatics are down from 2005 for all districts;
• Olefins are up from 2005 for all districts;
• Sulfur is down from 2005 in all districts except Pharr;
• Nine eastern Texas districts had an average cetane level below 48.
These results may have implications for the Texas Low Emission Diesel Rule (30 TAC
114.312) that requires a nominal 10% aromatic cap and a minimum cetane number of 48 for counties located in eastern Texas, in addition to the national sulfur requirements (e.g., 15 ppm in 2006; 500 ppm is allowed until then). However, the Texas Low Emission Diesel Rule does have provisions for alternative diesel fuel formulations that may account for lower cetane levels, especially since these districts have average cetane levels only slightly less than the required 48 of the TxLED rule.
These findings also indicate that TCEQ should perhaps re-evaluate the emission reductions claimed by the original rule. The original rule assumed an average base cetane number of 43, which would be increased to a minimum of 48. The data from the 2003, 2004, 2005, and 2007 sampling seem to indicate that average base cetane levels are higher than 43.
25
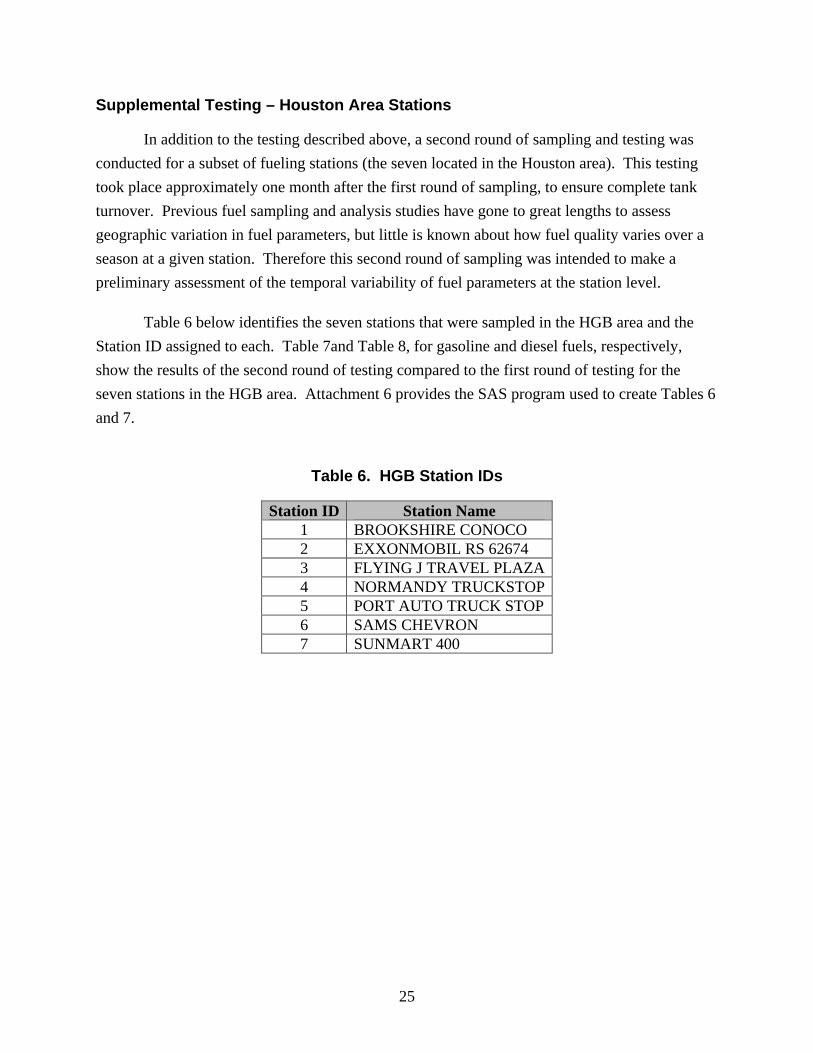
Supplemental Testing – Houston Area Stations
In addition to the testing described above, a second round of sampling and testing was conducted for a subset of fueling stations (the seven located in the Houston area). This testing took place approximately one month after the first round of sampling, to ensure complete tank turnover. Previous fuel sampling and analysis studies have gone to great lengths to assess geographic variation in fuel parameters, but little is known about how fuel quality varies over a season at a given station. Therefore this second round of sampling was intended to make a preliminary assessment of the temporal variability of fuel parameters at the station level.
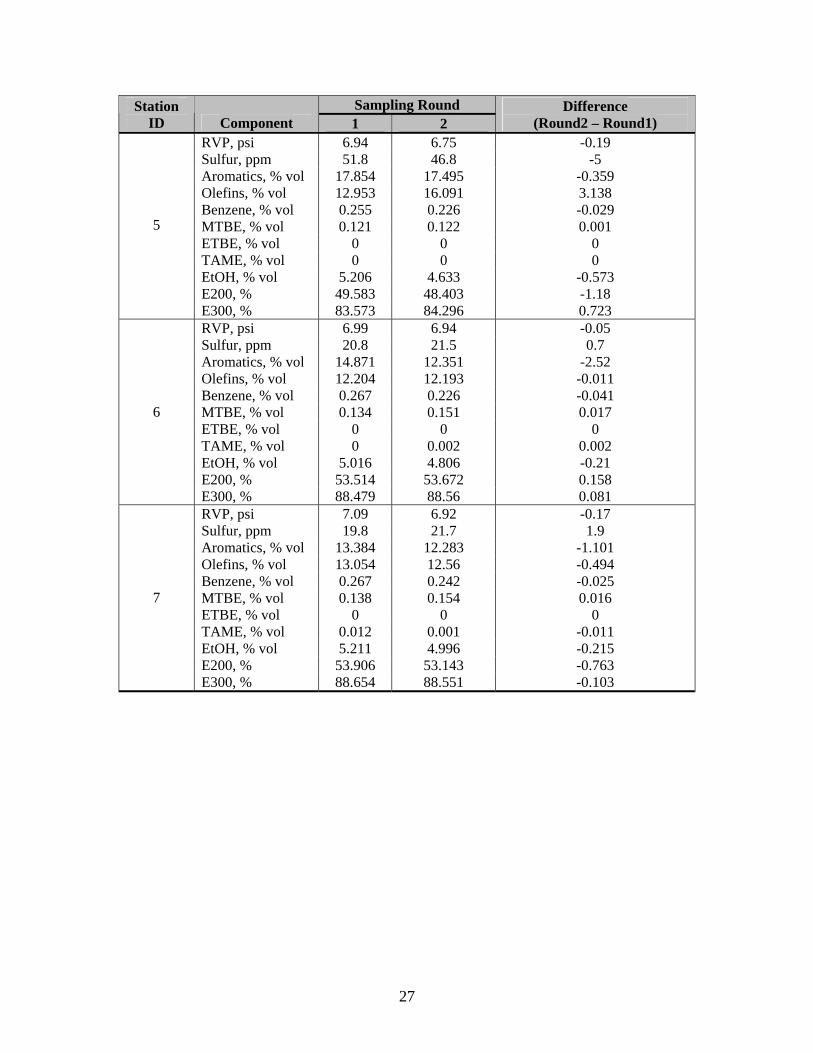
Table 6 below identifies the seven stations that were sampled in the HGB area and the Station ID assigned to each. Table 7and Table 8, for gasoline and diesel fuels, respectively, show the results of the second round of testing compared to the first round of testing for the seven stations in the HGB area. Attachment 6 provides the SAS program used to create Tables 6 and 7.
Table 6. HGB Station IDs
Station ID Station Name 1 BROOKSHIRE CONOCO 2 EXXONMOBIL RS 62674 3 FLYING J TRAVEL PLAZA4 NORMANDY TRUCKSTOP5 PORT AUTO TRUCK STOP6 SAMS CHEVRON 7 SUNMART 400
26
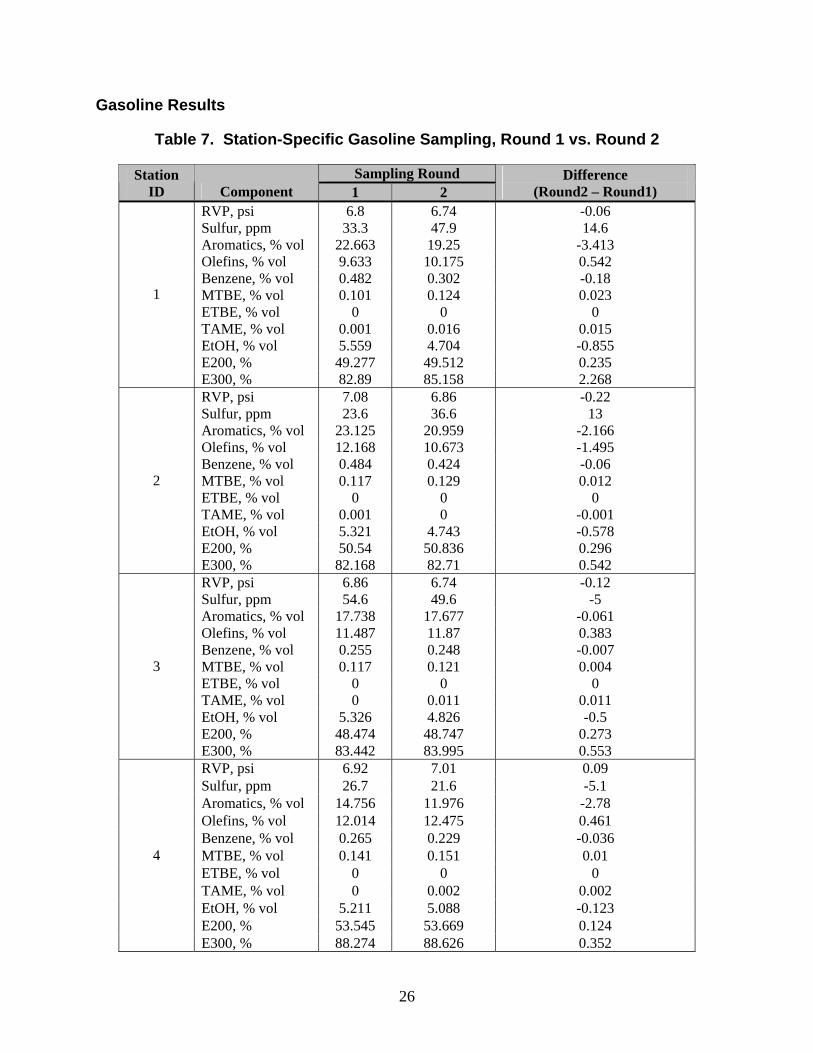
Gasoline Results
Table 7. Station-Specific Gasoline Sampling, Round 1 vs. Round 2
Sampling Round Station ID Component 1 2
Difference (Round2 – Round1)
RVP, psi 6.8 6.74 -0.06 Sulfur, ppm 33.3 47.9 14.6 Aromatics, % vol 22.663 19.25 -3.413 Olefins, % vol 9.633 10.175 0.542 Benzene, % vol 0.482 0.302 -0.18 MTBE, % vol 0.101 0.124 0.023 ETBE, % vol 0 0 0 TAME, % vol 0.001 0.016 0.015 EtOH, % vol 5.559 4.704 -0.855 E200, % 49.277 49.512 0.235
1
E300, % 82.89 85.158 2.268 RVP, psi 7.08 6.86 -0.22 Sulfur, ppm 23.6 36.6 13 Aromatics, % vol 23.125 20.959 -2.166 Olefins, % vol 12.168 10.673 -1.495 Benzene, % vol 0.484 0.424 -0.06 MTBE, % vol 0.117 0.129 0.012 ETBE, % vol 0 0 0 TAME, % vol 0.001 0 -0.001 EtOH, % vol 5.321 4.743 -0.578 E200, % 50.54 50.836 0.296
2
E300, % 82.168 82.71 0.542 RVP, psi 6.86 6.74 -0.12 Sulfur, ppm 54.6 49.6 -5 Aromatics, % vol 17.738 17.677 -0.061 Olefins, % vol 11.487 11.87 0.383 Benzene, % vol 0.255 0.248 -0.007 MTBE, % vol 0.117 0.121 0.004 ETBE, % vol 0 0 0 TAME, % vol 0 0.011 0.011 EtOH, % vol 5.326 4.826 -0.5 E200, % 48.474 48.747 0.273
3
E300, % 83.442 83.995 0.553 RVP, psi 6.92 7.01 0.09 Sulfur, ppm 26.7 21.6 -5.1 Aromatics, % vol 14.756 11.976 -2.78 Olefins, % vol 12.014 12.475 0.461 Benzene, % vol 0.265 0.229 -0.036 MTBE, % vol 0.141 0.151 0.01 ETBE, % vol 0 0 0 TAME, % vol 0 0.002 0.002 EtOH, % vol 5.211 5.088 -0.123 E200, % 53.545 53.669 0.124
4
E300, % 88.274 88.626 0.352
27
Sampling Round Station ID Component 1 2
Difference (Round2 – Round1)
RVP, psi 6.94 6.75 -0.19 Sulfur, ppm 51.8 46.8 -5 Aromatics, % vol 17.854 17.495 -0.359 Olefins, % vol 12.953 16.091 3.138 Benzene, % vol 0.255 0.226 -0.029 MTBE, % vol 0.121 0.122 0.001 ETBE, % vol 0 0 0 TAME, % vol 0 0 0 EtOH, % vol 5.206 4.633 -0.573 E200, % 49.583 48.403 -1.18
5
E300, % 83.573 84.296 0.723 RVP, psi 6.99 6.94 -0.05 Sulfur, ppm 20.8 21.5 0.7 Aromatics, % vol 14.871 12.351 -2.52 Olefins, % vol 12.204 12.193 -0.011 Benzene, % vol 0.267 0.226 -0.041 MTBE, % vol 0.134 0.151 0.017 ETBE, % vol 0 0 0 TAME, % vol 0 0.002 0.002 EtOH, % vol 5.016 4.806 -0.21 E200, % 53.514 53.672 0.158
6
E300, % 88.479 88.56 0.081 RVP, psi 7.09 6.92 -0.17 Sulfur, ppm 19.8 21.7 1.9 Aromatics, % vol 13.384 12.283 -1.101 Olefins, % vol 13.054 12.56 -0.494 Benzene, % vol 0.267 0.242 -0.025 MTBE, % vol 0.138 0.154 0.016 ETBE, % vol 0 0 0 TAME, % vol 0.012 0.001 -0.011 EtOH, % vol 5.211 4.996 -0.215 E200, % 53.906 53.143 -0.763
7
E300, % 88.654 88.551 -0.103
28
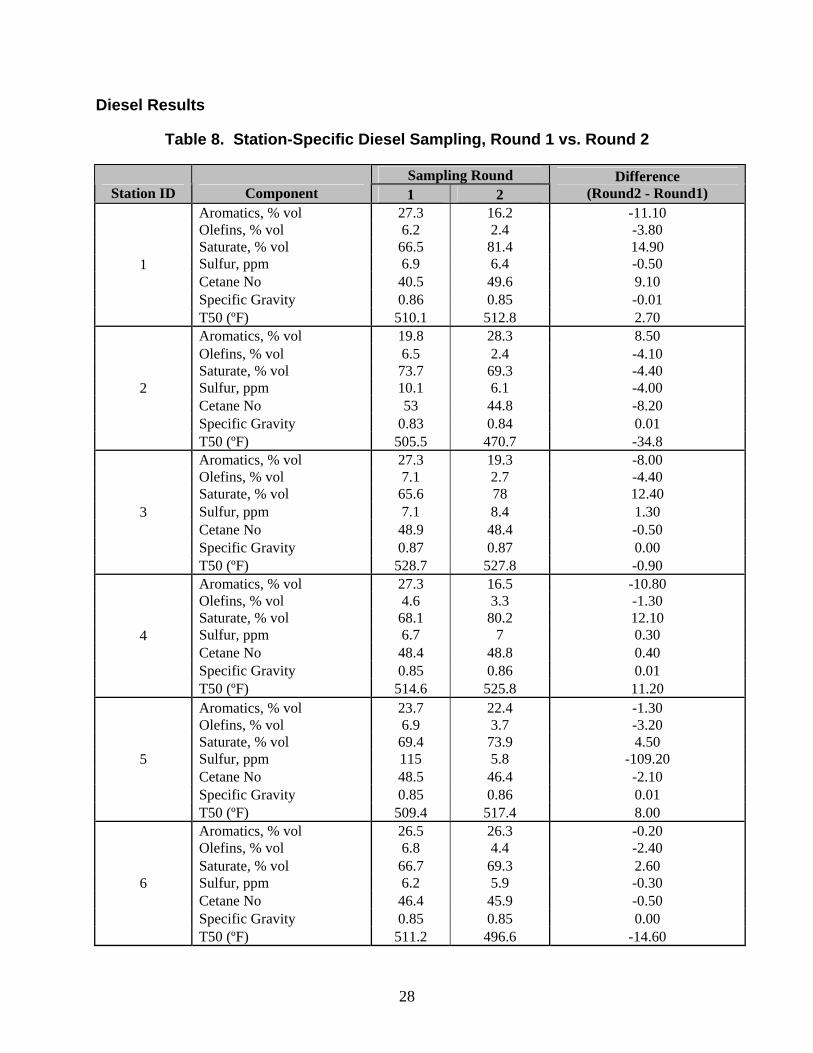
Diesel Results
Table 8. Station-Specific Diesel Sampling, Round 1 vs. Round 2
Sampling Round Station ID Component 1 2
Difference (Round2 - Round1)
Aromatics, % vol 27.3 16.2 -11.10 Olefins, % vol 6.2 2.4 -3.80 Saturate, % vol 66.5 81.4 14.90 Sulfur, ppm 6.9 6.4 -0.50 Cetane No 40.5 49.6 9.10 Specific Gravity 0.86 0.85 -0.01
1
T50 (ºF) 510.1 512.8 2.70 Aromatics, % vol 19.8 28.3 8.50 Olefins, % vol 6.5 2.4 -4.10 Saturate, % vol 73.7 69.3 -4.40 Sulfur, ppm 10.1 6.1 -4.00 Cetane No 53 44.8 -8.20 Specific Gravity 0.83 0.84 0.01
2
T50 (ºF) 505.5 470.7 -34.8 Aromatics, % vol 27.3 19.3 -8.00 Olefins, % vol 7.1 2.7 -4.40 Saturate, % vol 65.6 78 12.40 Sulfur, ppm 7.1 8.4 1.30 Cetane No 48.9 48.4 -0.50 Specific Gravity 0.87 0.87 0.00
3
T50 (ºF) 528.7 527.8 -0.90 Aromatics, % vol 27.3 16.5 -10.80 Olefins, % vol 4.6 3.3 -1.30 Saturate, % vol 68.1 80.2 12.10 Sulfur, ppm 6.7 7 0.30 Cetane No 48.4 48.8 0.40 Specific Gravity 0.85 0.86 0.01
4
T50 (ºF) 514.6 525.8 11.20 Aromatics, % vol 23.7 22.4 -1.30 Olefins, % vol 6.9 3.7 -3.20 Saturate, % vol 69.4 73.9 4.50 Sulfur, ppm 115 5.8 -109.20 Cetane No 48.5 46.4 -2.10 Specific Gravity 0.85 0.86 0.01
5
T50 (ºF) 509.4 517.4 8.00 Aromatics, % vol 26.5 26.3 -0.20 Olefins, % vol 6.8 4.4 -2.40 Saturate, % vol 66.7 69.3 2.60 Sulfur, ppm 6.2 5.9 -0.30 Cetane No 46.4 45.9 -0.50 Specific Gravity 0.85 0.85 0.00
6
T50 (ºF) 511.2 496.6 -14.60
29
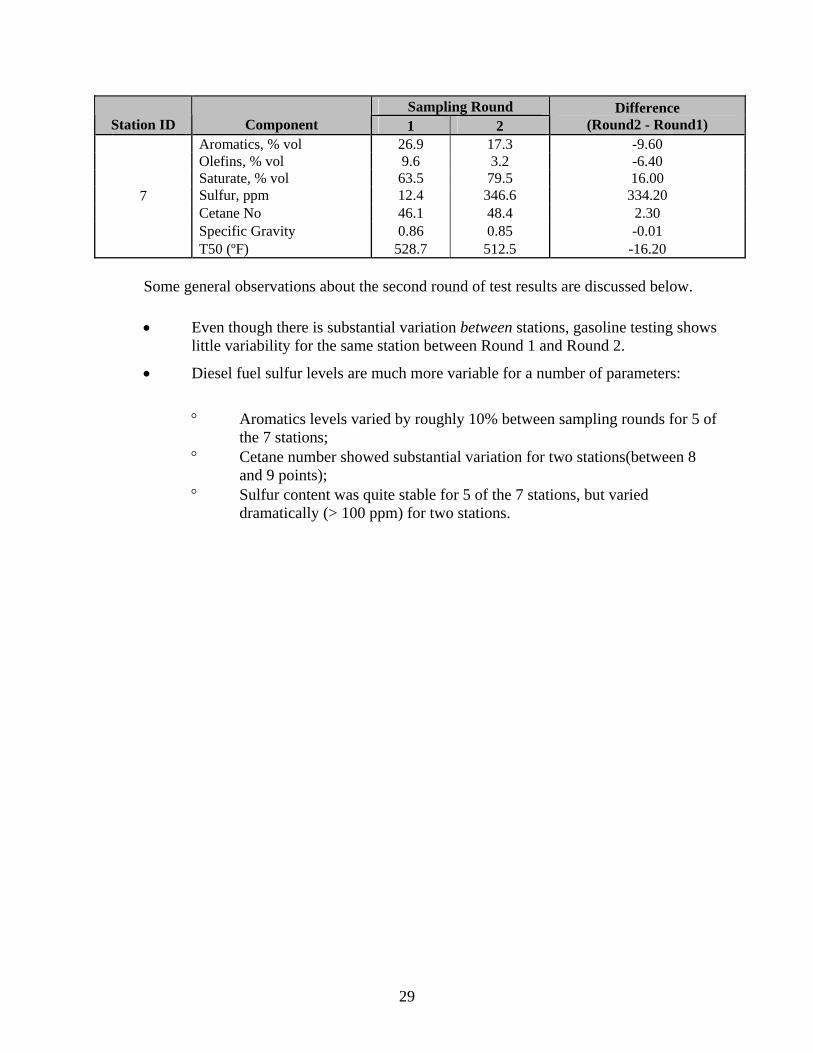
Sampling Round Station ID Component 1 2
Difference (Round2 - Round1)
Aromatics, % vol 26.9 17.3 -9.60 Olefins, % vol 9.6 3.2 -6.40 Saturate, % vol 63.5 79.5 16.00 Sulfur, ppm 12.4 346.6 334.20 Cetane No 46.1 48.4 2.30 Specific Gravity 0.86 0.85 -0.01
7
T50 (ºF) 528.7 512.5 -16.20
Some general observations about the second round of test results are discussed below.
• Even though there is substantial variation between stations, gasoline testing shows little variability for the same station between Round 1 and Round 2.
• Diesel fuel sulfur levels are much more variable for a number of parameters:
° Aromatics levels varied by roughly 10% between sampling rounds for 5 of
the 7 stations; ° Cetane number showed substantial variation for two stations(between 8
and 9 points); ° Sulfur content was quite stable for 5 of the 7 stations, but varied
dramatically (> 100 ppm) for two stations.
30
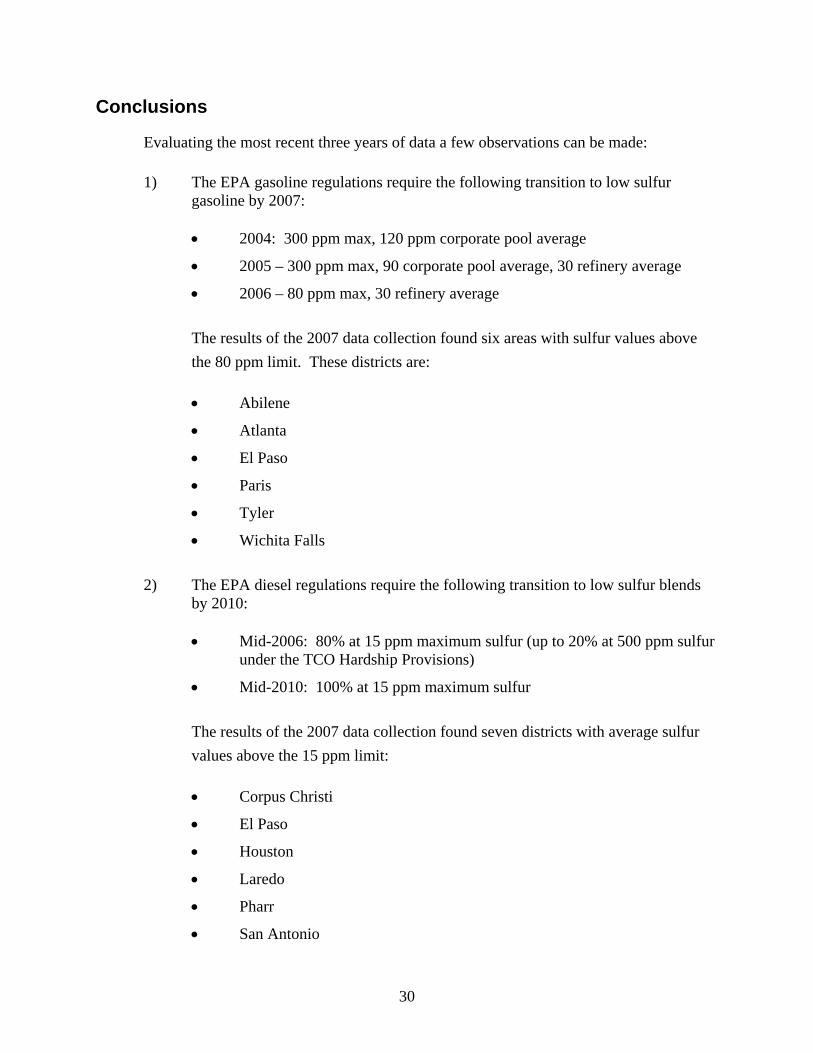
Conclusions
Evaluating the most recent three years of data a few observations can be made:
1) The EPA gasoline regulations require the following transition to low sulfur gasoline by 2007:
• 2004: 300 ppm max, 120 ppm corporate pool average
• 2005 – 300 ppm max, 90 corporate pool average, 30 refinery average
• 2006 – 80 ppm max, 30 refinery average
The results of the 2007 data collection found six areas with sulfur values above the 80 ppm limit. These districts are:
• Abilene
• Atlanta
• El Paso
• Paris
• Tyler
• Wichita Falls
2) The EPA diesel regulations require the following transition to low sulfur blends
by 2010:
• Mid-2006: 80% at 15 ppm maximum sulfur (up to 20% at 500 ppm sulfur under the TCO Hardship Provisions)
• Mid-2010: 100% at 15 ppm maximum sulfur
The results of the 2007 data collection found seven districts with average sulfur values above the 15 ppm limit:
• Corpus Christi
• El Paso
• Houston
• Laredo
• Pharr
• San Antonio
31
• Yoakum
3) The preliminary analysis of temporal variability at the station level, as evidenced
in the second round test results for the Houston area, appear to indicate low variability for gasoline fuel parameters, but potentially very high variability for cetane number and sulfur content for diesel fuel. While the limited sample size does not allow for a definitive statistical analysis of these results, we believe future investigation of diesel fuel parameter variability is warranted.