appendix a. quality assurance resultsftp.sccwrp.org/pub/download/documents/technical... · stream...
TRANSCRIPT

A-1
APPENDIX A. QUALITY ASSURANCE RESULTS

A-2
A1. QUALITY ASSURANCE/QUALITY CONTROL METHODS
The section summarizes the methods used to meet the objectives of the San Diego Reference
Stream study, including sampling procedures, laboratory analysis, and Quality Assurance/
Quality Control (QA/QC) procedures. Data collected as part of the research study was
required to be compatible with the SWAMP quality assurance standards. This required an
additional 10 to 15% of samples collected for field and laboratory quality assurance samples.
Field QA/QC samples were used to evaluate potential contamination and sampling error
occurring during sample collection. Field QA/QC processes included equipment calibration,
field protocols to meet analytical holding times, field duplicates (FD), and field blanks (FB).
Laboratory QA/QC samples were used to evaluate the analytical process for contamination,
accuracy, and reproducibility. Internal laboratory quality control checks included procedural
blanks, blank spikes (BS), matrix spike/matrix spike duplicate (MS/MSDs), and duplicates.
A1.1 Field Equipment Verification and Sampling Procedures
This section discusses the calibration, inspection, and maintenance requirements of the
equipment used in the San Diego Reference Stream monitoring effort, as well as the
requirements governing sampling procedures for the program.
A1.1.1 Field Equipment Calibration, Inspection, and Maintenance
QA/QC activities for the monitoring equipment included calibration, inspection, and
maintenance procedures. Table A1-1 summarizes the equipment used in the San Diego
Reference Stream study and the required frequency of calibration, inspection, and/or maintenance
of the equipment.
Continuous monitoring of stream flow via a HOBO® Water Quality Data Logger required
monthly downloading of 15 min recorded measured data. Calibration activities were conducted
monthly, including flow-validation measurements, stream level offset checks, and maintenance
activities on an as-needed basis. Data validation or correction activities were conducted to
maintain consistent flow measurements.
American Sigma and Marsh-McBirney flow meters, YSI Pro Plus multi-parameter probe (i.e.
conductivity, dissolved oxygen, pH, salinity, temperature), and rain gauges used to collect
composite and pollutograph samples were required to be calibrated semi-annually or as-needed
based on inspections.

A-3
Table A1-1: Calibration, Inspection, and Maintenance Schedule of Field Equipment
Equipment Activity
a
Responsible Entity Frequency SOP Reference
YSI Pro Plus multi-parameter water quality probe
Calibration SCWRPP Technical Staff
Daily, before use
YSI Pro Plus Series Instruments SOP
Freshwater HOBO Water Level Data Logger (30 ft)
Downloading Data AMEC Technical Staff Monthly HOBO Water Level Manual
American Sigma 950 AVB and Marsh-McBirneyFlowmeters
Inspection,calibration, and maintenance
AMEC and SCCWRP Technical Staff
Semi- annually
American Sigma 950 OM Manual AS009 Marsh-McBirney Manual
American Sigma RainGauge
Inspection,calibration, and maintenance
AMEC Technical Staff Semi- annually
NA
aActivity: Inspection, calibration, or maintenance activity.
A1.1.2 Sampling Procedures
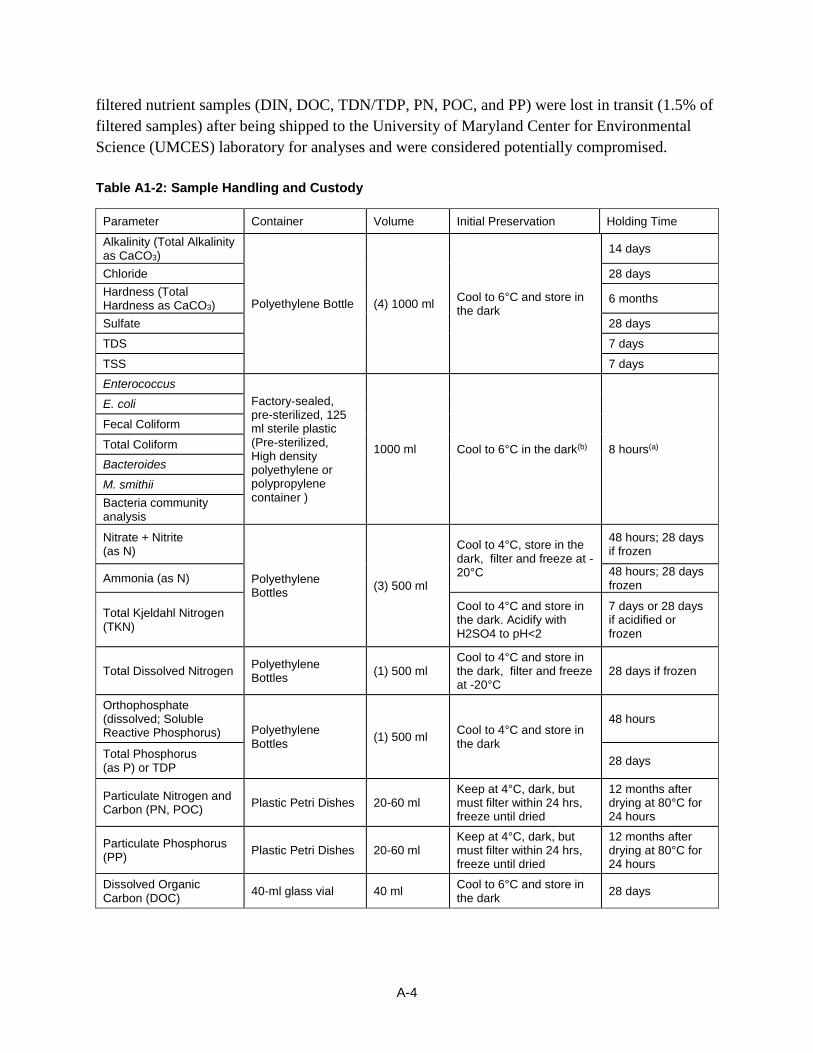
Holding Time Requirements
Holding time requirements were established as part of the analytical methods and required
samples to be analyzed within a specified time. Samples were preserved, packaged, and
transported within the designated holding times per the method requirements provided in
Table A1-2. Specific protocols were required to meet the holding time requirements of the
following constituents:
• E. coli, Enterococcus, fecal coliform, and total coliform – Samples were required to be
kept in the dark and delivered to the laboratory within six hours (analyzed within
eight hours) of the sample collection time.
• Ammonium, dissolved inorganic nitrogen (DIN), dissolved organic carbon (DOC),
nitrate+nitrite, nitrite, particulate nitrate (PN), particulate organic carbon (POC),
particulate phosphate (PP), total nitrogen (TN), total phosphorus (TP), total dissolved
nitrogen (TDN), and total dissolved phosphorus (TDP) – Samples were required to be
filtered and frozen within six hours of the sample collection time to provide
laboratories with a 28-day holding time.
All measured constituents were analyzed within their holding time requirements except for the
following constituents. Five alkalinity and hardness samples, representing 2% of the dry weather
collected samples, were analyzed passed their holding time requirements. Six wet weather
bacteria and nutrient samples exceeded holding time requirements. In addition six wet weather
A-4
filtered nutrient samples (DIN, DOC, TDN/TDP, PN, POC, and PP) were lost in transit (1.5% of
filtered samples) after being shipped to the University of Maryland Center for Environmental
Science (UMCES) laboratory for analyses and were considered potentially compromised.
Table A1-2: Sample Handling and Custody
Parameter Container Volume Initial Preservation Holding Time
Alkalinity (Total Alkalinity as CaCO3)
Polyethylene Bottle (4) 1000 ml Cool to 6°C and store in the dark
14 days
Chloride 28 days
Hardness (Total Hardness as CaCO3)
6 months
Sulfate 28 days
TDS 7 days
TSS 7 days
Enterococcus
Factory-sealed, pre-sterilized, 125 ml sterile plastic (Pre-sterilized, High density polyethylene or polypropylene container )
1000 ml
Cool to 6°C in the dark(b) 8 hours(a)
E. coli
Fecal Coliform
Total Coliform
Bacteroides
M. smithii
Bacteria community analysis
Nitrate + Nitrite (as N)
Polyethylene Bottles
(3) 500 ml
Cool to 4°C, store in the dark, filter and freeze at -20°C
48 hours; 28 days if frozen
Ammonia (as N) 48 hours; 28 days frozen
Total Kjeldahl Nitrogen (TKN)
Cool to 4°C and store in the dark. Acidify with H2SO4 to pH<2
7 days or 28 days if acidified or frozen
Total Dissolved Nitrogen Polyethylene Bottles
(1) 500 ml Cool to 4°C and store in the dark, filter and freeze at -20°C
28 days if frozen
Orthophosphate (dissolved; Soluble Reactive Phosphorus) Polyethylene
Bottles (1) 500 ml
Cool to 4°C and store in the dark
48 hours
Total Phosphorus (as P) or TDP
28 days
Particulate Nitrogen and Carbon (PN, POC)
Plastic Petri Dishes 20-60 ml Keep at 4°C, dark, but must filter within 24 hrs, freeze until dried
12 months after drying at 80°C for 24 hours
Particulate Phosphorus (PP)
Plastic Petri Dishes 20-60 ml Keep at 4°C, dark, but must filter within 24 hrs, freeze until dried
12 months after drying at 80°C for 24 hours
Dissolved Organic Carbon (DOC)
40-ml glass vial 40 ml Cool to 6°C and store in the dark
28 days

A-5
Table A1-2: (Continued)
Parameter Container Volume Initial
Preservation Holding Time
Cadmium (Total)
Acid-cleaned polyethylene bottle
500 ml
Cool to 6°C in the dark; Acidify to pH<2 with pre-
tested HNO3 within 48 hours
6 months at room temperature
following acidification
Chromium (Total)
Copper (Total)
Iron (Total)
Lead (Total)
Manganese (Total)
Nickel (Total)
Selenium (Total)
Zinc (Total)
bCadmium (Dissolved)
Acid-cleaned polyethylene bottle
500 ml
Filter within 8 hours of collection(a); Cool to 6°C in the dark;
Acidify to pH<2 with pre-tested HNO3 within 48 hours
6 months at room temperature after filtration and/or
acidification
Chromium (Dissolved)
Copper (Dissolved)
Iron (Dissolved)
Lead (Dissolved)
Manganese (Dissolved)
Nickel (Dissolved)
Selenium (Dissolved)
Zinc (Dissolved)
(a) Eight hours to analyze fecal indicator bacteria and eight hours to filter for the microbial source testing samples.
(b) Filtration of dissolved metals will be conducted by the laboratory within 8 hours of sample collection.
Broken Sample Containers
Sample handling and delivery protocols were established to make sure samples were received
intact by the laboratory for analysis; however, sample containers occasionally break during
sample collection, handling, or delivery. To account for the possibility of broken sample
containers, a 90% level of completeness requirement was established.
Field Duplicates
Field duplicates were utilized as part of a QA/QC program to assess sampling precision. The
project goal for field duplicates was one for every 10 samples collected per sample type per
reference stream. Field duplicate collection procedure requirements for the San Diego
Reference Stream study were established as being the same as those used for the collection of
standard field samples. Duplicates of manual grab samples were collected by filling two grab
sample containers at the same time or in rapid sequence. Sample containers for duplicate
samples were labeled, but were not identified as duplicates to the laboratories.

A-6
Duplicate results were evaluated by calculating the RPD between the two sets of results, which
served as a measure of the reproducibility (precision) of the sample results. The acceptable
ARPD limits are shown in Table A1-3 below. The RPD was calculated as follows:
Equation 1: RPD = 100 x (sample 1 - sample 2) / ((sample 1 + sample 2)/2) Eq. 1
A1.1.2 Laboratory Analysis Quality Control Procedures
Laboratory Duplicates
Laboratory duplicates were utilized as part of a QA/QC program to assess method precision.
The project goal for laboratory duplicates was one for every 20 samples collected per event.
Duplicate results were evaluated by calculating the RPD between the two sets of results,
which served as a measure of the reproducibility (precision) of the sample results. The acceptable
ARPD limits are shown in Table A1-3. The RPD was calculated using Equation 1.
Standard Reference Material
Standard reference materials (SRMs) were used to evaluate the relative accuracy of a particular
analysis. The project goal for SRMs was one for every 20 samples collected per event or one per
batch. An SRM is a homogeneous matrix with a similar concentration as those expected in the
samples analyzed. The results should be within 95% of the confidence interval of the mean
as stated by the provider of the material.
Laboratory Blank Spikes and Matrix Spikes
Laboratory blank spikes and matrix spikes were used to assess precision and accuracy of the
laboratory analytical method, and to evaluate matrix interference. The project goal for matrix
spikes was one for every 20 samples collected per event or one per batch. The matrix
spike/matrix spike duplicate (MS/MSD) approach was used with the field samples. A matrix
spike sample is an aliquot of a field sample into which the laboratory adds a known
quantity of an analyte. Reported percent recovery of the known analyte in the sample indicates
matrix effects on the analysis. A matrix spike duplicate sample is a duplicate aliquot of the
matrix spike sample analyzed separately. Matrix spike duplicate results were compared to the
matrix spike results to assess the precision of the laboratory analytical method.
Method Blanks
Laboratory method blanks were run by each analytical laboratory to determine the level of
contamination associated with laboratory reagents and equipment. The project goal for method
blanks was one for every 20 samples collected per event or one per batch. A method blank is a
sample of a known matrix that has been subjected to the same complete analytical procedure as
the submitted field samples to determine if contamination has been introduced into the samples
A-7
by the laboratory during processing. Results of a method blank analysis should be less than the
reporting limit for each analyte.
Field Blanks
Field blanks were used to determine if field sampling activities were a potential source for
contamination. The project goal for field blanks was one for every 20 samples collected per
event or one per batch. Field blanks were collected by pouring "blank water" (contaminant-free
de-ionized or Millipore water) into sampling equipment and containers in the field during a
sampling event. The same equipment used for collection of the grab samples was used to transfer
the blank water into the blank sample containers.
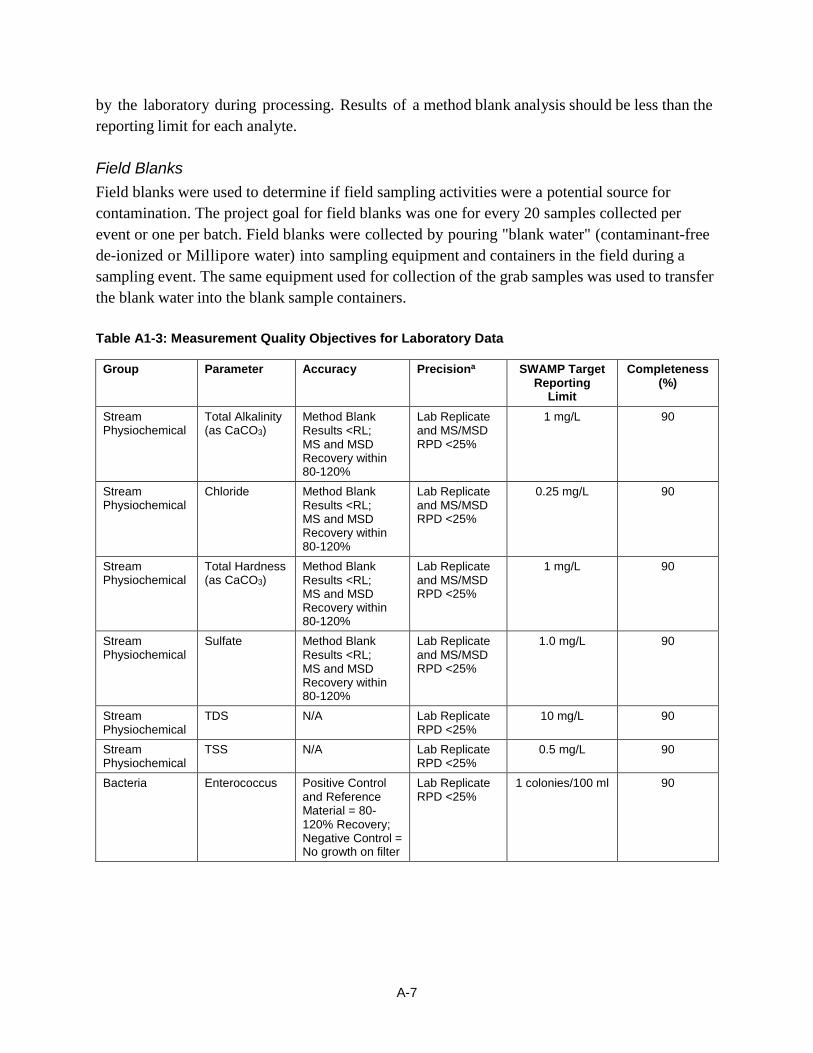
Table A1-3: Measurement Quality Objectives for Laboratory Data
Group Parameter Accuracy Precisiona SWAMP Target Reporting
Limit
Completeness (%)
Stream Physiochemical
Total Alkalinity (as CaCO3)
Method Blank Results <RL; MS and MSD Recovery within 80-120%
Lab Replicate and MS/MSD RPD <25%
1 mg/L 90
Stream Physiochemical
Chloride Method Blank Results <RL; MS and MSD Recovery within 80-120%
Lab Replicate and MS/MSD RPD <25%
0.25 mg/L 90
Stream Physiochemical
Total Hardness (as CaCO3)
Method Blank Results <RL; MS and MSD Recovery within 80-120%
Lab Replicate and MS/MSD RPD <25%
1 mg/L 90
Stream Physiochemical
Sulfate Method Blank Results <RL; MS and MSD Recovery within 80-120%
Lab Replicate and MS/MSD RPD <25%
1.0 mg/L 90
Stream Physiochemical
TDS N/A Lab Replicate RPD <25%
10 mg/L 90
Stream Physiochemical
TSS N/A Lab Replicate RPD <25%
0.5 mg/L 90
Bacteria Enterococcus Positive Control and Reference Material = 80-120% Recovery; Negative Control = No growth on filter
Lab Replicate RPD <25%
1 colonies/100 ml 90
A-8
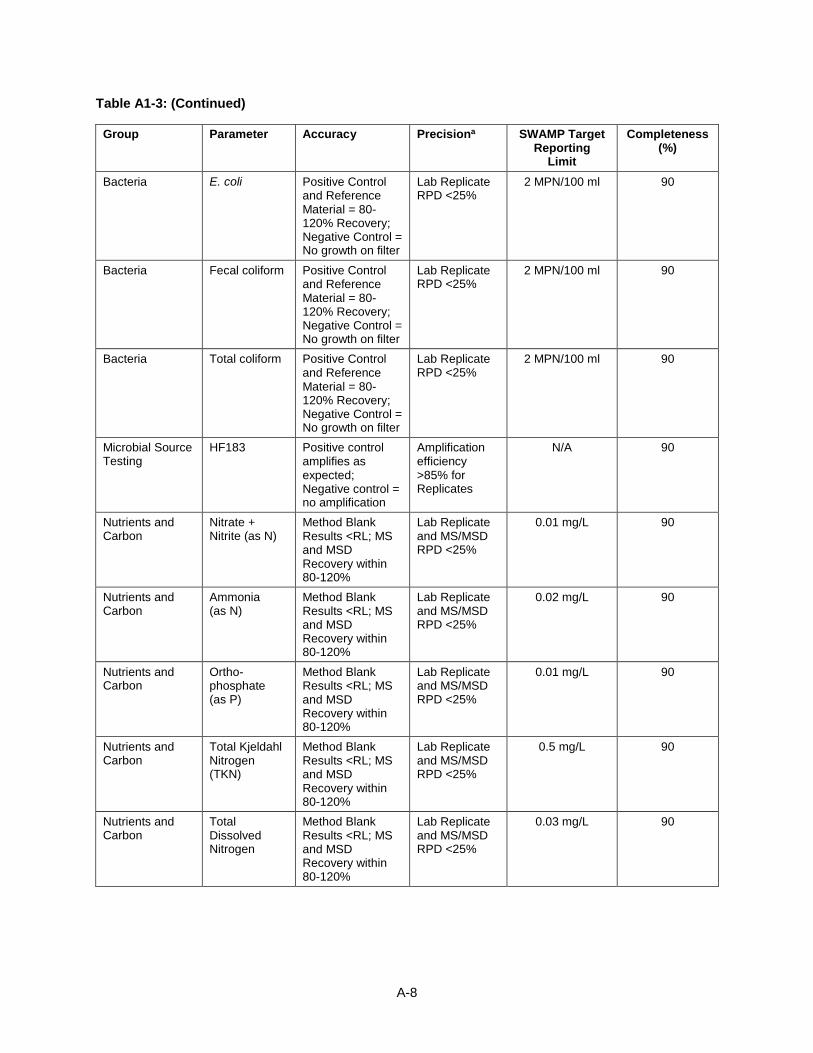
Table A1-3: (Continued)
Group Parameter Accuracy Precisiona SWAMP Target Reporting
Limit
Completeness (%)
Bacteria E. coli Positive Control and Reference Material = 80-120% Recovery; Negative Control = No growth on filter
Lab Replicate RPD <25%
2 MPN/100 ml 90
Bacteria Fecal coliform Positive Control and Reference Material = 80-120% Recovery; Negative Control = No growth on filter
Lab Replicate RPD <25%
2 MPN/100 ml 90
Bacteria Total coliform Positive Control and Reference Material = 80-120% Recovery; Negative Control = No growth on filter
Lab Replicate RPD <25%
2 MPN/100 ml 90
Microbial Source Testing
HF183 Positive control amplifies as expected; Negative control = no amplification
Amplification efficiency >85% for Replicates
N/A 90
Nutrients and Carbon
Nitrate + Nitrite (as N)
Method Blank Results <RL; MS and MSD Recovery within 80-120%
Lab Replicate and MS/MSD RPD <25%
0.01 mg/L 90
Nutrients and Carbon
Ammonia (as N)
Method Blank Results <RL; MS and MSD Recovery within 80-120%
Lab Replicate and MS/MSD RPD <25%
0.02 mg/L 90
Nutrients and Carbon
Ortho-phosphate (as P)
Method Blank Results <RL; MS and MSD Recovery within 80-120%
Lab Replicate and MS/MSD RPD <25%
0.01 mg/L 90
Nutrients and Carbon
Total Kjeldahl Nitrogen (TKN)
Method Blank Results <RL; MS and MSD Recovery within 80-120%
Lab Replicate and MS/MSD RPD <25%
0.5 mg/L 90
Nutrients and Carbon
Total Dissolved Nitrogen
Method Blank Results <RL; MS and MSD Recovery within 80-120%
Lab Replicate and MS/MSD RPD <25%
0.03 mg/L 90

A-9
Table A1-3: (Continued)
Group Parameter Accuracy Precisiona SWAMP Target Reporting
Limit
Completeness (%)
Nutrients and Carbon
Total Phosphorus (as P)
Method Blank Results <RL; MS and MSD Recovery within 80-120%
Lab Replicate and MS/MSD RPD <25%
0.014 mg/L 90
Nutrients and Carbon
Particulate or Algal Nitrogen and Carbon
Method Blank Results <RL; MS and MSD Recovery within 80-120%
Lab Replicate and MS/MSD RPD <25%
165 mg kg-1, 2600 mg kg-1 in 10 mg sample
90
Nutrients and Carbon
Particulate or Algal Phosphorus
Method Blank Results <RL; MS and MSD Recovery within 80-120%
Lab Replicate and MS/MSD RPD <25%
100 mg kg-1 in 10 mg sample
90
Nutrients and Carbon
Dissolved Organic Carbon (DOC)
Method Blank Results <RL; MS and MSD Recovery within 80-120%
Lab Replicate and MS/MSD RPD <25%
0.6 mg/L 90
Metals (Total and Dissolved)
Cadmium Method Blank Results <RL; MS and MSD Recovery within 75-125%
Lab Replicate and MS/MSD RPD <25%
0.01 µg/L 90
Metals (Total and Dissolved)
Chromium Method Blank Results <RL; MS and MSD Recovery within 75-125%
Lab Replicate and MS/MSD RPD <25%
0.1 µg/L 90
Metals (Total and Dissolved)
Copper Method Blank Results <RL; MS and MSD Recovery within 75-125%
Lab Replicate and MS/MSD RPD <25%
0.01 µg/L 90
Metals (Total and Dissolved)
Iron Method Blank Results <RL; MS and MSD Recovery within 75-125%
Lab Replicate and MS/MSD RPD <25%
20 µg/L 90
Metals (Total and Dissolved)
Lead Method Blank Results <RL; MS and MSD Recovery within 75-125%
Lab Replicate and MS/MSD RPD <25%
0.01 µg/L 90
Metals (Total and Dissolved)
Manganese Method Blank Results <RL; MS and MSD Recovery within 75-125%
Lab Replicate and MS/MSD RPD <25%
0.01 µg/L 90
Metals (Total and Dissolved)
Nickel Method Blank Results <RL; MS and MSD Recovery within 75-125%
Lab Replicate and MS/MSD RPD <25%
0.02 µg/L 90
Metals (Total and Dissolved)
Selenium Method Blank Results <RL; MS and MSD Recovery within 75-125%
Lab Replicate and MS/MSD RPD <25%
0.30 µg/L 90
A-10
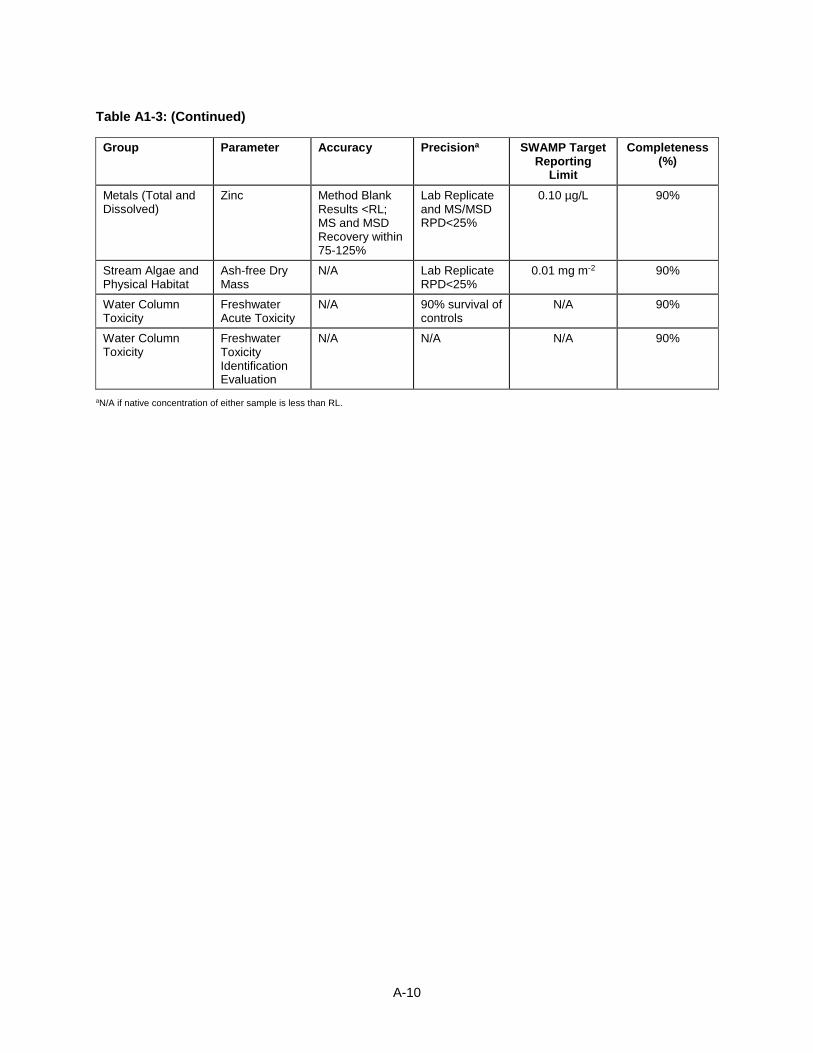
Table A1-3: (Continued)
Group Parameter Accuracy Precisiona SWAMP Target Reporting
Limit
Completeness (%)
Metals (Total and Dissolved)
Zinc Method Blank Results <RL; MS and MSD Recovery within 75-125%
Lab Replicate and MS/MSD RPD<25%
0.10 µg/L 90%
Stream Algae and Physical Habitat
Ash-free Dry Mass
N/A Lab Replicate RPD<25%
0.01 mg m-2 90%
Water Column Toxicity
Freshwater Acute Toxicity
N/A 90% survival of controls
N/A 90%
Water Column Toxicity
Freshwater Toxicity Identification Evaluation
N/A N/A N/A 90%
aN/A if native concentration of either sample is less than RL.

A-11
A2. QUALITY ASSURANCE/QUALITY CONTROL RESULTS
The Quality Assurance Project Plan (QAPP) was developed to establish activities and
procedures to assure both chemical and physical measurements would meet the SWAMP
requirements and provide the quality of data needed to validate and calibrate future TMDL
models. Field sampling and laboratory quality assurance activities and procedures were
implemented to objectives provided in the QAPP.
Quality assurance activities began with field protocols designed to minimize errors
introduced during field sampling and measurements. Field procedures included calibration of
field equipment as well as sample handling and processing procedures. Field QA/QC samples
evaluated potential contamination and sampling error prior to sample delivery to the analytical
laboratory. Field QA/QC processes included equipment calibration, field protocols to meet
analytical holding times, field duplicates, and field blanks. Laboratory QA/QC samples were
used to evaluate the analytical process for contamination, accuracy, and reproducibility.
The primary criteria used to evaluate the quality of data are precision, accuracy, completeness,
and representativeness. These criteria are described below:
• Precision describes how well repeated measurements agree. Precision measurements
were assessed on both field and laboratory duplicates (i.e., MS1/MS2, BS1/BS2,
LCS1/LCS2, LCM1/LCM2, CRM1/CRM2, and surrogate spikes) on a minimum
frequency of one per batch. The results of the replicate project sample analysis
(R1/R2), were compared to the original samples to estimate a RPD between the two
samples.
• Accuracy describes how close the measurement is to its true value using calibration
standards, reference samples, and spiked samples. The accuracy of chemical
measurements was checked by performing LCS/LCSDs and MS/MSDs during each
batch of sample analysis at the laboratory. Accuracy was quantified as the percent
recovery of the measured value within established control limits. The recoveries of
both LCS/LCSDs and MS/MSDs were evaluated.
• Completeness describes the fraction of collected data that is successfully analyzed in
the laboratory. While no specific statistical criteria have been generated as part of
this project, it is expected that 90% of all analyses should be completed when
sampled. Completeness was quantified by comparing the number of measurements
actually collected to the number of measurements planned to be collected.
• Representativeness describes the degree to which the results of analyses represent
the samples collected, and the samples in turn represent natural variability and
characteristics of the environmental conditions. The monitoring approach was
designed to achieve representativeness by sampling at 10, 50, and 90% locations in
each reference stream. Sites were chosen to best represent distinctive processes or
sections of the reference stream: Monitoring locations were chosen to be
representative of the reference stream processes of interest.

A-12
Overall, data quality met research study QA/QC objectives. Data were qualified and flagged in
the project database with the appropriate SWAMP QA code. Data was required to be reported in
a SWAMP compatible format. QA Codes are used in the database to describe any special
conditions or situation occurring during the analysis. No data points were rejected based on these
qualifiers. Following the review, data results were assigned data qualifiers, as appropriate.
Individual sample results were qualified using Result Qualifier Codes and Quality Assurance
Codes, which are detailed below:
• Non-Detect (ND): The result was below the MDL
• Detected Not Quantifiable (DNQ): The result was between the MDL and the RL.
• H: A holding time violation occurred. Method recommended holding times are the
length of time a project sample can be stored under specific conditions after
collection and prior to analysis without significantly affecting the analyte’s
concentration. The majority of the “H” qualifiers were attributable Ato holding-time
violations for nutrients and total dissolved solids. These data are flagged in the project
database with a QA/QC code of “H”.
Any constituent reported as non-detect (Numerical Qualifier “<”) received an overall
qualification of “ND” in the absence of laboratory quality control qualification. Any constituent
that reported a value below the RL but at or above the MDL (with a Numerical Qualifier “<”)
received an overall qualification of “<” and DNQ to identify that the result was reported as a less
than value and was qualified as a DNQ in the absence of laboratory quality control qualification.
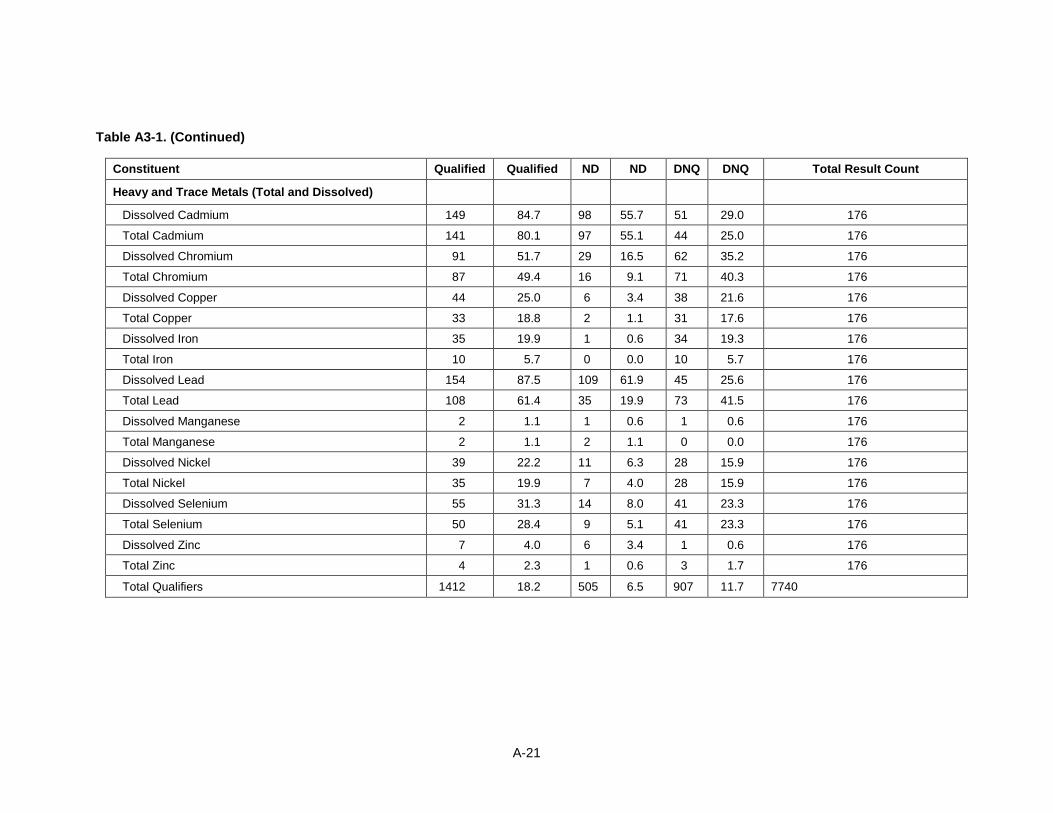
The 2012-2014 San Diego Reference Stream monitoring effort has resulted in 18,154 chemical
measurements (12,023 dry weather and 6,131 wet weather; total includes both native and
replicate samples). Of these native values 1,593 (8.8%) required data qualifications. Of the 1,593
values 1,142 (6.3%) were dry weather results (Table A3-1) and 451 (2.5%) were wet weather
results (Table A3-2). Both total and dissolved trace metals comprised the majority of NDs and
DNQs. Overall 505 (6.5%) of the reference stream samples collected during dry weather were
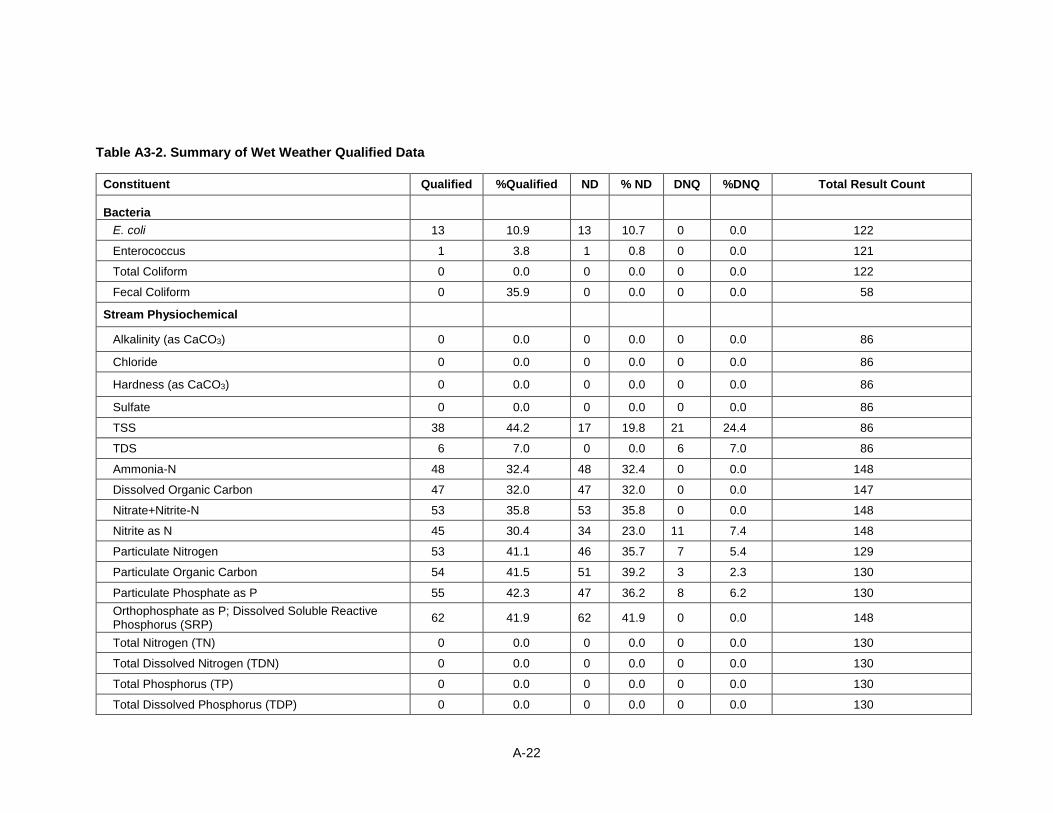
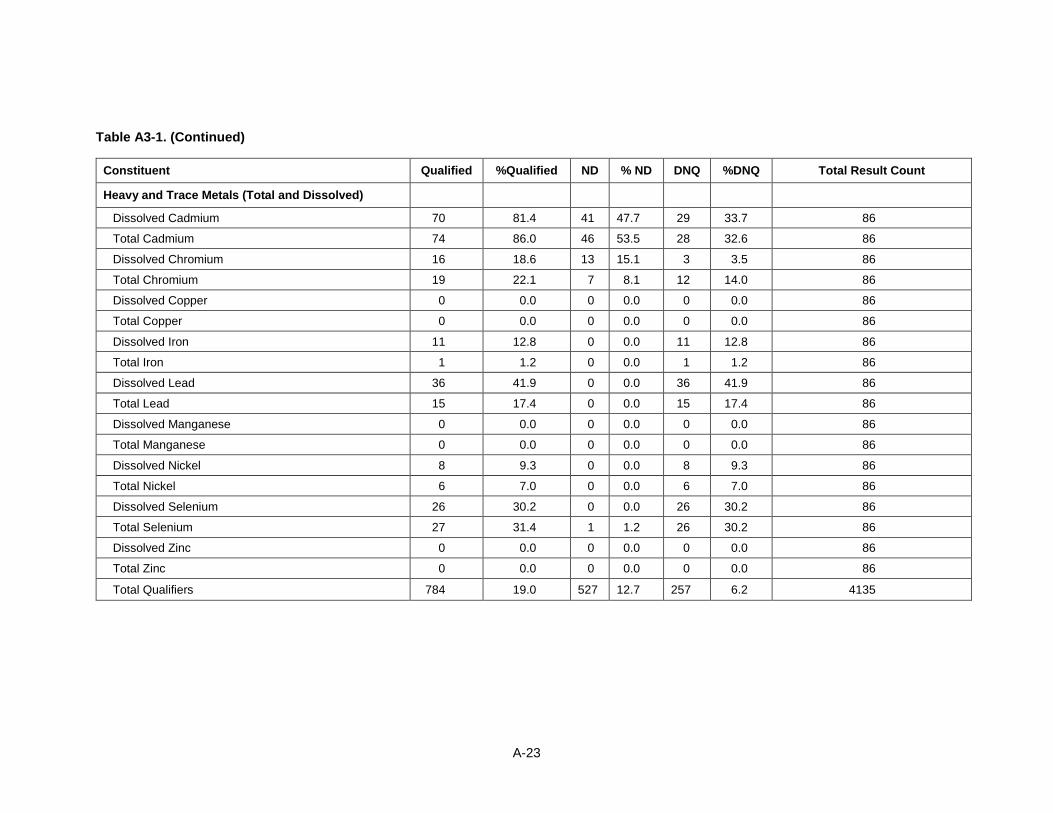
analyzed as NDs and 907 (11.7%) resulted in DNQs (Table A3-1). During wet weather 527
(12.7%) of the reference stream samples collected were analyzed as NDs and 257 (6.2%)
resulted in DNQs (Table A3-2).
Based on a review of the project DQOs and the database data qualifiers, the data collected as part
of this study were deemed appropriate for use in the San Diego Reference Stream study as
qualified. No data was rejected. The flagged data was applicable as qualified and can be used
considering the constraints placed by the qualifiers.

A-13
A2.1 Field Duplicates
Field duplicates were analyzed for a minimum of 10% of total samples per constituent. For those
samples that did not meet the DQOs, site variations were evaluated by constituent to reflect the
sampling strategy.
High RPDs occurred as a result of small absolute differences at low concentrations that tended to
amplify RPDs. This occurred for dissolved metals, nutrients, and TSS samples. High RPDs also
reflected the heterogeneous nature of environmental samples, and are considered reasonable.
Storm water samples routinely have RPDs between 60 and 100%. This is thought to be caused,
in many instances by the process of splitting samples (due to the potential for large variations in
particle sizes and, therefore, constituent concentrations between primary and duplicate samples).
A2.1.2 Bacteria
Field duplicates were analyzed for 10% of the total bacteria samples collected for this monitoring
study. The percent of field duplicates for bacteria (E. coli, Enterococcus, fecal coliform and total
coliform that met the DQO’s are provided in Table A2-1. The breakdown by constituent of the
field duplicates that met the DQO for precision are as follows:
• E. coli, and Enterococcus: Total Coliform: Of 50, 49 field duplicates (98%) for each
constituent met the DQO for precision.
• Total Coliform: all 50 field duplicates (100%) met the DQO for precision.
• Fecal Coliform: all 24 field duplicates (100%) met the DQO for precision.
A2.1.3 Stream Physiochemical Constituents
Field duplicates were analyzed for 10% of the alkalinity, chloride, hardness and sulfate samples
collected for this study (Table A2-1). Of 26, 22 field duplicates (85%) analyzed met the DQO for
precision.
A2.1.4 Total Suspended Solids (TSS) and Total Dissolved Solids (TDS)
Field duplicates were analyzed for 10% of the total suspended and total dissolved solids samples
collected for this study (Table A2-1). Of 26 total field duplicates analyzed for TDS, 100% met
the DQO for precision.
A2.1.5 Nutrients
Field duplicates were analyzed for 15% of the total nutrient samples collected during the study.
The percentages of field duplicates for each constituent that met the DQOs are provided in Table
A2-1. The breakdown by constituent of the field duplicates that met the DQO for precision is as
follows:

A-14
• Ammonia as N, Nitrate + Nitrite, Total Kjeldahl Nitrogen and Total Phosphorus: Of 41,
39 field duplicates (95.1%) analyzed for ammonia as nitrogen, nitrate + nitrite, TKN
and TP met the DQO for precision.
• Orthophosphate: Of 41, 41 field duplicates (100%) analyzed met the DQO for precision.
• Total Dissolved Nitrogen and Total Nitrogen: Of 41, 38 field duplicates (92.7%)
analyzed for TDN and TN met the DQO for precision.
• Total Phosphorus, Particulate Nitrogen, Particulate Organic Carbon, Particulate
Phosphorus and Dissolved Organic Carbon: Of 41, 40 field duplicates (97.6%)
analyzed for TP, PN, POC, PP and DOC met the DQO for precision.
A2.1.6 Total and Dissolved Metals
Field duplicates were analyzed for 10% of the total and dissolved metals samples collected for
this study (Table A2-1). Of 26 total and dissolved metals, 21 field duplicates (80.7%) analyzed
met the DQO for precision. In some instances, the results for the dissolved fraction were higher
than the total fraction for a particular analyte (e.g. total and dissolved copper). This is typically
caused by the analytical variation for each result and indicates that the target analyte is primarily
in the dissolved phase, within the sample.
A2.1.7 Laboratory Duplicates
Laboratory duplicates serve as an indicator of instrument stability, consistency in laboratory
sample preparation and analysis, as well as an estimate of field proficiency. Laboratory
duplicates were analyzed for a minimum of 5% of total number of samples analyzed per
constituent. The percentage of duplicates meeting the DQOs for individual constituents is
presented in Table A2-1.
Bacteria
• E. coli, Enterococcus and Total Coliform: all 17 laboratory duplicates (100%) for each
constituent met the DQO for precision.
• Fecal Coliform: all 19 laboratory duplicates (100%) met the DQO for precision.
Stream Physiochemical Constituents
Alkalinity, chloride, hardness and sulfate: Of 11, 10 laboratory duplicates (91%) analyzed met
the DQO for precision (Table A2-1).
Total Suspended Solids (TSS) and Total Dissolved Solids (TDS)
All ten laboratory duplicates (100%) for TDS and TSS, met the DQO for precision (Table A2-1).
A-15
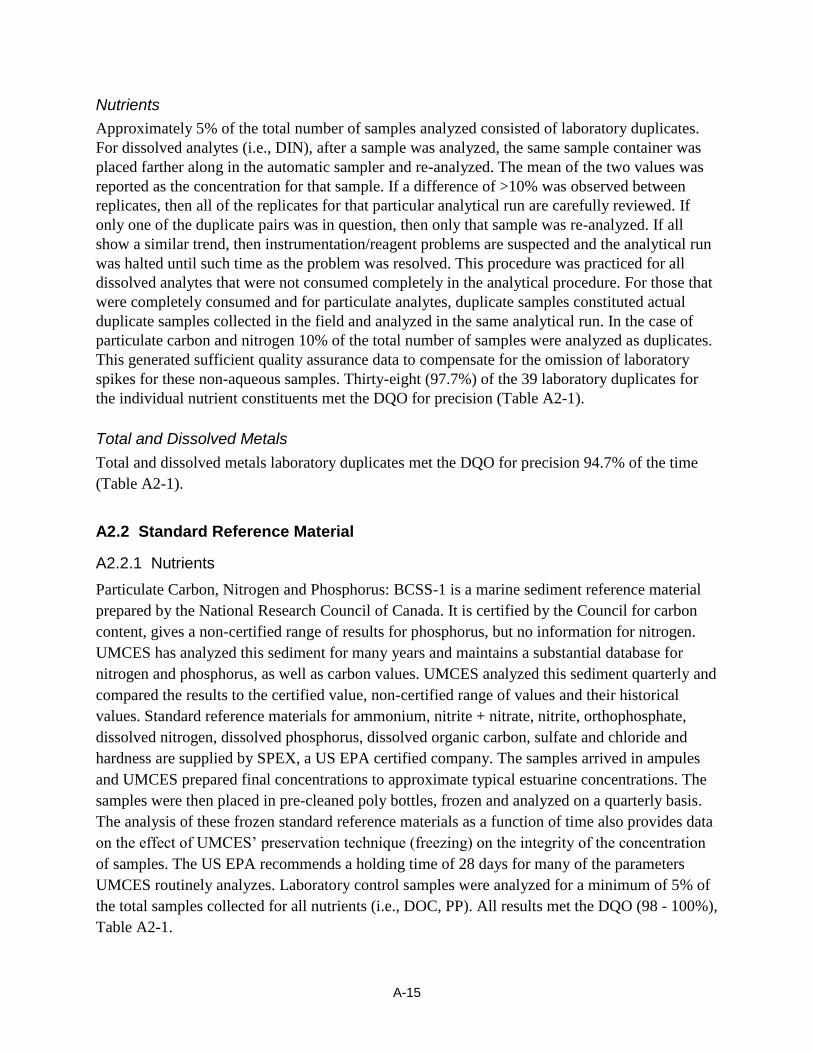
Nutrients
Approximately 5% of the total number of samples analyzed consisted of laboratory duplicates.
For dissolved analytes (i.e., DIN), after a sample was analyzed, the same sample container was
placed farther along in the automatic sampler and re-analyzed. The mean of the two values was
reported as the concentration for that sample. If a difference of >10% was observed between
replicates, then all of the replicates for that particular analytical run are carefully reviewed. If
only one of the duplicate pairs was in question, then only that sample was re-analyzed. If all
show a similar trend, then instrumentation/reagent problems are suspected and the analytical run
was halted until such time as the problem was resolved. This procedure was practiced for all
dissolved analytes that were not consumed completely in the analytical procedure. For those that
were completely consumed and for particulate analytes, duplicate samples constituted actual
duplicate samples collected in the field and analyzed in the same analytical run. In the case of
particulate carbon and nitrogen 10% of the total number of samples were analyzed as duplicates.
This generated sufficient quality assurance data to compensate for the omission of laboratory
spikes for these non-aqueous samples. Thirty-eight (97.7%) of the 39 laboratory duplicates for
the individual nutrient constituents met the DQO for precision (Table A2-1).
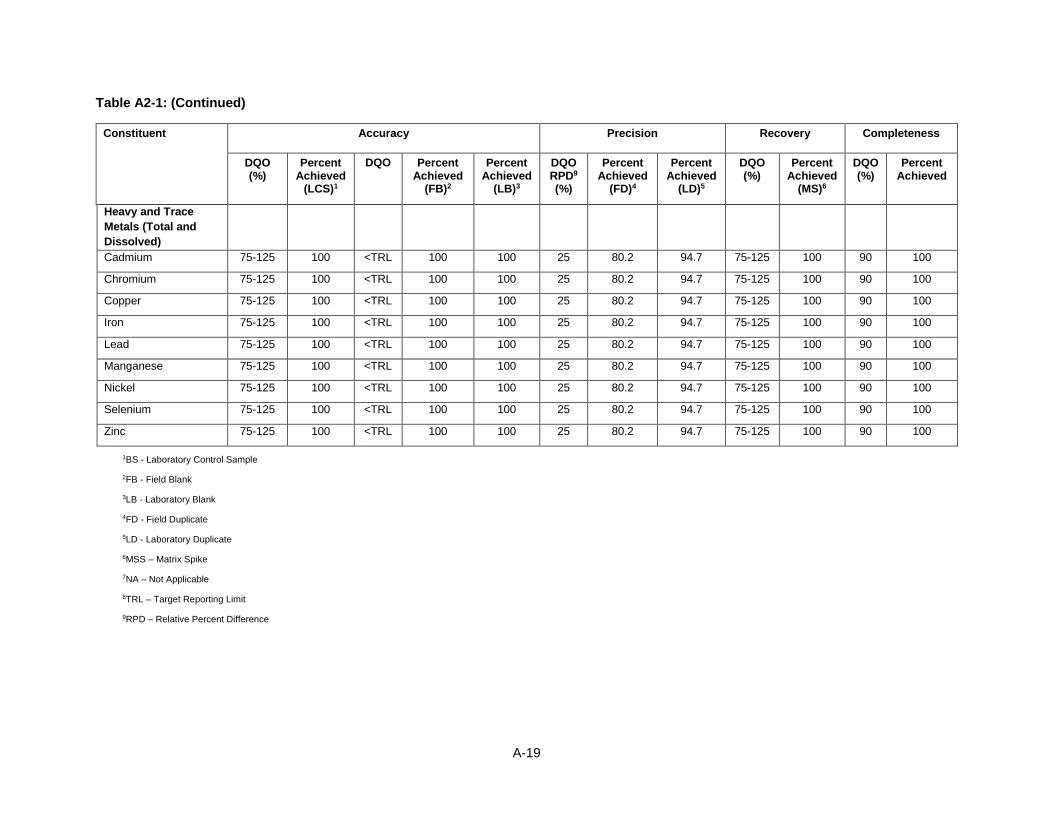
Total and Dissolved Metals
Total and dissolved metals laboratory duplicates met the DQO for precision 94.7% of the time
(Table A2-1).
A2.2 Standard Reference Material
A2.2.1 Nutrients
Particulate Carbon, Nitrogen and Phosphorus: BCSS-1 is a marine sediment reference material
prepared by the National Research Council of Canada. It is certified by the Council for carbon
content, gives a non-certified range of results for phosphorus, but no information for nitrogen.
UMCES has analyzed this sediment for many years and maintains a substantial database for
nitrogen and phosphorus, as well as carbon values. UMCES analyzed this sediment quarterly and
compared the results to the certified value, non-certified range of values and their historical
values. Standard reference materials for ammonium, nitrite + nitrate, nitrite, orthophosphate,
dissolved nitrogen, dissolved phosphorus, dissolved organic carbon, sulfate and chloride and
hardness are supplied by SPEX, a US EPA certified company. The samples arrived in ampules
and UMCES prepared final concentrations to approximate typical estuarine concentrations. The
samples were then placed in pre-cleaned poly bottles, frozen and analyzed on a quarterly basis.
The analysis of these frozen standard reference materials as a function of time also provides data
on the effect of UMCES’ preservation technique (freezing) on the integrity of the concentration
of samples. The US EPA recommends a holding time of 28 days for many of the parameters
UMCES routinely analyzes. Laboratory control samples were analyzed for a minimum of 5% of
the total samples collected for all nutrients (i.e., DOC, PP). All results met the DQO (98 - 100%),
Table A2-1.

A-16
A2.2.2 Trace Metals
Laboratory control samples (LCS) were analyzed for a minimum of 5% of the total samples
collected for all total and dissolved metals. All results met the DQO (100%; Table A2-1).
A2.3 Laboratory Blank Spikes and Matrix Spikes
Blank spikes (BS) demonstrates performance of the preparation and analytical methods on a
clean matrix void of potential matrix related interferences. The BS is performed in laboratory
deionized water, making these recoveries a better indicator of the efficiency of the laboratory
method per se.
Matrix spikes (MS)/matrix spike duplicates (MSD) and laboratory blank spikes were analyzed on
a minimum of 5% of the total number of samples collected for the following constituents: ammonia
as nitrogen, nitrate + nitrite as nitrogen, total nitrogen, total dissolved nitrogen, total phosphorus,
total dissolved phosphorus, total and dissolved metals. Nutrient recovery ranged from 97.9%
(DOC and nitrate + nitrite) to 100% (ammonia as N, TDN, TN, TP, and orthophosphate), Table
A2-1. Total and dissolved metals showed 100% recovery. All results met the DQO (98 - 100%),
Table A2-1.
A2.3.1 Nutrients Matrix Spiking Method
A spike was prepared by adding a known volume of standard to a known volume of pre-analyzed
sample. University of Maryland Center for Environmental Science (UMCES) added enough
concentrated standard to provide a significant response on their instruments that was
distinguishable from the original concentration of the sample. This concentrated standard was
used to minimize any possible change in sample matrix by the addition of spike.
The spiked sample was analyzed and its expected concentration calculated as the sum of the
original concentration and the spike concentration, normalized for the constituent volumes. A
comparison was made between the actual value and the expected value. These concentrations
(original, expected and actual) were recorded in a separate QA/QC data file along with sample
number, sample collection date, analysis date and the amount of spike added. In the case of
particulate phosphorus, the volume filtered was not used in the calculation to determine
percentage recovery.
If a value of >115% or <85% was observed for percentage recovery of the spike, then all of the
spikes for that particular analytical run were carefully reviewed. If only one of the spikes is in
question, then only that sample was re-analyzed. If all showed poor recovery, then
instrumentation/reagent problems were suspected and the analytical run was halted until such
time that the problem was resolved. This procedure was adhered to for all dissolved analytes and
for particulate phosphorus.

A-17
Table A2-1: Data Quality Objectives and Levels Achieved for Analytical Results
Constituent Accuracy Precision Recovery Completeness
DQO (%)
Percent Achieved
(LCS)1
DQO Percent Achieved
(FB)2
Percent Achieved
(LB)3
DQO RPD9
(%)
Percent Achieved
(FD)4
Percent Achieved
(LD)5
DQO (%)
Percent Achieved
(MS)6
DQO (%)
Percent Achieved
Bacteria
E. coli NA7 NA <TRL8 98.5 100 25 98 100 NA NA 90 99
Enterococcus NA7 NA <TRL 98.5 100 25 98 100 NA NA 90 99
Total Coliform NA NA <TRL 99 100 25 100 100 NA NA 90 100
Fecal Coliform NA NA <TRL 100 100 25 100 100 NA NA 90 100
Stream Physiochemical
Alkalinity (as CaCO3) 80-120 100 <TRL 100 100 25 85 91 NA NA 90 99
Chloride 80-120 100 <TRL 100 100 25 85 91 NA NA 90 99
Hardness (as CaCO3) 80-120 100 <TRL 100 100 25 85 91 NA NA 90 99
Sulfate 80-120 100 <TRL 100 100 25 85 91 NA NA 90 99
Total Dissolved Solids 80-120 100 <TRL 100 100 25 100 100 NA NA 90 100
Total Suspended Solids 80-120 100 <TRL 100 100 25 100 100 NA NA 90 100

A-18
Table A2-1: (Continued)
Constituent Accuracy Precision Recovery Completeness
DQO (%)
Percent Achieved
(LCS)1
DQO Percent Achieved
(FB)2
Percent Achieved
(LB)3
DQO RPD9
(%)
Percent Achieved
(FD)4
Percent Achieved
(LD)5
DQO (%)
Percent Achieved
(MS)6
DQO (%)
Percent Achieved
Nutrients
Ammonia-N 80-120 100 <TRL 100 100 25 95.1 97.7 80-120 100 90 99
Dissolved Organic Carbon
80-120 100 <TRL 96.7 100 25 97.6 97.7 80-120 97.9 90 100
Nitrate+Nitrite-N 80-120 100 <TRL 96.7 100 25 95.1 97.7 80-120 97.9 90 100
Particulate Carbon 80-120 100 <TRL 96.7 100 25 97.6 97.7 NA 98.6 90 100
Particulate Nitrogen 80-120 100 <TRL 96.7 100 25 97.6 97.7 NA 98.6 90 100
Particulate Phosphorus 80-120 100 <TRL 96.7 100 25 97.6 97.7 NA 98.6 90 100
Orthophosphate as P 80-120 100 <TRL 100 100 25 97.6 97.7 80-120 100 90 100
Total Kjeldahl Nitrogen (TKN)
80-120 100.0 <TRL 100 100 25 95.1 97.7 80-120 100 90 100
Total Nitrogen (TN) 80-120 98.0 <TRL 100 100 25 92.7 97.7 80-120 100 90 100
Total Dissolved Nitrogen (TDN)
80-120 100.0 <TRL 100 100 25 92.7 97.7 80-120 100 90 100
Total Phosphorus (TP) 80-120 98 <TRL 100 100 25 95.1 97.7 80-120 100 90 100
A-19
Table A2-1: (Continued)
Constituent Accuracy Precision Recovery Completeness
DQO (%)
Percent Achieved
(LCS)1
DQO Percent Achieved
(FB)2
Percent Achieved
(LB)3
DQO RPD9
(%)
Percent Achieved
(FD)4
Percent Achieved
(LD)5
DQO (%)
Percent Achieved
(MS)6
DQO (%)
Percent Achieved
Heavy and Trace
Metals (Total and
Dissolved)
Cadmium 75-125 100 <TRL 100 100 25 80.2 94.7 75-125 100 90 100
Chromium 75-125 100 <TRL 100 100 25 80.2 94.7 75-125 100 90 100
Copper 75-125 100 <TRL 100 100 25 80.2 94.7 75-125 100 90 100
Iron 75-125 100 <TRL 100 100 25 80.2 94.7 75-125 100 90 100
Lead 75-125 100 <TRL 100 100 25 80.2 94.7 75-125 100 90 100
Manganese 75-125 100 <TRL 100 100 25 80.2 94.7 75-125 100 90 100
Nickel 75-125 100 <TRL 100 100 25 80.2 94.7 75-125 100 90 100
Selenium 75-125 100 <TRL 100 100 25 80.2 94.7 75-125 100 90 100
Zinc 75-125 100 <TRL 100 100 25 80.2 94.7 75-125 100 90 100
1BS - Laboratory Control Sample
2FB - Field Blank
3LB - Laboratory Blank
4FD - Field Duplicate
5LD - Laboratory Duplicate
6MSS – Matrix Spike
7NA – Not Applicable
8TRL – Target Reporting Limit
9RPD – Relative Percent Difference

A-20
A3. SUMMARY OF DRY AND WET WEATHER QUALIFIED DATA
Table A3-1: Summary of Dry Weather Qualified Data
Constituent Qualified %Qualified ND % ND DNQ %DNQ Total Result Count
Bacteria
E. coli 39 10.9 0 0.0 39 9.2 425
Enterococcus 13 3.8 0 0.0 13 3.1 424
Total Coliform 3 0.7 0 0.0 3 0.7 424
Fecal Coliform 61 35.9 0 0.0 61 21.0 291
Stream Physiochemical 0.0
Alkalinity (as CaCO3) 0 0.0 0 0.0 0 0.0 185
Chloride 0 0.0 0 0.0 0 0.0 164
Hardness (as CaCO3) 0 0.0 0 0.0 0 0.0 318
Sulfate 0 0.0 0 0.0 0 0.0 167
TSS 103 69.6 61 0.0 42 28.4 148
TDS 6 3.8 0 0.0 6 3.8 157
Ammonia-N 10 5.7 0 0.0 10 5.7 176
Dissolved Organic Carbon 0 0.0 0 0.0 0 0.0 185
Nitrate+Nitrite-N 6 4.7 0 0.0 6 4.7 127
Nitrite as N 48 96.0 0 0.0 48 96.0 50
Particulate Nitrogen 14 7.4 0 0.0 14 7.4 188
Particulate Organic Carbon 3 1.6 0 0.0 3 1.6 189
Particulate Phosphate as P 45 24.6 0 0.0 45 24.6 183
Orthophosphate as P; Dissolved Soluble Reactive Phosphorus (SRP)
3 6.0 0 0.0
3 6.0 50
Total Nitrogen (TN) 1 0.6 0 0.0 1 0.6 176
Total Dissolved Nitrogen (TDN) 11 6.3 0 0.0 11 6.3 176
Total Phosphorus (TP) 0 0.0 0 0.0 0 0.0 189
Total Dissolved Phosphorus (TDP) 0 0.0 0 0.0 0 0.0 180
A-21
Table A3-1. (Continued)
Constituent Qualified Qualified ND ND DNQ DNQ Total Result Count
Heavy and Trace Metals (Total and Dissolved)
Dissolved Cadmium 149 84.7 98 55.7 51 29.0 176
Total Cadmium 141 80.1 97 55.1 44 25.0 176
Dissolved Chromium 91 51.7 29 16.5 62 35.2 176
Total Chromium 87 49.4 16 9.1 71 40.3 176
Dissolved Copper 44 25.0 6 3.4 38 21.6 176
Total Copper 33 18.8 2 1.1 31 17.6 176
Dissolved Iron 35 19.9 1 0.6 34 19.3 176
Total Iron 10 5.7 0 0.0 10 5.7 176
Dissolved Lead 154 87.5 109 61.9 45 25.6 176
Total Lead 108 61.4 35 19.9 73 41.5 176
Dissolved Manganese 2 1.1 1 0.6 1 0.6 176
Total Manganese 2 1.1 2 1.1 0 0.0 176
Dissolved Nickel 39 22.2 11 6.3 28 15.9 176
Total Nickel 35 19.9 7 4.0 28 15.9 176
Dissolved Selenium 55 31.3 14 8.0 41 23.3 176
Total Selenium 50 28.4 9 5.1 41 23.3 176
Dissolved Zinc 7 4.0 6 3.4 1 0.6 176
Total Zinc 4 2.3 1 0.6 3 1.7 176
Total Qualifiers 1412 18.2 505 6.5 907 11.7 7740
A-22
Table A3-2. Summary of Wet Weather Qualified Data
Constituent Qualified %Qualified ND % ND DNQ %DNQ Total Result Count
Bacteria
E. coli 13 10.9 13 10.7 0 0.0 122
Enterococcus 1 3.8 1 0.8 0 0.0 121
Total Coliform 0 0.0 0 0.0 0 0.0 122
Fecal Coliform 0 35.9 0 0.0 0 0.0 58
Stream Physiochemical
Alkalinity (as CaCO3) 0 0.0 0 0.0 0 0.0 86
Chloride 0 0.0 0 0.0 0 0.0 86
Hardness (as CaCO3) 0 0.0 0 0.0 0 0.0 86
Sulfate 0 0.0 0 0.0 0 0.0 86
TSS 38 44.2 17 19.8 21 24.4 86
TDS 6 7.0 0 0.0 6 7.0 86
Ammonia-N 48 32.4 48 32.4 0 0.0 148
Dissolved Organic Carbon 47 32.0 47 32.0 0 0.0 147
Nitrate+Nitrite-N 53 35.8 53 35.8 0 0.0 148
Nitrite as N 45 30.4 34 23.0 11 7.4 148
Particulate Nitrogen 53 41.1 46 35.7 7 5.4 129
Particulate Organic Carbon 54 41.5 51 39.2 3 2.3 130
Particulate Phosphate as P 55 42.3 47 36.2 8 6.2 130
Orthophosphate as P; Dissolved Soluble Reactive Phosphorus (SRP)
62 41.9 62 41.9 0 0.0 148
Total Nitrogen (TN) 0 0.0 0 0.0 0 0.0 130
Total Dissolved Nitrogen (TDN) 0 0.0 0 0.0 0 0.0 130
Total Phosphorus (TP) 0 0.0 0 0.0 0 0.0 130
Total Dissolved Phosphorus (TDP) 0 0.0 0 0.0 0 0.0 130
A-23
Table A3-1. (Continued)
Constituent Qualified %Qualified ND % ND DNQ %DNQ Total Result Count
Heavy and Trace Metals (Total and Dissolved)
Dissolved Cadmium 70 81.4 41 47.7 29 33.7 86
Total Cadmium 74 86.0 46 53.5 28 32.6 86
Dissolved Chromium 16 18.6 13 15.1 3 3.5 86
Total Chromium 19 22.1 7 8.1 12 14.0 86
Dissolved Copper 0 0.0 0 0.0 0 0.0 86
Total Copper 0 0.0 0 0.0 0 0.0 86
Dissolved Iron 11 12.8 0 0.0 11 12.8 86
Total Iron 1 1.2 0 0.0 1 1.2 86
Dissolved Lead 36 41.9 0 0.0 36 41.9 86
Total Lead 15 17.4 0 0.0 15 17.4 86
Dissolved Manganese 0 0.0 0 0.0 0 0.0 86
Total Manganese 0 0.0 0 0.0 0 0.0 86
Dissolved Nickel 8 9.3 0 0.0 8 9.3 86
Total Nickel 6 7.0 0 0.0 6 7.0 86
Dissolved Selenium 26 30.2 0 0.0 26 30.2 86
Total Selenium 27 31.4 1 1.2 26 30.2 86
Dissolved Zinc 0 0.0 0 0.0 0 0.0 86
Total Zinc 0 0.0 0 0.0 0 0.0 86
Total Qualifiers 784 19.0 527 12.7 257 6.2 4135