sample progress report - cdpr.ca.gov · contract progress report summary of work to be completed %...
TRANSCRIPT

Contract Progress Report
Summary of Work to be Completed
Progress Report # 2 Reporting Period: Nov. 30, 2013 to Jun. 30, 2014 Submittal Date July 1, 2014
Contract No: Department of Pesticide Regulation - #13-C0029
Project Name: Environmental monitoring of the constructed water quality pond at Folsom, CA
Contractor Name: UC Davis Aquatic Health Program Laboratory I certify under penalty of law that this document and all attachments were prepared by me or under my direction in accordance with the terms and conditions of each Contract Exhibit. Based on my inquiry of the persons or persons who manage the project or those directly responsible for gathering the information, the information submitted is, to the best of my knowledge and belief, true, accurate, and complete. All information submitted in this document and all attachments conform to and are in accordance with the state and federal laws and I so here certify with my signature. I am aware that there are significant penalties for submitting false or misleading information.
Project Director: Dr. Swee Teh
Printed Name Signature
Items for Review # Due Date % Of Work Complete
Date Submitted
Task 1 Macroinvertebrate Community Survey 1.1 Kicknet Sample Collection Dec 2015 50% July 1, 2014 1.2 Taxonomic Identification Dec 2015 25% July 1, 2014 1.3 Physical Habitat and Water Quality Data Dec 2015 38% July 1, 2014 Task 2 Laboratory Toxicity Tests 2.1 H. azteca and S. capricornutum Tests Dec 2015 38% July 1, 2014 2.2 Dilution Series Tests Dec 2015 38% July 1, 2014 Task 3 Habitat Sampler Exposures 3.1 Deployment for Colonization Dec 2015 50% July 1, 2014 3.2 Habitat Sampler Exposure Dec 2015 50% July 1, 2014 3.3 Live Sorting Dec 2015 50% July 1, 2014 3.4 Dry Season Exposures Dec 2015 25% July 1, 2014 Task 4 Reporting 4.1 Summary Tables March 2016 38% July 1, 2014 4.2 Brief Annual Progress Reports for 2014 June 2014 100% July 1, 2014 4.3 Brief Annual Progress Reports for 2015 June 2015 0% 4.4 Draft Final Project Report March 2016 0%
Contract Progress Report
Activities Undertaken Summary of Completed Milestones The following tasks were completed during this reporting period:
• Six toxicity tests (three for Hyalella azteca and three for Selenastrum capricornutum) in the laboratory
• Six field exposures utilizing local field organisms • Two presentations given at the DPR annual meeting January 9, 2014 and Contaminants Work
Team Informal Meeting March 25, 2014 • The fall 2013 macroinvertebrate survey and the sampling for the spring 2014 survey.
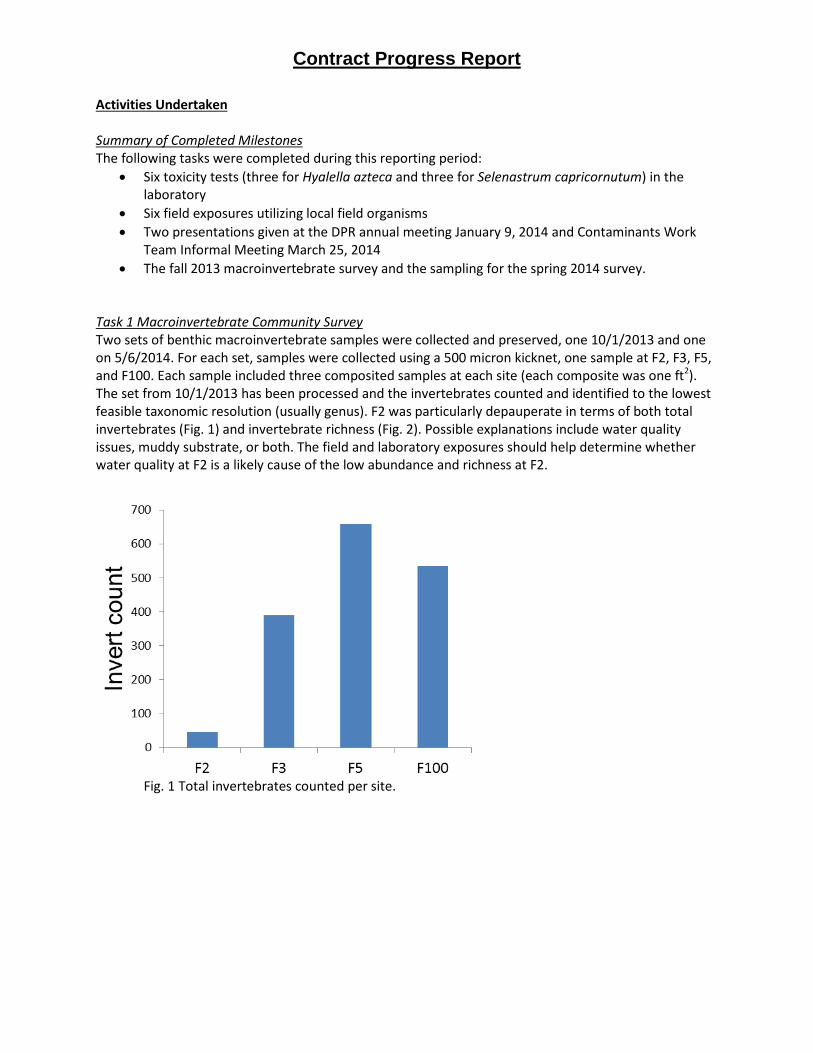
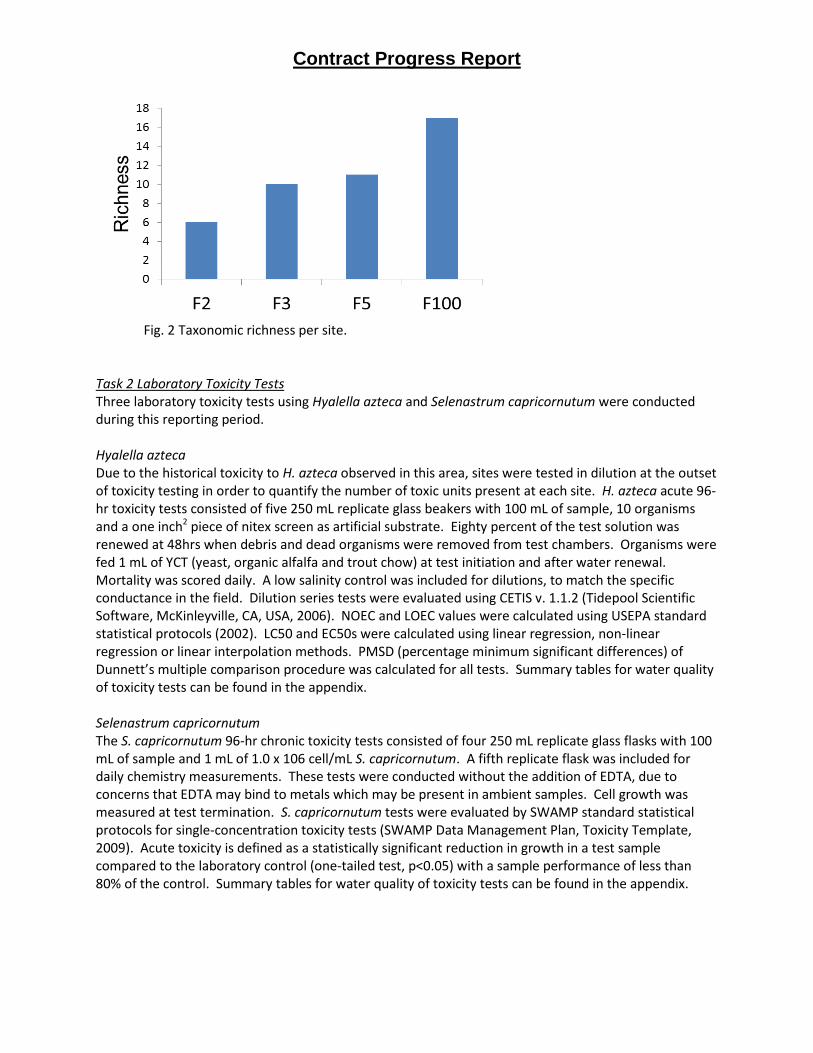
Task 1 Macroinvertebrate Community Survey Two sets of benthic macroinvertebrate samples were collected and preserved, one 10/1/2013 and one on 5/6/2014. For each set, samples were collected using a 500 micron kicknet, one sample at F2, F3, F5, and F100. Each sample included three composited samples at each site (each composite was one ft2). The set from 10/1/2013 has been processed and the invertebrates counted and identified to the lowest feasible taxonomic resolution (usually genus). F2 was particularly depauperate in terms of both total invertebrates (Fig. 1) and invertebrate richness (Fig. 2). Possible explanations include water quality issues, muddy substrate, or both. The field and laboratory exposures should help determine whether water quality at F2 is a likely cause of the low abundance and richness at F2.
Fig. 1 Total invertebrates counted per site.
Contract Progress Report
Fig. 2 Taxonomic richness per site.
Task 2 Laboratory Toxicity Tests Three laboratory toxicity tests using Hyalella azteca and Selenastrum capricornutum were conducted during this reporting period. Hyalella azteca Due to the historical toxicity to H. azteca observed in this area, sites were tested in dilution at the outset of toxicity testing in order to quantify the number of toxic units present at each site. H. azteca acute 96-hr toxicity tests consisted of five 250 mL replicate glass beakers with 100 mL of sample, 10 organisms and a one inch2 piece of nitex screen as artificial substrate. Eighty percent of the test solution was renewed at 48hrs when debris and dead organisms were removed from test chambers. Organisms were fed 1 mL of YCT (yeast, organic alfalfa and trout chow) at test initiation and after water renewal. Mortality was scored daily. A low salinity control was included for dilutions, to match the specific conductance in the field. Dilution series tests were evaluated using CETIS v. 1.1.2 (Tidepool Scientific Software, McKinleyville, CA, USA, 2006). NOEC and LOEC values were calculated using USEPA standard statistical protocols (2002). LC50 and EC50s were calculated using linear regression, non-linear regression or linear interpolation methods. PMSD (percentage minimum significant differences) of Dunnett’s multiple comparison procedure was calculated for all tests. Summary tables for water quality of toxicity tests can be found in the appendix. Selenastrum capricornutum The S. capricornutum 96-hr chronic toxicity tests consisted of four 250 mL replicate glass flasks with 100 mL of sample and 1 mL of 1.0 x 10⁶ cell/mL S. capricornutum. A fifth replicate flask was included for daily chemistry measurements. These tests were conducted without the addition of EDTA, due to concerns that EDTA may bind to metals which may be present in ambient samples. Cell growth was measured at test termination. S. capricornutum tests were evaluated by SWAMP standard statistical protocols for single-concentration toxicity tests (SWAMP Data Management Plan, Toxicity Template, 2009). Acute toxicity is defined as a statistically significant reduction in growth in a test sample compared to the laboratory control (one-tailed test, p<0.05) with a sample performance of less than 80% of the control. Summary tables for water quality of toxicity tests can be found in the appendix.
Contract Progress Report
November 21, 2013 initiation date This sampling date coincided with the field exposure conducted with organza leaf litter bags. H. aztea The 11/21/2013 exposure had the highest number of toxic units associated with the Folsom sites tested thus far, most notably sites F2 and F3, which had 17.6 and 14.6 toxic units associated with each, respectively. Sites F5 and F100 exhibited reduced mortality of H. azteca, with 3.4 and 1.1 toxic units each, respectively. Survival in the controls met all toxicity test acceptability criteria (TAC), with 100% survival in the TAC control and 98% survival in the low salinity control. Table 1 outlines toxicity data for H. azteca tests conducted during this reporting period. S. capricornutum There was no toxicity observed in any treatment in the S. capricornutum toxicity test. Control growth was 1.465 (x106) cells/mL, whereas growth in the Folsom site treatments ranged from 1.472 cells/mL (F2) to 1.935 (x106) cells/mL (F100). There was no correlation between site location and cell growth. Table 2 outlines toxicity data for S. capricornutum tests conducted during this reporting period. February 27, 2014 initiation date This sampling date coincided with the field exposure conducted between February 26 and March 2, 2014. H. azteca There was less toxicity associated with this event, with 2.3 toxic units at site F2 and 5.3 toxic units at F3. There was less than one toxic unit at sites F5 and F100. Control survival ranged from 98-100%, for the TAC and low salinity controls, respectively. S. capricornutum There was no toxicity observed in this event, and all Folsom sites performed better than the control. May 7, 2014 initiation date This sampling date coincided with the field exposure conducted between May 6 and May 10, 2014. H. azteca This exposure had the least amount of toxicity associated with the Folsom sites. Site F2 had 1.2 toxic units and all other sites had less than one toxic unit present. Survival was 100% in both control treatments. S. capricornutum There was no toxicity associated with any site in this exposure. There was a reduction in cell growth at F3 (1.821 [x106] cells/mL) compared to the control (2.242 [x106] cells/mL), which was significant (p=0.00000430). The SWAMP statistical protocol involves the examination of significant differences in test organism performance by one-tailed heteroschedastic t-test (p<0.05) and a categorization of the performance of organisms exposed to the ambient sample as either greater to or less than the control performance. For the purposes of this report, samples are considered toxic only when both a significant t-test result and performance below 80% of the control is observed. For site F3, although there was a significant t-test result, this site’s performance was 81.2% of the control and therefore is not considered toxic.

Contract Progress Report
Table 1. Summary of Toxic Units associated with Hyalella azteca laboratory toxicity tests
Date Control Survival
(%) Low Salinity Control
Survival (%) Toxic Units*
Ave SE Ave SE F2 F3 F5 F100 11/20/13 100 0 98 2 17.6 14.6 3.5 1.1 2/27/14 98 2 100 0 2.3 5.3 <1 <1 5/7/14 100 0 100 0 1.2 <1 <1 <1
*A toxic unit is defined as the actual concentration present in an ambient sample divided by the 96-hr LC50 for the species of interest. Table 2. Summary of cell growth in Selenastrum capricornutum laboratory toxicity tests
Date Cell counts (x106)
Control F2 F3 F5 F100 Ave SE Ave SE Ave SE Ave SE Ave SE
11/21/13 1.465 0.131 1.472 0.042 1.800 0.102 1.589 0.095 1.935 0.160 2/27/14 1.818 0.144 2.558 0.076 2.395 0.153 2.769 0.172 2.584 0.041 5/7/14 2.242 0.024 1.970 0.089 1.821 0.019 2.149 0.121 2.261 0.059
Task 3 Habitat Sampler Exposures Organza leaf-litter bags In our last progress report (11/19/13) we stated that invertebrates readily colonized the leaf-litter bags at F100 and survived a dry event exposure and transport back to our lab in Davis (100% survival of 113 invertebrates). Therefore, we conducted a storm water exposure from 11/18/2013 to 11/21/2013 using the following methodology: leaf litter bags that had been colonized for two weeks were placed in organza bags and deployed at F2, F3, F5, and F100 before the storm. 48h later (after the storm), the bags were transported back to Davis, aerated, sorted into ‘live’ and ‘dead’ vials, preserved, and counted and identified. We found nearly 100% survival across all four sites (Fig. 3).
Fig 3. Percent survival by site for storm #1.

Contract Progress Report
However, we noticed that the invertebrates community at F3 was dominated by flatworms, and there were very few live arthropods (Fig. 4). We were therefore concerned that the flatworms were entering the organza bags and eating the arthropods (flatworms comprise roughly 1/3 of the invertebrate population at site F3). This presents a serious problem because survival at F3 may have been low but we could not tell because flatworms may have eaten all the dead arthropods (i.e., making Fig. 3 misleading). Plotting the number of live arthropods as a function of flatworms shows a strong correlation (Fig. 5), further indicating that flatworms (and other predators) should be excluded from our habitat samplers. Thus, we cannot determine with these data whether stormwater runnoff was toxic to F100 invertebrates.
Fig. 4 Live arthropods by site. Note the low level of arthropods at F3, a site with abundant flatworms.
Fig. 5 A scatter-plot of arthropod and flatworm abundance in the organza leaf-litter bags.
Mesh cages Because of the problems with flatworms infiltrating the organza bags, we changed our methodology for sampling subsequent storms. The general method was to construct small mesh cages (‘biobarrels’, 1” x 1”, wrapped in 6”x6” 160 µm mesh and tied off with a zip-tie) into which we placed amphipods collected
Contract Progress Report
from Folsom sites (generally F100, but from F5 during the most recent event because F100 was dry). Our aims with these exposures were four-fold. Our first aim was to determine whether the constructed water quality treatment pond reduced toxicity, our second aim was to determine whether stormwater at F2 and F3 was toxic to local invertebrates, our third aim was to find the optimal balance between large mesh sizes to allow flow through the mesh cages (important for oxygenating the amphipods and exposing them to storm water) and small mesh sizes (to keep flatworms out of the cages), and our final aim was to standardize our methodology for use during the 2014-15 sampling year. Exposure from Jan 29-31, 2014 48-h storm exposure of amphipods collected from F100 and deployed to sites F2, F3, F5, F100, and a laboratory control. Percent survivals with SE in parentheses were as follows: F2: 28% (8.76%), F3: 72% (8.29%), F5:92% (2.19%), F100: 96% (1.79%), and control: 95% (2.24). Mesh size was 160 µm, cage was a small (1”x1”) biobarrel, and 5 amphipods/cage were used. No flatworms were found in the cages. Exposure from Feb 7-11, 2014 For this storm we switched to 96h exposures to make the field data more comparable to the laboratory data, and 210 µm mesh and 5 amphipods/cage were used. The switch to longer exposures did not lower the field (F100) or laboratory control survival, so we decided to move forward doing 96h exposures. Percent survivals were as follows: F2: 63.3% (3.59%), F3: 0% (0%), F5:33.33% (9.43%), F100: 73.33% (6.6%), and control: 96% (1.79%). For this event we encountered two difficulties. First, sediment deposition buried the cages at site F3, potentially contributing to the 0% survival at that site. In addition, 4 of the cages at F5 were not under water when they were collected, likely killing the amphipods. No flatworms were found in the cages. Exposure from Feb 26-March 2, 2014 The methodology for this storm was identical to the prevous (Feb 7-11) storm, except that we began using large tent stakes at sites with mud substrate. This kept the cages off the bottom, and will hopefully prevent sediment burial. Percent survivals were as follows: F2: 0% (0%), F3: 100% (0%), F5:100% (0%), F100: 92% (4.0%), and control: 96% (1.79%). We found flatworms inside two of the cages during this event. Exposure from May 6-10, 2014 For this event we began using 10 amphipods/cage enclosed in larger biobarrel cages (2”x2”) to reduce the influence of any single amphipod on our results. Otherwise, the methodology was similar to the previous exposure (210 µm mesh, large biobarrel, 96h exposure). Percent survivals were as follows: F2: 6% (2.68%), F3: 76% (5.22%), F5: 0% (0%), F100: 98% (0.81%), and control: 100% (0.0%). During this event we found many flatworms in the F2, F3, and F5 cages, and a small number in the F100 cages. At this point we decided to run an experiment to find a mesh size that excludes flatworms better than 210 µm. Exposure from June 2-6, 2014 When we arrived at Folsom to conduct this exposure we found that F100 had no water, F2 had no flowing water, and the water level at F3 was so low that there was not enough space to deploy the cages. Therefore, we decided to forgo the regular exposure and to compare the efficacy of three kinds of cage: 50mL centrifuge tubes with 210µm mesh, 50mL centrifuge tubes with 160 µm mesh, and a large modified biobarrel with 210 µm mesh. Because F100 was dry, we collected amphipods for use in the cages at F5. We deployed 5 replicates of the three kinds of cages in a pool of standing water at F2. We also deployed 5 replicates of the 50mL tubes with 160 µm mesh at F5. Survival was as follows: F2 50mL

Contract Progress Report
tubes with 160 µm mesh: 46.7% (10.11%), F2 50mL tubes with 210 µm mesh: 3.7% (2.14%), F2 bio-barrel with 210 µm mesh 66.7% (11.55%), and F5 100% (0%). We observed many flatworms in the 210 µm cages, and a few, very small flatworms in the 160 µm cages. Conclusions to date: We will proceed with 160 µm cages, 10 amphipods/cage, and 96h exposures. Task 4 Reporting This report is the brief annual progress report for June, 2014. A presentation was given at the DPR annual meeting on January 9, 2014. An additional informal update was presented at the Contaminants Work Team Meeting on March 25, 2014. These presentations are attached. List of Attachments
• Summary tables • Presentation given at the DPR annual meeting January 9, 2014 • Presentation given at the CWT meeting March 25, 2014

Contract Progress Report
Appendix

Contract Progress Report
Table A-1. Summary of water chemistry during a 96-hour H. azteca toxicity test initiated on 11/20/13 of samples collected by the California Department of Pesticide Regulation on 11/19/13.
Treatment EC (uS/cm) Temp (°C) DO (mg/L) pH Hardness
(mg/L as CaCO3) Alkalinity
(mg/L as CaCO3)
Unionized Ammonia
(mg/L)1 Min Max Min Max Min Max Min Max
Control DIEPAMHR 348 368 20.2 22.2 8.2 8.5 7.94 8.26 96 60 0.001
Low SC DIEPAMHR @ 100 uS/cm 118 155 20.4 22.0 8.1 8.3 7.82 8.35 N/A N/A N/A
F2
100% 92 137 19.6 22.0 7.4 8.2 7.75 8.16 32 20 0.035 50% 106 127 19.7 22.0 7.7 8.0 7.67 8.09 - - - 25% 113 126 20.6 21.9 8.0 8.2 7.58 8.04 - - -
12.5% 111 133 20.8 21.7 7.9 8.3 7.55 8.31 - - - 6.25% 115 140 18.8 22.0 8.1 8.3 7.53 8.13 - - -
F3
100% 107 121 20.6 21.9 8.1 8.3 7.56 8.00 28 26 0.025 50% 110 114 19.7 21.7 7.5 8.3 7.62 8.13 - - - 25% 117 134 18.8 22.0 7.9 8.4 7.60 8.11 - - -
12.5% 114 126 18.9 22.0 8.1 8.3 7.67 8.27 - - - 6.25% 115 135 18.9 22.1 8.0 8.2 7.77 8.14 - - -
F5
100% 162 162 19.1 21.9 7.9 8.2 7.67 7.92 48 34 0.026 50% 141 147 19.2 21.8 8.1 8.2 7.75 7.95 - - - 25% 130 130 19.2 22.0 8.1 8.2 7.77 8.00 - - -
12.5% 121 137 19.0 21.5 8.0 8.1 7.84 8.22 - - - 6.25% 118 131 19.0 21.5 8.0 8.4 7.81 8.15 - - -
F100
100% 161 165 19.1 23.9 7.8 8.1 7.80 8.00 52 36 0.024 50% 141 151 19.1 21.5 8.1 8.3 7.82 8.01 - - - 25% 128 140 18.6 21.4 7.9 8.5 7.89 7.97 - - -
12.5% 126 127 18.7 23.7 8.0 8.3 7.84 8.28 - - - 6.25% 124 132 18.6 23.8 8.0 8.4 7.82 8.14 - - -
1. This unionized ammonia reading is based on the ammonia-nitrogen measured upon sample receipt and upon the water chemistry measured at test initiation.
Contract Progress Report
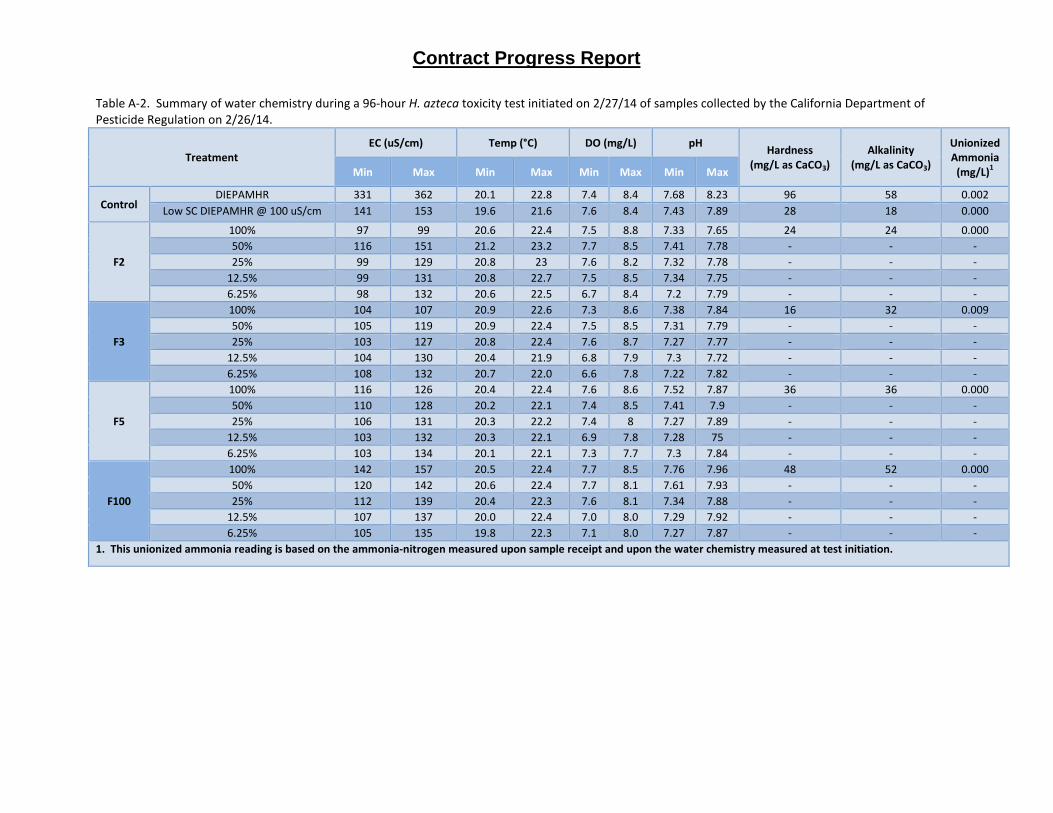
Table A-2. Summary of water chemistry during a 96-hour H. azteca toxicity test initiated on 2/27/14 of samples collected by the California Department of Pesticide Regulation on 2/26/14.
Treatment EC (uS/cm) Temp (°C) DO (mg/L) pH Hardness
(mg/L as CaCO3) Alkalinity
(mg/L as CaCO3)
Unionized Ammonia
(mg/L)1 Min Max Min Max Min Max Min Max
Control DIEPAMHR 331 362 20.1 22.8 7.4 8.4 7.68 8.23 96 58 0.002
Low SC DIEPAMHR @ 100 uS/cm 141 153 19.6 21.6 7.6 8.4 7.43 7.89 28 18 0.000
F2
100% 97 99 20.6 22.4 7.5 8.8 7.33 7.65 24 24 0.000 50% 116 151 21.2 23.2 7.7 8.5 7.41 7.78 - - - 25% 99 129 20.8 23 7.6 8.2 7.32 7.78 - - -
12.5% 99 131 20.8 22.7 7.5 8.5 7.34 7.75 - - - 6.25% 98 132 20.6 22.5 6.7 8.4 7.2 7.79 - - -
F3
100% 104 107 20.9 22.6 7.3 8.6 7.38 7.84 16 32 0.009 50% 105 119 20.9 22.4 7.5 8.5 7.31 7.79 - - - 25% 103 127 20.8 22.4 7.6 8.7 7.27 7.77 - - -
12.5% 104 130 20.4 21.9 6.8 7.9 7.3 7.72 - - - 6.25% 108 132 20.7 22.0 6.6 7.8 7.22 7.82 - - -
F5
100% 116 126 20.4 22.4 7.6 8.6 7.52 7.87 36 36 0.000 50% 110 128 20.2 22.1 7.4 8.5 7.41 7.9 - - - 25% 106 131 20.3 22.2 7.4 8 7.27 7.89 - - -
12.5% 103 132 20.3 22.1 6.9 7.8 7.28 75 - - - 6.25% 103 134 20.1 22.1 7.3 7.7 7.3 7.84 - - -
F100
100% 142 157 20.5 22.4 7.7 8.5 7.76 7.96 48 52 0.000 50% 120 142 20.6 22.4 7.7 8.1 7.61 7.93 - - - 25% 112 139 20.4 22.3 7.6 8.1 7.34 7.88 - - -
12.5% 107 137 20.0 22.4 7.0 8.0 7.29 7.92 - - - 6.25% 105 135 19.8 22.3 7.1 8.0 7.27 7.87 - - -
1. This unionized ammonia reading is based on the ammonia-nitrogen measured upon sample receipt and upon the water chemistry measured at test initiation.
Contract Progress Report
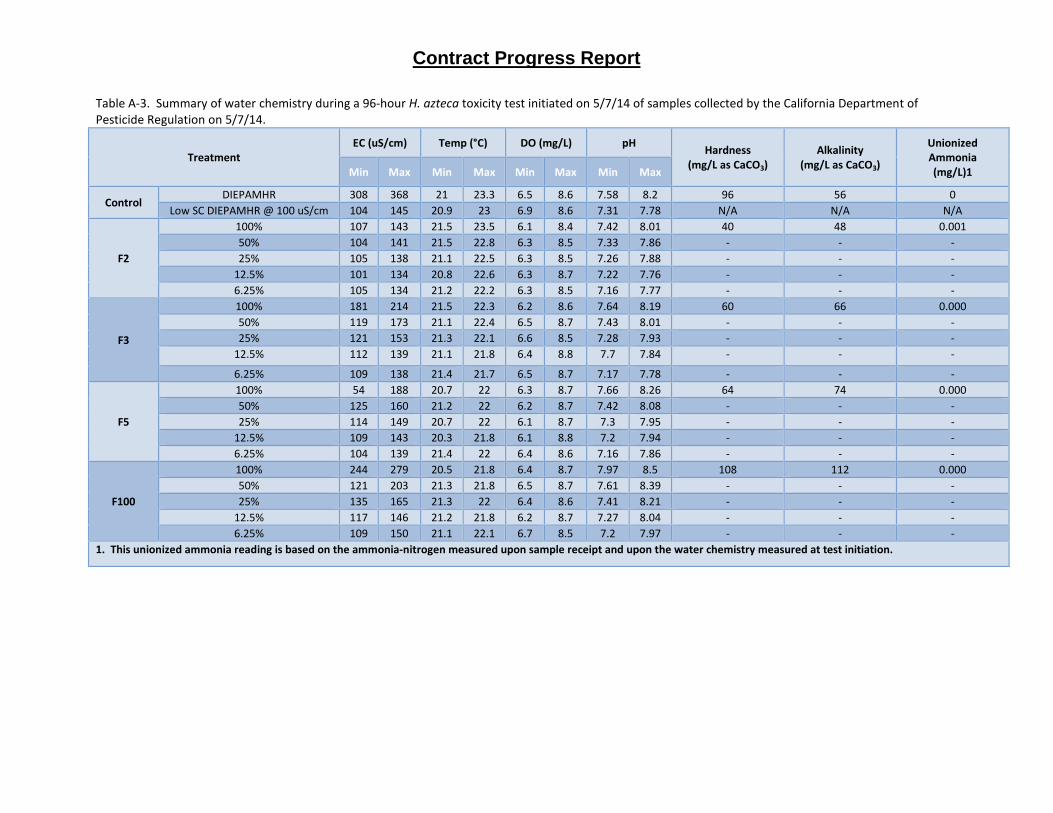
Table A-3. Summary of water chemistry during a 96-hour H. azteca toxicity test initiated on 5/7/14 of samples collected by the California Department of Pesticide Regulation on 5/7/14.
Treatment EC (uS/cm) Temp (°C) DO (mg/L) pH Hardness
(mg/L as CaCO3) Alkalinity
(mg/L as CaCO3)
Unionized Ammonia (mg/L)1 Min Max Min Max Min Max Min Max
Control DIEPAMHR 308 368 21 23.3 6.5 8.6 7.58 8.2 96 56 0
Low SC DIEPAMHR @ 100 uS/cm 104 145 20.9 23 6.9 8.6 7.31 7.78 N/A N/A N/A
F2
100% 107 143 21.5 23.5 6.1 8.4 7.42 8.01 40 48 0.001 50% 104 141 21.5 22.8 6.3 8.5 7.33 7.86 - - - 25% 105 138 21.1 22.5 6.3 8.5 7.26 7.88 - - -
12.5% 101 134 20.8 22.6 6.3 8.7 7.22 7.76 - - - 6.25% 105 134 21.2 22.2 6.3 8.5 7.16 7.77 - - -
F3
100% 181 214 21.5 22.3 6.2 8.6 7.64 8.19 60 66 0.000 50% 119 173 21.1 22.4 6.5 8.7 7.43 8.01 - - - 25% 121 153 21.3 22.1 6.6 8.5 7.28 7.93 - - -
12.5% 112 139 21.1 21.8 6.4 8.8 7.7 7.84 - - -
6.25% 109 138 21.4 21.7 6.5 8.7 7.17 7.78 - - -
F5
100% 54 188 20.7 22 6.3 8.7 7.66 8.26 64 74 0.000 50% 125 160 21.2 22 6.2 8.7 7.42 8.08 - - - 25% 114 149 20.7 22 6.1 8.7 7.3 7.95 - - -
12.5% 109 143 20.3 21.8 6.1 8.8 7.2 7.94 - - - 6.25% 104 139 21.4 22 6.4 8.6 7.16 7.86 - - -
F100
100% 244 279 20.5 21.8 6.4 8.7 7.97 8.5 108 112 0.000 50% 121 203 21.3 21.8 6.5 8.7 7.61 8.39 - - - 25% 135 165 21.3 22 6.4 8.6 7.41 8.21 - - -
12.5% 117 146 21.2 21.8 6.2 8.7 7.27 8.04 - - - 6.25% 109 150 21.1 22.1 6.7 8.5 7.2 7.97 - - -
1. This unionized ammonia reading is based on the ammonia-nitrogen measured upon sample receipt and upon the water chemistry measured at test initiation.
Contract Progress Report
1. This unionized ammonia reading is based on the ammonia-nitrogen measured at test initiation and upon water chemistry measured at test initiation.
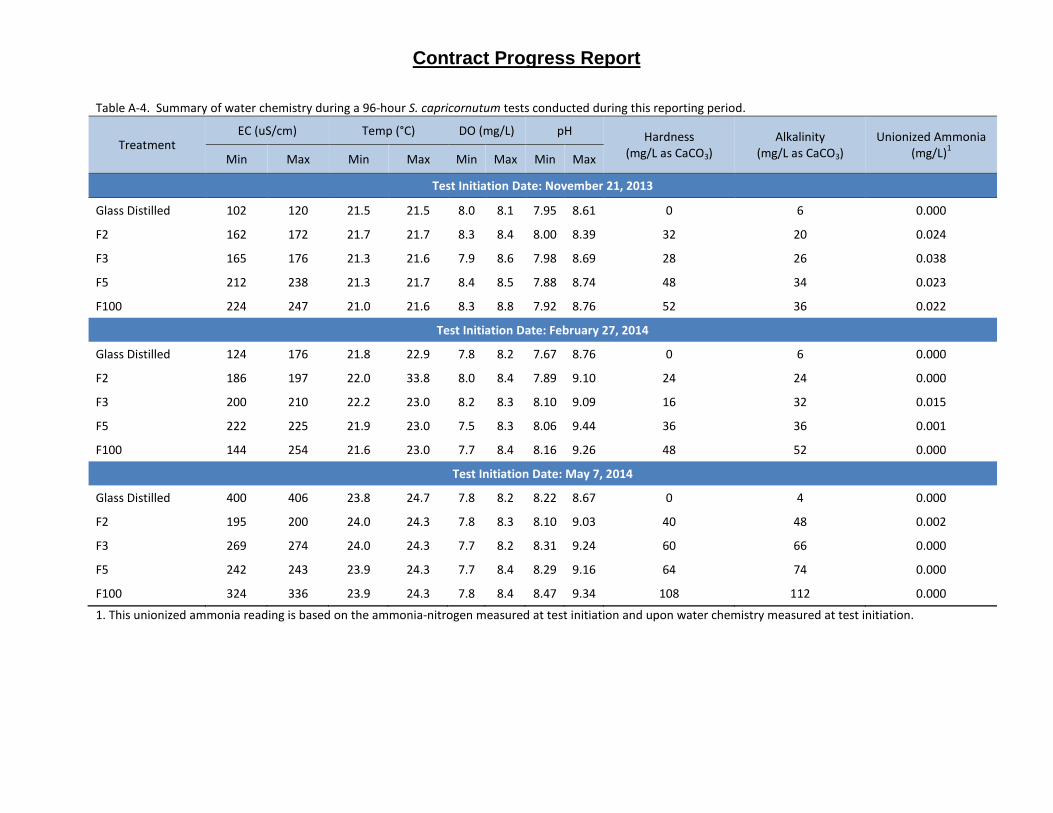
Table A-4. Summary of water chemistry during a 96-hour S. capricornutum tests conducted during this reporting period.
Treatment EC (uS/cm) Temp (°C) DO (mg/L) pH Hardness
(mg/L as CaCO3) Alkalinity
(mg/L as CaCO3) Unionized Ammonia
(mg/L)1 Min Max Min Max Min Max Min Max
Test Initiation Date: November 21, 2013
Glass Distilled 102 120 21.5 21.5 8.0 8.1 7.95 8.61 0 6 0.000
F2 162 172 21.7 21.7 8.3 8.4 8.00 8.39 32 20 0.024
F3 165 176 21.3 21.6 7.9 8.6 7.98 8.69 28 26 0.038
F5 212 238 21.3 21.7 8.4 8.5 7.88 8.74 48 34 0.023
F100 224 247 21.0 21.6 8.3 8.8 7.92 8.76 52 36 0.022
Test Initiation Date: February 27, 2014
Glass Distilled 124 176 21.8 22.9 7.8 8.2 7.67 8.76 0 6 0.000
F2 186 197 22.0 33.8 8.0 8.4 7.89 9.10 24 24 0.000
F3 200 210 22.2 23.0 8.2 8.3 8.10 9.09 16 32 0.015
F5 222 225 21.9 23.0 7.5 8.3 8.06 9.44 36 36 0.001
F100 144 254 21.6 23.0 7.7 8.4 8.16 9.26 48 52 0.000
Test Initiation Date: May 7, 2014
Glass Distilled 400 406 23.8 24.7 7.8 8.2 8.22 8.67 0 4 0.000
F2 195 200 24.0 24.3 7.8 8.3 8.10 9.03 40 48 0.002
F3 269 274 24.0 24.3 7.7 8.2 8.31 9.24 60 66 0.000
F5 242 243 23.9 24.3 7.7 8.4 8.29 9.16 64 74 0.000
F100 324 336 23.9 24.3 7.8 8.4 8.47 9.34 108 112 0.000

Contract Progress Report
Table X. Summary of water quality measured in the field at the Folsom Site for November, February and May events
Treatment EC (uS/cm) Salinity (ppt) Temp (°C) DO (mg/L) pH
Min Max Min Max Min Max Min Max Min Max
Field Date: November 18-21, 2013 F2 108 153 0.1 0.1 18.1 18.4 8.9 9.2 6.64 6.76 F3 237 293 0.1 0.1 15.3 18.6 1.8 6.1 6.59 7.08 F5 146 170 0.1 0.1 13.8 14.7 5.2 6.6 6.72 6.80 F100 239 254 0.1 0.1 12.8 15.0 6.4 9.1 6.86 7.27
Treatment EC (uS/cm) SC (uS/cm) Temp (°C) DO (mg/L) pH
Min Max Min Max Min Max Min Max Min Max
Field Date: February 26 - March 2, 2014 Lab Control 307 307 369 369 15.0 15.1 9.5 9.5 7.77 8.00 F2 88 101 110 124 14.5 15.2 9.4 10.1 6.66 6.88 F3 245 376 297 493 12.6 15.8 2.8 6.8 6.61 7.19 F5 96 134 122 167 13.5 14.5 7.0 7.2 6.72 6.76 F100 150 152 195 198 12.4 13.4 8.0 8.6 6.82 7.02
Field Date: May 6-10, 2014 Lab Control 111 368 N/A N/A 19.6 20.0 9.4 9.4 7.21 8.13 F2 152 211 N/A N/A 17.9 19.3 2.8 7.0 6.64 6.88 F3 163 293 N/A N/A 16.6 20.1 2.0 8.0 6.47 8.17 F5 132 236 N/A N/A 15.8 17.8 3.8 6.7 6.67 7.23 F100 169 169 N/A N/A 15.9 15.9 6.6 6.6 7.12 7.12
Contract Progress Report
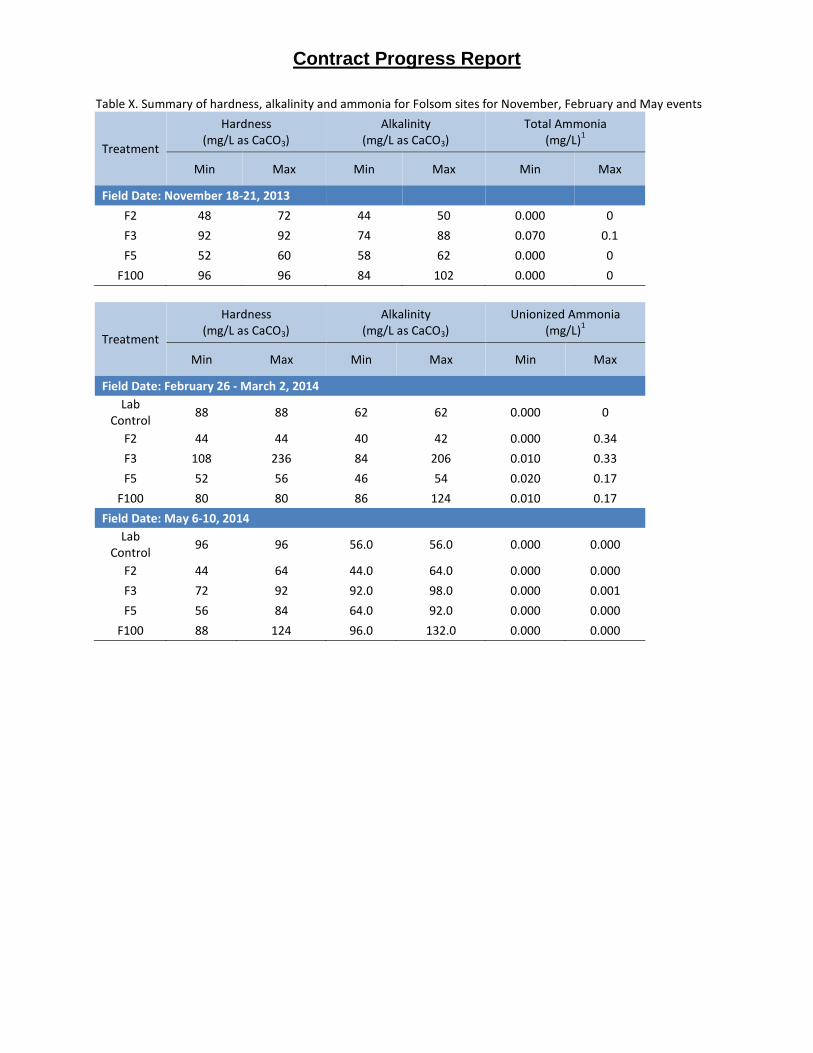
Table X. Summary of hardness, alkalinity and ammonia for Folsom sites for November, February and May events
Treatment
Hardness (mg/L as CaCO3)
Alkalinity (mg/L as CaCO3)
Total Ammonia (mg/L)1
Min Max Min Max Min Max
Field Date: November 18-21, 2013 F2 48 72 44 50 0.000 0 F3 92 92 74 88 0.070 0.1 F5 52 60 58 62 0.000 0
F100 96 96 84 102 0.000 0
Treatment
Hardness (mg/L as CaCO3)
Alkalinity (mg/L as CaCO3)
Unionized Ammonia (mg/L)1
Min Max Min Max Min Max
Field Date: February 26 - March 2, 2014 Lab
Control 88 88 62 62 0.000 0
F2 44 44 40 42 0.000 0.34 F3 108 236 84 206 0.010 0.33 F5 52 56 46 54 0.020 0.17
F100 80 80 86 124 0.010 0.17 Field Date: May 6-10, 2014
Lab Control 96 96 56.0 56.0 0.000 0.000
F2 44 64 44.0 64.0 0.000 0.000 F3 72 92 92.0 98.0 0.000 0.001 F5 56 84 64.0 92.0 0.000 0.000
F100 88 124 96.0 132.0 0.000 0.000