salary survey 2016 - icheme · why nes? • the global recruitment partner for icheme • 45...
TRANSCRIPT

ADVANCING
WORLDWIDE
C H E M I CA LENGINEERING
ADVANCING
WORLDWIDE
C H E M I CA LENGINEERING
Salary Survey 2016Analysis of the pay and benefits received by professional chemical engineers based in the UK

WWW.NESGLOBALTALENT.COM
RESOLVE YOUR RECRUITMENT HEADACHES WITH NES GLOBAL TALENTWORLD-LEADERS IN RECRUITMENT FOR THE CHEMICAL INDUSTRY
To find the right people with the specialist skills, you need the support of a talent provider with experience, expertise and an unrivalled understanding of the Chemical Industry.
Why NES?• The Global Recruitment
Partner for IChemE• 45 offices across 28 countries• 500+ discipline specific consultants• Over 35 years of Scientific
& Engineering experience• Winner of ‘International Recruitment
firm of the year’ 2015
Redefining recruitmentNES Global Talent can offer a full range of staffing solutions:
• Contract,
• Permanent (Direct) Hire,
• Managed Solutions, contingencyand project-based,
• Fully outsourced service.
Beyond recruitmentThese services are complemented by an industry leading support service and mobility package to ensure clients keep hold of the top talent in a compliant manner for as long as they need it.
Are you looking for...
• Maintenance
• Project Services
• Engineering
• Production / Operations
• Safety
• Construction
• Commissioning
• Research andDevelopment
...NES can help | T: +44 (0)161 942 4000 | E: [email protected]

33
The information in this report is given in good faith and belief in its accuracy, but does not imply the acceptance of any legal liability or responsibility whatsoever, by the Institution, or by the author, for the consequences of its use or misuse in any particular circumstances. This disclaimer shall have effect only to the extent permitted by any applicable law.
All rights reserved. No part of this publication may be reproduced or transmitted, in any form or by any means, electronic, mechanical, photocopying, recording or otherwise, without the prior permission of the publisher.
Published by:
Institution of Chemical Engineers (IChemE)
Davis Building, Railway Terrace,
Rugby, CV21 3HQ, UK
IChemE is a registered charity in England and Wales (214379), and a charity registered in Scotland (SC 039661)
IChemE offices in Kuala Lumpur, London, Melbourne, Rugby, Singapore and Wellington
© 2016 Institution of Chemical Engineers
ISBN 978-1-911446-00-2
in association with:
WWW.NESGLOBALTALENT.COM
RESOLVE YOUR RECRUITMENT HEADACHESWITH NES GLOBAL TALENTWORLD-LEADERS IN RECRUITMENT FOR THE CHEMICAL INDUSTRY
To find the right people with the specialist skills, you need the support of a talent provider with experience, expertise and an unrivalled understanding of the Chemical Industry.
Why NES?• The Global Recruitment
Partner for IChemE• 45 offices across 28 countries• 500+ discipline specific consultants• Over 35 years of Scientific
& Engineering experience• Winner of ‘International Recruitment
firm of the year’ 2015
Redefining recruitmentNES Global Talent can offer a full rangeof staffing solutions:
• Contract,
• Permanent (Direct) Hire,
• Managed Solutions, contingencyand project-based,
• Fully outsourced service.
Beyond recruitmentThese services are complemented byan industry leading support service andmobility package to ensure clients keephold of the top talent in a compliantmanner for as long as they need it.
Are you looking for...
• Maintenance
• Project Services
• Engineering
• Production / Operations
• Safety
• Construction
• Commissioning
• Research andDevelopment
...NES can help | T: +44 (0)161 942 4000 | E: [email protected]

IntroductionSummary of key findings Analysis UK Salary Survey sample UK Salary Survey notes Section AClassified by age, sex, 2015 graduation and highest qualification
Table 1 – employment status
Table 2 – current annual salary or self-employed earnings
Table 3 – benefits in kind for salaried employees
Table 4 – salary or self-employed earnings by membership grade and sex
Table 5 – salary or self-employed earnings by highest qualification
Table 6 – salary or self-employed earnings by level of responsibility – Chartered Members or Fellows
Table 7 – salary or self-employed earnings by level of responsibility – Associates
Table 8 – salary or self-employed earnings by industry sector
Table 9 – salary or self-employed earnings by type of work
Section BClassified by membership grade, class of employment and level of responsibility
Table 1 – employment status
Table 2 – current annual salary or self-employed earnings
Table 3 – benefits in kind for salaried employees
Table 4 – salary or self-employed earnings by membership grade and sex
Table 5 – salary or self-employed earnings by highest qualification
Table 6 – salary or self-employed earnings by level of responsibility – Chartered Members or Fellows
Table 7 – salary or self-employed earnings by level of responsibility – Associates
Contents
Table 8A – salary or self-employed earnings by industry sector
Table 8B – salary or self-employed earnings by industry sector
Table 8C – salary or self-employed earnings by industry sector
Table 9 – salary or self-employed earnings by type of work
Section CClassified by region
Table 1 – employment status
Table 2 – current annual salary or self-employed earnings
Table 3 – benefits in kind for salaried employees
Table 4 – salary or self-employed earnings by membership grade and sex
Table 5 – salary or self-employed earnings by highest qualification
Table 6 – salary or self-employed earnings by level or responsibility – Chartered Members or Fellows
Table 7 – salary or self-employed earnings by level of responsibility – Associates
Table 8A – salary or self-employed earnings by industry sector
Table 8B – salary or self-employed earnings by industry sector
Table 8C – salary or self-employed earnings by industry sector
Table 9 – salary or self-employed earnings by type of work
Section DClassified by industry sector
Table 1A – employment status
Table 1B – employment status
Table 2A – current annual salary or self-employed earnings
Table 2B – current annual salary or self-employed earnings
Table 3A – benefits in kind for salaried employees
Table 3B – benefits in kind for salaried employees
568
121415
16
17
19
20
21
22
23
24
26
27
28
29
31
32
33
34
35
40
53
41
42
44
45
46
47
48
49
50
51
52
36
37
38
39
54
55
56
58
60
61

5
Table 4A – salary or self-employed earnings membership grade and sex
Table 4B – salary or self-employed earnings membership grade and sex
Table 5A – salary or self-employed earnings by highest qualification
Table 5B – salary or self-employed earnings by highest qualification
Table 6A – salary or self-employed earnings by level of responsibility – Chartered Members or Fellows
Table 6B – salary or self-employed earnings by level of responsibility – Chartered Members or Fellows
Table 7A – salary or self-employed earnings by level of responsibility – Associates
Table 7B – salary or self-employed earnings by level of responsibility – Associates
Table 8A – salary or self-employed earnings by type of work
Table 8B – salary or self-employed earnings by type of work
Section EClassified by type of work
Table 1 – employment status
Table 2 – current annual salary or self-employed earnings
Table 3 – benefits in kind for salaried employees
Table 4 – salary or self-employed earnings by membership grade and sex
Table 5 – salary or self-employed earnings by highest qualification
Table 6 – salary or self-employed earnings by level of responsibility – Chartered Members or Fellows
Table 7 – salary or self-employed earnings by level of responsibility – Associates
Table 8A – salary or self-employed earnings by industry sector
Table 8B – salary or self-employed earnings by industry sector
Table 8C – salary or self-employed earnings by industry sector
In January 2016, IChemE conducted a salary survey of members in the UK. This report contains the salary data collected and a short summary comparing the 2016 data to that of previous years.
The survey was also extended to members in Australia, Malaysia, Ireland, the US, Singapore, South Africa, Canada, United Arab Emirates, India and New Zealand. The sample sizes for these countries were too small to make accurate assumptions and therefore no reports are available.
Questionnaires were sent to eligible members in January. 1,682 members participated in the survey. Of these, 54% of participants were Chartered Members.
DefinitionsThe basic measure of the survey is the median, which is the half way point: in any chosen group, 50% of the group earn more than the median, 50% earn less. The earning distributions of any group are likely to be skewed – that is, a few in the group may earn very high salaries – but it is unlikely that many earn much less than the salary offered to new graduates. Because of the skew, the average or mean is likely to be higher than the median. The median therefore gives a fairer indication of what a typical member of the group is earning. Within any group, 10% are paid less than the first decile, 50% are paid more than the median, and 10% are paid more than the ninth decile.
Disclaimer:Where a total doesn’t reconcile, the respondent did not provide complete information e.g. did not indicate male or female, age, employment status etc. Please note that this did not impact on the salary reported, only the overall participation number.
Introduction
72
62
63
64
65
66
67
68
69
70
71
73
74
76
77
78
79
80
81
82
83
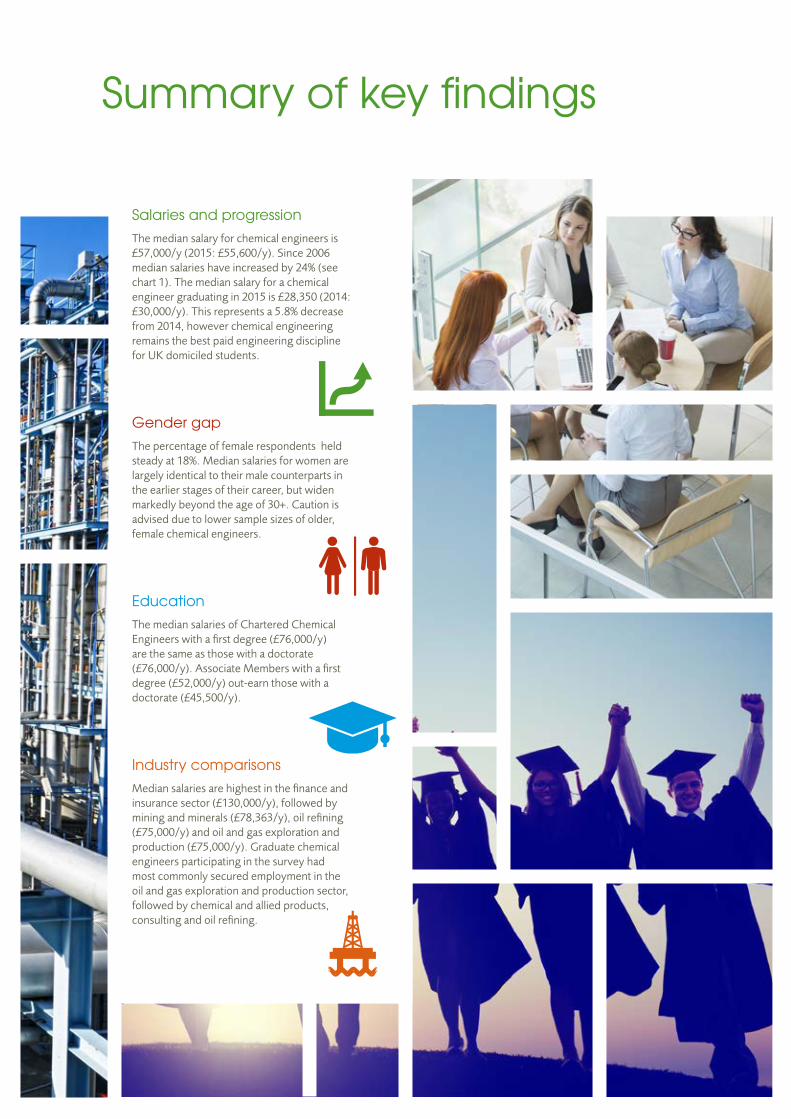
Summary of key findings
Salaries and progression The median salary for chemical engineers is £57,000/y (2015: £55,600/y). Since 2006 median salaries have increased by 24% (see chart 1). The median salary for a chemical engineer graduating in 2015 is £28,350 (2014: £30,000/y). This represents a 5.8% decrease from 2014, however chemical engineering remains the best paid engineering discipline for UK domiciled students.
Gender gapThe percentage of female respondents held steady at 18%. Median salaries for women are largely identical to their male counterparts in the earlier stages of their career, but widen markedly beyond the age of 30+. Caution is advised due to lower sample sizes of older, female chemical engineers.
EducationThe median salaries of Chartered Chemical Engineers with a first degree (£76,000/y) are the same as those with a doctorate (£76,000/y). Associate Members with a first degree (£52,000/y) out-earn those with a doctorate (£45,500/y).
Industry comparisons Median salaries are highest in the finance and insurance sector (£130,000/y), followed by mining and minerals (£78,363/y), oil refining (£75,000/y) and oil and gas exploration and production (£75,000/y). Graduate chemical engineers participating in the survey had most commonly secured employment in the oil and gas exploration and production sector, followed by chemical and allied products, consulting and oil refining.

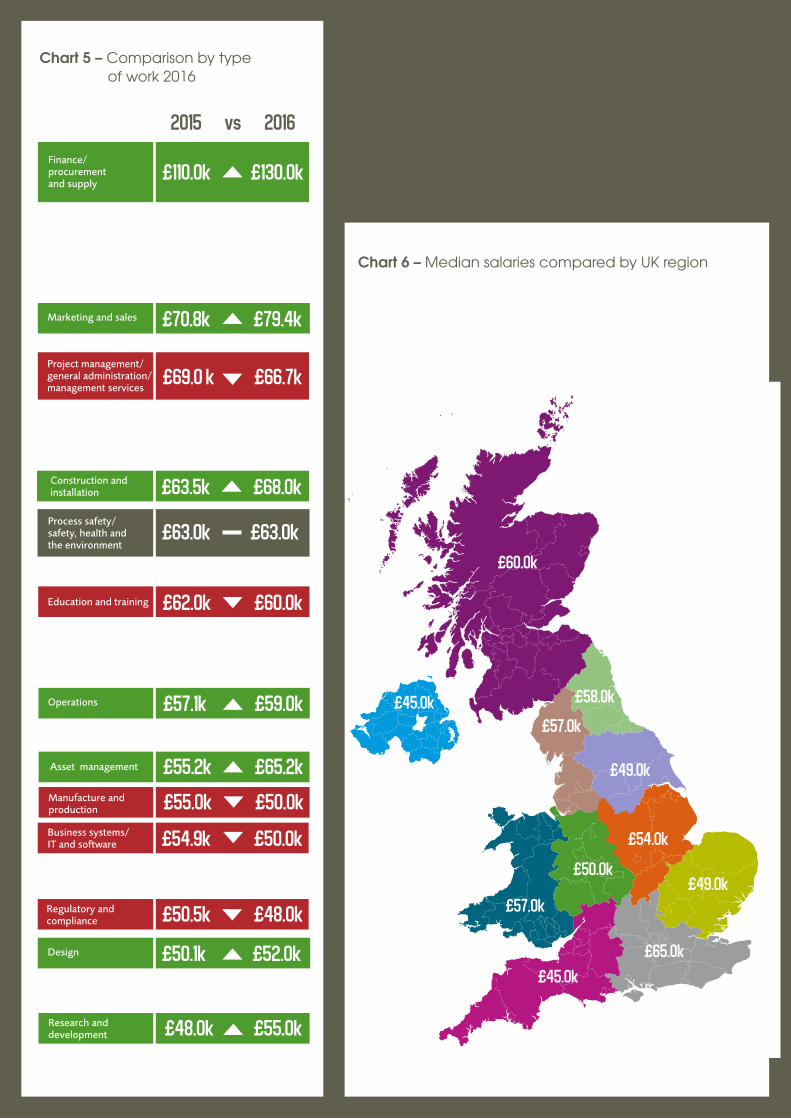
Impact of job roleSurvey participants working in a finance or financial services role reported the highest median salary of £130,000/y. However the relatively small sample size (14) means that caution is advised. The 2015 median salaries for those in the same type of work was £110,000/y. Elsewhere, survey participants working in marketing and sales reported a median salary of £79,425/y (2015: £70,700/y). Those working in construction and installation roles reported a median salary of £68,000/y (2015: £63,500/y).
Regional variation The highest paid chemical engineers can be found in the South East with median salaries of £65,000/y. Survey participants based in Scotland (£60,000/y) and North East (£58,000/y) also ranked highly.
The highest concentration of chemical and process engineers responding were in South East England. The top three industry sectors in this region are oil and gas exploration and production, contracting, and consultancy. North West is where you will find the second highest concentration of chemical engineers. The top industry sectors for this region are consulting and chemical and allied products. Scotland had the third highest concentration of chemical engineers, with oil and gas exploration and production featuring strongly.
Other benefits30% of survey participants reported receiving a company final salary or defined benefit pension, which as significantly lower than 46% in 2015. Conversely, company money purchase pensions were up to 60%, compared to 42% in 2015. 7% of participants reported receiving no pension related benefits.
75% of participants reported that their employer paid their IChemE membership fees and 60% had their dental and medical insurance paid. £ 7

36.5k23.5k
25.5k
26.7k
non-Chartered
30.0k
31.0k
33.1k
36.0k
37.0k
38.0k
40.3k
40.0k
40.0k
40.5k
42.5k
46.1k
48.3k
Chartered
53.0k
57.5k
60.4k
65.0k
70.0k
71.0k
73.0k
Analysis
Food and drink
Water
Oil & gas exploration and production
Consultancy
Chemical & allied products
Pharmaceuticals and personal care products
£37.5k
£30.0k
£27.6k
£24.2k
£27.0k
£26.5k
Chart 2 – ‘The value of the letters’: Chartered engineer versus non-Chartered comparisions 1996–2016
Chart 1 – 2015 graduate salaries by industry sector
All data refers to £k median salary/y
1996
1998
2000
2002
2004
2006
2008
2010
2012
2014
2015
2016

3
Top Decile
Median
Bottom Decile
Biochemical engineering
Chemical and allied products
Consultancy
Consumer products
Contracting
Education/Universities
Finance, insurance and risk
Food and drink
Health, safety and environment
Industrial gases
Iron, steel and other metals
Mining and minerals
£56.0k
£55.0k
£51.0k
£70.0k
£55.0k
£130.0k
£55.0k
£63.5k
£57.5k
£40.0k
£78.3k
£75.0k
£42.5k
7%
6%
7%
42%
9%
10%
16%
16%
11%
13%
36%
2%Oil and gas exploration and production
Oil refining
Petrochemicals
Pharmaceuticals and personal care products
Plastics
Power generation – fossil fuels
Power generation – nuclear decommissioning
Power generation – nuclear generation
Power generation – renewables
Process plant and equipment
Public sector*
Waste management
Water
£75.0k
£61.0k
£47.0k
£58.0k
£54.0k
£45.0k
£58.0k
£45.0k
£45.5k
£59.0k
£45.1k
£68.0k
11%
3%
9%
20%
8%
2%
3%
4%
4%
17%
Chart 4 – Chemical engineering salary trends 2006–2016
Chart 3 – Salary comparison and year-on-year trend by sector 2015–2016 *new industry category introduced in 2016
2006 2008 2010 2012 2014 2015 2016
£78.0k
£43.2k£47.0k £50.0k £53.0k £56.0k £55.6k £57.0k
£31.0k£30.7k£31.0k£28.8k£28.5k£27.3k£26.0k
£88.0k£96.0k £96.0k
£120.0k£115.0k
£120.0k
£60.0k
£45.0k
£50.0k
£57.0k
£45.0k
£65.0k
£49.0k
£54.0k
£49.0k
£57.0k
£58.0k
Chart 6 – Median salaries compared by UK region
Chart 5 – Comparison by type of work 2016 Analysis
£50.5k £48.0k
Business systems/IT and software
Design
£48.0k £55.0k
£57.1k £59.0k
£62.0k £60.0k
Process safety/safety, health and the environment
£55.2k £65.2k
£69.0 k £66.7k
£63.5k £68.0k
£70.8k £79.4k
2015 vs 2016
Finance/procurement and supply
All data refers to £k median salary/y
£110.0k £130.0k
Marketing and sales
Project management/general administration/management services
Construction and installation
Asset management
£63.0k £63.0k
Education and training
Operations
Research and development
£50.1k £52.0k
£54.9k £50.0k
Regulatory and compliance
Manufacture and production £55.0k £50.0k

3
Under 25Under 25
30 – 3430 – 34
35 – 39
35 – 3945 – 49
45 – 49
£29.0k
£48.0k
£55.0k
£61.8k
£30.0k
£50.2k
£60.0k
£80.0k
Chart 7 – Female and male salaries compared by age
Chart 8 – Chartered engineer v non-Chartered salaries compared by age
25–29 30–34 35–39 40–44 45–49 50–54
£49.0£46.5k
£45.0k
£51.5k
£62.0k £62.5k
£74.0k
£57.0k
£66.2k
£77.2k£79.6k
£85.0k
£36.7knon-Chartered
Chartered
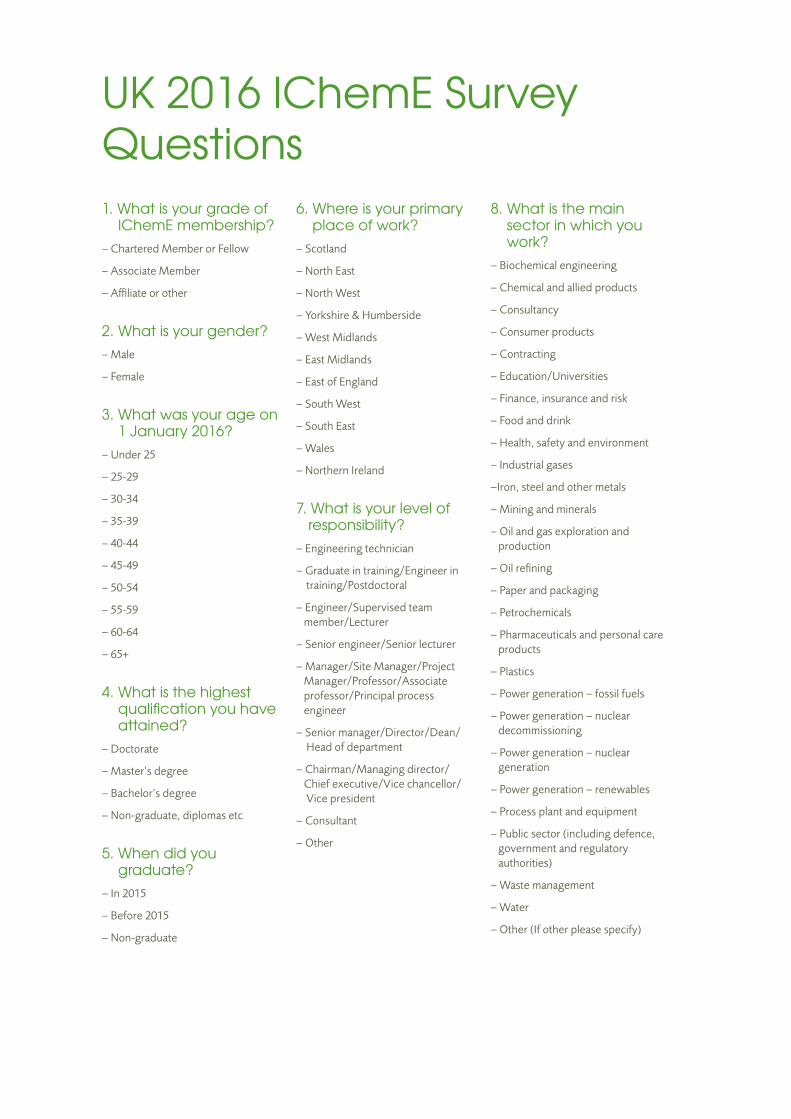
1. What is your grade of IChemE membership?– Chartered Member or Fellow
– Associate Member
– Affiliate or other
2. What is your gender?– Male
– Female
3. What was your age on 1 January 2016?– Under 25
– 25-29
– 30-34
– 35-39
– 40-44
– 45-49
– 50-54
– 55-59
– 60-64
– 65+
4. What is the highest qualification you have attained?– Doctorate
– Master’s degree
– Bachelor’s degree
– Non-graduate, diplomas etc
5. When did you graduate?– In 2015
– Before 2015
– Non-graduate
6. Where is your primary place of work?– Scotland
– North East
– North West
– Yorkshire & Humberside
– West Midlands
– East Midlands
– East of England
– South West
– South East
– Wales
– Northern Ireland
7. What is your level of responsibility?– Engineering technician
– Graduate in training/Engineer in training/Postdoctoral
– Engineer/Supervised team member/Lecturer
– Senior engineer/Senior lecturer
– Manager/Site Manager/Project Manager/Professor/Associate professor/Principal process engineer
– Senior manager/Director/Dean/ Head of department
– Chairman/Managing director/ Chief executive/Vice chancellor/ Vice president
– Consultant
– Other
8. What is the main sector in which you work?– Biochemical engineering
– Chemical and allied products
– Consultancy
– Consumer products
– Contracting
– Education/Universities
– Finance, insurance and risk
– Food and drink
– Health, safety and environment
– Industrial gases
–Iron, steel and other metals
– Mining and minerals
– Oil and gas exploration and production
– Oil refining
– Paper and packaging
– Petrochemicals
– Pharmaceuticals and personal care products
– Plastics
– Power generation – fossil fuels
– Power generation – nuclear decommissioning
– Power generation – nuclear generation
– Power generation – renewables
– Process plant and equipment
– Public sector (including defence, government and regulatory authorities)
– Waste management
– Water
– Other (If other please specify)
UK 2016 IChemE Survey Questions

313
9. What is your main type of work?– Asset management
– Business systems, IT and software
– Construction and installation
– Design
– Education and training
– Finance/financial services/procurement/supply
– Manufacture and production
– Marketing and sales
– Operations
– Process safety/safety health and environment
– Project management/general administration/ management services
– Regulations/regulatory compliance
– Research and development
– Other (If other please specify)
10. What is the status of your employment?– Full time
– Part time
11. (for those who answered ‘part time’)
How many hours per 4 week period did you typically work in 2015? (Nearest to the whole number, no decimals allowed)
12. What was your total earned income (including bonuses), before tax, in 2015? eg 56000 (no commas, decimal places, £, $, etc.)
13. What pension related benefits in kind do you receive from your employer?– Defined benefit pension/company final salary scheme
– Defined contribution pension/company money purchase scheme
– Non-contributory pension
– Superannuation (Australia/NZ)
– Central Providence Fund (Singapore)
– 401k savings plan (US)
– None
14. What other benefits in kind do you receive from your employer?– Medical and dental insurance
– Car and car allowance
– Company share scheme
– Life insurance
– Loans
– IChemE membership fees
– Other professional membership fees
– Childcare
– None
– Other (If other please specify)

I. Level of responsibility■■ Engineering technician: A member in employment, likely to be working in a process engineering support role such
as technician or operator but without a formal chemical engineering undergraduate degree-level qualification.
■■ Graduate in training/Engineer in training/ Postdoctoral: A member in employment receiving training. Work is defined in detail and calculation and designs are subject to checking.
■■ Engineer/Supervised team member/Lecturer: A member who has completed practical training and now works in a chosen field, generally as a member of a project team, or supervised by a section leader - spot checks are made on the work, may have technicians or artisans reporting to him or her for experimental work.
■■ Senior engineer/Senior lecturer: A member working alone or as a member of a project team with responsibility for the major part of the project. Only work affecting major areas of safety are checked, responsibility for expenditure within the budget. In addition, one who is a senior teacher or lecturer at a college or university with responsibility for a particular course or subject.
■■ Manager/Site manager/Project manager/Professor/Associate professor/Principal engineer: A member working as a section leader/project manager with responsibility for a major project or section including responsibility for the work of the section and for expenditure, i.e. sets the budgets for subordinates. Also professor.
■■ Senior manager/Director/Dean/Head of department: A member working as a manager or director with responsibility for several sections/projects, responsible for expenditure and profit as well as technical aspects of the project. In addition, one who is a vice-principal at a college or head of department or dean at a university.
■■ Chairman/ Managing director/Chief executive/Vice chancellor/Vice president: A member working as a managing director or chief executive with total responsibility for policy, technical and administrative work, or one who is principal of a college or vice-chancellor of a university. (‘The buck stops here’).
■■ Consultant:. A member who is either self-employed, or employed by others, providing professional advice and services to another party (client).
II. Total earned income - salaried employmentPlease enter the rate of annual earnings in the specified currency on the 1 January 2016 from salaried employment in accordance with the notes below:
1. Income Tax and National Insurance contributions or contributions you make under a group superannuation scheme should be included.
2. Any insurance or superannuation contribution paid by an employer should be excluded.
3. Benefits in kind (e.g. employer contributions to pension schemes, use of car, sickness or accident insurance cover, accommodation at a nominal rent) should be excluded.
4. ‘Current Annual Salary’ should be taken to mean:
a) the basic rate of annual salary received from the sole or principal employer on 1 January 2016; plus
b) bonus payments including ‘thirteenth month’ payments. Director’s or manager’s fees, share of profits, commission, and other honoraria received from the sole or principal employer, during 2015.
5. Refunds of expenses incurred should be excluded.
Salary survey notes
Classified by age, sex, 2015 graduation and highest qualification
Section A
15

Section A Classified by age, sex, 2015 graduation and highest qualification
SECTION A / TABLE 1 : EMPLOYMENT STATUS
Under 25 25-29 30-34 35-39 40-44 45-49 50-54 55-59 60-64 65+ Doctorate Masters Bachelors Non-grad Male FemaleTotal 1682 139 309 213 198 204 208 203 124 64 20 68 167 895 609 11 1376 305
% 100% 100% 100% 100% 100% 100% 100% 100% 100% 100% 100% 100% 100% 100% 100% 100% 100% 100%Total 1606 139 307 208 194 193 196 195 119 49 6 68 152 864 579 11 1337 269
% 96% 100% 99% 98% 98% 95% 94% 96% 96% 77% 30% 100% 91% 97% 95% 100% 97% 88%Total 75 0 2 5 4 10 12 8 5 15 14 0 15 30 30 0 39 36
% 4% 0% 1% 2% 2% 5% 6% 4% 4% 23% 70% 0% 9% 3% 5% 0% 3% 12%
GenderTotal
Total
Full time
Part time
Age BandGraduate 2015
Highest Qualification
16

Section A Classified by age, sex, 2015 graduation and highest qualification
SECTION A / TABLE 2 : CURRENT ANNUAL SALARY OR SELF EMPLOYED EARNINGS
Under 25 25-29 30-34 35-39 40-44 45-49 50-54 55-59 60-64 65+ Doctorate Masters Bachelors Non-grad Male FemaleTotal 1682 139 309 213 198 204 208 203 124 64 20 68 167 895 609 11 1376 306<£16K 10 4 1 1 0 0 1 1 1 1 0 5 0 8 2 0 9 1>=£16K 2 2 0 0 0 0 0 0 0 0 0 1 0 0 1 1 2 0>=£18K 3 1 0 0 0 0 0 0 1 1 0 1 0 1 2 0 3 0>=£19K 1 1 0 0 0 0 0 0 0 0 0 1 0 1 0 0 1 0>=£20K 6 2 3 0 0 0 0 0 0 0 1 1 0 3 3 0 4 2>=£21K 3 0 1 0 1 1 0 0 0 0 0 0 0 1 2 0 0 3>=£22K 5 4 0 0 0 0 1 0 0 0 0 2 0 5 0 0 3 2>=£23K 3 2 0 0 0 1 0 0 0 0 0 1 0 3 0 0 2 1>=£24K 5 2 1 0 0 0 1 0 0 0 1 2 0 4 1 0 3 2>=£25K 18 9 4 2 1 0 0 0 0 0 2 7 0 11 6 1 11 7>=£26K 11 6 5 0 0 0 0 0 0 0 0 5 0 9 2 0 7 4>=£27K 5 4 0 0 1 0 0 0 0 0 0 2 0 4 1 0 3 2>=£28K 30 17 9 2 0 1 0 0 1 0 0 11 2 25 3 0 17 13>=£29K 27 7 15 4 1 0 0 0 0 0 0 3 1 19 7 0 22 5>=£30K 33 16 13 1 0 0 1 0 0 1 1 7 3 25 5 0 27 6>=£31K 18 7 6 1 0 1 2 1 0 0 0 2 4 12 2 0 9 9>=£32K 35 11 19 3 1 0 0 0 0 1 0 3 1 29 5 0 23 12>=£33K 25 7 14 1 0 2 1 0 0 0 0 1 1 20 4 0 16 9>=£34K 24 6 10 4 2 0 0 0 0 2 0 2 2 18 4 0 18 6>=£35K 28 7 16 5 0 0 0 0 0 0 0 0 1 24 3 0 23 5>=£36K 39 4 26 3 2 1 2 0 1 0 0 1 0 33 6 0 29 10>=£37K 30 4 17 7 2 0 0 0 0 0 0 1 1 24 5 0 24 6>=£38K 28 3 13 6 3 1 0 2 0 0 0 0 2 23 3 0 20 8>=£39K 19 1 10 4 2 2 0 0 0 0 0 1 6 13 0 0 13 6>=£40K 138 10 53 28 19 12 3 10 1 1 1 3 16 93 29 0 106 32>=£45K 119 1 26 33 22 16 8 3 3 6 1 1 11 69 37 2 84 35>=£50K 107 0 19 27 19 12 15 7 3 2 3 0 13 60 33 1 86 21>=£55K 118 0 17 16 27 15 18 10 10 4 1 1 13 61 42 2 96 22>=£60K 95 0 4 19 14 15 11 16 11 4 1 0 12 41 42 0 83 12>=£65K 78 0 2 12 10 15 15 14 7 3 0 0 7 31 40 0 61 17>=£70K 79 0 1 11 9 11 16 14 14 3 0 0 10 29 39 1 68 11>=£75K 67 0 0 6 8 14 16 14 6 2 1 0 6 20 41 0 61 6>=£80K 60 1 1 4 10 11 12 12 6 2 1 0 9 22 29 0 53 7>=£85K 45 0 1 2 7 8 9 8 3 6 1 0 9 14 22 0 41 4>=£90K 51 0 0 2 7 15 12 10 5 0 0 0 4 21 26 0 47 4>=£95K 35 0 0 0 9 5 10 4 5 1 1 1 3 14 18 0 32 3>=£100K 30 0 0 4 4 2 8 5 4 3 0 1 7 7 16 0 27 3>=£105K 29 0 0 0 3 6 7 6 5 1 1 0 1 11 17 0 29 0>=£110K 23 0 0 1 2 5 4 2 3 5 1 0 3 11 9 0 21 2>=£115K 18 0 0 0 1 4 3 7 2 1 0 0 0 6 12 0 18 0
SECTION A / TABLE 2 : CURRENT ANNUAL SALARY OR SELF EMPLOYED EARNINGS Cont'd
TotalGraduate
2015 GenderUnder 25 25-29 30-34 35-39 40-44 45-49 50-54 55-59 60-64 65+ Doctorate Masters Bachelors Non-grad Male Female
>=£120K 37 0 1 2 3 4 11 11 3 2 0 0 7 14 16 0 34 3>=£125K 20 0 0 0 1 2 5 9 2 1 0 1 1 9 10 0 19 1>=£130K 15 0 0 1 2 6 0 2 3 1 0 0 0 6 9 0 15 0>=£135K 12 0 1 0 1 1 1 1 4 2 1 0 1 4 7 0 11 1>=£140K 13 0 0 0 1 2 0 8 2 0 0 0 4 4 5 0 13 0>=£145K 7 0 0 0 0 1 2 2 2 0 0 0 1 4 2 0 7 0>=£150K 41 0 0 1 0 6 9 16 5 4 0 0 3 17 19 2 40 1>=£200K 17 0 0 0 0 4 2 4 4 2 1 0 1 6 9 1 16 1>=£250K 20 0 0 0 3 2 2 4 7 2 0 0 1 6 13 0 19 1Total 1,682 139 309 213 198 204 208 203 124 64 20 68 167 895 609 11 1376 306Mean 70,637 30,585 39,886 53,741 70,759 81,627 88,131 100,778 107,930 102,514 69,650 31,617 72,034 60,973 84,272 80,807 75,024 50,908Median 57,000 30,000 37,500 50,000 58,740 72,750 78,000 83,000 81,000 82,000 54,250 28,350 61,000 47,500 71,000 55,000 60,186 45,0001st Decile 31,000 22,500 29,000 35,005 41,770 44,000 50,000 53,500 55,000 44,000 24,500 18,000 38,000 29,350 37,000 25,000 32,400 28,0009th Decile 120,000 38,930 54,000 75,000 100,008 130,000 125,000 150,000 183,131 165,000 122,500 42,000 120,000 109,000 130,000 160,000 125,000 80,000
Gender
Age Band Highest Qualification
TotalAge Band Graduate
2015Highest Qualification
17

Section A Classified by age, sex, 2015 graduation and highest qualification
SECTION A / TABLE 2 : CURRENT ANNUAL SALARY OR SELF EMPLOYED EARNINGS
Under 25 25-29 30-34 35-39 40-44 45-49 50-54 55-59 60-64 65+ Doctorate Masters Bachelors Non-grad Male FemaleTotal 1682 139 309 213 198 204 208 203 124 64 20 68 167 895 609 11 1376 306<£16K 10 4 1 1 0 0 1 1 1 1 0 5 0 8 2 0 9 1>=£16K 2 2 0 0 0 0 0 0 0 0 0 1 0 0 1 1 2 0>=£18K 3 1 0 0 0 0 0 0 1 1 0 1 0 1 2 0 3 0>=£19K 1 1 0 0 0 0 0 0 0 0 0 1 0 1 0 0 1 0>=£20K 6 2 3 0 0 0 0 0 0 0 1 1 0 3 3 0 4 2>=£21K 3 0 1 0 1 1 0 0 0 0 0 0 0 1 2 0 0 3>=£22K 5 4 0 0 0 0 1 0 0 0 0 2 0 5 0 0 3 2>=£23K 3 2 0 0 0 1 0 0 0 0 0 1 0 3 0 0 2 1>=£24K 5 2 1 0 0 0 1 0 0 0 1 2 0 4 1 0 3 2>=£25K 18 9 4 2 1 0 0 0 0 0 2 7 0 11 6 1 11 7>=£26K 11 6 5 0 0 0 0 0 0 0 0 5 0 9 2 0 7 4>=£27K 5 4 0 0 1 0 0 0 0 0 0 2 0 4 1 0 3 2>=£28K 30 17 9 2 0 1 0 0 1 0 0 11 2 25 3 0 17 13>=£29K 27 7 15 4 1 0 0 0 0 0 0 3 1 19 7 0 22 5>=£30K 33 16 13 1 0 0 1 0 0 1 1 7 3 25 5 0 27 6>=£31K 18 7 6 1 0 1 2 1 0 0 0 2 4 12 2 0 9 9>=£32K 35 11 19 3 1 0 0 0 0 1 0 3 1 29 5 0 23 12>=£33K 25 7 14 1 0 2 1 0 0 0 0 1 1 20 4 0 16 9>=£34K 24 6 10 4 2 0 0 0 0 2 0 2 2 18 4 0 18 6>=£35K 28 7 16 5 0 0 0 0 0 0 0 0 1 24 3 0 23 5>=£36K 39 4 26 3 2 1 2 0 1 0 0 1 0 33 6 0 29 10>=£37K 30 4 17 7 2 0 0 0 0 0 0 1 1 24 5 0 24 6>=£38K 28 3 13 6 3 1 0 2 0 0 0 0 2 23 3 0 20 8>=£39K 19 1 10 4 2 2 0 0 0 0 0 1 6 13 0 0 13 6>=£40K 138 10 53 28 19 12 3 10 1 1 1 3 16 93 29 0 106 32>=£45K 119 1 26 33 22 16 8 3 3 6 1 1 11 69 37 2 84 35>=£50K 107 0 19 27 19 12 15 7 3 2 3 0 13 60 33 1 86 21>=£55K 118 0 17 16 27 15 18 10 10 4 1 1 13 61 42 2 96 22>=£60K 95 0 4 19 14 15 11 16 11 4 1 0 12 41 42 0 83 12>=£65K 78 0 2 12 10 15 15 14 7 3 0 0 7 31 40 0 61 17>=£70K 79 0 1 11 9 11 16 14 14 3 0 0 10 29 39 1 68 11>=£75K 67 0 0 6 8 14 16 14 6 2 1 0 6 20 41 0 61 6>=£80K 60 1 1 4 10 11 12 12 6 2 1 0 9 22 29 0 53 7>=£85K 45 0 1 2 7 8 9 8 3 6 1 0 9 14 22 0 41 4>=£90K 51 0 0 2 7 15 12 10 5 0 0 0 4 21 26 0 47 4>=£95K 35 0 0 0 9 5 10 4 5 1 1 1 3 14 18 0 32 3>=£100K 30 0 0 4 4 2 8 5 4 3 0 1 7 7 16 0 27 3>=£105K 29 0 0 0 3 6 7 6 5 1 1 0 1 11 17 0 29 0>=£110K 23 0 0 1 2 5 4 2 3 5 1 0 3 11 9 0 21 2>=£115K 18 0 0 0 1 4 3 7 2 1 0 0 0 6 12 0 18 0
SECTION A / TABLE 2 : CURRENT ANNUAL SALARY OR SELF EMPLOYED EARNINGS Cont'd
TotalGraduate
2015 GenderUnder 25 25-29 30-34 35-39 40-44 45-49 50-54 55-59 60-64 65+ Doctorate Masters Bachelors Non-grad Male Female
>=£120K 37 0 1 2 3 4 11 11 3 2 0 0 7 14 16 0 34 3>=£125K 20 0 0 0 1 2 5 9 2 1 0 1 1 9 10 0 19 1>=£130K 15 0 0 1 2 6 0 2 3 1 0 0 0 6 9 0 15 0>=£135K 12 0 1 0 1 1 1 1 4 2 1 0 1 4 7 0 11 1>=£140K 13 0 0 0 1 2 0 8 2 0 0 0 4 4 5 0 13 0>=£145K 7 0 0 0 0 1 2 2 2 0 0 0 1 4 2 0 7 0>=£150K 41 0 0 1 0 6 9 16 5 4 0 0 3 17 19 2 40 1>=£200K 17 0 0 0 0 4 2 4 4 2 1 0 1 6 9 1 16 1>=£250K 20 0 0 0 3 2 2 4 7 2 0 0 1 6 13 0 19 1Total 1,682 139 309 213 198 204 208 203 124 64 20 68 167 895 609 11 1376 306Mean 70,637 30,585 39,886 53,741 70,759 81,627 88,131 100,778 107,930 102,514 69,650 31,617 72,034 60,973 84,272 80,807 75,024 50,908Median 57,000 30,000 37,500 50,000 58,740 72,750 78,000 83,000 81,000 82,000 54,250 28,350 61,000 47,500 71,000 55,000 60,186 45,0001st Decile 31,000 22,500 29,000 35,005 41,770 44,000 50,000 53,500 55,000 44,000 24,500 18,000 38,000 29,350 37,000 25,000 32,400 28,0009th Decile 120,000 38,930 54,000 75,000 100,008 130,000 125,000 150,000 183,131 165,000 122,500 42,000 120,000 109,000 130,000 160,000 125,000 80,000
Gender
Age Band Highest Qualification
TotalAge Band Graduate
2015Highest Qualification
18

Section A Classified by age, sex, 2015 graduation and highest qualification
SECTION A / TABLE 3 : BENEFITS IN KIND FOR SALARIED EMPLOYEES
Under 25 25-29 30-34 35-39 40-44 45-49 50-54 55-59 60-64 65+ Doctorate Masters Bachelors Non-grad Male FemaleTotal 1682 139 309 213 198 204 208 203 124 64 20 68 167 895 609 11 1376 306Total 4 1 0 0 0 0 0 2 0 1 0 0 0 0 4 0 4 0
% 0% 1% 0% 0% 0% 0% 0% 1% 0% 2% 0% 0% 0% 0% 1% 0% 0% 0%
Total 2 0 1 0 0 0 0 0 0 0 1 0 0 1 1 0 2 0
% 0% 0% 0% 0% 0% 0% 0% 0% 0% 0% 5% 0% 0% 0% 0% 0% 0% 0%
Total 499 36 74 51 65 65 66 73 49 18 2 22 66 259 172 2 413 86
% 30% 26% 24% 24% 33% 32% 32% 36% 40% 28% 10% 32% 40% 29% 28% 18% 30% 28%
Total 1013 91 211 134 118 116 127 120 58 30 8 36 89 555 362 7 813 200
% 60% 66% 68% 63% 60% 57% 61% 59% 47% 47% 40% 53% 53% 62% 59% 64% 59% 65%Total 54 2 8 11 3 10 5 3 6 3 3 2 2 29 23 0 46 8
% 3% 1% 3% 5% 2% 5% 2% 2% 5% 5% 15% 3% 1% 3% 4% 0% 3% 3%Total 110 9 15 17 12 13 10 5 11 12 6 8 10 51 47 2 98 12
% 7% 7% 5% 8% 6% 6% 5% 3% 9% 19% 30% 12% 6% 6% 8% 18% 7% 4%Total 1007 71 157 121 130 130 133 143 81 30 11 26 86 513 400 8 839 168
% 60% 51% 51% 57% 66% 64% 64% 70% 65% 47% 55% 38% 52% 57% 66% 73% 61% 55%Total 505 14 16 24 61 96 94 102 65 28 5 7 54 187 260 4 445 60
% 30% 10% 5% 11% 31% 47% 45% 50% 52% 44% 25% 10% 32% 21% 43% 36% 32% 20%Total 493 52 79 67 61 67 57 61 36 13 0 16 36 297 158 2 404 89
% 29% 37% 26% 32% 31% 33% 27% 30% 29% 20% 0% 24% 22% 33% 26% 18% 29% 29%Total 619 43 92 69 70 92 90 85 48 24 6 17 57 300 256 6 528 91
% 37% 31% 30% 32% 35% 45% 43% 42% 39% 38% 30% 25% 34% 34% 42% 55% 38% 30%Total 64 15 11 5 4 10 10 6 2 1 0 11 5 37 20 2 54 10
% 4% 11% 4% 2% 2% 5% 5% 3% 2% 2% 0% 16% 3% 4% 3% 18% 4% 3%Total 1266 109 248 177 152 160 151 145 83 29 12 43 104 718 436 8 1034 232
% 75% 78% 80% 83% 77% 78% 73% 71% 67% 45% 60% 63% 62% 80% 72% 73% 75% 76%
Total 209 18 31 17 25 28 28 25 22 9 6 9 32 104 70 3 172 37
% 12% 13% 10% 8% 13% 14% 14% 12% 18% 14% 30% 13% 19% 12% 12% 27% 13% 12%Total 152 11 16 29 45 28 13 6 4 0 0 8 15 86 50 1 118 34
% 9% 8% 5% 14% 23% 14% 6% 3% 3% 0% 0% 12% 9% 10% 8% 9% 9% 11%Total 171 12 27 18 20 24 22 15 12 15 6 10 35 79 55 2 140 31
% 10% 9% 9% 9% 10% 12% 11% 7% 10% 23% 30% 15% 21% 9% 9% 18% 10% 10%Total 53 7 14 4 5 6 6 5 3 1 2 3 5 24 20 4 41 12
% 3% 5% 5% 2% 3% 3% 3% 3% 2% 2% 10% 4% 3% 3% 3% 36% 3% 4%
Company share scheme
Graduate 2015Highest Qualification Gender
401k savings plan (US)
Central Providence Fund (Singapore)
Defined benefit pension/Company final salary scheme
TotalAge Band
Defined contribution pension/Company money purchase scheme
Non-contributory pension
None
Medical and dental insurance
Car or car allowance
Other
Life insurance
Loans
IChemE membership fees
Other professional membership fees
Childcare
None
19

Section A Classified by age, sex, 2015 graduation and highest qualification
SECTION A / TABLE 4 : SALARY OR SELF EMPLOYED EARNINGS BY GRADE AND SEX
Under 25 25-29 30-34 35-39 40-44 45-49 50-54 55-59 60-64 65+ Doctorate Masters Bachelors Non-grad Male FemaleTotal 933 1 37 109 118 152 170 169 101 59 17 2 97 392 441 3 810 123Median 73,000 20,000 46,500 57,000 66,200 77,238 79,600 85,000 80,000 85,000 57,000 76,250 76,000 67,500 76,000 70,080 76,000 58,600Mean 88,406 20,000 48,472 60,402 80,626 84,444 92,232 103,612 109,522 105,693 73,441 76,250 85,833 84,406 92,367 112,027 92,371 62,2961st Decile 45,000 20,000 38,000 40,000 45,000 47,000 50,313 55,000 54,000 45,200 24,000 56,000 49,000 42,000 48,000 56,000 47,500 36,0579th Decile 135,000 20,000 62,400 83,000 110,000 130,000 129,131 150,000 183,131 165,000 135,000 96,500 135,000 130,000 135,000 210,000 140,000 90,000Total 749 138 272 104 80 52 38 34 23 5 3 66 70 503 168 8 566 183Median 40,000 30,000 36,744 45,000 51,500 62,000 62,517 73,964 84,292 49,000 51,500 28,196 45,500 37,500 52,000 50,000 41,000 38,500Mean 48,503 30,662 38,718 46,760 56,205 73,393 69,782 86,691 100,938 65,000 48,167 30,264 52,914 42,711 63,025 69,100 50,200 43,2551st Decile 28,000 23,500 29,000 32,000 37,334 42,000 45,000 41,000 61,000 9,998 30,000 18,000 31,000 28,000 28,500 17,000 29,000 26,0009th Decile 79,200 38,930 51,000 61,600 85,000 110,000 105,000 150,000 145,500 173,000 63,000 39,000 84,500 60,125 100,008 160,000 83,000 64,000Total 1,376 92 238 154 161 168 174 189 117 63 20 46 144 690 531 11 1,376 0Median 60,186 30,000 37,500 50,230 60,000 76,588 80,000 84,000 81,000 80,000 54,250 28,727 62,000 50,000 74,000 55,000 60,186Mean 75,024 30,582 40,128 55,588 72,163 86,641 93,678 102,750 107,660 101,998 69,650 30,876 75,277 65,654 87,012 80,807 75,0241st Decile 32,400 22,000 29,000 36,000 43,000 47,000 53,000 53,923 55,000 44,000 24,500 16,000 40,000 30,000 37,900 25,000 32,4009th Decile 125,000 38,375 54,800 80,000 100,000 130,000 129,217 150,000 183,131 165,000 122,500 42,000 120,000 118,500 131,500 160,000 125,000Total 306 47 71 59 37 36 34 14 7 1 0 22 23 205 78 0 0 306Median 45,000 29,000 38,500 48,000 55,000 54,400 61,800 75,500 90,300 135,000 27,500 40,000 40,100 57,800 45,000Mean 50,908 30,592 39,076 48,920 64,646 58,231 59,740 74,153 112,427 135,000 33,166 51,732 45,217 65,623 50,9081st Decile 28,000 25,000 30,000 31,000 38,000 31,000 31,086 42,736 36,000 135,000 24,500 30,000 28,000 33,000 28,0009th Decile 80,000 40,500 51,000 70,000 100,008 90,000 80,000 95,000 240,000 135,000 42,000 80,000 70,279 90,300 80,000
Gender
Chartered Members
Non-Chartered Members
Male
Female
TotalAge Band
Graduate 2015Highest Qualification
20
Section A Classified by age, sex, 2015 graduation and highest qualification
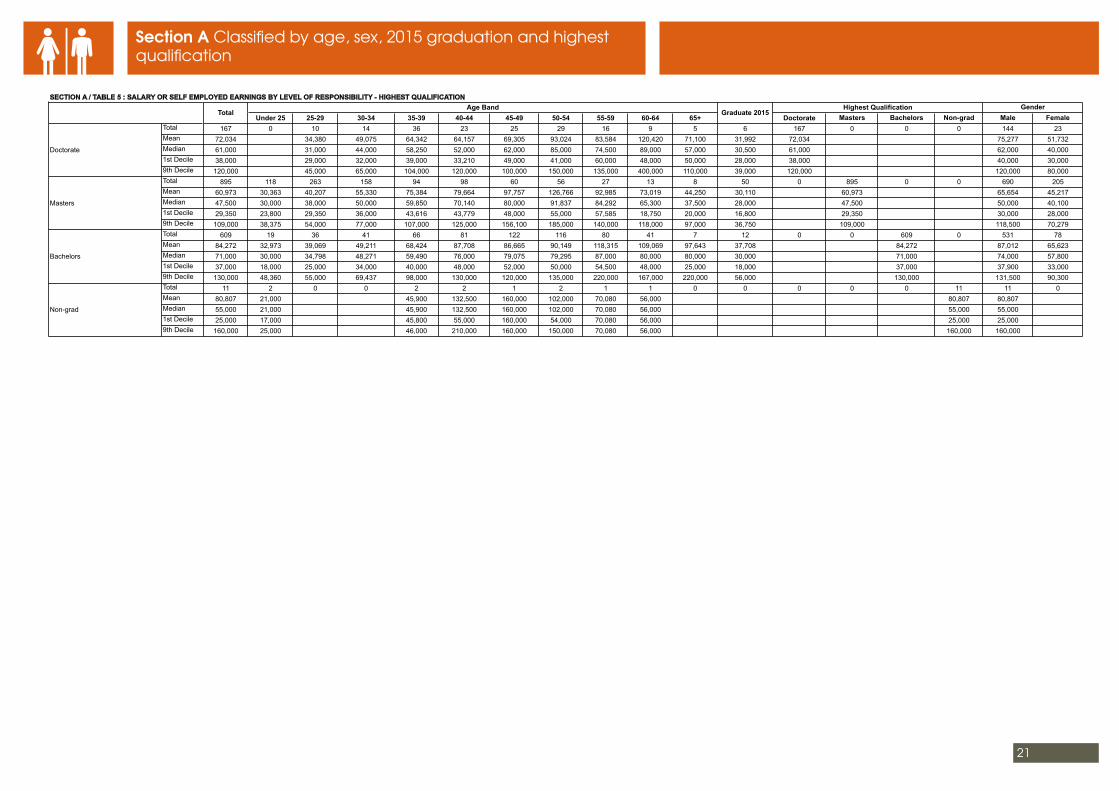
SECTION A / TABLE 5 : SALARY OR SELF EMPLOYED EARNINGS BY LEVEL OF RESPONSIBILITY - HIGHEST QUALIFICATION
Under 25 25-29 30-34 35-39 40-44 45-49 50-54 55-59 60-64 65+ Doctorate Masters Bachelors Non-grad Male FemaleTotal 167 0 10 14 36 23 25 29 16 9 5 6 167 0 0 0 144 23Mean 72,034 34,380 49,075 64,342 64,157 69,305 93,024 83,584 120,420 71,100 31,992 72,034 75,277 51,732Median 61,000 31,000 44,000 58,250 52,000 62,000 85,000 74,500 89,000 57,000 30,500 61,000 62,000 40,0001st Decile 38,000 29,000 32,000 39,000 33,210 49,000 41,000 60,000 48,000 50,000 28,000 38,000 40,000 30,0009th Decile 120,000 45,000 65,000 104,000 120,000 100,000 150,000 135,000 400,000 110,000 39,000 120,000 120,000 80,000Total 895 118 263 158 94 98 60 56 27 13 8 50 0 895 0 0 690 205Mean 60,973 30,363 40,207 55,330 75,384 79,664 97,757 126,766 92,985 73,019 44,250 30,110 60,973 65,654 45,217Median 47,500 30,000 38,000 50,000 59,850 70,140 80,000 91,837 84,292 65,300 37,500 28,000 47,500 50,000 40,1001st Decile 29,350 23,800 29,350 36,000 43,616 43,779 48,000 55,000 57,585 18,750 20,000 16,800 29,350 30,000 28,0009th Decile 109,000 38,375 54,000 77,000 107,000 125,000 156,100 185,000 140,000 118,000 97,000 36,750 109,000 118,500 70,279Total 609 19 36 41 66 81 122 116 80 41 7 12 0 0 609 0 531 78Mean 84,272 32,973 39,069 49,211 68,424 87,708 86,665 90,149 118,315 109,069 97,643 37,708 84,272 87,012 65,623Median 71,000 30,000 34,798 48,271 59,490 76,000 79,075 79,295 87,000 80,000 80,000 30,000 71,000 74,000 57,8001st Decile 37,000 18,000 25,000 34,000 40,000 48,000 52,000 50,000 54,500 48,000 25,000 18,000 37,000 37,900 33,0009th Decile 130,000 48,360 55,000 69,437 98,000 130,000 120,000 135,000 220,000 167,000 220,000 56,000 130,000 131,500 90,300Total 11 2 0 0 2 2 1 2 1 1 0 0 0 0 0 11 11 0Mean 80,807 21,000 45,900 132,500 160,000 102,000 70,080 56,000 80,807 80,807Median 55,000 21,000 45,900 132,500 160,000 102,000 70,080 56,000 55,000 55,0001st Decile 25,000 17,000 45,800 55,000 160,000 54,000 70,080 56,000 25,000 25,0009th Decile 160,000 25,000 46,000 210,000 160,000 150,000 70,080 56,000 160,000 160,000
Gender
Doctorate
Masters
Bachelors
Non-grad
TotalAge Band
Graduate 2015Highest Qualification
21
Section A Classified by age, sex, 2015 graduation and highest qualification
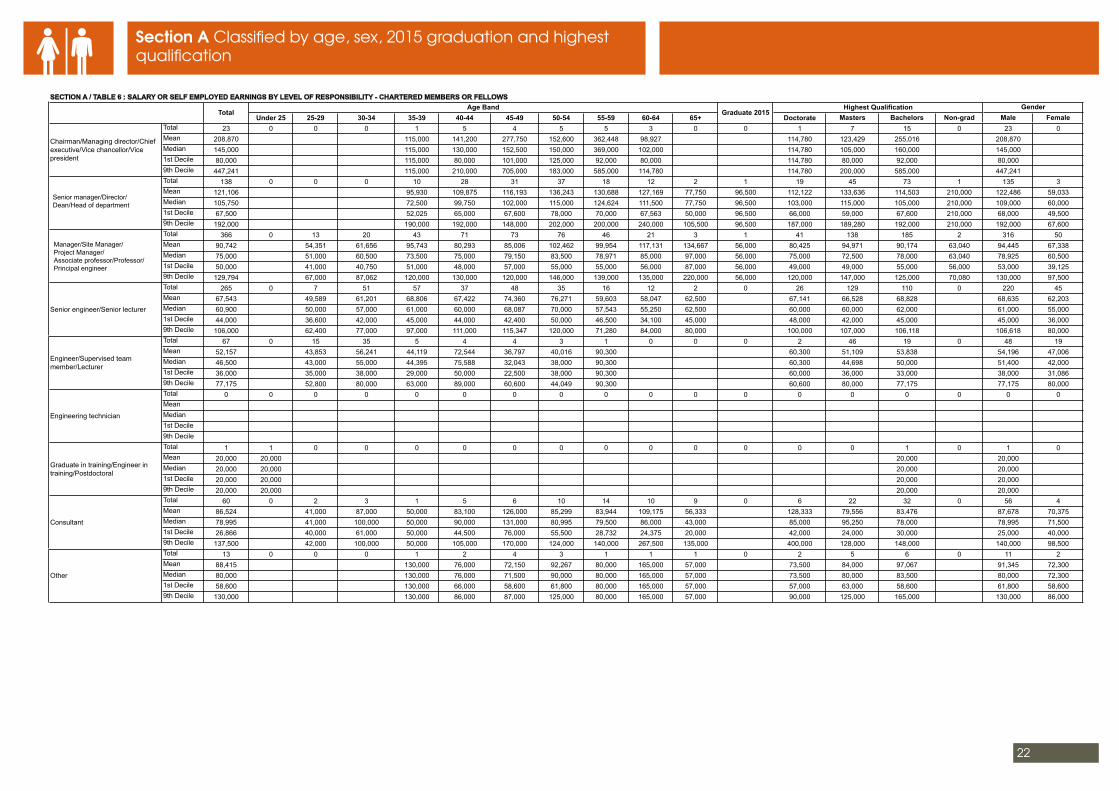
SECTION A / TABLE 6 : SALARY OR SELF EMPLOYED EARNINGS BY LEVEL OF RESPONSIBILITY - CHARTERED MEMBERS OR FELLOWS
Under 25 25-29 30-34 35-39 40-44 45-49 50-54 55-59 60-64 65+ Doctorate Masters Bachelors Non-grad Male FemaleTotal 23 0 0 0 1 5 4 5 5 3 0 0 1 7 15 0 23 0Mean 208,870 115,000 141,200 277,750 152,600 362,448 98,927 114,780 123,429 255,016 208,870Median 145,000 115,000 130,000 152,500 150,000 369,000 102,000 114,780 105,000 160,000 145,0001st Decile 80,000 115,000 80,000 101,000 125,000 92,000 80,000 114,780 80,000 92,000 80,0009th Decile 447,241 115,000 210,000 705,000 183,000 585,000 114,780 114,780 200,000 585,000 447,241Total 138 0 0 0 10 28 31 37 18 12 2 1 19 45 73 1 135 3Mean 121,106 95,930 109,875 116,193 136,243 130,688 127,169 77,750 96,500 112,122 133,636 114,503 210,000 122,486 59,033Median 105,750 72,500 99,750 102,000 115,000 124,624 111,500 77,750 96,500 103,000 115,000 105,000 210,000 109,000 60,0001st Decile 67,500 52,025 65,000 67,600 78,000 70,000 67,563 50,000 96,500 66,000 59,000 67,600 210,000 68,000 49,5009th Decile 192,000 190,000 192,000 148,000 202,000 200,000 240,000 105,500 96,500 187,000 189,280 192,000 210,000 192,000 67,600Total 366 0 13 20 43 71 73 76 46 21 3 1 41 138 185 2 316 50Mean 90,742 54,351 61,656 95,743 80,293 85,006 102,462 99,954 117,131 134,667 56,000 80,425 94,971 90,174 63,040 94,445 67,338Median 75,000 51,000 60,500 73,500 75,000 79,150 83,500 78,971 85,000 97,000 56,000 75,000 72,500 78,000 63,040 78,925 60,5001st Decile 50,000 41,000 40,750 51,000 48,000 57,000 55,000 55,000 56,000 87,000 56,000 49,000 49,000 55,000 56,000 53,000 39,1259th Decile 129,794 67,000 87,062 120,000 130,000 120,000 146,000 139,000 135,000 220,000 56,000 120,000 147,000 125,000 70,080 130,000 97,500Total 265 0 7 51 57 37 48 35 16 12 2 0 26 129 110 0 220 45Mean 67,543 49,589 61,201 68,806 67,422 74,360 76,271 59,603 58,047 62,500 67,141 66,528 68,828 68,635 62,203Median 60,900 50,000 57,000 61,000 60,000 68,087 70,000 57,543 55,250 62,500 60,000 60,000 62,000 61,000 55,0001st Decile 44,000 36,600 42,000 45,000 44,000 42,400 50,000 46,500 34,100 45,000 48,000 42,000 45,000 45,000 36,0009th Decile 106,000 62,400 77,000 97,000 111,000 115,347 120,000 71,280 84,000 80,000 100,000 107,000 106,118 106,618 80,000Total 67 0 15 35 5 4 4 3 1 0 0 0 2 46 19 0 48 19Mean 52,157 43,853 56,241 44,119 72,544 36,797 40,016 90,300 60,300 51,109 53,838 54,196 47,006Median 46,500 43,000 55,000 44,395 75,588 32,043 38,000 90,300 60,300 44,698 50,000 51,400 42,0001st Decile 36,000 35,000 38,000 29,000 50,000 22,500 38,000 90,300 60,000 36,000 33,000 38,000 31,0869th Decile 77,175 52,800 80,000 63,000 89,000 60,600 44,049 90,300 60,600 80,000 77,175 77,175 80,000Total 0 0 0 0 0 0 0 0 0 0 0 0 0 0 0 0 0 0MeanMedian1st Decile9th DecileTotal 1 1 0 0 0 0 0 0 0 0 0 0 0 0 1 0 1 0Mean 20,000 20,000 20,000 20,000Median 20,000 20,000 20,000 20,0001st Decile 20,000 20,000 20,000 20,0009th Decile 20,000 20,000 20,000 20,000Total 60 0 2 3 1 5 6 10 14 10 9 0 6 22 32 0 56 4Mean 86,524 41,000 87,000 50,000 83,100 126,000 85,299 83,944 109,175 56,333 128,333 79,556 83,476 87,678 70,375Median 78,995 41,000 100,000 50,000 90,000 131,000 80,995 79,500 86,000 43,000 85,000 95,250 78,000 78,995 71,5001st Decile 26,866 40,000 61,000 50,000 44,500 76,000 55,500 28,732 24,375 20,000 42,000 24,000 30,000 25,000 40,0009th Decile 137,500 42,000 100,000 50,000 105,000 170,000 124,000 140,000 267,500 135,000 400,000 128,000 148,000 140,000 98,500Total 13 0 0 0 1 2 4 3 1 1 1 0 2 5 6 0 11 2Mean 88,415 130,000 76,000 72,150 92,267 80,000 165,000 57,000 73,500 84,000 97,067 91,345 72,300Median 80,000 130,000 76,000 71,500 90,000 80,000 165,000 57,000 73,500 80,000 83,500 80,000 72,3001st Decile 58,600 130,000 66,000 58,600 61,800 80,000 165,000 57,000 57,000 63,000 58,600 61,800 58,6009th Decile 130,000 130,000 86,000 87,000 125,000 80,000 165,000 57,000 90,000 125,000 165,000 130,000 86,000
Highest Qualification Gender
Graduate in training/Engineer in training/Postdoctoral
Consultant
Other
TotalAge Band
Graduate 2015
Chairman/Managing director/Chief executive/Vice chancellor/Vice president
Senior manager/Director/Dean/Head of department
Manager/Site Manager/Project Manager/Associate professor/Professor/Principal engineer
Senior engineer/Senior lecturer
Engineer/Supervised team member/Lecturer
Engineering technician
22
Senior manager/Director/Dean/Head of department
Manager/Site Manager/Project Manager/Associate professor/Professor/Principal engineer
Section A Classified by age, sex, 2015 graduation and highest qualification
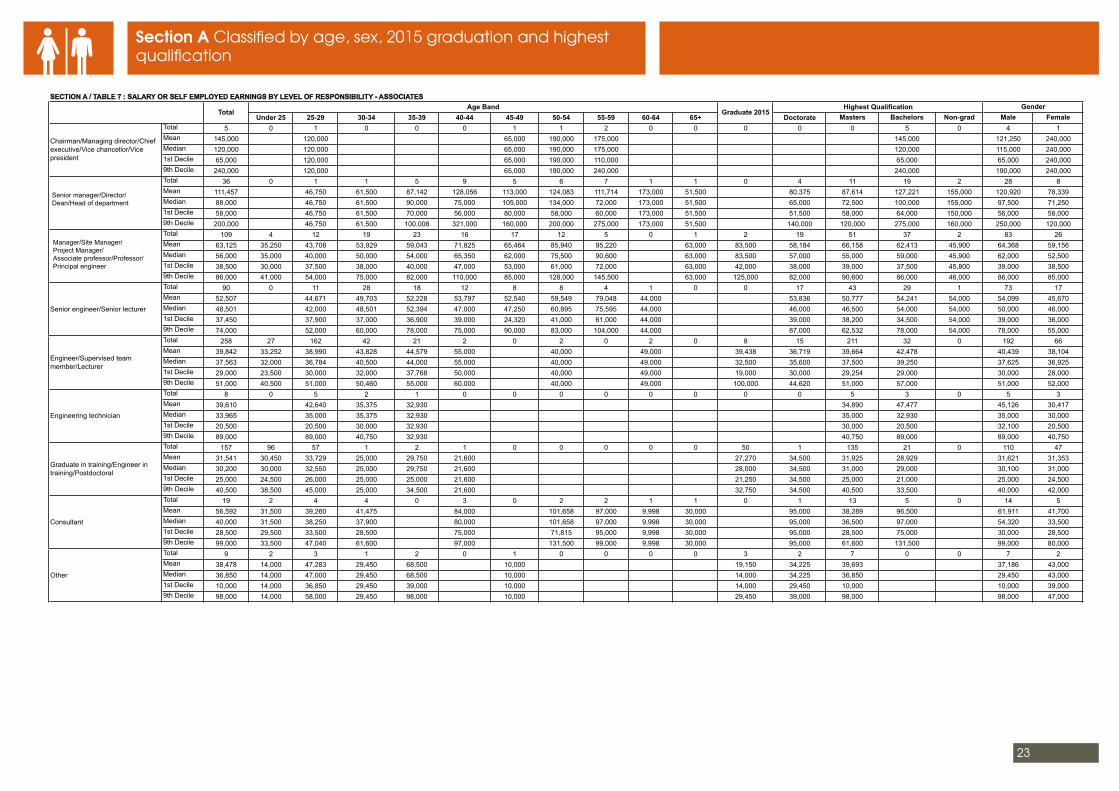
SECTION A / TABLE 7 : SALARY OR SELF EMPLOYED EARNINGS BY LEVEL OF RESPONSIBILITY - ASSOCIATES
Under 25 25-29 30-34 35-39 40-44 45-49 50-54 55-59 60-64 65+ Doctorate Masters Bachelors Non-grad Male FemaleTotal 5 0 1 0 0 0 1 1 2 0 0 0 0 0 5 0 4 1Mean 145,000 120,000 65,000 190,000 175,000 145,000 121,250 240,000Median 120,000 120,000 65,000 190,000 175,000 120,000 115,000 240,0001st Decile 65,000 120,000 65,000 190,000 110,000 65,000 65,000 240,0009th Decile 240,000 120,000 65,000 190,000 240,000 240,000 190,000 240,000Total 36 0 1 1 5 9 5 6 7 1 1 0 4 11 19 2 28 8Mean 111,457 46,750 61,500 87,142 128,056 113,000 124,083 111,714 173,000 51,500 80,375 87,614 127,221 155,000 120,920 78,339Median 88,000 46,750 61,500 90,000 75,000 105,000 134,000 72,000 173,000 51,500 65,000 72,500 100,000 155,000 97,500 71,2501st Decile 58,000 46,750 61,500 70,000 56,000 80,000 58,000 60,000 173,000 51,500 51,500 58,000 64,000 150,000 56,000 58,0009th Decile 200,000 46,750 61,500 100,008 321,000 160,000 200,000 275,000 173,000 51,500 140,000 120,000 275,000 160,000 250,000 120,000Total 109 4 12 19 23 16 17 12 5 0 1 2 19 51 37 2 83 26Mean 63,125 35,250 43,708 53,929 59,043 71,825 65,464 85,940 95,220 63,000 83,500 58,184 66,158 62,413 45,900 64,368 59,156Median 56,000 35,000 40,000 50,000 54,000 65,350 62,000 75,500 90,600 63,000 83,500 57,000 55,000 59,000 45,900 62,000 52,5001st Decile 38,500 30,000 37,500 38,000 40,000 47,000 53,000 61,000 72,000 63,000 42,000 38,000 39,000 37,500 45,800 39,000 38,5009th Decile 86,000 41,000 54,000 75,000 82,000 110,000 85,000 128,000 145,500 63,000 125,000 82,000 90,600 86,000 46,000 86,000 85,000Total 90 0 11 28 18 12 8 8 4 1 0 0 17 43 29 1 73 17Mean 52,507 44,671 49,703 52,228 53,797 52,540 59,549 79,048 44,000 53,836 50,777 54,241 54,000 54,099 45,670Median 48,501 42,000 48,501 52,394 47,000 47,250 60,895 75,595 44,000 46,000 46,500 54,000 54,000 50,000 46,0001st Decile 37,450 37,900 37,000 36,900 39,000 24,320 41,000 61,000 44,000 39,000 38,200 34,500 54,000 39,000 36,0009th Decile 74,000 52,000 60,000 78,000 75,000 90,000 83,000 104,000 44,000 87,000 62,532 78,000 54,000 78,000 55,000Total 258 27 162 42 21 2 0 2 0 2 0 8 15 211 32 0 192 66Mean 39,842 33,252 38,990 43,828 44,579 55,000 40,000 49,000 39,438 36,719 39,664 42,478 40,439 38,104Median 37,563 32,000 36,784 40,500 44,000 55,000 40,000 49,000 32,500 35,600 37,500 39,250 37,625 36,9251st Decile 29,000 23,500 30,000 32,000 37,768 50,000 40,000 49,000 19,000 30,000 29,254 29,000 30,000 28,0009th Decile 51,000 40,500 51,000 50,460 55,000 60,000 40,000 49,000 100,000 44,620 51,000 57,000 51,000 52,000Total 8 0 5 2 1 0 0 0 0 0 0 0 0 5 3 0 5 3Mean 39,610 42,640 35,375 32,930 34,890 47,477 45,126 30,417Median 33,965 35,000 35,375 32,930 35,000 32,930 35,000 30,0001st Decile 20,500 20,500 30,000 32,930 30,000 20,500 32,100 20,5009th Decile 89,000 89,000 40,750 32,930 40,750 89,000 89,000 40,750Total 157 96 57 1 2 1 0 0 0 0 0 50 1 135 21 0 110 47Mean 31,541 30,450 33,729 25,000 29,750 21,600 27,270 34,500 31,925 28,929 31,621 31,353Median 30,200 30,000 32,550 25,000 29,750 21,600 28,000 34,500 31,000 29,000 30,100 31,0001st Decile 25,000 24,500 26,000 25,000 25,000 21,600 21,250 34,500 25,000 21,000 25,000 24,5009th Decile 40,500 38,500 45,000 25,000 34,500 21,600 32,750 34,500 40,500 33,500 40,000 42,000Total 19 2 4 4 0 3 0 2 2 1 1 0 1 13 5 0 14 5Mean 56,592 31,500 39,260 41,475 84,000 101,658 97,000 9,998 30,000 95,000 38,289 96,500 61,911 41,700Median 40,000 31,500 38,250 37,900 80,000 101,658 97,000 9,998 30,000 95,000 36,500 97,000 54,320 33,5001st Decile 28,500 29,500 33,500 28,500 75,000 71,815 95,000 9,998 30,000 95,000 28,500 75,000 30,000 28,5009th Decile 99,000 33,500 47,040 61,600 97,000 131,500 99,000 9,998 30,000 95,000 61,600 131,500 99,000 80,000Total 9 2 3 1 2 0 1 0 0 0 0 3 2 7 0 0 7 2Mean 38,478 14,000 47,283 29,450 68,500 10,000 19,150 34,225 39,693 37,186 43,000Median 36,850 14,000 47,000 29,450 68,500 10,000 14,000 34,225 36,850 29,450 43,0001st Decile 10,000 14,000 36,850 29,450 39,000 10,000 14,000 29,450 10,000 10,000 39,0009th Decile 98,000 14,000 58,000 29,450 98,000 10,000 29,450 39,000 98,000 98,000 47,000
Highest Qualification Gender
Graduate in training/Engineer in training/Postdoctoral
Consultant
Other
TotalAge Band
Graduate 2015
Chairman/Managing director/Chief executive/Vice chancellor/Vice president
Senior manager/Director/Dean/Head of department
Manager/Site Manager/Project Manager/Associate professor/Professor/Principal engineer
Senior engineer/Senior lecturer
Engineer/Supervised team member/Lecturer
Engineering technician
23
Senior manager/Director/Dean/Head of department
Manager/Site Manager/Project Manager/Associate professor/Professor/Principal engineer

Section A Classified by age, sex, 2015 graduation and highest qualification
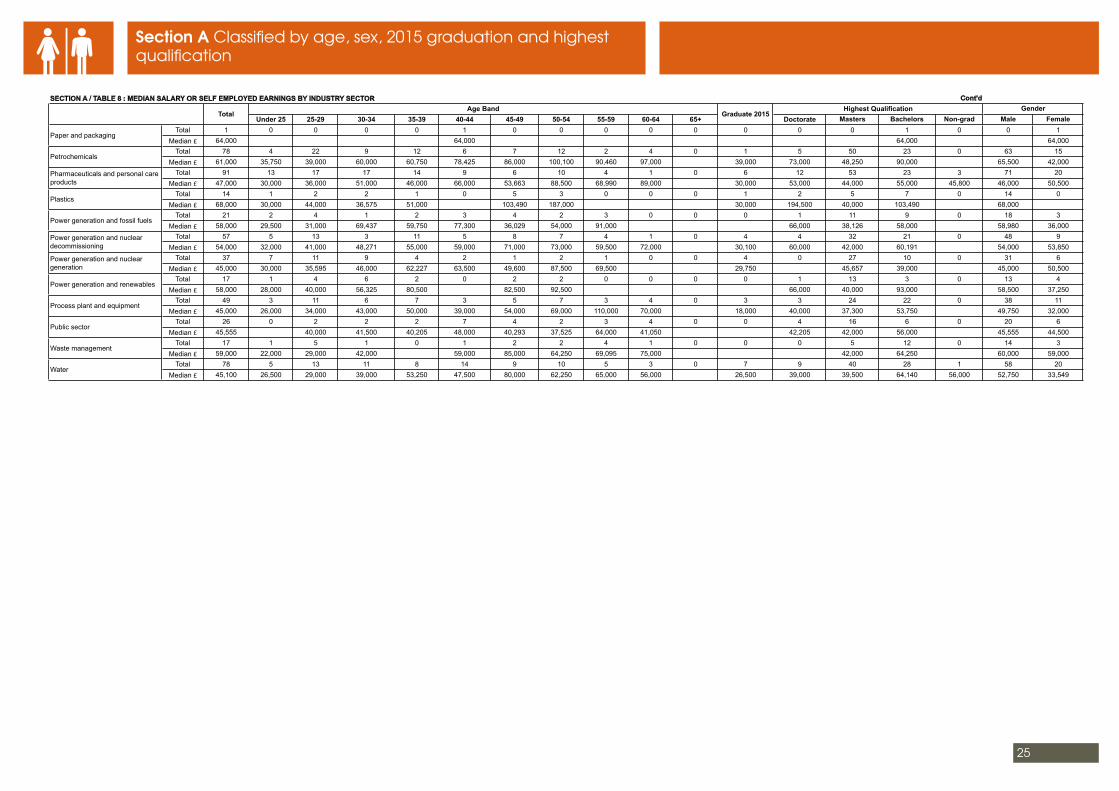
SECTION A / TABLE 8 : MEDIAN SALARY OR SELF EMPLOYED EARNINGS BY INDUSTRY SECTOR
Under 25 25-29 30-34 35-39 40-44 45-49 50-54 55-59 60-64 65+ Doctorate Masters Bachelors Non-grad Male FemaleTotal 32 1 3 7 2 5 5 4 1 4 0 0 12 10 10 0 27 5
Median £ 56,000 33,500 37,000 45,000 61,394 58,000 57,000 84,000 75,000 74,000 59,500 37,250 57,500 58,000 37,000Total 184 14 30 9 22 34 33 27 11 3 1 7 16 88 78 2 159 25
Median £ 55,000 28,600 37,500 49,000 49,500 64,500 70,000 75,000 71,280 114,780 51,500 27,592 54,525 44,244 70,640 102,500 57,000 46,000Total 153 16 25 32 21 15 16 12 8 5 3 6 6 95 51 1 121 32
Median £ 51,000 28,734 37,000 53,700 59,000 84,000 74,750 96,258 65,000 58,000 25,000 24,250 65,500 44,000 65,000 54,000 54,000 39,125Total 22 4 4 4 0 4 3 3 0 0 0 1 3 10 8 1 16 6
Median £ 42,500 28,500 30,500 42,000 53,200 120,000 76,000 29,000 31,000 40,750 58,200 17,000 46,250 30,500Total 107 9 13 10 13 14 13 15 12 5 3 3 2 59 46 0 90 17
Median £ 70,000 32,500 42,000 56,892 78,500 76,425 79,700 78,000 102,000 70,764 45,000 32,500 81,000 61,000 78,575 71,500 51,000Total 31 0 0 4 7 1 4 8 4 1 2 1 29 0 2 0 27 4
Median £ 55,000 43,750 43,000 66,000 60,000 74,250 60,500 99,000 72,000 34,500 57,000 38,465 55,000 54,810Total 14 0 0 0 0 4 3 3 2 1 1 0 2 4 8 0 14 0
Median £ 130,000 181,100 115,347 140,000 86,800 155,000 135,000 121,600 85,300 137,500 130,000Total 66 6 15 4 10 3 8 8 10 0 2 5 9 36 21 0 49 17
Median £ 55,000 27,000 33,550 42,500 57,000 67,500 90,500 75,000 71,000 46,500 27,000 67,340 38,050 64,000 60,000 39,100Total 18 1 2 1 0 0 4 3 6 1 0 0 2 6 10 0 14 4
Median £ 63,500 29,500 27,250 50,000 79,087 65,000 103,500 44,000 120,000 52,500 63,500 66,587 31,500Total 46 4 12 3 8 6 4 4 2 2 1 3 5 29 12 0 36 10
Median £ 57,500 25,000 38,344 47,000 78,000 68,000 72,825 69,500 108,600 101,000 110,000 25,000 80,000 45,173 69,500 64,500 48,024Total 10 2 3 0 2 0 2 0 0 1 0 1 1 6 3 0 10 0
Median £ 40,000 22,500 29,000 51,490 66,000 55,000 20,000 44,000 28,500 55,000 40,000Total 14 1 0 1 3 2 2 3 2 0 0 1 4 4 6 0 13 1
Median £ 78,363 28,000 50,500 104,000 70,500 93,363 64,000 65,000 28,000 102,000 49,526 67,000 86,726 28,000Total 313 24 67 53 31 42 34 31 15 11 5 7 16 189 106 2 257 56
Median £ 75,000 35,000 46,650 62,000 95,000 112,500 120,000 121,000 145,500 120,000 75,000 37,500 90,000 58,000 94,000 185,000 85,000 55,000Total 99 8 19 9 8 9 16 9 16 4 1 1 5 51 43 0 82 17
Median £ 75,000 39,715 46,500 55,000 86,000 97,000 79,750 109,000 93,500 95,500 80,000 32,000 82,000 55,000 89,000 80,000 40,791Total 87 7 12 9 8 14 8 14 6 8 1 6 14 32 40 1 73 14
Median £ 55,000 27,000 32,473 47,000 62,000 55,000 66,500 60,590 77,186 82,500 50,000 28,377 48,500 46,250 59,376 70,080 60,000 40,500
Gender
Education/ university
TotalAge Band
Graduate 2015Highest Qualification
Biochemical engineering
Chemical and allied products
Consultancy
Consumer products
Contracting
Finance, insurance and risk
Food and drink
Health, safety and environment
Industrial gases
Iron, steel and other metals
Mining and minerals
Oil and gas exploration and production
Oil refining
Other
24
Section A Classified by age, sex, 2015 graduation and highest qualification
SECTION A / TABLE 8 : MEDIAN SALARY OR SELF EMPLOYED EARNINGS BY INDUSTRY SECTOR Cont'd
Under 25 25-29 30-34 35-39 40-44 45-49 50-54 55-59 60-64 65+ Doctorate Masters Bachelors Non-grad Male FemaleTotal 1 0 0 0 0 1 0 0 0 0 0 0 0 0 1 0 0 1
Median £ 64,000 64,000 64,000 64,000Total 78 4 22 9 12 6 7 12 2 4 0 1 5 50 23 0 63 15
Median £ 61,000 35,750 39,000 60,000 60,750 78,425 86,000 100,100 90,460 97,000 39,000 73,000 48,250 90,000 65,500 42,000Total 91 13 17 17 14 9 6 10 4 1 0 6 12 53 23 3 71 20
Median £ 47,000 30,000 36,000 51,000 46,000 66,000 53,663 88,500 68,990 89,000 30,000 53,000 44,000 55,000 45,800 46,000 50,500Total 14 1 2 2 1 0 5 3 0 0 0 1 2 5 7 0 14 0
Median £ 68,000 30,000 44,000 36,575 51,000 103,490 187,000 30,000 194,500 40,000 103,490 68,000Total 21 2 4 1 2 3 4 2 3 0 0 0 1 11 9 0 18 3
Median £ 58,000 29,500 31,000 69,437 59,750 77,300 36,029 54,000 91,000 66,000 38,126 58,000 58,980 36,000Total 57 5 13 3 11 5 8 7 4 1 0 4 4 32 21 0 48 9
Median £ 54,000 32,000 41,000 48,271 55,000 59,000 71,000 73,000 59,500 72,000 30,100 60,000 42,000 60,191 54,000 53,850Total 37 7 11 9 4 2 1 2 1 0 0 4 0 27 10 0 31 6
Median £ 45,000 30,000 35,595 46,000 62,227 63,500 49,600 87,500 69,500 29,750 45,657 39,000 45,000 50,500Total 17 1 4 6 2 0 2 2 0 0 0 0 1 13 3 0 13 4
Median £ 58,000 28,000 40,000 56,325 80,500 82,500 92,500 66,000 40,000 93,000 58,500 37,250Total 49 3 11 6 7 3 5 7 3 4 0 3 3 24 22 0 38 11
Median £ 45,000 26,000 34,000 43,000 50,000 39,000 54,000 69,000 110,000 70,000 18,000 40,000 37,300 53,750 49,750 32,000Total 26 0 2 2 2 7 4 2 3 4 0 0 4 16 6 0 20 6
Median £ 45,555 40,000 41,500 40,205 48,000 40,293 37,525 64,000 41,050 42,205 42,000 56,000 45,555 44,500Total 17 1 5 1 0 1 2 2 4 1 0 0 0 5 12 0 14 3
Median £ 59,000 22,000 29,000 42,000 59,000 85,000 64,250 69,095 75,000 42,000 64,250 60,000 59,000Total 78 5 13 11 8 14 9 10 5 3 0 7 9 40 28 1 58 20
Median £ 45,100 26,500 29,000 39,000 53,250 47,500 80,000 62,250 65,000 56,000 26,500 39,000 39,500 64,140 56,000 52,750 33,549
TotalAge Band
Graduate 2015Highest Qualification Gender
Pharmaceuticals and personal care products
Paper and packaging
Petrochemicals
Public sector
Waste management
Water
Plastics
Power generation and fossil fuels
Power generation and nuclear decommissioning
Power generation and nuclear generation
Power generation and renewables
Process plant and equipment
25

Section A Classified by age, sex, 2015 graduation and highest qualification
SECTION A / TABLE 9: MEDIAN SALARY OR SELF EMPLOYED EARNINGS BY TYPE OF WORK
Under 25 25-29 30-34 35-39 40-44 45-49 50-54 55-59 60-64 65+ Doctorate Masters Bachelors Non-grad Male FemaleTotal 524 49 126 86 63 59 57 50 15 14 5 16 22 325 177 0 427 97
Median £ 52,000 30,000 37,713 53,700 60,000 70,000 78,000 78,300 71,280 78,500 45,000 26,000 68,500 44,000 65,650 55,000 42,200Total 133 10 16 15 28 18 13 15 11 7 0 7 54 44 34 1 111 22
Median £ 55,000 29,377 32,000 39,000 57,500 64,500 62,000 77,880 70,000 60,000 28,700 61,000 38,050 60,000 17,000 58,000 39,946Total 190 22 46 21 16 27 19 20 16 3 0 12 14 99 75 2 150 40
Median £ 50,000 29,500 37,877 50,500 48,500 62,737 58,500 85,000 78,040 105,000 28,100 56,250 42,500 57,500 47,540 50,000 50,465Total 172 8 21 22 22 16 19 34 21 8 1 4 9 87 74 2 142 30
Median £ 66,750 30,000 37,900 45,000 75,750 73,140 79,150 96,000 96,000 99,500 63,000 30,000 82,000 52,000 82,850 97,900 71,000 49,500
Total 34 3 3 3 5 9 5 4 2 0 0 3 1 16 17 0 31 3Median £ 68,000 31,000 35,000 61,600 56,000 68,000 80,000 74,964 105,000 30,000 70,000 56,250 72,000 68,000 56,000
Total 185 19 43 29 20 25 19 14 14 1 1 12 7 113 64 1 156 29Median £ 59,000 33,000 40,500 57,000 58,300 106,000 115,000 68,750 112,000 57,000 220,000 27,796 45,000 54,000 73,500 160,000 60,513 48,000
Total 9 0 3 0 0 0 2 3 1 0 0 1 2 3 4 0 8 1Median £ 50,000 39,000 44,500 75,000 92,000 39,000 44,000 40,000 75,000 62,500 39,000
Total 56 2 5 2 12 4 7 9 6 7 2 1 2 20 34 0 47 9Median £ 79,425 25,750 34,000 40,018 55,000 86,425 90,000 117,464 99,600 102,000 65,250 25,000 37,000 62,000 89,500 90,000 45,000
Total 11 0 0 1 2 2 1 2 0 1 2 0 2 2 7 0 11 0
Median £ 130,000 50,000 93,500 181,100 97,500 120,000 130,000 122,500 133,100 75,000 130,000 130,000
Total 42 0 6 5 6 8 7 7 1 2 0 1 5 25 10 2 37 5Median £ 65,250 33,230 54,075 61,525 69,000 76,500 127,000 135,000 151,732 29,450 40,000 60,000 75,000 51,000 75,000 33,500
Total 24 0 2 0 2 1 6 6 3 2 2 0 18 1 5 0 22 2Median £ 60,000 23,000 40,384 97,000 77,488 52,000 60,000 93,500 72,000 60,000 26,000 89,976 60,000 53,799
Total 189 17 24 20 10 22 35 22 21 14 4 6 17 104 65 3 153 36Median £ 63,000 30,200 38,500 47,750 60,500 68,000 75,000 83,500 84,292 72,675 37,000 29,250 72,000 55,000 72,000 55,000 65,000 45,000
Total 31 1 3 2 6 2 6 6 3 2 0 0 1 20 10 0 17 14Median £ 48,000 34,000 32,350 63,000 56,727 45,000 47,392 62,900 57,585 34,100 31,000 43,000 58,400 57,585 43,000
Total 82 8 11 7 6 11 12 11 10 3 3 5 13 36 33 0 64 18Median £ 72,750 27,250 35,700 61,500 77,500 86,000 107,000 128,000 79,000 84,000 50,000 36,000 61,000 49,959 100,000 79,000 54,376
Gender
Design
Business systems/IT and software
TotalAge Band
Graduate 2015Highest Qualification
Research and development
Manufacture and production
Project management/general administration/management services
Construction and installation
Operations
Other
Marketing and sales
Finance/Financial services/Procurement and supply
Asset management
Education and training
Process safety/Safety, health and environment
Regulations/Regulatory compliance
26

Section BClassified by membership grade, class of employment and level of responsibility
27

Section B Classified by membership grade, class of employment and level of responsibility
SECTION B / TABLE 1 : EMPLOYMENT STATUS
Chartered Assoc Other MD/CEO Sen Mgr Proj Mgr Sen Eng Engineer Technician Graduate Consultant Other Male Female Full time Part timeTotal 1,682 933 691 58 29 177 486 364 342 8 165 84 27 1,376 306 1,606 75
% 100% 100% 100% 100% 100% 100% 100% 100% 100% 100% 100% 100% 100% 100% 100% 100% 100%Total 1,606 868 681 57 29 175 459 341 337 8 165 66 26 1,337 269 1,606 0
% 96% 93% 99% 98% 100% 99% 94% 94% 99% 100% 100% 79% 96% 97% 88% 100% 0%Total 75 64 10 1 0 2 27 22 5 0 0 18 1 39 36 0 75
% 5% 7% 1% 2% 0% 1% 6% 6% 2% 0% 0% 21% 4% 3% 12% 0% 100%
Employment status
Full time
Part time
Member Grade Level of Responsibility GenderTotal
Total
28

Section B Classified by membership grade, class of employment and level of responsibility
SECTION B / TABLE 2 : CURRENT ANNUAL SALARY OR SELF EMPLOYED EARNINGS
Chartered Assoc Other MD/CEO Sen Mgr Proj Mgr Sen Eng Engineer Technician Graduate Consultant Other Male Female Full time Part timeTotal 1682 933 691 58 29 177 486 364 342 8 165 84 27 1376 306 1606 75<£16K 10 3 7 0 0 1 0 2 0 0 3 1 3 9 1 10 0>=£16K 2 0 0 2 0 0 0 0 0 0 0 0 2 2 0 2 0>=£18K 3 2 1 0 0 0 0 0 0 0 1 2 0 3 0 2 1>=£19K 1 0 1 0 0 0 0 0 1 0 0 0 0 1 0 1 0>=£20K 6 2 4 0 0 0 0 0 1 1 3 1 0 4 2 5 1>=£21K 3 0 3 0 0 0 1 0 0 0 2 0 0 0 3 2 1>=£22K 5 1 4 0 0 0 0 0 2 0 3 0 0 3 2 4 1>=£23K 3 1 2 0 0 0 0 1 1 0 1 0 0 2 1 2 1>=£24K 5 1 4 0 0 0 0 1 0 0 3 1 0 3 2 4 1>=£25K 18 2 14 2 0 0 0 0 4 0 11 2 1 11 7 16 2>=£26K 11 0 11 0 0 0 0 0 1 0 10 0 0 7 4 11 0>=£27K 5 0 5 0 0 0 0 0 1 0 4 0 0 3 2 5 0>=£28K 30 2 25 3 0 0 0 0 13 0 15 2 0 17 13 29 1>=£29K 27 1 23 3 0 0 0 0 11 0 13 1 2 22 5 27 0>=£30K 33 1 29 3 0 0 1 1 10 1 18 2 0 27 6 31 2>=£31K 18 5 13 0 0 0 2 2 7 0 7 0 0 9 9 13 5>=£32K 35 1 32 2 0 0 1 1 19 2 12 0 0 23 12 34 1>=£33K 25 3 22 0 0 0 3 0 14 0 6 2 0 16 9 23 2>=£34K 24 3 21 0 0 0 1 3 14 0 6 0 0 18 6 21 3>=£35K 28 1 23 4 0 0 0 2 17 1 8 0 0 23 5 28 0>=£36K 39 5 33 1 0 0 2 6 19 1 9 1 1 29 10 37 2>=£37K 30 4 25 1 0 0 2 5 17 0 5 1 0 24 6 30 0>=£38K 28 8 20 0 0 0 6 2 15 0 4 1 0 20 8 27 1>=£39K 19 3 14 2 0 0 1 4 12 0 1 0 1 13 6 18 1>=£40K 138 44 86 8 0 0 24 30 65 1 13 5 0 106 32 130 8>=£45K 119 52 65 2 0 3 26 52 29 0 5 2 2 84 35 112 7>=£50K 107 59 44 4 0 2 35 45 20 0 1 4 0 86 21 99 8>=£55K 118 79 34 5 0 7 41 44 19 0 1 3 3 96 22 113 5>=£60K 95 71 22 2 1 4 41 31 11 0 0 5 2 83 12 89 5>=£65K 78 61 16 1 1 12 39 22 2 0 0 1 1 61 17 76 2>=£70K 79 65 12 2 0 9 38 24 5 0 0 3 0 68 11 78 1>=£75K 67 54 13 0 0 8 35 15 2 0 0 7 0 61 6 64 3>=£80K 60 45 12 3 3 6 25 15 4 0 0 5 2 53 7 59 1>=£85K 45 36 8 1 0 8 27 5 2 1 0 0 2 41 4 42 3>=£90K 51 47 3 1 1 13 19 12 1 0 0 4 1 47 4 51 0>=£95K 35 26 6 3 0 10 14 5 0 0 0 5 1 32 3 33 2>=£100K 30 24 5 1 2 6 12 5 1 0 0 4 0 27 3 29 1>=£105K 29 27 2 0 1 9 9 9 0 0 0 1 0 29 0 29 0>=£110K 23 20 3 0 2 6 9 4 0 0 0 2 0 21 2 22 1>=£115K 18 18 0 0 1 7 6 3 0 0 0 1 0 18 0 18 0
TotalMember Grade Level of Responsibility Gender Employment status
29

Section B Classified by membership grade, class of employment and level of responsibility
SECTION B / TABLE 2 : CURRENT ANNUAL SALARY OR SELF EMPLOYED EARNINGS Cont'd
Chartered Assoc Other MD/CEO Sen Mgr Proj Mgr Sen Eng Engineer Technician Graduate Consultant Other Male Female Full time Part time>=£120K 37 31 4 2 1 11 16 4 1 0 0 4 0 34 3 37 0>=£125K 20 18 2 0 1 4 11 2 0 0 0 1 1 19 1 20 0>=£130K 15 13 2 0 1 5 4 2 0 0 0 2 1 15 0 15 0>=£135K 12 10 2 0 0 3 6 0 1 0 0 2 0 11 1 11 1>=£140K 13 11 2 0 0 7 4 1 0 0 0 1 0 13 0 13 0>=£145K 7 6 1 0 1 2 3 0 0 0 0 1 0 7 0 7 0>=£150K 41 35 6 0 4 18 12 3 0 0 0 3 1 40 1 41 0>=£200K 17 15 2 0 4 9 4 0 0 0 0 0 0 16 1 17 0>=£250K 20 17 3 0 5 7 6 1 0 0 0 1 0 19 1 19 1Total 1,682 933 691 58 29 177 486 364 342 8 165 84 27 1,376 306 1,606 75Mean 70,637 88,406 48,210 51,993 192,725 118,679 83,926 63,582 42,212 39,610 31,441 79,905 60,396 75,024 50,908 71,352 55,419Median 57,000 73,000 40,000 43,779 130,000 103,000 72,000 56,750 39,000 33,965 30,000 75,500 58,000 60,186 45,000 58,000 48,0001st Decile 31,000 45,000 28,200 28,000 80,000 65,000 45,800 41,220 29,880 20,500 25,000 28,732 14,000 32,400 28,000 31,300 25,0009th Decile 120,000 135,000 78,000 95,000 447,241 192,000 125,000 97,000 57,000 89,000 40,000 131,500 125,000 125,000 80,000 120,000 88,000
TotalMember Grade Level of Responsibility Gender Employment status
30

Section B Classified by membership grade, class of employment and level of responsibility
SECTION B / TABLE 3 : BENEFITS IN KIND FOR SALARIED EMPLOYEES
Chartered Assoc Other MD/CEO Sen Mgr Proj Mgr Sen Eng Engineer Technician Graduate Consultant Other Male Female Full time Part time1682 933 691 58 29 177 486 364 342 8 165 84 27 1376 306 1606 75
Total 4 2 2 0 0 1 2 0 0 0 1 0 0 4 0 4 0% 0.2% 0.2% 0.3% 0.0% 0.0% 0.6% 0.4% 0.0% 0.0% 0.0% 0.6% 0.0% 0.0% 0.3% 0.0% 0.2% 0.0%
Total 2 2 0 0 0 0 0 1 0 0 0 1 0 2 0 1 1% 0.1% 0.2% 0.0% 0.0% 0.0% 0.0% 0.0% 0.3% 0.0% 0.0% 0.0% 1.2% 0.0% 0.1% 0.0% 0.1% 1.3%
Total 499 294 186 19 7 62 159 115 88 3 40 13 12 413 86 475 24
% 29.7% 31.5% 26.9% 32.8% 24.1% 35.0% 32.7% 31.6% 25.7% 37.5% 24.2% 15.5% 44.4% 30.0% 28.1% 29.6% 32.0%
Total 1013 541 443 29 17 98 300 205 228 4 111 40 10 813 200 979 34
% 60.2% 58.0% 64.1% 50.0% 58.6% 55.4% 61.7% 56.3% 66.7% 50.0% 67.3% 47.6% 37.0% 59.1% 65.4% 61.0% 45.3%
Total 54 32 21 1 4 9 6 9 14 0 3 8 1 46 8 50 4% 3.2% 3.4% 3.0% 1.7% 13.8% 5.1% 1.2% 2.5% 4.1% 0.0% 1.8% 9.5% 3.7% 3.3% 2.6% 3.1% 5.3%
Total 110 62 39 9 1 7 19 34 12 1 10 22 4 98 12 97 12% 6.5% 6.6% 5.6% 15.5% 3.4% 4.0% 3.9% 9.3% 3.5% 12.5% 6.1% 26.2% 14.8% 7.1% 3.9% 6.0% 16.0%
Total 1007 613 372 22 21 136 342 226 166 2 73 30 11 839 168 979 28% 59.9% 65.7% 53.8% 37.9% 72.4% 76.8% 70.4% 62.1% 48.5% 25.0% 44.2% 35.7% 40.7% 61.0% 54.9% 61.0% 37.3%
Total 505 381 115 9 17 128 222 81 19 0 14 16 8 445 60 487 18% 30.0% 40.8% 16.6% 15.5% 58.6% 72.3% 45.7% 22.3% 5.6% 0.0% 8.5% 19.0% 29.6% 32.3% 19.6% 30.3% 24.0%
Total 493 299 187 7 8 58 162 95 101 2 52 9 6 404 89 481 12% 29.3% 32.0% 27.1% 12.1% 27.6% 32.8% 33.3% 26.1% 29.5% 25.0% 31.5% 10.7% 22.2% 29.4% 29.1% 30.0% 16.0%
Total 619 402 209 8 22 95 215 123 97 0 43 21 3 528 91 605 14% 36.8% 43.1% 30.2% 13.8% 75.9% 53.7% 44.2% 33.8% 28.4% 0.0% 26.1% 25.0% 11.1% 38.4% 29.7% 37.7% 18.7%
Total 64 30 34 0 0 7 19 13 7 0 15 1 2 54 10 63 1% 3.8% 3.2% 4.9% 0.0% 0.0% 4.0% 3.9% 3.6% 2.0% 0.0% 9.1% 1.2% 7.4% 3.9% 3.3% 3.9% 1.3%
Total 1266 720 519 27 20 140 371 267 277 4 127 49 11 1034 232 1217 49% 75.3% 77.2% 75.1% 46.6% 69.0% 79.1% 76.3% 73.4% 81.0% 50.0% 77.0% 58.3% 40.7% 75.1% 75.8% 75.8% 65.3%
Total 209 119 78 12 7 33 67 34 34 1 16 16 1 172 37 195 14% 12.4% 12.8% 11.3% 20.7% 24.1% 18.6% 13.8% 9.3% 9.9% 12.5% 9.7% 19.0% 3.7% 12.5% 12.1% 12.1% 18.7%
Total 152 82 66 4 2 19 55 27 31 0 13 4 1 118 34 146 6% 9.0% 8.8% 9.6% 6.9% 6.9% 10.7% 11.3% 7.4% 9.1% 0.0% 7.9% 4.8% 3.7% 8.6% 11.1% 9.1% 8.0%
Total 171 84 70 17 0 11 32 45 32 3 17 24 7 140 31 149 21% 10.2% 9.0% 10.1% 29.3% 0.0% 6.2% 6.6% 12.4% 9.4% 37.5% 10.3% 28.6% 25.9% 10.2% 10.1% 9.3% 28.0%
Total 53 18 33 2 1 3 9 12 10 0 11 5 2 41 12 51 2% 3.2% 1.9% 4.8% 3.4% 3.4% 1.7% 1.9% 3.3% 2.9% 0.0% 6.7% 6.0% 7.4% 3.0% 3.9% 3.2% 2.7%
Gender
None
401k savings plan (US)
TotalMember Grade Level of Responsibility
Medical and dental insurance
Employment status
Childcare
None
Other
Total
Car or car allowance
Company share scheme
Life insurance
Loans
IChemE membership fees
Other professional membership fees
Central Providence Fund (Singapore)
Defined benefit pension/Company final salary scheme
Defined contribution pension/Company money purchase scheme
Non-contributory pension
31

Section B Classified by membership grade, class of employment and level of responsibility
SECTION B / TABLE 4 : SALARY OR SELF EMPLOYED EARNINGS BY GRADE AND SEX
Chartered Assoc Other MD/CEO Sen Mgr Proj Mgr Sen Eng Engineer Technician Graduate Consultant Other Male Female Full time Part timeTotal 933 933 0 0 23 138 366 265 67 0 1 60 13 810 123 868 64Mean 88,406 88,406 208,870 121,106 90,742 67,543 52,157 20,000 86,524 88,415 92,371 62,296 90,656 58,282Median 73,000 73,000 145,000 105,750 75,000 60,900 46,500 20,000 78,995 80,000 76,000 58,600 75,000 49,0001st Decile 45,000 45,000 80,000 67,500 50,000 44,000 36,000 20,000 26,866 58,600 47,500 36,057 47,000 25,0009th Decile 135,000 135,000 447,241 192,000 129,794 106,000 77,175 20,000 137,500 130,000 140,000 90,000 138,000 89,000Total 749 0 691 58 6 39 120 99 275 8 164 24 14 566 183 738 11Mean 48,503 48,210 51,993 130,833 110,089 63,138 52,981 39,790 39,610 31,510 63,356 34,379 50,200 43,255 48,648 38,756Median 40,000 40,000 43,779 115,000 90,000 55,500 49,500 37,500 33,965 30,100 55,800 29,225 41,000 38,500 40,000 41,2201st Decile 28,000 28,200 28,000 60,000 58,000 39,500 37,000 29,000 20,500 25,000 29,500 14,000 29,000 26,000 28,000 30,0009th Decile 79,200 78,000 95,000 240,000 200,000 88,300 78,000 51,000 89,000 40,000 120,000 58,000 83,000 64,000 80,000 51,500Total 1,376 810 516 50 28 166 407 302 256 5 115 75 22 1,376 0 1,337 39Mean 75,024 92,371 49,918 53,105 191,036 121,701 87,654 64,796 42,971 45,126 31,468 82,960 62,323 75,024 75,344 64,075Median 60,186 76,000 40,250 45,000 127,500 105,000 74,928 58,000 39,325 35,000 30,000 78,000 59,900 60,186 61,000 50,0001st Decile 32,400 47,500 29,000 28,500 80,000 67,000 48,000 42,000 30,000 32,100 25,000 28,732 14,000 32,400 32,550 25,0009th Decile 125,000 140,000 80,000 94,250 447,241 195,000 128,000 100,000 60,000 89,000 40,000 135,000 125,000 125,000 125,000 100,000Total 306 123 175 8 1 11 79 62 86 3 50 9 5 0 306 269 36Mean 50,908 62,296 43,173 45,038 240,000 73,073 64,721 57,670 39,953 30,417 31,378 54,444 51,920 50,908 51,515 46,040Median 45,000 58,600 38,500 33,650 240,000 67,600 59,000 49,136 38,750 30,000 31,250 40,000 47,000 45,000 45,000 41,6101st Decile 28,000 36,057 26,000 28,000 240,000 58,000 38,500 36,000 28,000 20,500 24,500 28,500 29,000 28,000 28,000 30,0009th Decile 80,000 90,000 62,000 100,000 240,000 100,008 100,000 77,000 55,000 40,750 41,396 98,500 86,000 80,000 80,000 79,700
Employment status
Chartered Members
Non-Chartered Members
Male
Female
TotalMember Grade Level of Responsibility Gender
32

Section B Classified by membership grade, class of employment and level of responsibility
SECTION B / TABLE 5 : SALARY OR SELF EMPLOYED EARNINGS BY LEVEL OF RESPONSIBILITY - HIGHEST QUALIFICATION
Chartered Assoc Other MD/CEO Sen Mgr Proj Mgr Sen Eng Engineer Technician Graduate Consultant Other Male Female Full time Part timeTotal 167 97 59 11 1 24 64 45 19 0 3 7 4 144 23 152 15Mean 72,034 85,833 52,389 55,727 114,780 105,846 73,358 61,242 39,520 30,833 123,571 53,863 75,277 51,732 71,303 79,441Median 61,000 76,000 46,000 44,000 114,780 89,500 66,670 55,000 39,000 30,000 92,000 48,000 62,000 40,000 62,000 50,0001st Decile 38,000 49,000 31,000 30,000 114,780 60,000 40,000 41,000 30,000 28,000 42,000 29,450 40,000 30,000 39,000 31,0009th Decile 120,000 135,000 82,000 88,500 114,780 150,000 120,000 90,000 60,000 34,500 400,000 90,000 120,000 80,000 120,000 110,000Total 895 392 476 27 7 57 195 176 268 5 137 37 13 690 205 864 30Mean 60,973 84,406 42,332 49,391 123,429 124,077 86,303 62,296 41,483 34,890 31,899 66,278 55,912 65,654 45,217 61,717 39,469Median 47,500 67,500 37,500 42,000 105,000 110,000 68,000 55,000 38,188 35,000 31,000 58,000 58,000 50,000 40,100 48,000 35,0501st Decile 29,350 42,000 28,000 28,000 80,000 58,000 43,779 41,000 29,350 30,000 25,000 24,000 14,000 30,000 28,000 29,500 22,8299th Decile 109,000 130,000 60,000 93,500 200,000 189,280 135,000 97,000 55,000 40,750 40,500 120,000 98,000 118,500 70,279 110,000 57,990Total 609 441 151 17 21 93 222 142 55 3 25 40 8 531 78 579 30Mean 84,272 92,367 63,684 57,176 219,535 116,919 85,547 65,986 46,695 47,477 29,001 84,868 80,800 87,012 65,623 85,563 59,357Median 71,000 76,000 52,000 50,000 150,000 102,000 75,000 60,000 43,850 32,930 29,000 78,995 70,900 74,000 57,800 72,000 58,1251st Decile 37,000 48,000 28,500 29,000 80,000 67,600 49,000 42,000 29,500 20,500 20,000 36,500 16,000 37,900 33,000 37,000 29,3669th Decile 130,000 135,000 100,008 97,500 447,241 195,000 124,926 98,000 72,000 89,000 36,500 141,500 165,000 131,500 90,300 130,000 87,220Total 11 3 5 3 0 3 5 1 0 0 0 0 2 11 0 11 0Mean 80,807 112,027 91,160 32,333 173,333 54,576 54,000 21,000 80,807 80,807Median 55,000 70,080 54,000 25,000 160,000 55,000 54,000 21,000 55,000 55,0001st Decile 25,000 56,000 45,800 17,000 150,000 45,800 54,000 17,000 25,000 25,0009th Decile 160,000 210,000 160,000 55,000 210,000 70,080 54,000 25,000 160,000 160,000
Employment status
Doctorate
Masters
Bachelors
Non-grad
TotalMember Grade Level of Responsibility Gender
33

Section B Classified by membership grade, class of employment and level of responsibility
SECTION B / TABLE 6 : SALARY OR SELF EMPLOYED EARNINGS BY LEVEL OF RESPONSIBILITY - CHARTERED MEMBERS OR FELLOWS
Chartered Assoc Other MD/CEO Sen Mgr Proj Mgr Sen Eng Engineer Technician Graduate Consultant Other Male Female Full time Part timeTotal 23 23 0 0 23 0 0 0 0 0 0 0 0 23 0 23 0Mean 208,870 208,870 208,870 208,870 208,870Median 145,000 145,000 145,000 145,000 145,0001st Decile 80,000 80,000 80,000 80,000 80,0009th Decile 447,241 447,241 447,241 447,241 447,241Total 138 138 0 0 0 138 0 0 0 0 0 0 0 135 3 137 1Mean 121,106 121,106 121,106 122,486 59,033 121,625 50,000Median 105,750 105,750 105,750 109,000 60,000 106,000 50,0001st Decile 67,500 67,500 67,500 68,000 49,500 67,563 50,0009th Decile 192,000 192,000 192,000 192,000 67,600 192,000 50,000Total 366 366 0 0 0 0 366 0 0 0 0 0 0 316 50 343 23Mean 90,742 90,742 90,742 94,445 67,338 93,149 54,842Median 75,000 75,000 75,000 78,925 60,500 77,300 50,0001st Decile 50,000 50,000 50,000 53,000 39,125 53,000 33,2109th Decile 129,794 129,794 129,794 130,000 97,500 130,000 85,440Total 265 265 0 0 0 0 0 265 0 0 0 0 0 220 45 246 18Mean 67,543 67,543 67,543 68,635 62,203 68,800 50,614Median 60,900 60,900 60,900 61,000 55,000 61,000 46,5001st Decile 44,000 44,000 44,000 45,000 36,000 45,000 31,0009th Decile 106,000 106,000 106,000 106,618 80,000 106,236 89,000Total 67 67 0 0 0 0 0 0 67 0 0 0 0 48 19 63 4Mean 52,157 52,157 52,157 54,196 47,006 53,021 38,547Median 46,500 46,500 46,500 51,400 42,000 47,500 35,5431st Decile 36,000 36,000 36,000 38,000 31,086 37,500 22,5009th Decile 77,175 77,175 77,175 77,175 80,000 77,175 60,600Total 0 0 0 0 0 0 0 0 0 0 0 0 0 0 0 0 0MeanMedian1st Decile9th DecileTotal 1 1 0 0 0 0 0 0 0 0 1 0 0 1 0 1 0Mean 20,000 20,000 20,000 20,000 20,000Median 20,000 20,000 20,000 20,000 20,0001st Decile 20,000 20,000 20,000 20,000 20,0009th Decile 20,000 20,000 20,000 20,000 20,000Total 60 60 0 0 0 0 0 0 0 0 0 60 0 56 4 43 17Mean 86,524 86,524 86,524 87,678 70,375 90,581 76,262Median 78,995 78,995 78,995 78,995 71,500 90,000 50,0001st Decile 26,866 26,866 26,866 25,000 40,000 44,500 20,0009th Decile 137,500 137,500 137,500 140,000 98,500 140,000 135,000Total 13 13 0 0 0 0 0 0 0 0 0 0 13 11 2 12 1Mean 88,415 88,415 88,415 91,345 72,300 91,033 57,000Median 80,000 80,000 80,000 80,000 72,300 83,000 57,0001st Decile 58,600 58,600 58,600 61,800 58,600 61,800 57,0009th Decile 130,000 130,000 130,000 130,000 86,000 130,000 57,000
Employment status
Consultant
Other
Senior manager/Director/Dean/Head of department
Manager/Site Manager/Project Manager/Associate professor/Professor/Principal engineer
Senior engineer/Senior lecturer
Engineer/Supervised team member/Lecturer
Engineering technician
Graduate in training/Engineer in training/Postdoctoral
Chairman/Managing director/Chief executive/Vice chancellor/Vice president
TotalMember Grade Level of Responsibility Gender
34
Senior manager/Director/Dean/Head of department
Manager/Site Manager/Project Manager/Associate professor/Professor/Principal engineer

Section B Classified by membership grade, class of employment and level of responsibility
SECTION B / TABLE 7 : SALARY OR SELF EMPLOYED EARNINGS BY LEVEL OF RESPONSIBILITY - ASSOCIATES
Chartered Assoc Other MD/CEO Sen Mgr Proj Mgr Sen Eng Engineer Technician Graduate Consultant Other Male Female Full time Part timeTotal 5 0 5 0 5 0 0 0 0 0 0 0 0 4 1 5 0Mean 145,000 145,000 145,000 121,250 240,000 145,000Median 120,000 120,000 120,000 115,000 240,000 120,0001st Decile 65,000 65,000 65,000 65,000 240,000 65,0009th Decile 240,000 240,000 240,000 190,000 240,000 240,000Total 36 0 36 0 0 36 0 0 0 0 0 0 0 28 8 35 1Mean 111,457 111,457 111,457 120,920 78,339 113,170 51,500Median 88,000 88,000 88,000 97,500 71,250 90,000 51,5001st Decile 58,000 58,000 58,000 56,000 58,000 60,000 51,5009th Decile 200,000 200,000 200,000 250,000 120,000 200,000 51,500Total 109 0 109 0 0 0 109 0 0 0 0 0 0 83 26 106 3Mean 63,125 63,125 63,125 64,368 59,156 63,770 40,333Median 56,000 56,000 56,000 62,000 52,500 57,500 48,0001st Decile 38,500 38,500 38,500 39,000 38,500 39,000 21,0009th Decile 86,000 86,000 86,000 86,000 85,000 86,000 52,000Total 90 0 90 0 0 0 0 90 0 0 0 0 0 73 17 86 4Mean 52,507 52,507 52,507 54,099 45,670 53,207 37,455Median 48,501 48,501 48,501 50,000 46,000 49,500 38,6101st Decile 37,450 37,450 37,450 39,000 36,000 38,200 30,0009th Decile 74,000 74,000 74,000 78,000 55,000 75,000 42,598Total 258 0 258 0 0 0 0 0 258 0 0 0 0 192 66 257 1Mean 39,842 39,842 39,842 40,439 38,104 39,872 32,000Median 37,563 37,563 37,563 37,625 36,925 37,625 32,0001st Decile 29,000 29,000 29,000 30,000 28,000 29,000 32,0009th Decile 51,000 51,000 51,000 51,000 52,000 51,000 32,000Total 8 0 8 0 0 0 0 0 0 8 0 0 0 5 3 8 0Mean 39,610 39,610 39,610 45,126 30,417 39,610Median 33,965 33,965 33,965 35,000 30,000 33,9651st Decile 20,500 20,500 20,500 32,100 20,500 20,5009th Decile 89,000 89,000 89,000 89,000 40,750 89,000Total 157 0 157 0 0 0 0 0 0 0 157 0 0 110 47 157 0Mean 31,541 31,541 31,541 31,621 31,353 31,541Median 30,200 30,200 30,200 30,100 31,000 30,2001st Decile 25,000 25,000 25,000 25,000 24,500 25,0009th Decile 40,500 40,500 40,500 40,000 42,000 40,500Total 19 0 19 0 0 0 0 0 0 0 0 19 0 14 5 18 1Mean 56,592 56,592 56,592 61,911 41,700 58,070 30,000Median 40,000 40,000 40,000 54,320 33,500 43,520 30,0001st Decile 28,500 28,500 28,500 30,000 28,500 28,500 30,0009th Decile 99,000 99,000 99,000 99,000 80,000 99,000 30,000Total 9 0 9 0 0 0 0 0 0 0 0 0 9 7 2 9 0Mean 38,478 38,478 38,478 37,186 43,000 38,478Median 36,850 36,850 36,850 29,450 43,000 36,8501st Decile 10,000 10,000 10,000 10,000 39,000 10,0009th Decile 98,000 98,000 98,000 98,000 47,000 98,000
Employment status
Consultant
Other
Senior manager/Director/Dean/Head of department
Manager/Site Manager/Project Manager/Associate professor/Professor/Principal engineer
Senior engineer/Senior lecturer
Engineer/Supervised team member/Lecturer
Engineering technician
Graduate in training/Engineer in training/Postdoctoral
Chairman/Managing director/Chief executive/Vice chancellor/Vice president
TotalMember Grade Level of Responsibility Gender
Senior manager/Director/Dean/Head of department
Manager/Site Manager/Project Manager/Associate professor/Professor/Principal engineer
35
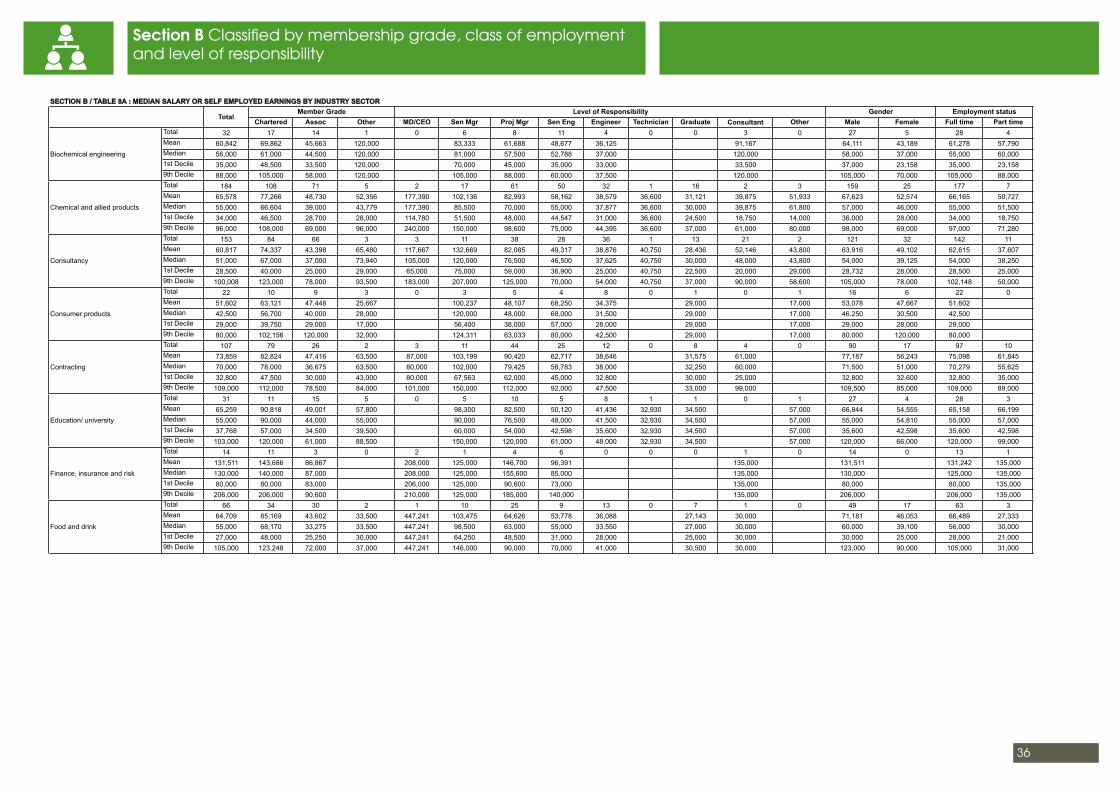
Section B Classified by membership grade, class of employment and level of responsibility
SECTION B / TABLE 8A : MEDIAN SALARY OR SELF EMPLOYED EARNINGS BY INDUSTRY SECTOR
Chartered Assoc Other MD/CEO Sen Mgr Proj Mgr Sen Eng Engineer Technician Graduate Consultant Other Male Female Full time Part timeTotal 32 17 14 1 0 6 8 11 4 0 0 3 0 27 5 28 4Mean 60,842 69,862 45,663 120,000 83,333 61,688 48,677 36,125 91,167 64,111 43,189 61,278 57,790Median 56,000 61,000 44,500 120,000 81,000 57,500 52,788 37,000 120,000 58,000 37,000 55,000 60,0001st Decile 35,000 48,500 33,500 120,000 70,000 45,000 35,000 33,000 33,500 37,000 23,158 35,000 23,1589th Decile 88,000 105,000 58,000 120,000 105,000 88,000 60,000 37,500 120,000 105,000 70,000 105,000 88,000Total 184 108 71 5 2 17 61 50 32 1 16 2 3 159 25 177 7Mean 65,578 77,266 48,730 52,356 177,390 102,136 82,993 58,162 38,579 36,600 31,121 39,875 51,933 67,623 52,574 66,165 50,727Median 55,000 66,604 39,000 43,779 177,390 85,500 70,000 55,000 37,877 36,600 30,000 39,875 61,800 57,000 46,000 55,000 51,5001st Decile 34,000 46,500 28,700 28,000 114,780 51,500 48,000 44,547 31,000 36,600 24,500 18,750 14,000 36,000 28,000 34,000 18,7509th Decile 96,000 108,000 69,000 96,000 240,000 150,000 98,600 75,000 44,395 36,600 37,000 61,000 80,000 98,000 69,000 97,000 71,280Total 153 84 66 3 3 11 38 28 36 1 13 21 2 121 32 142 11Mean 60,817 74,337 43,398 65,480 117,667 132,669 82,085 49,317 38,876 40,750 28,436 52,146 43,800 63,916 49,102 62,615 37,607Median 51,000 67,000 37,000 73,940 105,000 120,000 76,500 46,500 37,625 40,750 30,000 48,000 43,800 54,000 39,125 54,000 38,2501st Decile 28,500 40,000 25,000 29,000 65,000 75,000 59,000 36,900 25,000 40,750 22,500 20,000 29,000 28,732 28,000 28,500 25,0009th Decile 100,008 123,000 78,000 93,500 183,000 207,000 125,000 70,000 54,000 40,750 37,000 90,000 58,600 105,000 78,000 102,148 50,000Total 22 10 9 3 0 3 5 4 8 0 1 0 1 16 6 22 0Mean 51,602 63,121 47,448 25,667 100,237 48,107 68,250 34,375 29,000 17,000 53,078 47,667 51,602Median 42,500 56,700 40,000 28,000 120,000 48,000 68,000 31,500 29,000 17,000 46,250 30,500 42,5001st Decile 29,000 39,750 29,000 17,000 56,400 38,000 57,000 28,000 29,000 17,000 29,000 28,000 29,0009th Decile 80,000 102,156 120,000 32,000 124,311 63,033 80,000 42,500 29,000 17,000 80,000 120,000 80,000Total 107 79 26 2 3 11 44 25 12 0 8 4 0 90 17 97 10Mean 73,859 82,824 47,416 63,500 87,000 103,199 90,420 62,717 38,646 31,575 61,000 77,187 56,243 75,098 61,845Median 70,000 78,000 36,675 63,500 80,000 102,000 79,425 58,783 38,000 32,250 60,000 71,500 51,000 70,279 55,6251st Decile 32,800 47,500 30,000 43,000 80,000 67,563 62,000 45,000 32,800 30,000 25,000 32,800 32,600 32,800 35,0009th Decile 109,000 112,000 78,500 84,000 101,000 150,000 112,000 92,000 47,500 33,000 99,000 109,500 85,000 109,000 89,000Total 31 11 15 5 0 5 10 5 8 1 1 0 1 27 4 28 3Mean 65,259 90,818 49,001 57,800 98,300 82,500 50,120 41,436 32,930 34,500 57,000 66,844 54,555 65,158 66,199Median 55,000 90,000 44,000 55,000 90,000 76,500 48,000 41,500 32,930 34,500 57,000 55,000 54,810 55,000 57,0001st Decile 37,768 57,000 34,500 39,500 60,000 54,000 42,598 35,600 32,930 34,500 57,000 35,600 42,598 35,600 42,5989th Decile 103,000 120,000 61,000 88,500 150,000 120,000 61,000 48,000 32,930 34,500 57,000 120,000 66,000 120,000 99,000Total 14 11 3 0 2 1 4 6 0 0 0 1 0 14 0 13 1Mean 131,511 143,686 86,867 208,000 125,000 146,700 96,391 135,000 131,511 131,242 135,000Median 130,000 140,000 87,000 208,000 125,000 155,600 85,000 135,000 130,000 125,000 135,0001st Decile 80,000 80,000 83,000 206,000 125,000 90,600 73,000 135,000 80,000 80,000 135,0009th Decile 206,000 206,000 90,600 210,000 125,000 185,000 140,000 135,000 206,000 206,000 135,000Total 66 34 30 2 1 10 25 9 13 0 7 1 0 49 17 63 3Mean 64,709 85,169 43,602 33,500 447,241 103,475 64,626 53,778 36,088 27,143 30,000 71,181 46,053 66,489 27,333Median 55,000 68,170 33,275 33,500 447,241 98,500 63,000 55,000 33,550 27,000 30,000 60,000 39,100 56,000 30,0001st Decile 27,000 48,000 25,250 30,000 447,241 64,250 48,500 31,000 28,000 25,000 30,000 30,000 25,000 28,000 21,0009th Decile 105,000 123,248 72,000 37,000 447,241 146,000 90,000 70,000 41,000 30,500 30,000 123,000 90,000 105,000 31,000
Employment status
Food and drink
Chemical and allied products
Consultancy
Consumer products
Contracting
Education/ university
Finance, insurance and risk
Biochemical engineering
TotalMember Grade Level of Responsibility Gender
36

Section B Classified by membership grade, class of employment and level of responsibility
SECTION B / TABLE 8B : MEDIAN SALARY OR SELF EMPLOYED EARNINGS BY INDUSTRY SECTOR
Chartered Assoc Other MD/CEO Sen Mgr Proj Mgr Sen Eng Engineer Technician Graduate Consultant Other Male Female Full time Part timeTotal
18 11 6 1 0 3 5 3 0 0 1 6 0 14 4 18 0
Mean 71,621 79,198 53,000 100,000 118,667 69,800 54,058 21,000 66,833 78,941 46,000 71,621Median 63,500 68,174 38,750 100,000 126,000 55,000 50,000 21,000 63,500 66,587 31,500 63,5001st Decile 29,500 55,000 21,000 100,000 90,000 55,000 44,000 21,000 29,500 50,000 21,000 29,5009th Decile 130,000 126,000 140,000 100,000 140,000 100,000 68,174 21,000 130,000 130,000 100,000 130,000Total 46 28 17 1 0 6 14 10 4 0 10 1 1 36 10 44 2Mean 62,193 79,040 37,161 16,000 100,833 66,746 70,100 42,555 32,419 110,000 16,000 64,666 53,287 61,429 79,000Median 57,500 77,000 38,187 16,000 113,000 67,325 73,000 43,587 32,500 110,000 16,000 64,500 48,024 57,500 79,0001st Decile 29,000 47,000 25,000 16,000 60,000 39,000 49,500 35,000 24,750 110,000 16,000 30,000 25,000 29,000 48,0009th Decile 110,000 116,000 48,048 16,000 125,000 100,000 87,000 48,048 40,000 110,000 16,000 110,000 84,500 101,200 110,000Total 10 2 6 2 0 2 3 0 2 0 3 0 0 10 0 10 0Mean 42,798 56,990 39,500 38,500 67,500 51,660 32,500 24,333 42,798 42,798Median 40,000 56,990 32,500 38,500 67,500 52,000 32,500 25,000 40,000 40,0001st Decile 22,500 55,000 20,000 25,000 55,000 44,000 29,000 20,000 22,500 22,5009th Decile 69,490 58,980 80,000 52,000 80,000 58,980 36,000 28,000 69,490 69,490Total 14 11 3 0 0 1 5 5 1 0 1 1 0 13 1 14 0Mean 77,255 82,729 57,184 95,000 68,969 92,945 89,000 28,000 60,000 81,044 28,000 77,255Median 78,363 86,726 48,552 95,000 52,000 100,000 89,000 28,000 60,000 86,726 28,000 78,3631st Decile 48,552 52,000 28,000 95,000 48,552 70,000 89,000 28,000 60,000 50,500 28,000 48,5529th Decile 104,000 104,000 95,000 95,000 129,794 104,000 89,000 28,000 60,000 104,000 28,000 104,000Total 313 176 134 3 5 28 76 66 76 1 35 22 4 257 56 300 12Mean 94,085 123,823 56,265 38,793 275,800 182,180 118,870 86,846 52,671 89,000 35,996 111,173 101,250 100,443 64,909 94,543 85,235Median 75,000 110,000 48,000 36,500 160,000 145,000 116,150 76,500 49,600 89,000 35,700 99,250 94,000 85,000 55,000 77,000 60,0001st Decile 35,005 58,000 32,960 29,880 115,000 65,000 63,000 50,000 32,260 89,000 26,000 43,000 87,000 36,000 34,000 35,020 24,0009th Decile 160,000 192,000 98,000 50,000 585,000 321,000 180,000 129,575 80,000 89,000 46,650 170,000 130,000 162,000 110,500 160,000 100,000Total 99 58 34 7 2 12 23 22 19 0 13 6 2 82 17 96 3Mean 81,047 91,075 68,192 60,400 146,000 152,875 89,883 74,968 48,202 37,900 98,167 91,500 87,401 50,395 81,882 54,333Median 75,000 83,500 45,500 57,000 146,000 126,000 82,000 71,500 46,500 36,005 98,000 91,500 80,000 40,791 75,425 40,0001st Decile 36,000 55,000 32,000 35,000 92,000 97,500 67,000 55,000 34,500 30,000 78,000 58,000 42,000 34,000 36,005 34,0009th Decile 125,000 129,000 97,000 97,500 200,000 250,000 125,000 92,000 62,000 47,000 115,000 125,000 129,000 77,000 125,000 89,000Total 1 0 1 0 0 1 0 0 0 0 0 0 0 0 1 1 0Mean 64,000 64,000 64,000 64,000 64,000Median 64,000 64,000 64,000 64,000 64,0001st Decile 64,000 64,000 64,000 64,000 64,0009th Decile 64,000 64,000 64,000 64,000 64,000Total 78 46 32 0 1 8 18 23 20 1 5 1 1 63 15 77 1Mean 76,293 92,885 52,442 145,000 120,500 126,054 63,186 42,015 35,000 35,490 30,000 36,850 82,639 49,640 76,748 41,220Median 61,000 71,500 40,050 145,000 116,500 82,500 61,000 40,625 35,000 36,000 30,000 36,850 65,500 42,000 61,000 41,2201st Decile 35,000 45,000 32,550 145,000 76,000 61,000 45,000 32,000 35,000 32,400 30,000 36,850 35,000 38,000 35,000 41,2209th Decile 128,000 130,000 86,000 145,000 170,000 150,000 90,000 57,965 35,000 40,000 30,000 36,850 130,000 65,000 128,000 41,220Total 91 36 50 5 1 3 30 18 24 0 9 3 3 71 20 89 2Mean 61,083 84,414 45,443 49,500 190,000 73,583 85,313 53,769 38,658 29,311 85,990 57,000 64,825 47,800 61,242 53,990Median 47,000 57,740 40,898 35,000 190,000 85,000 52,500 50,000 36,000 29,500 79,990 66,000 46,000 50,500 46,750 53,9901st Decile 30,000 40,000 29,250 25,000 190,000 46,750 39,000 43,616 31,000 25,000 57,980 25,000 30,000 32,000 30,000 50,0009th Decile 88,000 92,000 60,500 120,000 190,000 89,000 105,000 80,000 55,000 32,000 120,000 80,000 89,000 62,000 89,000 57,980
Employment status
Petrochemicals
Pharmaceuticals and personal care products
Industrial gases
Iron, steel and other metals
Mining and minerals
Oil and gas exploration and production
Oil refining
Paper and packaging
Health, safety and environment
TotalMember Grade Level of Responsibility Gender
37

Section B Classified by membership grade, class of employment and level of responsibility
SECTION B / TABLE 8C : MEDIAN SALARY OR SELF EMPLOYED EARNINGS BY INDUSTRY SECTOR
Chartered Assoc Other MD/CEO Sen Mgr Proj Mgr Sen Eng Engineer Technician Graduate Consultant Other Male Female Full time Part timeTotal 14 8 5 1 1 3 3 1 5 0 1 0 0 14 0 14 0Mean 130,689 198,436 40,430 40,000 705,000 177,667 98,497 54,000 42,430 30,000 130,689 130,689Median 68,000 127,000 39,150 40,000 705,000 187,000 103,490 54,000 40,000 30,000 68,000 68,0001st Decile 34,000 54,000 30,000 40,000 705,000 144,000 82,000 54,000 34,000 30,000 34,000 34,0009th Decile 202,000 705,000 51,000 40,000 705,000 202,000 110,000 54,000 51,000 30,000 202,000 202,000Total 21 15 6 0 0 1 6 7 2 0 3 1 1 18 3 21 0Mean 57,475 69,999 26,167 119,600 74,877 48,731 32,000 27,667 140,000 10,000 61,496 33,352 57,475Median 58,000 61,500 27,000 119,600 71,650 42,000 32,000 26,000 140,000 10,000 58,980 36,000 58,0001st Decile 26,000 36,057 10,000 119,600 58,000 36,000 28,000 26,000 140,000 10,000 26,000 28,000 26,0009th Decile 97,000 119,600 36,000 119,600 97,000 69,437 36,000 31,000 140,000 10,000 119,600 36,057 97,000Total 57 35 21 1 0 8 18 11 12 0 6 1 1 48 9 56 1Mean 58,448 68,714 41,836 48,000 104,056 62,308 54,543 39,065 31,464 72,000 48,000 59,260 54,119 58,688 45,000Median 54,000 60,000 37,000 48,000 87,475 60,096 54,000 39,734 31,750 72,000 48,000 54,000 53,850 54,000 45,0001st Decile 34,000 43,000 31,500 48,000 70,000 41,000 45,000 34,000 28,192 72,000 48,000 34,327 33,000 34,000 45,0009th Decile 80,700 94,250 61,000 48,000 195,000 80,000 66,000 43,000 34,567 72,000 48,000 88,000 80,700 80,700 45,000Total 37 15 21 1 0 1 11 5 12 1 5 2 0 31 6 37 0Mean 49,521 66,108 38,698 28,000 110,000 58,838 46,020 39,046 32,100 28,860 100,000 48,704 53,742 49,521Median 45,000 62,000 35,595 28,000 110,000 62,000 46,000 37,500 32,100 30,000 100,000 45,000 50,500 45,0001st Decile 30,000 45,000 30,000 28,000 110,000 41,000 34,500 30,800 32,100 23,800 100,000 30,000 30,800 30,0009th Decile 79,200 100,000 49,000 28,000 110,000 69,500 55,000 46,000 32,100 31,000 100,000 69,500 79,200 79,200Total 17 7 9 1 0 2 6 4 2 0 1 2 0 13 4 17 0Mean 58,691 73,357 43,250 95,000 80,500 72,000 52,038 35,000 28,000 49,300 64,250 40,625 58,691Median 58,000 66,000 40,000 95,000 80,500 66,000 56,075 35,000 28,000 49,300 58,500 37,250 58,0001st Decile 30,000 37,500 28,000 95,000 66,000 40,000 37,500 30,000 28,000 37,000 40,000 28,000 30,0009th Decile 95,000 127,000 61,600 95,000 95,000 127,000 58,500 40,000 28,000 61,600 95,000 60,000 95,000Total 49 16 29 4 2 6 9 12 14 1 4 1 0 38 11 48 1Mean 56,903 82,444 43,349 53,000 214,500 82,500 68,778 46,925 36,643 30,000 22,282 50,000 63,017 35,782 57,421 32,000Median 45,000 62,500 40,000 54,500 214,500 79,500 60,000 45,500 35,500 30,000 22,000 50,000 49,750 32,000 45,500 32,0001st Decile 27,000 36,600 25,000 46,000 110,000 58,000 40,000 36,600 27,000 30,000 14,600 50,000 30,529 26,000 27,000 32,0009th Decile 105,000 123,000 76,000 57,000 319,000 105,000 123,000 55,000 47,000 30,000 30,529 50,000 110,000 45,000 105,000 32,000Total 26 19 5 2 0 5 4 11 4 0 0 0 2 20 6 19 7Mean 52,195 56,508 40,282 41,000 85,600 42,775 43,712 36,034 66,500 53,522 47,770 58,197 35,903Median 45,555 48,000 41,000 41,000 90,000 38,050 44,410 34,500 66,500 45,555 44,500 48,000 34,1001st Decile 31,086 31,036 33,000 40,000 49,500 31,000 34,100 31,086 47,000 33,550 31,036 36,000 31,0009th Decile 90,000 94,500 47,000 42,000 135,000 64,000 48,000 44,049 86,000 92,250 86,000 94,500 48,000Total 17 11 5 1 0 2 8 3 0 0 4 0 0 14 3 17 0Mean 54,658 65,682 35,538 29,000 82,500 59,875 61,730 25,000 54,536 55,230 54,658Median 59,000 66,500 29,000 29,000 82,500 60,500 68,190 25,500 60,000 59,000 59,0001st Decile 22,000 42,000 20,000 29,000 70,000 38,500 42,000 20,000 22,000 38,500 22,0009th Decile 78,000 78,000 68,190 29,000 95,000 78,000 75,000 29,000 78,000 68,190 78,000Total 78 43 32 3 1 10 27 13 16 0 8 2 1 58 20 72 6Mean 50,706 57,673 41,986 43,867 120,000 84,005 52,815 50,491 32,534 27,081 73,000 29,450 55,468 36,898 51,445 41,847Median 45,100 54,000 36,500 30,300 120,000 73,750 53,000 45,000 31,400 26,500 73,000 29,450 52,750 33,549 45,600 38,1441st Decile 28,500 33,887 26,000 30,300 120,000 60,275 33,887 41,000 25,000 25,150 71,000 29,450 29,000 25,075 28,500 31,0009th Decile 80,000 85,000 65,000 71,000 120,000 125,000 65,000 65,000 40,000 29,000 75,000 29,450 85,000 50,642 80,000 65,300Total 87 42 41 4 5 11 25 12 16 1 10 3 4 73 14 86 1Mean 61,917 81,391 42,349 58,018 99,400 105,811 60,512 59,731 40,402 20,500 29,410 84,764 70,250 65,900 41,150 62,056 50,000Median 55,000 70,660 38,500 52,000 102,000 105,420 58,751 53,125 39,250 20,500 28,377 84,292 51,000 60,000 40,500 55,000 50,0001st Decile 28,000 51,250 25,000 43,779 60,000 75,000 43,779 42,000 29,254 20,500 25,000 78,000 14,000 28,754 28,000 28,000 50,0009th Decile 109,000 120,000 55,000 84,292 130,000 145,000 85,000 100,000 49,000 20,500 33,750 92,000 165,000 115,000 58,751 109,000 50,000
Employment status
Waste management
Water
Other
Power generation and fossil fuels
Power generation and nuclear decommissioning
Power generation and nuclear generation
Power generation and renewables
Process plant and equipment
Public sector
Plastics
TotalMember Grade Level of Responsibility Gender
38
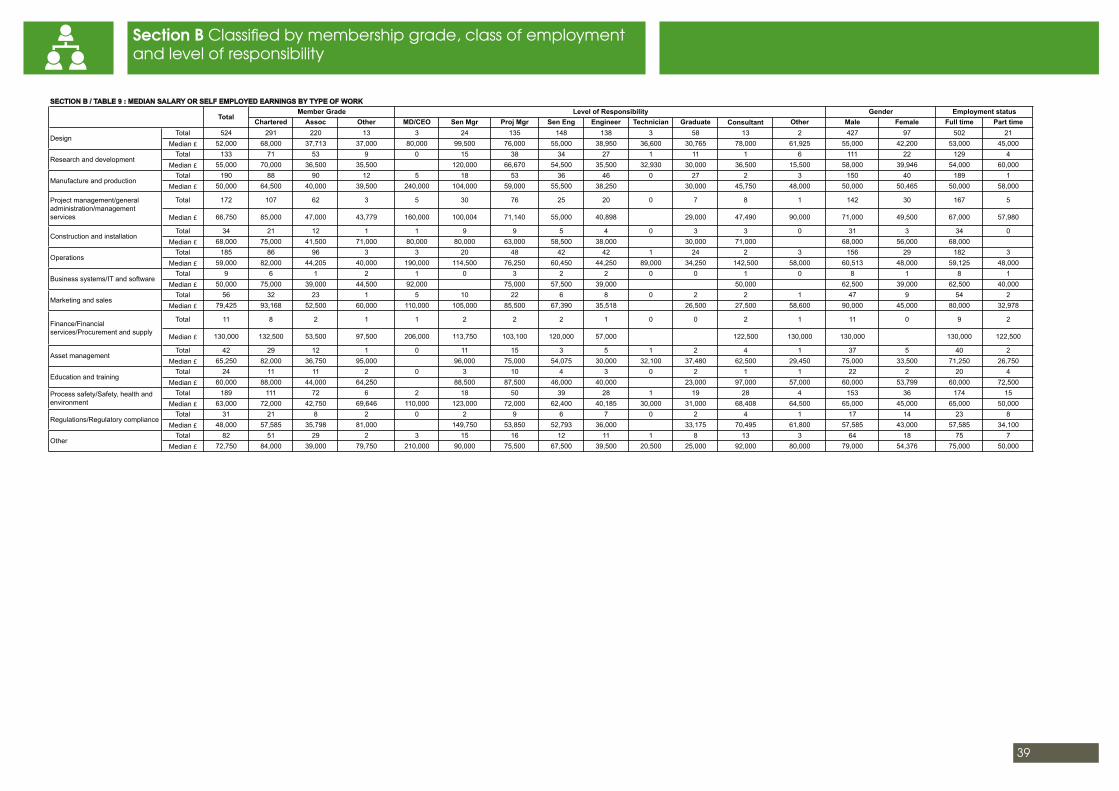
Section B Classified by membership grade, class of employment and level of responsibility
SECTION B / TABLE 9 : MEDIAN SALARY OR SELF EMPLOYED EARNINGS BY TYPE OF WORK
Chartered Assoc Other MD/CEO Sen Mgr Proj Mgr Sen Eng Engineer Technician Graduate Consultant Other Male Female Full time Part timeTotal 524 291 220 13 3 24 135 148 138 3 58 13 2 427 97 502 21
Median £ 52,000 68,000 37,713 37,000 80,000 99,500 76,000 55,000 38,950 36,600 30,765 78,000 61,925 55,000 42,200 53,000 45,000Total 133 71 53 9 0 15 38 34 27 1 11 1 6 111 22 129 4
Median £ 55,000 70,000 36,500 35,500 120,000 66,670 54,500 35,500 32,930 30,000 36,500 15,500 58,000 39,946 54,000 60,000Total 190 88 90 12 5 18 53 36 46 0 27 2 3 150 40 189 1
Median £ 50,000 64,500 40,000 39,500 240,000 104,000 59,000 55,500 38,250 30,000 45,750 48,000 50,000 50,465 50,000 58,000
Total 172 107 62 3 5 30 76 25 20 0 7 8 1 142 30 167 5
Median £ 66,750 85,000 47,000 43,779 160,000 100,004 71,140 55,000 40,898 29,000 47,490 90,000 71,000 49,500 67,000 57,980
Total 34 21 12 1 1 9 9 5 4 0 3 3 0 31 3 34 0Median £ 68,000 75,000 41,500 71,000 80,000 80,000 63,000 58,500 38,000 30,000 71,000 68,000 56,000 68,000
Total 185 86 96 3 3 20 48 42 42 1 24 2 3 156 29 182 3Median £ 59,000 82,000 44,205 40,000 190,000 114,500 76,250 60,450 44,250 89,000 34,250 142,500 58,000 60,513 48,000 59,125 48,000
Total 9 6 1 2 1 0 3 2 2 0 0 1 0 8 1 8 1Median £ 50,000 75,000 39,000 44,500 92,000 75,000 57,500 39,000 50,000 62,500 39,000 62,500 40,000
Total 56 32 23 1 5 10 22 6 8 0 2 2 1 47 9 54 2Median £ 79,425 93,168 52,500 60,000 110,000 105,000 85,500 67,390 35,518 26,500 27,500 58,600 90,000 45,000 80,000 32,978
Total 11 8 2 1 1 2 2 2 1 0 0 2 1 11 0 9 2
Median £ 130,000 132,500 53,500 97,500 206,000 113,750 103,100 120,000 57,000 122,500 130,000 130,000 130,000 122,500
Total 42 29 12 1 0 11 15 3 5 1 2 4 1 37 5 40 2Median £ 65,250 82,000 36,750 95,000 96,000 75,000 54,075 30,000 32,100 37,480 62,500 29,450 75,000 33,500 71,250 26,750
Total 24 11 11 2 0 3 10 4 3 0 2 1 1 22 2 20 4Median £ 60,000 88,000 44,000 64,250 88,500 87,500 46,000 40,000 23,000 97,000 57,000 60,000 53,799 60,000 72,500
Total 189 111 72 6 2 18 50 39 28 1 19 28 4 153 36 174 15Median £ 63,000 72,000 42,750 69,646 110,000 123,000 72,000 62,400 40,185 30,000 31,000 68,408 64,500 65,000 45,000 65,000 50,000
Total 31 21 8 2 0 2 9 6 7 0 2 4 1 17 14 23 8Median £ 48,000 57,585 35,798 81,000 149,750 53,850 52,793 36,000 33,175 70,495 61,800 57,585 43,000 57,585 34,100
Total 82 51 29 2 3 15 16 12 11 1 8 13 3 64 18 75 7Median £ 72,750 84,000 39,000 79,750 210,000 90,000 75,500 67,500 39,500 20,500 25,000 92,000 80,000 79,000 54,376 75,000 50,000
Employment status
Design
Business systems/IT and software
TotalMember Grade Level of Responsibility Gender
Research and development
Manufacture and production
Project management/general administration/management services
Construction and installation
Operations
Other
Marketing and sales
Finance/Financial services/Procurement and supply
Asset management
Education and training
Process safety/Safety, health and environment
Regulations/Regulatory compliance
39

Section CClassified by region
40

Section C Classified by region
SECTION C / TABLE 1 : EMPLOYMENT STATUS
North East South East East of England North West South West East MidlandsWest
Midlands WalesNorthern Ireland Scotland
Yorkshire and the Humber
Total 1682 129 573 43 323 92 55 55 57 18 253 84% 100.0% 100.0% 100.0% 100.0% 100.0% 100.0% 100.0% 100.0% 100.0% 100.0% 100.0% 100.0%
Total 1606 123 549 43 307 88 54 53 52 18 237 82% 95.5% 95.3% 96.0% 100.0% 95.0% 95.7% 98.2% 96.4% 91.2% 100.0% 93.7% 97.6%
Total 75 6 23 0 16 4 1 2 5 0 16 2% 4.5% 4.7% 4.0% 0.0% 5.0% 4.3% 1.8% 3.6% 8.8% 0.0% 6.3% 2.4%
Full time
Part time
Region
Total
Total
41

Section C Classified by region
SECTION C / TABLE 2 : CURRENT ANNUAL SALARY OR SELF EMPLOYED EARNINGS
North East South EastEast of
England North West South West East MidlandsWest
Midlands WalesNorthern Ireland Scotland
Yorkshire and the Humber
Total 1682 129 573 43 323 92 55 55 57 18 253 84<£16K 10 1 2 1 0 2 0 0 0 0 1 3>=£16K 2 0 1 0 1 0 0 0 0 0 0 0>=£18K 3 0 0 0 1 0 0 0 0 0 2 0>=£19K 1 0 0 0 0 0 0 0 0 1 0 0>=£20K 6 1 1 0 1 0 0 0 1 1 1 0>=£21K 3 0 1 0 1 0 0 0 1 0 0 0>=£22K 5 0 1 0 0 0 0 1 0 0 3 0>=£23K 3 1 0 0 2 0 0 0 0 0 0 0>=£24K 5 0 0 0 3 0 1 0 0 0 1 0>=£25K 18 0 8 1 2 0 2 1 0 1 2 1>=£26K 11 0 0 0 4 1 2 2 0 0 1 1>=£27K 5 1 0 0 1 2 0 0 0 0 0 1>=£28K 30 1 6 0 8 1 4 1 2 0 5 2>=£29K 27 5 7 2 1 4 0 2 1 1 3 1>=£30K 33 1 12 2 7 2 2 2 0 0 3 2>=£31K 18 1 3 2 6 0 0 2 0 0 3 1>=£32K 35 2 18 3 4 3 0 1 0 0 3 1>=£33K 25 2 7 1 6 1 1 1 0 1 4 1>=£34K 24 0 7 0 8 3 0 0 3 0 2 1>=£35K 28 1 11 0 7 2 1 0 0 0 5 1>=£36K 39 6 7 2 3 3 1 3 1 0 6 7>=£37K 30 5 7 0 9 3 1 0 0 0 2 3>=£38K 28 1 6 1 7 1 2 0 0 1 4 5>=£39K 19 5 2 1 4 1 1 1 1 1 1 1>=£40K 138 12 40 3 25 16 2 9 6 1 18 6>=£45K 119 3 43 3 28 6 6 1 5 2 18 4>=£50K 107 8 35 3 11 7 2 7 5 1 21 7>=£55K 118 11 32 5 24 5 5 8 6 2 16 4>=£60K 95 17 23 1 28 5 3 3 4 0 9 2>=£65K 78 7 24 1 22 3 2 1 1 2 11 4>=£70K 79 10 23 1 21 5 2 2 1 0 11 3>=£75K 67 5 25 1 17 5 4 1 2 0 5 2>=£80K 60 5 22 1 11 3 2 1 3 2 9 1>=£85K 45 3 20 1 8 2 1 0 1 1 7 1>=£90K 51 4 25 1 7 2 2 0 1 0 5 4>=£95K 35 0 16 1 4 0 1 0 2 0 7 4>=£100K 30 2 13 0 3 0 1 0 0 0 9 2>=£105K 29 4 12 0 5 1 0 1 0 0 4 2>=£110K 23 0 13 0 5 0 0 0 1 0 4 0>=£115K 18 0 10 1 1 0 1 0 0 0 5 0
Total
Region
42
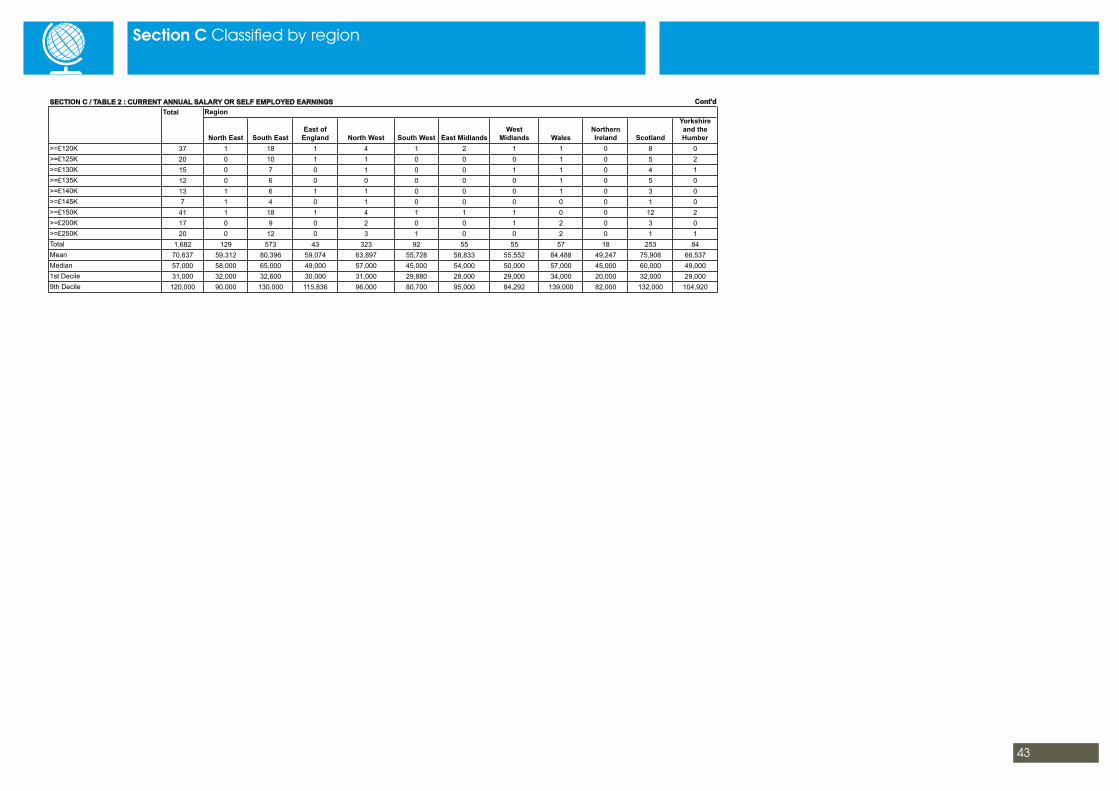
Section C Classified by region
SECTION C / TABLE 2 : CURRENT ANNUAL SALARY OR SELF EMPLOYED EARNINGS Cont'dTotal Region
North East South EastEast of
England North West South West East MidlandsWest
Midlands WalesNorthern Ireland Scotland
Yorkshire and the Humber
>=£120K 37 1 18 1 4 1 2 1 1 0 8 0>=£125K 20 0 10 1 1 0 0 0 1 0 5 2>=£130K 15 0 7 0 1 0 0 1 1 0 4 1>=£135K 12 0 6 0 0 0 0 0 1 0 5 0>=£140K 13 1 6 1 1 0 0 0 1 0 3 0>=£145K 7 1 4 0 1 0 0 0 0 0 1 0>=£150K 41 1 18 1 4 1 1 1 0 0 12 2>=£200K 17 0 9 0 2 0 0 1 2 0 3 0>=£250K 20 0 12 0 3 1 0 0 2 0 1 1Total 1,682 129 573 43 323 92 55 55 57 18 253 84Mean 70,637 59,312 80,396 59,074 63,897 55,728 58,833 55,552 84,488 49,247 75,908 66,537Median 57,000 58,000 65,000 49,000 57,000 45,000 54,000 50,000 57,000 45,000 60,000 49,0001st Decile 31,000 32,000 32,600 30,000 31,000 29,880 28,000 29,000 34,000 20,000 32,000 29,0009th Decile 120,000 90,000 130,000 115,836 96,000 80,700 95,000 84,292 139,000 82,000 132,000 104,920
43

Section C Classified by region
SECTION C / TABLE 3 : BENEFITS IN KIND FOR SALARIED EMPLOYEES
North East South East East of England North West South West East MidlandsWest
Midlands WalesNorthern Ireland Scotland
Yorkshire and the Humber
1682 129 573 43 323 92 55 55 57 18 253 84Total 4 1 0 0 0 0 0 0 1 0 2 0
% 0.2% 0.8% 0.0% 0.0% 0.0% 0.0% 0.0% 0.0% 1.8% 0.0% 0.8% 0.0%Total 2 0 1 0 0 0 0 0 0 0 1 0
% 0.1% 0.0% 0.2% 0.0% 0.0% 0.0% 0.0% 0.0% 0.0% 0.0% 0.4% 0.0%
Total 499 35 174 14 94 27 17 19 17 8 66 28
% 29.7% 27.1% 30.4% 32.6% 29.1% 29.3% 30.9% 34.5% 29.8% 44.4% 26.1% 33.3%
Total 1013 83 343 25 204 57 31 32 35 8 145 50
% 60.2% 64.3% 59.9% 58.1% 63.2% 62.0% 56.4% 58.2% 61.4% 44.4% 57.3% 59.5%
Total 54 0 23 1 10 3 1 2 1 0 13 0% 3.2% 0.0% 4.0% 2.3% 3.1% 3.3% 1.8% 3.6% 1.8% 0.0% 5.1% .0%
Total 110 10 32 3 15 5 6 2 3 2 26 6% 6.5% 7.8% 5.6% 7.0% 4.6% 5.4% 10.9% 3.6% 5.3% 11.1% 10.3% 7.1%
Total 1007 87 398 19 181 39 19 18 43 12 141 50% 59.9% 67.4% 69.5% 44.2% 56.0% 42.4% 34.5% 32.7% 75.4% 66.7% 55.7% 59.5%
Total 505 32 207 13 92 17 19 17 19 1 65 23% 30.0% 24.8% 36.1% 30.2% 28.5% 18.5% 34.5% 30.9% 33.3% 5.6% 25.7% 27.4%
Total 493 39 186 14 87 18 6 8 9 3 90 33% 29.3% 30.2% 32.5% 32.6% 26.9% 19.6% 10.9% 14.5% 15.8% 16.7% 35.6% 39.3%
Total 619 48 234 18 99 32 19 18 20 2 95 34% 36.8% 37.2% 40.8% 41.9% 30.7% 34.8% 34.5% 32.7% 35.1% 11.1% 37.5% 40.5%
Total 64 5 41 0 7 2 0 1 0 0 6 2% 3.8% 3.9% 7.2% 0.0% 2.2% 2.2% 0.0% 1.8% 0.0% 0.0% 2.4% 2.4%
Total 1266 85 446 28 261 64 41 43 45 9 176 68% 75.3% 65.9% 77.8% 65.1% 80.8% 69.6% 74.5% 78.2% 78.9% 50.0% 69.6% 81.0%
Total 209 17 67 7 40 13 14 13 12 1 20 5% 12.4% 13.2% 11.7% 16.3% 12.4% 14.1% 25.5% 23.6% 21.1% 5.6% 7.9% 6.0%
Total 152 9 52 1 31 8 7 4 2 1 27 10% 9.0% 7.0% 9.1% 2.3% 9.6% 8.7% 12.7% 7.3% 3.5% 5.6% 10.7% 11.9%
Total 171 12 40 6 23 13 9 11 4 5 40 8% 10.2% 9.3% 7.0% 14.0% 7.1% 14.1% 16.4% 20.0% 7.0% 27.8% 15.8% 9.5%
Total 53 5 15 1 9 5 0 1 2 0 11 4% 3.2% 3.9% 2.6% 2.3% 2.8% 5.4% 0.0% 1.8% 3.5% 0.0% 4.3% 4.8%
Defined contribution pension/Company money purchase scheme
Total
TotalRegion
401k savings plan (US)
Central Providence Fund (Singapore)
Defined benefit pension/Company final salary scheme
Other
Non-contributory pension
None
Medical and dental insurance
Car or car allowance
Company share scheme
Life insurance
Loans
IChemE membership fees
Other professional membership fees
Childcare
None
44

Section C Classified by region
SECTION C / TABLE 4 : SALARY OR SELF EMPLOYED EARNINGS BY GRADE AND SEX
North East South East East of England North West South West East MidlandsWest
Midlands WalesNorthern Ireland Scotland
Yorkshire and the Humber
Total 933 68 330 22 187 47 28 27 35 7 140 42Mean 88,406 68,845 100,875 73,157 77,887 70,373 76,083 68,323 95,806 60,277 95,900 91,768Median 73,000 65,500 86,863 58,550 68,174 60,000 72,000 56,000 62,737 66,000 81,500 71,5001st Decile 45,000 44,093 50,000 46,000 42,400 40,000 49,000 32,000 42,000 33,000 44,750 36,0579th Decile 135,000 100,000 150,000 120,000 110,000 92,000 120,000 130,000 139,000 82,000 150,000 125,000Total 749 61 243 21 136 45 27 28 22 11 113 42Mean 48,503 48,686 52,585 44,320 44,661 40,433 40,944 43,236 66,482 42,227 51,139 41,305Median 40,000 39,000 43,000 32,930 38,100 37,000 36,900 39,875 45,250 44,000 45,000 37,9501st Decile 28,000 29,000 29,500 29,000 27,592 28,500 25,000 26,000 28,000 20,000 29,000 26,0009th Decile 79,200 70,000 85,000 75,000 66,000 62,000 67,500 78,000 133,000 55,000 96,000 65,000Total 1,376 109 470 31 271 73 45 41 50 15 200 71Mean 75,024 61,313 85,510 67,202 67,579 58,868 62,144 62,534 85,814 52,962 81,285 69,910Median 60,186 60,000 72,000 55,550 60,000 49,600 58,000 54,000 57,500 53,500 65,000 50,0001st Decile 32,400 32,400 34,125 32,000 32,000 30,000 28,000 36,000 34,050 25,000 32,080 30,5009th Decile 125,000 93,000 137,500 120,000 103,490 87,000 100,000 105,000 136,000 82,000 139,394 106,236Total 306 20 103 12 52 19 10 14 7 3 53 13Mean 50,908 48,410 57,061 38,075 44,708 43,663 43,935 35,101 75,014 30,667 55,620 48,111Median 45,000 43,047 50,930 34,300 41,271 38,250 40,550 31,000 48,000 33,000 50,000 36,0001st Decile 28,000 30,500 30,000 30,000 26,000 27,000 26,500 26,000 21,000 20,000 31,500 27,0009th Decile 80,000 70,140 90,000 44,000 66,000 69,454 74,925 45,283 240,000 39,000 86,000 90,174
Female
TotalRegion
Chartered Members
Non-Chartered Members
Male
45

Section C Classified by region
SECTION C / TABLE 5 : SALARY OR SELF EMPLOYED EARNINGS BY LEVEL OF RESPONSIBILITY - HIGHEST QUALIFICATION
North East South East East of England North West South West East MidlandsWest
Midlands WalesNorthern Ireland Scotland
Yorkshire and the Humber
Total 167 21 59 2 32 5 10 5 5 5 16 7Mean 72,034 71,169 79,226 83,000 71,483 76,000 61,050 50,400 50,320 65,800 79,956 43,568Median 61,000 62,000 67,340 83,000 60,500 82,000 58,250 31,000 48,000 66,000 69,000 43,0001st Decile 38,000 53,000 32,000 39,000 39,700 41,000 33,000 30,000 34,000 39,000 34,500 33,2109th Decile 120,000 85,000 120,000 127,000 114,780 92,000 95,000 120,000 65,000 88,500 141,575 55,000Total 895 68 316 23 161 56 25 26 25 8 138 49Mean 60,973 51,221 71,012 38,980 55,994 42,100 48,692 48,947 61,248 38,250 64,175 65,215Median 47,500 42,500 55,000 36,600 42,500 40,000 39,100 43,570 50,500 41,500 50,230 39,1501st Decile 29,350 31,000 32,000 29,000 28,500 29,000 26,000 26,000 28,608 19,000 30,000 26,0009th Decile 109,000 80,000 121,000 55,550 85,500 61,000 78,000 63,000 97,000 55,000 122,000 100,000Total 609 40 197 18 128 31 20 24 25 4 96 26Mean 84,272 66,844 95,446 82,091 72,376 77,078 70,401 63,780 116,921 56,609 89,888 76,800Median 71,000 63,000 83,000 73,500 67,895 62,000 64,782 55,000 70,000 56,719 73,750 71,5001st Decile 37,000 29,765 40,500 32,930 38,400 41,000 36,750 32,000 42,000 33,000 35,000 36,0579th Decile 130,000 104,000 145,000 144,000 105,000 105,000 107,300 105,000 240,000 80,000 138,787 125,000Total 11 0 1 0 2 0 0 0 2 1 3 2Mean 80,807 150,000 36,000 55,000 25,000 146,693 45,900Median 55,000 150,000 36,000 55,000 25,000 160,000 45,9001st Decile 25,000 150,000 17,000 54,000 25,000 70,080 45,8009th Decile 160,000 150,000 55,000 56,000 25,000 210,000 46,000
Non-grad
TotalRegion
Doctorate
Masters
Bachelors
46

Section C Classified by region
SECTION C / TABLE 6 : SALARY OR SELF EMPLOYED EARNINGS BY LEVEL OF RESPONSIBILITY - CHARTERED MEMBERS OR FELLOWS
North East South East East of England North West South West East MidlandsWest
Midlands WalesNorthern Ireland Scotland
Yorkshire and the Humber
Total23 0 11 0 6 1 0 1 0 0 1 3
Mean 208,870 198,000 151,170 369,000 210,000 705,000 145,000Median 145,000 145,000 92,500 369,000 210,000 705,000 150,0001st Decile 80,000 101,000 80,000 369,000 210,000 705,000 125,0009th Decile 447,241 319,000 447,241 369,000 210,000 705,000 160,000Total 138 9 49 4 31 4 9 3 0 2 23 4Mean 121,106 91,389 133,556 111,638 127,612 115,000 89,601 121,667 74,000 122,957 84,000Median 105,750 90,000 115,000 123,500 105,000 97,500 80,000 130,000 74,000 120,000 78,0001st Decile 67,500 76,000 70,000 55,550 69,000 70,000 67,563 70,000 66,000 58,500 55,0009th Decile 192,000 105,500 240,000 144,000 187,000 195,000 123,248 165,000 82,000 200,000 125,000Total 366 26 133 11 73 16 10 11 19 1 54 12Mean 90,742 73,124 105,349 71,137 70,191 66,075 64,481 57,820 120,480 80,000 95,522 127,261Median 75,000 70,000 90,000 59,000 68,950 63,000 60,980 55,000 62,737 80,000 90,500 74,0001st Decile 50,000 50,000 57,000 50,000 48,000 38,250 50,500 40,000 42,000 80,000 57,000 42,0009th Decile 129,794 93,000 155,000 98,600 89,500 87,000 80,425 72,000 306,000 80,000 138,000 104,920Total 265 23 92 7 49 15 5 9 12 2 36 15Mean 67,543 58,215 74,661 54,341 61,631 49,253 58,600 54,634 61,592 61,469 79,078 70,564Median 60,900 58,000 66,450 54,000 57,000 49,600 58,500 56,000 63,000 61,469 67,602 70,0001st Decile 44,000 44,093 45,000 36,600 44,000 37,500 45,000 32,000 39,000 53,500 45,000 36,0579th Decile 106,000 71,000 110,000 72,000 83,000 73,000 70,000 65,000 80,000 69,437 129,044 106,236Total 67 3 19 0 12 7 1 1 2 2 15 5Mean 52,157 49,667 57,117 45,810 56,358 39,100 29,000 52,498 35,500 56,520 44,835Median 46,500 42,000 55,000 40,400 46,200 39,100 29,000 52,498 35,500 54,000 38,0001st Decile 36,000 42,000 44,049 31,086 41,067 39,100 29,000 44,395 33,000 40,000 35,0009th Decile 77,175 65,000 85,000 63,000 89,000 39,100 29,000 60,600 38,000 80,000 77,175Total 0 0 0 0 0 0 0 0 0 0 0 0MeanMedian1st Decile9th DecileTotal 1 1 0 0 0 0 0 0 0 0 0 0Mean 20,000 20,000Median 20,000 20,0001st Decile 20,000 20,0009th Decile 20,000 20,000Total 60 3 21 0 15 4 2 1 1 0 10 3Mean 86,524 80,667 100,571 63,314 72,000 91,000 50,000 140,000 95,425 91,167Median 78,995 82,000 84,000 61,000 78,000 91,000 50,000 140,000 99,250 99,0001st Decile 26,866 60,000 42,000 25,000 40,000 62,000 50,000 140,000 18,375 44,5009th Decile 137,500 100,000 135,000 100,000 92,000 120,000 50,000 140,000 170,000 130,000Total 13 3 5 0 1 0 1 1 1 0 1 0Mean 88,415 69,267 97,800 58,600 165,000 63,000 80,000 86,000Median 80,000 66,000 90,000 58,600 165,000 63,000 80,000 86,0001st Decile 58,600 61,800 57,000 58,600 165,000 63,000 80,000 86,0009th Decile 130,000 80,000 130,000 58,600 165,000 63,000 80,000 86,000
Senior engineer/Senior lecturer
TotalRegion
Chairman/Managing director/Chief executive/Vice chancellor/Vice president
Senior manager/Director/Dean/Head of department
Manager/Site Manager/Project Manager/Associate professor/Professor/Principal engineer
Engineer/Supervised team member/Lecturer
Engineering technician
Graduate in training/Engineer in training/Postdoctoral
Consultant
Other
47
Senior manager/Director/Dean/Head of department
Manager/Site Manager/Project Manager/Associate professor/Professor/Principal engineer

Section C Classified by region
SECTION C / TABLE 7 : SALARY OR SELF EMPLOYED EARNINGS BY LEVEL OF RESPONSIBILITY - ASSOCIATES
North East South East East of England North West South West East MidlandsWest
Midlands WalesNorthern Ireland Scotland
Yorkshire and the Humber
Total 5 1 1 1 0 0 0 0 1 0 0 1Mean 145,000 120,000 110,000 190,000 240,000 65,000Median 120,000 120,000 110,000 190,000 240,000 65,0001st Decile 65,000 120,000 110,000 190,000 240,000 65,0009th Decile 240,000 120,000 110,000 190,000 240,000 65,000Total 36 5 14 0 6 1 2 1 3 0 4 0Mean 111,457 107,000 120,000 101,542 80,700 75,500 105,000 139,667 108,127Median 88,000 80,000 82,500 66,250 80,700 75,500 105,000 133,000 100,0041st Decile 58,000 70,000 58,000 46,750 80,700 56,000 105,000 86,000 72,5009th Decile 200,000 173,000 275,000 250,000 80,700 95,000 105,000 200,000 160,000Total 109 10 45 2 15 4 3 4 4 2 13 7Mean 63,125 57,343 66,517 59,250 66,982 55,675 68,500 56,625 41,750 55,000 67,038 55,357Median 56,000 60,000 55,000 59,250 63,500 57,350 67,500 53,250 46,000 55,000 59,000 46,0001st Decile 38,500 38,750 40,000 38,500 37,500 32,000 38,000 42,000 21,000 55,000 49,000 38,0009th Decile 86,000 69,964 110,000 80,000 85,000 76,000 100,000 78,000 54,000 55,000 96,000 85,000Total 90 6 33 2 15 5 4 4 2 3 10 6Mean 52,507 52,167 55,696 57,000 50,867 44,920 38,475 43,840 50,250 44,667 61,139 49,650Median 48,501 54,000 51,465 57,000 47,000 42,000 36,950 43,681 50,250 45,000 50,895 50,0001st Decile 37,450 39,000 41,220 39,000 37,000 41,000 35,000 36,000 46,500 44,000 39,000 37,9009th Decile 74,000 58,000 83,000 75,000 68,190 50,100 45,000 52,000 54,000 45,000 112,000 60,000Total 258 24 83 10 53 18 6 10 6 2 33 13Mean 39,842 39,957 40,748 33,880 38,141 37,394 36,750 32,800 35,685 19,500 49,506 36,108Median 37,563 39,000 38,000 32,000 37,625 36,400 35,750 30,750 35,000 19,500 49,200 37,5001st Decile 29,000 33,000 32,000 27,000 31,000 29,350 25,000 27,000 28,608 19,000 30,000 30,0009th Decile 51,000 52,000 50,000 43,000 48,000 45,000 49,000 40,500 43,000 20,000 63,550 41,000Total 8 0 2 2 1 0 0 1 0 0 2 0Mean 39,610 35,800 31,465 32,100 40,750 54,750Median 33,965 35,800 31,465 32,100 40,750 54,7501st Decile 20,500 35,000 30,000 32,100 40,750 20,5009th Decile 89,000 36,600 32,930 32,100 40,750 89,000Total 157 12 42 1 32 9 4 4 3 1 40 9Mean 31,541 30,965 30,351 31,000 30,395 30,556 25,375 26,538 30,667 29,000 36,032 28,556Median 30,200 30,765 30,000 31,000 30,000 29,500 25,500 25,575 28,000 29,000 35,850 29,0001st Decile 25,000 27,000 25,000 31,000 24,500 26,000 24,500 22,000 20,000 29,000 27,000 10,0009th Decile 40,500 37,000 37,500 31,000 35,000 40,000 26,000 33,000 44,000 29,000 46,825 36,500Total 19 0 9 2 2 1 1 0 0 0 4 0Mean 56,592 63,167 23,249 66,708 33,500 28,500 66,210Median 40,000 40,000 23,249 66,708 33,500 28,500 63,5201st Decile 28,500 29,500 9,998 61,600 33,500 28,500 38,8009th Decile 99,000 131,500 36,500 71,815 33,500 28,500 99,000Total 9 1 1 0 1 1 0 0 1 1 1 2Mean 38,478 36,850 29,450 47,000 10,000 58,000 39,000 98,000 14,000Median 36,850 36,850 29,450 47,000 10,000 58,000 39,000 98,000 14,0001st Decile 10,000 36,850 29,450 47,000 10,000 58,000 39,000 98,000 14,0009th Decile 98,000 36,850 29,450 47,000 10,000 58,000 39,000 98,000 14,000
Senior engineer/Senior lecturer
TotalRegion
Chairman/Managing director/Chief executive/Vice chancellor/Vice president
Senior manager/Director/Dean/Head of department
Manager/Site Manager/Project Manager/Associate professor/Professor/Principal engineer
Engineer/Supervised team member/Lecturer
Engineering technician
Graduate in training/Engineer in training/Postdoctoral
Consultant
Other
48
Senior manager/Director/Dean/Head of department
Manager/Site Manager/Project Manager/Associate professor/Professor/Principal engineer

Section C Classified by region
SECTION C / TABLE 8A : MEDIAN SALARY OR SELF EMPLOYED EARNINGS BY INDUSTRY SECTOR
North East South East East of England North West South West East MidlandsWest
Midlands WalesNorthern Ireland Scotland
Yorkshire and the Humber
Total 32 15 7 0 3 0 4 0 2 0 1 0Mean 60,842 58,577 49,929 61,000 77,000 87,500 52,788Median 56,000 58,000 45,000 58,000 76,500 87,500 52,7881st Decile 35,000 33,000 33,500 37,000 35,000 55,000 52,7889th Decile 88,000 85,000 79,000 88,000 120,000 120,000 52,788Total 184 40 27 11 36 3 1 5 27 4 10 20Mean 65,578 53,587 71,404 70,583 66,286 74,900 28,000 49,140 98,464 62,125 53,735 44,473Median 55,000 53,000 57,000 72,000 68,750 65,700 28,000 53,923 64,000 66,750 51,000 37,9501st Decile 34,000 36,785 32,000 31,000 37,500 39,000 28,000 36,000 36,000 33,000 26,925 28,2809th Decile 96,000 75,000 140,000 115,836 108,000 120,000 28,000 56,000 133,000 82,000 84,000 70,000Total 153 7 57 3 37 8 7 1 2 1 24 6Mean 60,817 55,571 76,109 21,333 60,363 32,700 47,771 40,750 49,500 19,000 54,967 34,417Median 51,000 42,000 69,000 25,000 48,000 33,000 37,000 40,750 49,500 19,000 54,038 30,7501st Decile 28,500 33,000 32,000 9,998 28,000 10,000 28,000 40,750 45,000 19,000 29,000 10,0009th Decile 100,008 100,000 130,000 29,000 120,000 52,000 85,000 40,750 54,000 19,000 78,000 65,000Total 22 2 0 0 15 0 0 2 0 0 3 0Mean 51,602 29,000 60,416 30,500 36,667Median 42,500 29,000 56,400 30,500 32,0001st Decile 29,000 29,000 38,000 30,000 28,0009th Decile 80,000 29,000 120,000 31,000 50,000Total 107 9 61 0 21 1 2 2 0 0 11 0Mean 73,859 76,079 77,698 68,003 78,000 61,782 37,500 70,364Median 70,000 70,279 70,000 70,764 78,000 61,782 37,500 78,0001st Decile 32,800 58,000 32,500 38,000 78,000 56,000 33,000 30,0009th Decile 109,000 109,000 115,000 89,500 78,000 67,563 42,000 99,000Total 31 1 5 1 9 1 2 1 1 2 6 2Mean 65,259 53,000 87,000 32,930 54,678 87,000 95,000 120,000 48,000 66,250 56,620 46,384Median 55,000 53,000 65,000 32,930 48,000 87,000 95,000 120,000 48,000 66,250 49,810 46,3841st Decile 37,768 53,000 43,000 32,930 35,600 87,000 90,000 120,000 48,000 44,000 34,500 37,7689th Decile 103,000 53,000 150,000 32,930 99,000 87,000 100,000 120,000 48,000 88,500 103,000 55,000Total 14 0 12 0 1 0 0 1 0 0 0 0Mean 131,511 129,846 73,000 210,000Median 130,000 130,000 73,000 210,0001st Decile 80,000 83,000 73,000 210,0009th Decile 206,000 185,000 73,000 210,000Total 66 0 27 3 8 2 8 4 1 0 9 4Mean 64,709 56,661 85,000 104,093 48,500 68,919 69,125 21,000 52,817 58,000Median 55,000 49,500 69,000 63,000 48,500 63,000 42,750 21,000 53,800 57,0001st Decile 27,000 30,000 59,000 30,500 27,000 33,000 26,000 21,000 25,000 27,0009th Decile 105,000 105,000 127,000 447,241 70,000 123,248 165,000 21,000 90,000 91,000Total 18 1 3 0 5 2 1 3 0 0 2 1Mean 71,621 140,000 64,833 74,035 41,750 62,000 51,333 77,500 130,000Median 63,500 140,000 81,000 68,174 41,750 62,000 55,000 77,500 130,0001st Decile 29,500 140,000 29,500 21,000 33,500 62,000 44,000 55,000 130,0009th Decile 130,000 140,000 84,000 126,000 50,000 62,000 55,000 100,000 130,000
Consumer products
TotalRegion
Biochemical engineering
Chemical and allied products
Consultancy
Contracting
Education/ university
Finance, insurance and risk
Food and drink
Health, safety and environment
49

Section C Classified by region
SECTION C / TABLE 8B : MEDIAN SALARY OR SELF EMPLOYED EARNINGS BY INDUSTRY SECTOR Cont'd
North East South East East of England North West South West East MidlandsWest
Midlands WalesNorthern Ireland Scotland
Yorkshire and the Humber
Total 46 2 31 0 5 3 2 0 0 1 0 2Mean 62,193 38,750 65,705 64,600 39,000 50,250 29,000 88,500Median 57,500 38,750 69,000 60,000 40,000 50,250 29,000 88,5001st Decile 29,000 38,500 30,000 47,000 35,000 24,500 29,000 52,0009th Decile 110,000 39,000 110,000 80,000 42,000 76,000 29,000 125,000Total 10 1 0 1 0 0 0 0 5 0 0 3Mean 42,798 80,000 29,000 40,596 38,667Median 40,000 80,000 29,000 44,000 36,0001st Decile 22,500 80,000 29,000 20,000 25,0009th Decile 69,490 80,000 29,000 58,980 55,000Total 14 1 5 1 2 2 2 0 1 0 0 0Mean 77,255 60,000 104,904 64,000 38,276 70,500 82,500 50,500Median 78,363 60,000 104,000 64,000 38,276 70,500 82,500 50,5001st Decile 48,552 60,000 86,726 64,000 28,000 52,000 70,000 50,5009th Decile 104,000 60,000 129,794 64,000 48,552 89,000 95,000 50,500Total 313 5 132 5 15 13 0 1 2 0 133 7Mean 94,085 65,000 104,538 53,900 101,818 77,814 52,000 201,500 85,587 96,886Median 75,000 60,000 85,000 36,500 71,815 52,000 52,000 201,500 76,000 95,0001st Decile 35,005 36,000 36,500 32,000 32,960 34,000 52,000 97,000 35,000 44,5009th Decile 160,000 109,000 180,000 93,000 111,000 80,000 52,000 306,000 150,000 160,000Total 99 1 46 0 19 2 1 0 8 0 14 8Mean 81,047 62,000 91,881 68,055 61,250 75,850 91,375 64,801 75,689Median 75,000 62,000 89,500 57,000 61,250 75,850 69,000 60,750 73,5881st Decile 36,000 62,000 34,500 35,000 40,500 75,850 43,000 36,005 38,9309th Decile 125,000 62,000 129,000 92,336 82,000 75,850 200,000 92,000 106,236Total 1 0 0 0 1 0 0 0 0 0 0 0Mean 64,000 64,000Median 64,000 64,0001st Decile 64,000 64,0009th Decile 64,000 64,000Total 78 19 28 0 6 5 0 2 0 0 10 8Mean 76,293 61,134 67,854 111,500 55,420 60,681 47,352 168,553Median 61,000 65,000 60,100 111,000 60,000 60,681 41,885 92,0001st Decile 35,000 36,850 32,550 39,000 34,000 43,361 32,500 36,5009th Decile 128,000 90,000 130,000 170,000 72,000 78,000 73,500 770,000Total 91 7 36 3 21 5 2 0 0 4 7 6Mean 61,083 70,714 73,264 97,000 52,035 33,400 45,000 38,250 50,643 46,300Median 47,000 66,000 51,000 55,000 41,795 34,000 45,000 41,500 57,500 48,0001st Decile 30,000 28,000 31,000 46,000 30,000 30,000 38,000 25,000 29,000 36,0009th Decile 88,000 146,000 90,000 190,000 88,000 36,000 52,000 45,000 65,000 50,000
Region
Industrial gases
Iron, steel and other metals
Mining and minerals
Oil and gas exploration and production
Oil refining
Paper and packaging
Petrochemicals
Pharmaceuticals and personal care products
Total
50

Section C Classified by region
SECTION C / TABLE 8C : MEDIAN SALARY OR SELF EMPLOYED EARNINGS BY INDUSTRY SECTOR Cont'd
North East South East East of England North West South West East MidlandsWest
Midlands WalesNorthern Ireland Scotland
Yorkshire and the Humber
Total 14 0 1 1 7 2 0 0 0 0 1 2Mean 130,689 34,000 144,000 104,499 47,000 705,000 60,575Median 68,000 34,000 144,000 103,490 47,000 705,000 60,5751st Decile 34,000 34,000 144,000 30,000 40,000 705,000 39,1509th Decile 202,000 34,000 144,000 202,000 54,000 705,000 82,000Total 21 1 4 0 1 1 5 2 1 1 3 2Mean 57,475 31,000 71,032 77,300 10,000 58,612 32,000 140,000 69,437 55,333 36,029Median 58,000 31,000 74,500 77,300 10,000 59,960 32,000 140,000 69,437 58,000 36,0291st Decile 26,000 31,000 38,126 77,300 10,000 26,000 28,000 140,000 69,437 42,000 36,0009th Decile 97,000 31,000 97,000 77,300 10,000 119,600 36,000 140,000 69,437 66,000 36,057Total 57 0 2 0 45 7 0 0 0 0 3 0Mean 58,448 53,000 55,733 72,367 70,333Median 54,000 53,000 54,000 43,000 72,5001st Decile 34,000 45,000 33,000 36,800 50,5009th Decile 80,700 61,000 76,500 195,000 88,000Total 37 1 7 2 17 8 2 0 0 0 0 0Mean 49,521 52,000 38,442 36,400 55,813 49,944 45,000Median 45,000 52,000 37,000 36,400 46,000 49,300 45,0001st Decile 30,000 52,000 30,000 30,800 30,000 29,500 28,0009th Decile 79,200 52,000 46,000 42,000 100,000 69,454 62,000Total 17 2 6 0 2 1 0 2 0 1 2 1Mean 58,691 76,500 51,025 60,050 37,500 65,000 66,000 77,500 30,000Median 58,000 76,500 40,000 60,050 37,500 65,000 66,000 77,500 30,0001st Decile 30,000 60,000 37,000 58,500 37,500 58,000 66,000 28,000 30,0009th Decile 95,000 93,000 95,000 61,600 37,500 72,000 66,000 127,000 30,000Total 49 4 12 2 7 11 3 7 1 0 1 1Mean 56,903 31,032 85,000 33,300 37,357 57,955 39,333 51,500 39,000 123,000 38,000Median 45,000 34,765 61,500 33,300 34,500 55,000 46,000 50,000 39,000 123,000 38,0001st Decile 27,000 14,600 40,500 30,000 18,000 32,000 25,000 29,000 39,000 123,000 38,0009th Decile 105,000 40,000 110,000 36,600 69,000 90,000 47,000 105,000 39,000 123,000 38,000Total 26 2 11 1 4 1 2 0 2 0 3 0Mean 52,195 69,000 59,360 57,585 36,281 46,700 41,000 34,100 55,500Median 45,555 69,000 48,000 57,585 33,543 46,700 41,000 34,100 49,5001st Decile 31,086 48,000 41,000 57,585 31,036 46,700 40,000 34,100 31,0009th Decile 90,000 90,000 94,500 57,585 47,000 46,700 42,000 34,100 86,000Total 17 2 4 1 4 1 1 3 1 0 0 0Mean 54,658 29,000 51,625 38,500 75,048 75,000 58,000 50,333 42,000Median 59,000 29,000 54,250 38,500 71,595 75,000 58,000 59,000 42,0001st Decile 22,000 29,000 20,000 38,500 62,000 75,000 58,000 22,000 42,0009th Decile 78,000 29,000 78,000 38,500 95,000 75,000 58,000 70,000 42,000Total 78 1 14 8 17 8 5 14 3 1 4 3Mean 50,706 120,000 53,770 47,356 47,770 40,313 47,920 49,889 45,869 20,000 84,500 45,070Median 45,100 120,000 55,000 49,500 42,400 41,500 45,000 44,010 53,000 20,000 75,500 42,0001st Decile 28,500 120,000 29,000 32,000 26,500 28,500 30,300 26,000 28,608 20,000 67,000 33,2109th Decile 80,000 120,000 85,000 58,100 65,300 56,000 80,000 65,000 56,000 20,000 120,000 60,000Total 87 5 35 0 15 5 5 5 0 3 6 8Mean 61,917 73,451 63,949 52,233 65,937 65,300 59,014 49,667 76,430 54,875Median 55,000 68,000 52,000 55,000 71,240 49,000 62,000 55,000 72,540 40,0001st Decile 28,000 27,000 32,000 24,320 32,445 25,000 42,000 39,000 20,500 14,0009th Decile 109,000 173,000 109,000 80,000 92,000 165,000 84,292 55,000 145,000 125,000
Other
TotalRegion
Plastics
Power generation and fossil fuels
Power generation and nuclear decommissioning
Power generation and nuclear generation
Power generation and renewables
Process plant and equipment
Public sector
Waste management
Water
51
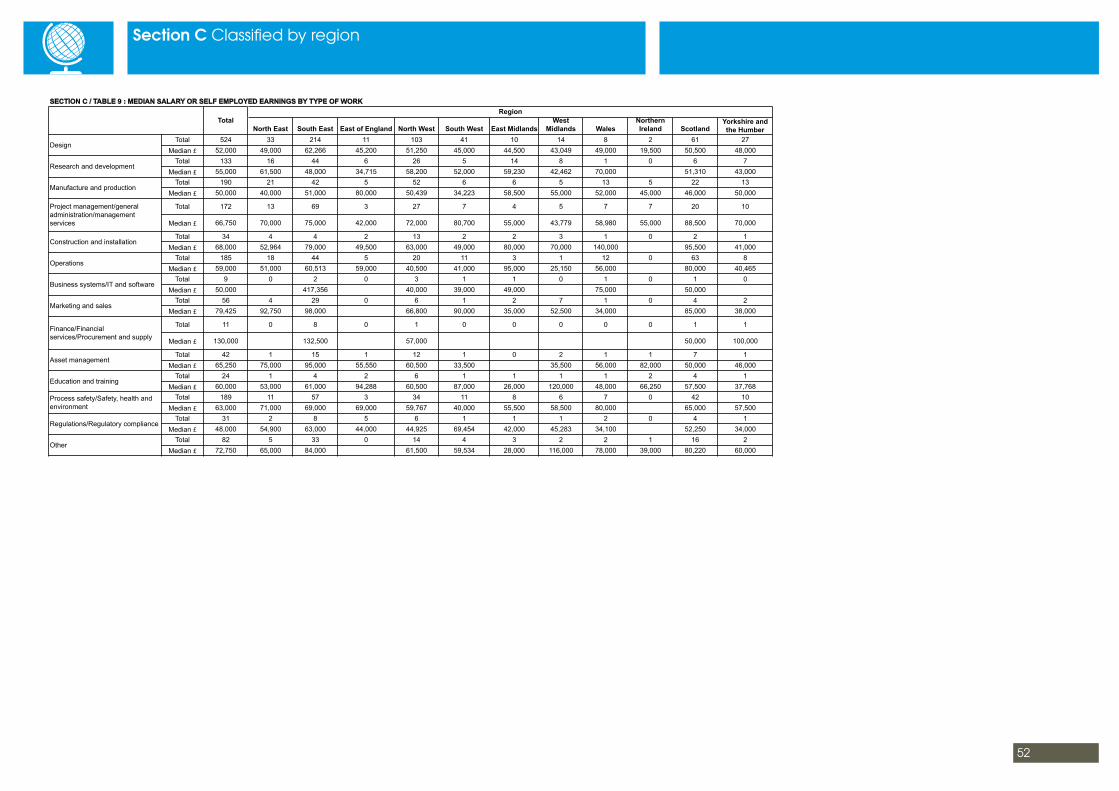
Section C Classified by region
SECTION C / TABLE 9 : MEDIAN SALARY OR SELF EMPLOYED EARNINGS BY TYPE OF WORK
North East South East East of England North West South West East MidlandsWest
Midlands WalesNorthern Ireland Scotland
Yorkshire and the Humber
Total 524 33 214 11 103 41 10 14 8 2 61 27Median £ 52,000 49,000 62,266 45,200 51,250 45,000 44,500 43,049 49,000 19,500 50,500 48,000
Total 133 16 44 6 26 5 14 8 1 0 6 7Median £ 55,000 61,500 48,000 34,715 58,200 52,000 59,230 42,462 70,000 51,310 43,000
Total 190 21 42 5 52 6 6 5 13 5 22 13Median £ 50,000 40,000 51,000 80,000 50,439 34,223 58,500 55,000 52,000 45,000 46,000 50,000
Total 172 13 69 3 27 7 4 5 7 7 20 10
Median £ 66,750 70,000 75,000 42,000 72,000 80,700 55,000 43,779 58,980 55,000 88,500 70,000
Total 34 4 4 2 13 2 2 3 1 0 2 1Median £ 68,000 52,964 79,000 49,500 63,000 49,000 80,000 70,000 140,000 95,500 41,000
Total 185 18 44 5 20 11 3 1 12 0 63 8Median £ 59,000 51,000 60,513 59,000 40,500 41,000 95,000 25,150 56,000 80,000 40,465
Total 9 0 2 0 3 1 1 0 1 0 1 0Median £ 50,000 417,356 40,000 39,000 49,000 75,000 50,000
Total 56 4 29 0 6 1 2 7 1 0 4 2Median £ 79,425 92,750 98,000 66,800 90,000 35,000 52,500 34,000 85,000 38,000
Total 11 0 8 0 1 0 0 0 0 0 1 1
Median £ 130,000 132,500 57,000 50,000 100,000
Total 42 1 15 1 12 1 0 2 1 1 7 1Median £ 65,250 75,000 95,000 55,550 60,500 33,500 35,500 56,000 82,000 50,000 46,000
Total 24 1 4 2 6 1 1 1 1 2 4 1Median £ 60,000 53,000 61,000 94,288 60,500 87,000 26,000 120,000 48,000 66,250 57,500 37,768
Total 189 11 57 3 34 11 8 6 7 0 42 10Median £ 63,000 71,000 69,000 69,000 59,767 40,000 55,500 58,500 80,000 65,000 57,500
Total 31 2 8 5 6 1 1 1 2 0 4 1Median £ 48,000 54,900 63,000 44,000 44,925 69,454 42,000 45,283 34,100 52,250 34,000
Total 82 5 33 0 14 4 3 2 2 1 16 2Median £ 72,750 65,000 84,000 61,500 59,534 28,000 116,000 78,000 39,000 80,220 60,000
Project management/general administration/management services
TotalRegion
Design
Research and development
Manufacture and production
Education and training
Process safety/Safety, health and environment
Regulations/Regulatory compliance
Other
Construction and installation
Operations
Business systems/IT and software
Marketing and sales
Finance/Financial services/Procurement and supply
Asset management
52

Section DClassified by industry sector
53

Section D Classified by industry sector
SECTION D / TABLE 1A : EMPLOYMENT STATUS
Biochem Chemical Consult Consumer ContractorEducation/ university
Finance and insurance Food drink
Health, safety and
envIndustrial
gases MetalsMining and
minerals Oil productionTotal 1682 32 184 153 22 107 31 14 66 18 46 10 14 313
% 100.0% 100.0% 100.0% 100.0% 100.0% 100.0% 100.0% 100.0% 100.0% 100.0% 100.0% 100.0% 100.0% 100.0%Total 1606 28 177 142 22 97 28 13 63 18 44 10 14 300
% 95.5% 87.5% 96.2% 92.8% 100.0% 90.7% 90.3% 92.9% 95.5% 100.0% 95.7% 100.0% 100.0% 96.2%Total 75 4 7 11 0 10 3 1 3 0 2 0 0 12
% 4.5% 12.5% 3.8% 7.2% 0.0% 9.3% 9.7% 7.1% 4.5% 0.0% 4.3% 0.0% 0.0% 3.8%
Full time
Part time
Industry Sector
Total
Total
54

Section D Classified by industry sector
SECTION D / TABLE 1B : EMPLOYMENT STATUS
Oil refining Paper Petrochem PharmaPlant and
equipment PlasticsPower - fossil
Power - Nuclear decomm
Power - Nuclear
generationPower -
renewablePublic sector Waste
management Water OtherTotal 1682 99 1 78 91 49 14 21 57 37 17 26 17 78 87
% 100.0% 100.0% 100.0% 100.0% 100.0% 100.0% 100.0% 100.0% 100.0% 100.0% 100.0% 100.0% 100.0% 100.0% 100.0%Total 1606 96 1 77 89 48 14 21 56 37 17 19 17 72 86
% 95.5% 97.0% 100.0% 98.7% 97.8% 98.0% 100.0% 100.0% 98.2% 100.0% 100.0% 73.1% 100.0% 92.3% 98.9%Total 75 3 0 1 2 1 0 0 1 0 0 7 0 6 1
% 4.5% 3.0% 0.0% 1.3% 2.2% 2.0% 0.0% 0.0% 1.8% 0.0% 0.0% 26.9% 0.0% 7.7% 1.1%Part time
Total
Industry Sector
Total
Full time
55

Section D Classified by industry sector
SECTION D / TABLE 2A : CURRENT ANNUAL SALARY OR SELF EMPLOYED EARNINGS
Biochem Chemical Consult Consumer ContractorEducation/ university
Finance and insurance Food drink
Health, safety and
envIndustrial
gases MetalsMining and
minerals Oil productionTotal 1682 32 184 153 22 107 31 14 66 18 46 10 14 313<£16K 10 0 1 3 0 1 0 0 0 0 0 0 0 2>=£16K 2 0 0 0 1 0 0 0 0 0 1 0 0 0>=£18K 3 0 1 1 0 0 0 0 0 0 0 0 0 0>=£19K 1 0 0 1 0 0 0 0 0 0 0 0 0 0>=£20K 6 0 1 1 0 0 0 0 0 0 0 1 0 0>=£21K 3 0 0 0 0 0 0 0 1 1 0 0 0 0>=£22K 5 0 0 2 0 0 0 0 0 0 0 0 0 2>=£23K 3 1 0 0 0 0 0 0 0 0 0 0 0 0>=£24K 5 0 2 0 0 0 0 0 0 0 1 0 0 1>=£25K 18 0 0 3 0 1 0 0 3 0 2 1 0 1>=£26K 11 0 0 2 0 0 0 0 1 0 0 0 0 1>=£27K 5 0 1 0 0 0 0 0 2 0 0 0 0 0>=£28K 30 0 5 6 1 0 0 0 1 0 0 1 1 2>=£29K 27 0 2 4 2 0 0 0 0 1 1 1 0 3>=£30K 33 0 0 6 1 4 0 0 4 0 1 0 0 0>=£31K 18 0 2 3 1 0 0 0 1 0 0 0 0 1>=£32K 35 0 2 2 1 6 1 0 0 0 0 0 0 5>=£33K 25 2 1 1 0 2 0 0 5 1 0 0 0 6>=£34K 24 0 1 0 0 0 1 0 0 0 0 0 0 4>=£35K 28 1 3 2 0 1 1 0 1 0 2 0 0 6>=£36K 39 0 10 2 0 0 0 0 0 0 0 1 0 8>=£37K 30 3 7 4 0 0 1 0 2 0 1 0 0 3>=£38K 28 0 1 5 1 2 0 0 0 0 2 0 0 2>=£39K 19 0 3 1 0 0 1 0 1 0 1 0 0 4>=£40K 138 1 15 12 4 5 6 0 1 1 3 1 0 17>=£45K 119 3 14 12 1 6 2 0 5 0 5 0 1 15>=£50K 107 3 15 11 1 5 1 0 3 1 2 1 2 21>=£55K 118 5 14 7 2 8 3 0 8 3 1 2 0 18>=£60K 95 3 13 5 2 6 3 0 4 1 2 0 2 13>=£65K 78 0 10 9 0 5 2 0 3 2 3 0 0 6>=£70K 79 1 15 8 0 11 0 1 6 0 2 0 1 13>=£75K 67 3 8 7 1 7 0 0 0 0 3 0 0 10>=£80K 60 1 8 4 1 7 0 2 1 2 5 1 0 9>=£85K 45 2 6 3 0 5 2 1 2 0 0 0 2 9>=£90K 51 0 3 7 0 2 1 1 4 1 1 0 0 9>=£95K 35 0 5 2 0 5 1 0 0 0 0 0 1 8>=£100K 30 0 0 3 0 4 2 0 0 1 2 0 3 7>=£105K 29 1 2 1 0 5 0 0 1 0 0 0 0 8>=£110K 23 0 2 0 0 2 0 0 0 0 2 0 0 8>=£115K 18 0 2 0 0 1 0 1 0 0 2 0 0 7
Total
Industry Sector
56

Section D Classified by industry sector
SECTION D / TABLE 2A : CURRENT ANNUAL SALARY OR SELF EMPLOYED EARNINGS Cont'd
Biochem Chemical Consult Consumer ContractorEducation/ university
Finance and insurance Food drink
Health, safety and
envIndustrial
gases MetalsMining and
minerals Oil production>=£120K 37 2 2 3 2 2 2 0 3 0 0 0 0 15>=£125K 20 0 1 1 0 0 0 1 1 1 1 0 1 7>=£130K 15 0 1 2 0 0 0 0 0 1 0 0 0 8>=£135K 12 0 0 0 0 0 0 1 0 0 0 0 0 8>=£140K 13 0 1 3 0 0 0 1 0 1 0 0 0 4>=£145K 7 0 0 0 0 0 0 0 0 0 0 0 0 3>=£150K 41 0 1 2 0 3 1 3 1 0 0 0 0 21>=£200K 17 0 1 2 0 0 0 2 0 0 0 0 0 8>=£250K 20 0 2 0 0 1 0 0 1 0 0 0 0 10Total 1682 32 184 153 22 107 31 14 66 18 46 10 14 313Mean 94,085 60,842 65,578 60,817 51,602 73,859 65,259 131,511 64,709 71,621 62,193 42,798 77,255 94,085Median 75,000 56,000 55,000 51,000 42,500 70,000 55,000 130,000 55,000 63,500 57,500 40,000 78,363 75,0001st Decile 35,005 35,000 34,000 28,500 29,000 32,800 37,768 80,000 27,000 29,500 29,000 22,500 48,552 35,0059th Decile 160,000 88,000 96,000 100,008 80,000 109,000 103,000 206,000 105,000 130,000 110,000 69,490 104,000 160,000
Total
Industry Sector
57

Section D Classified by industry sector
SECTION D / TABLE 2B : CURRENT ANNUAL SALARY OR SELF EMPLOYED EARNINGS
Oil refining Paper Petrochem PharmaPlant and
equipment Plastics Power - fossil
Power - Nuclear decomm
Power - Nuclear
generationPower -
renewablePublic sector
Waste management Water Other
Total 1682 99 1 78 91 49 14 21 57 37 17 26 17 78 87<£16K 10 0 0 0 0 1 0 1 0 0 0 0 0 0 1>=£16K 2 0 0 0 0 0 0 0 0 0 0 0 0 0 0>=£18K 3 0 0 0 0 1 0 0 0 0 0 0 0 0 0>=£19K 1 0 0 0 0 0 0 0 0 0 0 0 0 0 0>=£20K 6 0 0 0 0 0 0 0 0 0 0 0 1 1 1>=£21K 3 1 0 0 0 0 0 0 0 0 0 0 0 0 0>=£22K 5 0 0 0 0 0 0 0 0 0 0 0 1 0 0>=£23K 3 0 0 0 0 0 0 0 0 1 0 0 0 0 1>=£24K 5 0 0 0 0 0 0 0 0 0 0 0 0 0 1>=£25K 18 0 0 0 2 1 0 0 0 0 0 0 0 2 2>=£26K 11 0 0 0 0 1 0 2 0 0 0 0 0 4 0>=£27K 5 0 0 0 0 1 0 0 0 0 0 0 0 0 1>=£28K 30 0 0 0 2 0 0 1 2 1 1 0 0 3 3>=£29K 27 0 0 1 3 1 0 0 0 1 0 0 2 4 1>=£30K 33 2 0 2 3 2 1 0 0 3 1 0 0 3 0>=£31K 18 0 0 0 3 0 0 1 1 1 0 3 0 1 0>=£32K 35 1 0 2 5 3 0 0 1 1 0 0 0 1 4>=£33K 25 0 0 0 0 0 0 0 1 1 0 1 0 3 1>=£34K 24 3 0 1 2 2 1 0 3 1 0 2 0 1 2>=£35K 28 2 0 2 4 0 0 0 0 2 0 0 0 0 1>=£36K 39 2 0 5 3 2 0 3 2 0 0 1 0 0 0>=£37K 30 0 0 0 1 0 0 0 2 2 2 0 0 2 0>=£38K 28 3 0 1 3 1 0 1 1 1 0 0 1 0 3>=£39K 19 0 0 2 0 2 1 0 0 0 0 0 0 2 1>=£40K 138 7 0 11 6 6 1 1 8 2 3 6 2 10 9>=£45K 119 2 0 4 11 5 1 0 4 8 0 6 0 6 8>=£50K 107 5 0 2 11 3 2 0 5 1 1 0 0 8 3>=£55K 118 7 0 3 9 4 0 3 4 1 2 2 2 4 6>=£60K 95 4 1 7 3 1 0 1 5 2 2 1 1 5 8>=£65K 78 5 0 4 3 3 0 2 3 4 1 0 2 8 3>=£70K 79 5 0 5 0 0 0 0 5 0 1 0 1 1 3>=£75K 67 7 0 5 2 2 0 1 3 1 0 0 3 1 3>=£80K 60 7 0 1 4 0 1 0 2 0 0 0 0 2 2>=£85K 45 3 0 2 3 0 0 0 1 0 0 1 0 1 2>=£90K 51 6 0 4 3 1 0 1 1 0 1 2 0 0 3>=£95K 35 5 0 2 0 0 0 1 1 0 1 0 1 1 1>=£100K 30 1 0 2 0 0 1 0 0 2 0 0 0 0 2>=£105K 29 3 0 2 0 2 0 0 0 0 0 0 0 1 3>=£110K 23 5 0 0 0 2 1 0 0 1 0 0 0 0 0>=£115K 18 2 0 0 0 0 0 1 0 0 0 0 0 0 2
Total
Industry Sector
58

Section D Classified by industry sector
SECTION D / TABLE 2B : CURRENT ANNUAL SALARY OR SELF EMPLOYED EARNINGS Cont'd
Oil refining Paper Petrochem PharmaPlant and
equipment Plastics Power - fossil
Power - Nuclear decomm
Power - Nuclear
generationPower -
renewablePublic sector
Waste management Water Other
>=£120K 37 0 0 0 2 1 0 0 0 0 0 0 0 2 1>=£125K 20 3 0 1 0 0 0 0 0 0 1 0 0 0 1>=£130K 15 0 0 1 0 0 0 0 0 0 0 0 0 1 1>=£135K 12 1 0 1 0 0 0 0 0 0 0 1 0 0 0>=£140K 13 1 0 0 0 0 1 1 0 0 0 0 0 0 0>=£145K 7 0 0 1 1 0 0 0 1 0 0 0 0 0 1>=£150K 41 1 0 3 1 0 1 0 1 0 0 0 0 0 2>=£200K 17 3 0 0 0 0 1 0 0 0 0 0 0 0 0>=£250K 20 2 0 1 1 1 1 0 0 0 0 0 0 0 0Total 1682 99 1 78 91 49 14 21 57 37 17 26 17 78 87Mean 70,637 81,047 64,000 76,293 61,083 56,903 130,689 57,475 58,448 49,521 58,691 52,195 54,658 50,706 61,917Median 57,000 75,000 64,000 61,000 47,000 45,000 68,000 58,000 54,000 45,000 58,000 45,555 59,000 45,100 55,0001st Decile 31,000 36,000 64,000 35,000 30,000 27,000 34,000 26,000 34,000 30,000 30,000 31,086 22,000 28,500 28,0009th Decile 120,000 125,000 64,000 128,000 88,000 105,000 202,000 97,000 80,700 79,200 95,000 90,000 78,000 80,000 109,000
Total
Industry Sector
59

Section D Classified by industry sector
SECTION D / TABLE 3A : BENEFITS IN KIND FOR SALARIED EMPLOYEES
Biochem Chemical Consult Consumer ContractorEducation/ university
Finance and insurance Food drink
Health, safety and
envIndustrial
gases MetalsMining and
minerals Oil production1682 32 184 153 22 107 31 14 66 18 46 10 14 313
Total 4 0 1 0 0 0 0 0 0 0 0 0 0 0% 0.2% 0.0% 0.5% 0.0% 0.0% 0.0% 0.0% 0.0% 0.0% 0.0% 0.0% 0.0% 0.0% 0.0%
Total 2 0 0 0 0 0 0 0 0 0 0 0 0 2% 0.1% 0.0% 0.0% 0.0% 0.0% 0.0% 0.0% 0.0% 0.0% 0.0% 0.0% 0.0% 0.0% 0.6%
Total 499 8 42 16 8 11 24 1 19 7 21 5 0 101
% 29.7% 25.0% 22.8% 10.5% 36.4% 10.3% 77.4% 7.1% 28.8% 38.9% 45.7% 50.0% 0.0% 32.3%
Total 1013 19 130 112 13 89 7 12 45 9 22 3 9 167
% 60.2% 59.4% 70.7% 73.2% 59.1% 83.2% 22.6% 85.7% 68.2% 50.0% 47.8% 30.0% 64.3% 53.4%
Total 54 1 2 10 0 0 0 1 2 0 2 0 0 17% 3.2% 3.1% 1.1% 6.5% 0.0% 0.0% 0.0% 7.1% 3.0% 0.0% 4.3% 0.0% 0.0% 5.4%
Total 110 4 9 15 1 7 0 0 0 2 1 2 5 26% 6.5% 12.5% 4.9% 9.8% 4.5% 6.5% 0.0% 0.0% 0.0% 11.1% 2.2% 20.0% 35.7% 8.3%
Total 1007 21 114 89 14 67 0 11 49 9 29 3 5 226% 59.9% 65.6% 62.0% 58.2% 63.6% 62.6% 0.0% 78.6% 74.2% 50.0% 63.0% 30.0% 35.7% 72.2%
Total 505 7 45 37 6 39 0 10 35 6 19 3 5 90% 30.0% 21.9% 24.5% 24.2% 27.3% 36.4% 0.0% 71.4% 53.0% 33.3% 41.3% 30.0% 35.7% 28.8%
Total 493 1 50 36 15 26 0 4 12 2 13 0 1 135% 29.3% 3.1% 27.2% 23.5% 68.2% 24.3% 0.0% 28.6% 18.2% 11.1% 28.3% 0.0% 7.1% 43.1%
Total 619 10 69 58 8 31 1 10 23 6 17 3 6 148% 36.8% 31.3% 37.5% 37.9% 36.4% 29.0% 3.2% 71.4% 34.8% 33.3% 37.0% 30.0% 42.9% 47.3%
Total 64 0 1 8 2 8 1 2 2 0 2 0 0 15% 3.8% 0.0% 0.5% 5.2% 9.1% 7.5% 3.2% 14.3% 3.0% 0.0% 4.3% 0.0% 0.0% 4.8%
Total 1266 19 126 124 15 90 10 11 46 9 41 4 9 253% 75.3% 59.4% 68.5% 81.0% 68.2% 84.1% 32.3% 78.6% 69.7% 50.0% 89.1% 40.0% 64.3% 80.8%
Total 209 5 24 28 1 8 5 3 13 3 5 1 4 28% 12.4% 15.6% 13.0% 18.3% 4.5% 7.5% 16.1% 21.4% 19.7% 16.7% 10.9% 10.0% 28.6% 8.9%
Total 152 2 12 15 2 8 1 0 10 1 7 0 2 26% 9.0% 6.3% 6.5% 9.8% 9.1% 7.5% 3.2% 0.0% 15.2% 5.6% 15.2% 0.0% 14.3% 8.3%
Total 171 8 22 12 2 8 18 0 3 5 2 3 3 27% 10.2% 25.0% 12.0% 7.8% 9.1% 7.5% 58.1% 0.0% 4.5% 27.8% 4.3% 30.0% 21.4% 8.6%
Total 53 0 5 4 0 1 1 1 3 2 1 0 0 11% 3.2% 0.0% 2.7% 2.6% 0.0% .9% 3.2% 7.1% 4.5% 11.1% 2.2% 0.0% 0.0% 3.5%
Defined contribution pension/Company money purchase scheme
Total
Total
Industry Sector
401k savings plan (US)
Central Providence Fund (Singapore)
Defined benefit pension/Company final salary scheme
Other
Non-contributory pension
None
Medical and dental insurance
Car or car allowance
Company share scheme
Life insurance
Loans
IChemE membership fees
Other professional membership fees
Childcare
None
60

Section D Classified by industry sector
SECTION D / TABLE 3B : BENEFITS IN KIND FOR SALARIED EMPLOYEES
Oil refining Paper Petrochem PharmaPlant and
equipment PlasticsPower - fossil
Power - Nuclear decomm
Power - Nuclear
generationPower -
renewable Public sectorWaste
management Water Other1682 99 1 78 91 49 14 21 57 37 17 26 17 78 87
Total 4 0 0 0 1 0 0 0 0 0 1 0 0 0 1% 0.2% 0.0% 0.0% 0.0% 1.1% 0.0% 0.0% 0.0% 0.0% 0.0% 5.9% 0.0% 0.0% 0.0% 1.1%
Total 2 0 0 0 0 0 0 0 0 0 0 0 0 0 0% 0.1% 0.0% 0.0% 0.0% 0.0% 0.0% 0.0% 0.0% 0.0% 0.0% 0.0% 0.0% 0.0% 0.0% 0.0%
Total 499 49 0 35 21 7 1 11 23 14 4 20 5 22 24
% 29.7% 49.5% 0.0% 44.9% 23.1% 14.3% 7.1% 52.4% 40.4% 37.8% 23.5% 76.9% 29.4% 28.2% 27.6%
Total 1013 40 1 39 61 31 13 7 33 22 9 4 11 52 53
% 60.2% 40.4% 100.0% 50.0% 67.0% 63.3% 92.9% 33.3% 57.9% 59.5% 52.9% 15.4% 64.7% 66.7% 60.9%
Total 54 4 0 1 1 2 0 0 0 1 2 2 0 1 5% 3.2% 4.0% 0.0% 1.3% 1.1% 4.1% 0.0% 0.0% 0.0% 2.7% 11.8% 7.7% 0.0% 1.3% 5.7%
Total 110 6 0 3 7 9 0 3 1 0 1 0 1 3 4% 6.5% 6.1% 0.0% 3.8% 7.7% 18.4% 0.0% 14.3% 1.8% 0.0% 5.9% 0.0% 5.9% 3.8% 4.6%
Total 1007 77 1 47 71 25 12 11 21 7 10 4 7 32 45% 59.9% 77.8% 100.0% 60.3% 78.0% 51.0% 85.7% 52.4% 36.8% 18.9% 58.8% 15.4% 41.2% 41.0% 51.7%
Total 505 39 1 23 20 13 4 5 12 6 5 8 11 29 27% 30.0% 39.4% 100.0% 29.5% 22.0% 26.5% 28.6% 23.8% 21.1% 16.2% 29.4% 30.8% 64.7% 37.2% 31.0%
Total 493 41 0 34 43 7 8 5 10 5 5 2 3 16 19% 29.3% 41.4% 0.0% 43.6% 47.3% 14.3% 57.1% 23.8% 17.5% 13.5% 29.4% 7.7% 17.6% 20.5% 21.8%
Total 619 42 0 30 32 16 8 7 11 11 5 5 5 25 32% 36.8% 42.4% 0.0% 38.5% 35.2% 32.7% 57.1% 33.3% 19.3% 29.7% 29.4% 19.2% 29.4% 32.1% 36.8%
Total 64 1 0 5 1 0 0 1 2 2 0 0 0 4 7% 3.8% 1.0% 0.0% 6.4% 1.1% 0.0% 0.0% 4.8% 3.5% 5.4% 0.0% 0.0% 0.0% 5.1% 8.0%
Total 1266 78 1 54 71 29 13 17 52 35 14 18 13 58 56% 75.3% 78.8% 100.0% 69.2% 78.0% 59.2% 92.9% 81.0% 91.2% 94.6% 82.4% 69.2% 76.5% 74.4% 64.4%
Total 209 8 1 6 8 5 0 4 7 8 2 3 6 10 13% 12.4% 8.1% 100.0% 7.7% 8.8% 10.2% 0.0% 19.0% 12.3% 21.6% 11.8% 11.5% 35.3% 12.8% 14.9%
Total 152 7 0 7 12 2 2 1 3 6 1 5 1 12 7% 9.0% 7.1% 0.0% 9.0% 13.2% 4.1% 14.3% 4.8% 5.3% 16.2% 5.9% 19.2% 5.9% 15.4% 8.0%
Total 171 5 0 7 5 11 0 2 1 0 1 4 0 8 14% 10.2% 5.1% 0.0% 9.0% 5.5% 22.4% 0.0% 9.5% 1.8% 0.0% 5.9% 15.4% 0.0% 10.3% 16.1%
Total 53 3 0 2 6 0 0 1 0 3 0 1 1 5 2% 3.2% 3.0% 0.0% 2.6% 6.6% 0.0% 0.0% 4.8% 0.0% 8.1% 0.0% 3.8% 5.9% 6.4% 2.3%
Company share scheme
Total
Industry Sector
Total
401k savings plan (US)
Central Providence Fund (Singapore)
Defined benefit pension/Company final salary scheme
Defined contribution pension/Company money purchase scheme
Non-contributory pension
None
Medical and dental insurance
Car or car allowance
Other
Life insurance
Loans
IChemE membership fees
Other professional membership fees
Childcare
None
61
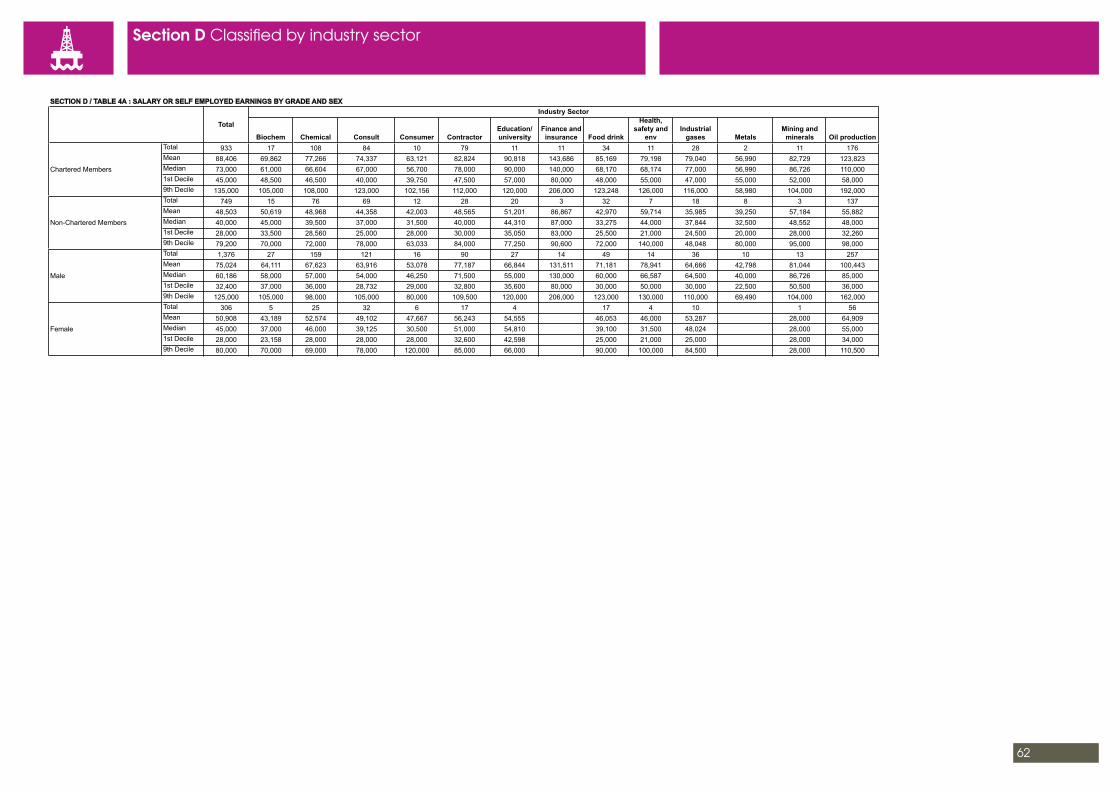
Section D Classified by industry sector
SECTION D / TABLE 4A : SALARY OR SELF EMPLOYED EARNINGS BY GRADE AND SEX
Biochem Chemical Consult Consumer ContractorEducation/ university
Finance and insurance Food drink
Health, safety and
envIndustrial
gases MetalsMining and
minerals Oil productionTotal 933 17 108 84 10 79 11 11 34 11 28 2 11 176Mean 88,406 69,862 77,266 74,337 63,121 82,824 90,818 143,686 85,169 79,198 79,040 56,990 82,729 123,823Median 73,000 61,000 66,604 67,000 56,700 78,000 90,000 140,000 68,170 68,174 77,000 56,990 86,726 110,0001st Decile 45,000 48,500 46,500 40,000 39,750 47,500 57,000 80,000 48,000 55,000 47,000 55,000 52,000 58,0009th Decile 135,000 105,000 108,000 123,000 102,156 112,000 120,000 206,000 123,248 126,000 116,000 58,980 104,000 192,000Total 749 15 76 69 12 28 20 3 32 7 18 8 3 137Mean 48,503 50,619 48,968 44,358 42,003 48,565 51,201 86,867 42,970 59,714 35,985 39,250 57,184 55,882Median 40,000 45,000 39,500 37,000 31,500 40,000 44,310 87,000 33,275 44,000 37,844 32,500 48,552 48,0001st Decile 28,000 33,500 28,560 25,000 28,000 30,000 35,050 83,000 25,500 21,000 24,500 20,000 28,000 32,2609th Decile 79,200 70,000 72,000 78,000 63,033 84,000 77,250 90,600 72,000 140,000 48,048 80,000 95,000 98,000Total 1,376 27 159 121 16 90 27 14 49 14 36 10 13 257Mean 75,024 64,111 67,623 63,916 53,078 77,187 66,844 131,511 71,181 78,941 64,666 42,798 81,044 100,443Median 60,186 58,000 57,000 54,000 46,250 71,500 55,000 130,000 60,000 66,587 64,500 40,000 86,726 85,0001st Decile 32,400 37,000 36,000 28,732 29,000 32,800 35,600 80,000 30,000 50,000 30,000 22,500 50,500 36,0009th Decile 125,000 105,000 98,000 105,000 80,000 109,500 120,000 206,000 123,000 130,000 110,000 69,490 104,000 162,000Total 306 5 25 32 6 17 4 17 4 10 1 56Mean 50,908 43,189 52,574 49,102 47,667 56,243 54,555 46,053 46,000 53,287 28,000 64,909Median 45,000 37,000 46,000 39,125 30,500 51,000 54,810 39,100 31,500 48,024 28,000 55,0001st Decile 28,000 23,158 28,000 28,000 28,000 32,600 42,598 25,000 21,000 25,000 28,000 34,0009th Decile 80,000 70,000 69,000 78,000 120,000 85,000 66,000 90,000 100,000 84,500 28,000 110,500
Female
Total
Industry Sector
Chartered Members
Non-Chartered Members
Male
62
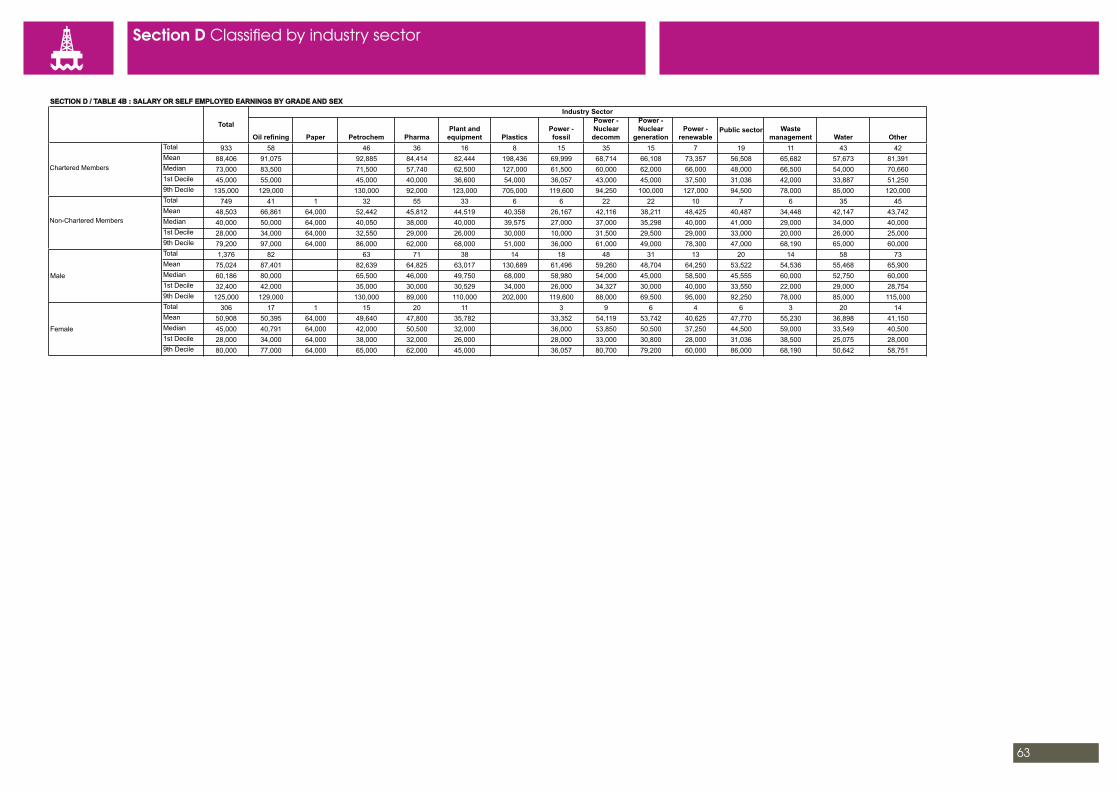
Section D Classified by industry sector
SECTION D / TABLE 4B : SALARY OR SELF EMPLOYED EARNINGS BY GRADE AND SEX
Oil refining Paper Petrochem PharmaPlant and
equipment PlasticsPower - fossil
Power - Nuclear decomm
Power - Nuclear
generationPower -
renewablePublic sector Waste
management Water OtherTotal 933 58 46 36 16 8 15 35 15 7 19 11 43 42Mean 88,406 91,075 92,885 84,414 82,444 198,436 69,999 68,714 66,108 73,357 56,508 65,682 57,673 81,391Median 73,000 83,500 71,500 57,740 62,500 127,000 61,500 60,000 62,000 66,000 48,000 66,500 54,000 70,6601st Decile 45,000 55,000 45,000 40,000 36,600 54,000 36,057 43,000 45,000 37,500 31,036 42,000 33,887 51,2509th Decile 135,000 129,000 130,000 92,000 123,000 705,000 119,600 94,250 100,000 127,000 94,500 78,000 85,000 120,000Total 749 41 1 32 55 33 6 6 22 22 10 7 6 35 45Mean 48,503 66,861 64,000 52,442 45,812 44,519 40,358 26,167 42,116 38,211 48,425 40,487 34,448 42,147 43,742Median 40,000 50,000 64,000 40,050 38,000 40,000 39,575 27,000 37,000 35,298 40,000 41,000 29,000 34,000 40,0001st Decile 28,000 34,000 64,000 32,550 29,000 26,000 30,000 10,000 31,500 29,500 29,000 33,000 20,000 26,000 25,0009th Decile 79,200 97,000 64,000 86,000 62,000 68,000 51,000 36,000 61,000 49,000 78,300 47,000 68,190 65,000 60,000Total 1,376 82 63 71 38 14 18 48 31 13 20 14 58 73Mean 75,024 87,401 82,639 64,825 63,017 130,689 61,496 59,260 48,704 64,250 53,522 54,536 55,468 65,900Median 60,186 80,000 65,500 46,000 49,750 68,000 58,980 54,000 45,000 58,500 45,555 60,000 52,750 60,0001st Decile 32,400 42,000 35,000 30,000 30,529 34,000 26,000 34,327 30,000 40,000 33,550 22,000 29,000 28,7549th Decile 125,000 129,000 130,000 89,000 110,000 202,000 119,600 88,000 69,500 95,000 92,250 78,000 85,000 115,000Total 306 17 1 15 20 11 3 9 6 4 6 3 20 14Mean 50,908 50,395 64,000 49,640 47,800 35,782 33,352 54,119 53,742 40,625 47,770 55,230 36,898 41,150Median 45,000 40,791 64,000 42,000 50,500 32,000 36,000 53,850 50,500 37,250 44,500 59,000 33,549 40,5001st Decile 28,000 34,000 64,000 38,000 32,000 26,000 28,000 33,000 30,800 28,000 31,036 38,500 25,075 28,0009th Decile 80,000 77,000 64,000 65,000 62,000 45,000 36,057 80,700 79,200 60,000 86,000 68,190 50,642 58,751
Female
Total
Industry Sector
Corporate Members
Non-Corporate Members
Male
Chartered Members
Non-Chartered Members
63

Section D Classified by industry sector
SECTION D / TABLE 5A : SALARY OR SELF EMPLOYED EARNINGS BY LEVEL OF RESPONSIBILITY - HIGHEST QUALIFICATION
Biochem Chemical Consult Consumer ContractorEducation/ university
Finance and insurance Food drink
Health, safety and
envIndustrial
gases MetalsMining and
minerals Oil productionTotal 167 12 16 6 3 2 29 2 9 2 5 1 4 16Mean 72,034 65,792 60,558 65,286 61,770 81,000 67,106 121,600 70,316 120,000 79,600 44,000 98,682 110,973Median 61,000 59,500 54,525 65,500 31,000 81,000 57,000 121,600 67,340 120,000 80,000 44,000 102,000 90,0001st Decile 38,000 54,500 34,000 39,700 30,000 42,000 37,768 87,000 28,000 100,000 52,000 44,000 86,726 50,0009th Decile 120,000 85,000 85,000 99,015 124,311 120,000 120,000 156,200 127,000 140,000 110,000 44,000 104,000 141,575Total 895 10 88 95 10 59 4 36 6 29 6 4 189Mean 60,973 48,816 48,769 55,754 46,750 64,135 107,150 51,275 61,029 54,207 39,000 54,013 81,759Median 47,500 37,250 44,244 44,000 40,750 61,000 85,300 38,050 52,500 45,173 28,500 49,526 58,0001st Decile 29,350 28,079 29,000 28,000 28,500 32,500 73,000 26,000 29,500 25,000 20,000 28,000 33,4809th Decile 109,000 99,000 72,000 99,750 88,500 101,000 185,000 90,000 130,000 100,000 80,000 89,000 145,500Total 609 10 78 51 8 46 2 8 21 10 12 3 6 106Mean 84,272 66,929 84,625 69,857 58,179 86,021 38,465 146,168 85,335 68,300 74,238 49,993 78,466 111,798Median 71,000 57,500 70,640 65,000 58,200 78,575 38,465 137,500 64,000 63,500 69,500 55,000 67,000 94,0001st Decile 37,000 41,750 37,900 29,000 32,000 48,300 32,930 83,000 48,500 32,500 52,000 36,000 52,000 44,5009th Decile 130,000 112,500 120,000 102,148 80,000 109,000 44,000 210,000 92,000 108,000 110,000 58,980 129,794 180,000Total 11 2 1 1 2Mean 80,807 102,500 54,000 17,000 185,000Median 55,000 102,500 54,000 17,000 185,0001st Decile 25,000 55,000 54,000 17,000 160,0009th Decile 160,000 150,000 54,000 17,000 210,000
Non-grad
Total
Industry Sector
Doctorate
Masters
Bachelors
64
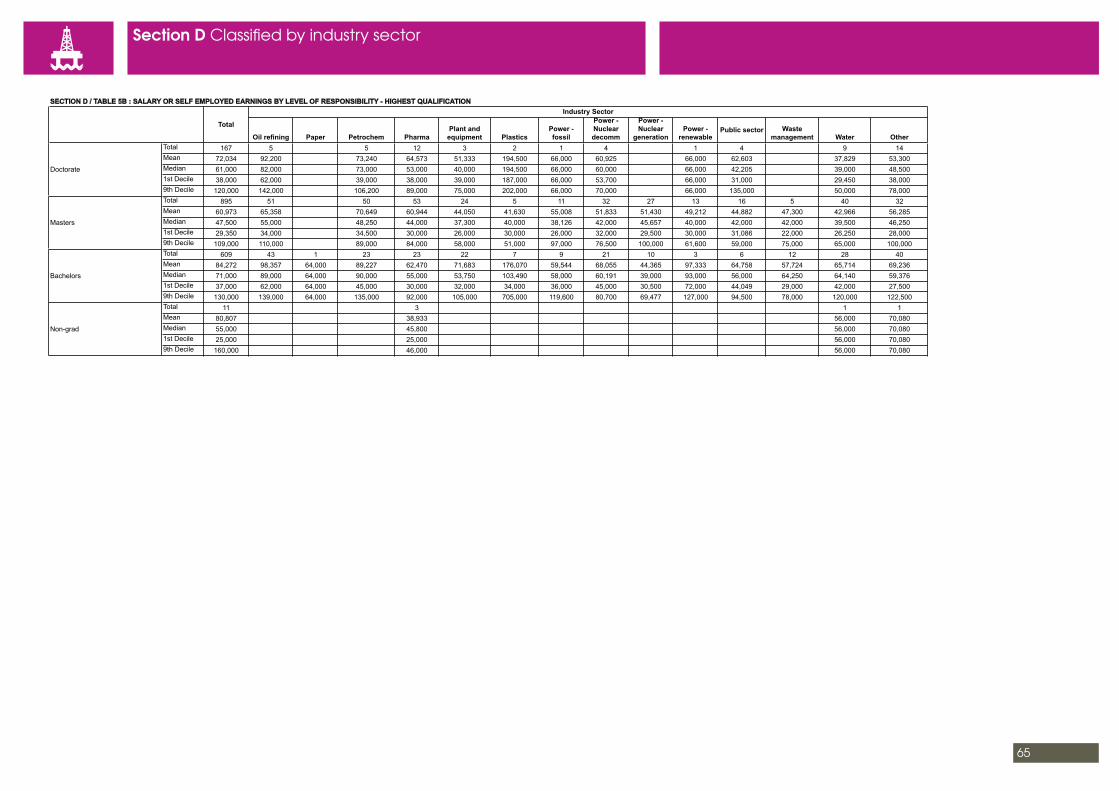
Section D Classified by industry sector
SECTION D / TABLE 5B : SALARY OR SELF EMPLOYED EARNINGS BY LEVEL OF RESPONSIBILITY - HIGHEST QUALIFICATION
Oil refining Paper Petrochem PharmaPlant and
equipment PlasticsPower - fossil
Power - Nuclear decomm
Power - Nuclear
generationPower -
renewablePublic sector Waste
management Water OtherTotal 167 5 5 12 3 2 1 4 1 4 9 14Mean 72,034 92,200 73,240 64,573 51,333 194,500 66,000 60,925 66,000 62,603 37,829 53,300Median 61,000 82,000 73,000 53,000 40,000 194,500 66,000 60,000 66,000 42,205 39,000 48,5001st Decile 38,000 62,000 39,000 38,000 39,000 187,000 66,000 53,700 66,000 31,000 29,450 38,0009th Decile 120,000 142,000 106,200 89,000 75,000 202,000 66,000 70,000 66,000 135,000 50,000 78,000Total 895 51 50 53 24 5 11 32 27 13 16 5 40 32Mean 60,973 65,358 70,649 60,944 44,050 41,630 55,008 51,833 51,430 49,212 44,882 47,300 42,966 56,285Median 47,500 55,000 48,250 44,000 37,300 40,000 38,126 42,000 45,657 40,000 42,000 42,000 39,500 46,2501st Decile 29,350 34,000 34,500 30,000 26,000 30,000 26,000 32,000 29,500 30,000 31,086 22,000 26,250 28,0009th Decile 109,000 110,000 89,000 84,000 58,000 51,000 97,000 76,500 100,000 61,600 59,000 75,000 65,000 100,000Total 609 43 1 23 23 22 7 9 21 10 3 6 12 28 40Mean 84,272 98,357 64,000 89,227 62,470 71,683 176,070 59,544 68,055 44,365 97,333 64,758 57,724 65,714 69,236Median 71,000 89,000 64,000 90,000 55,000 53,750 103,490 58,000 60,191 39,000 93,000 56,000 64,250 64,140 59,3761st Decile 37,000 62,000 64,000 45,000 30,000 32,000 34,000 36,000 45,000 30,500 72,000 44,049 29,000 42,000 27,5009th Decile 130,000 139,000 64,000 135,000 92,000 105,000 705,000 119,600 80,700 69,477 127,000 94,500 78,000 120,000 122,500Total 11 3 1 1Mean 80,807 38,933 56,000 70,080Median 55,000 45,800 56,000 70,0801st Decile 25,000 25,000 56,000 70,0809th Decile 160,000 46,000 56,000 70,080
Non-grad
Total
Industry Sector
Doctorate
Masters
Bachelors
65

Section D Classified by industry sector
SECTION D / TABLE 6A : SALARY OR SELF EMPLOYED EARNINGS BY LEVEL OF RESPONSIBILITY - CHARTERED MEMBERS OR FELLOWS
Biochem Chemical Consult Consumer ContractorEducation/ university
Finance and insurance Food drink
Health, safety and
envIndustrial
gases MetalsMining and
minerals Oil productionTotal 23 1 2 3 2 1 5Mean 208,870 114,780 144,000 87,000 208,000 447,241 275,800Median 145,000 114,780 144,000 80,000 208,000 447,241 160,0001st Decile 80,000 114,780 105,000 80,000 206,000 447,241 115,0009th Decile 447,241 114,780 183,000 101,000 210,000 447,241 585,000Total 138 5 11 9 2 10 3 1 9 2 6 1 23Mean 121,106 86,000 106,846 142,706 90,356 107,919 114,333 125,000 103,305 108,000 100,833 55,000 186,893Median 105,750 83,000 85,500 130,000 90,356 103,750 103,000 125,000 92,000 108,000 113,000 55,000 140,0001st Decile 67,500 78,000 68,000 67,600 56,400 68,782 90,000 125,000 58,500 90,000 60,000 55,000 94,0009th Decile 192,000 105,000 140,000 240,000 124,311 166,566 150,000 125,000 165,000 126,000 125,000 55,000 250,000Total 366 4 47 30 4 39 6 3 14 4 11 1 4 64Mean 90,742 69,750 90,595 79,656 44,375 93,206 91,833 165,400 70,153 62,250 73,541 58,980 74,074 125,897Median 75,000 68,000 75,000 73,750 44,750 79,942 93,000 156,200 65,670 55,000 70,000 58,980 58,000 120,0001st Decile 50,000 55,000 49,000 54,000 38,000 63,000 60,000 155,000 48,500 55,000 52,000 58,980 50,500 72,5009th Decile 129,794 88,000 115,836 112,574 50,000 115,000 120,000 185,000 90,000 84,000 100,000 58,980 129,794 180,000Total 265 7 40 16 4 21 1 4 8 1 8 5 49Mean 67,543 51,237 59,554 48,298 68,250 61,686 48,000 102,087 54,313 68,174 75,250 92,945 95,507Median 60,900 55,000 55,775 49,000 68,000 58,000 48,000 97,674 56,500 68,174 77,000 100,000 90,0001st Decile 44,000 23,158 46,500 39,700 57,000 45,000 48,000 73,000 31,000 68,174 55,000 70,000 55,0009th Decile 106,000 60,000 75,000 68,000 80,000 92,000 48,000 140,000 70,000 68,174 90,000 104,000 133,000Total 67 4 10 3 2 2 1 15Mean 52,157 43,249 52,020 42,500 51,050 43,587 89,000 66,330Median 46,500 39,698 51,700 42,000 51,050 43,587 89,000 72,0001st Decile 36,000 33,000 42,000 38,000 39,100 42,000 89,000 43,1509th Decile 77,175 60,600 65,500 47,500 63,000 45,173 89,000 85,000TotalMeanMedian1st Decile9th DecileTotal 1 1Mean 20,000 20,000Median 20,000 20,0001st Decile 20,000 20,0009th Decile 20,000 20,000Total 60 1 2 16 3 1 4 1 1 17Mean 86,524 120,000 39,875 58,171 48,333 135,000 84,500 110,000 60,000 122,118Median 78,995 120,000 39,875 58,000 42,000 135,000 73,000 110,000 60,000 110,0001st Decile 26,866 120,000 18,750 20,000 25,000 135,000 62,000 110,000 60,000 43,0009th Decile 137,500 120,000 61,000 92,000 78,000 135,000 130,000 110,000 60,000 170,000Total 13 2 1 1 3Mean 88,415 70,900 58,600 57,000 102,333Median 80,000 70,900 58,600 57,000 90,0001st Decile 58,600 61,800 58,600 57,000 87,0009th Decile 130,000 80,000 58,600 57,000 130,000
Senior engineer/Senior lecturer
Total
Industry Sector
Chairman/Managing director/Chief executive/Vice chancellor/Vice president
Senior manager/Director/Dean/Head of department
Manager/Site Manager/Project Manager/Associate professor/Professor/Principal engineer
Engineer/Supervised team member/Lecturer
Engineering technician
Graduate in training/Engineer in training/Postdoctoral
Consultant
Other
66
Senior manager/Director/Dean/Head of department
Manager/Site Manager/Project Manager/Associate professor/Professor/Principal engineer

Section D Classified by industry sector
SECTION D / TABLE 6B : SALARY OR SELF EMPLOYED EARNINGS BY LEVEL OF RESPONSIBILITY - CHARTERED MEMBERS OR FELLOWS
Oil refining Paper Petrochem PharmaPlant and
equipment PlasticsPower - fossil
Power - Nuclear decomm
Power - Nuclear
generationPower -
renewable Public sectorWaste
management Water OtherTotal 23 2 1 1 1 4Mean 208,870 146,000 145,000 319,000 705,000 109,250Median 145,000 146,000 145,000 319,000 705,000 113,5001st Decile 80,000 92,000 145,000 319,000 705,000 80,0009th Decile 447,241 200,000 145,000 319,000 705,000 130,000Total 138 8 7 2 3 3 1 6 1 1 5 2 8 9Mean 121,106 126,500 118,429 87,000 88,000 177,667 119,600 113,208 110,000 66,000 85,600 82,500 88,756 100,102Median 105,750 110,000 103,000 87,000 90,000 187,000 119,600 95,125 110,000 66,000 90,000 82,500 82,500 105,4201st Decile 67,500 85,000 76,000 85,000 69,000 144,000 119,600 70,000 110,000 66,000 49,500 70,000 55,550 50,0009th Decile 192,000 200,000 170,000 89,000 105,000 202,000 119,600 195,000 110,000 66,000 135,000 95,000 130,000 145,000Total 366 19 13 14 5 3 6 16 7 4 3 7 23 15Mean 90,742 92,700 133,998 122,328 82,900 98,497 74,877 62,918 63,003 88,000 43,033 62,929 52,740 67,667Median 75,000 82,000 78,850 71,440 65,000 103,490 71,650 60,096 65,000 82,500 34,100 62,000 53,000 62,0001st Decile 50,000 67,000 61,000 44,000 56,500 82,000 58,000 41,000 49,065 60,000 31,000 42,000 33,887 55,0009th Decile 129,794 129,000 106,200 146,000 123,000 110,000 97,000 80,000 69,500 127,000 64,000 78,000 65,000 86,000Total 265 18 19 10 5 1 7 10 3 2 8 2 8 8Mean 67,543 75,806 66,505 59,133 46,720 54,000 48,731 56,297 49,867 47,750 44,428 58,500 53,048 69,781Median 60,900 73,500 63,100 54,913 39,000 54,000 42,000 54,500 49,600 47,750 47,350 58,500 44,600 62,5001st Decile 44,000 55,000 47,500 44,754 32,000 54,000 36,000 46,636 45,000 37,500 31,036 42,000 41,000 42,0009th Decile 106,000 106,236 98,000 86,000 75,000 54,000 69,437 67,000 55,000 58,000 57,585 75,000 80,000 120,000Total 67 6 5 6 1 2 2 2 4 2Mean 52,157 55,085 52,630 46,167 38,000 42,034 45,500 37,568 33,125 54,620Median 46,500 53,650 44,000 46,500 38,000 42,034 45,500 37,568 33,250 54,6201st Decile 36,000 40,000 41,150 36,000 38,000 41,067 45,000 31,086 28,500 38,0009th Decile 77,175 77,175 71,000 55,000 38,000 43,000 46,000 44,049 37,500 71,240TotalMeanMedian1st Decile9th DecileTotal 1Mean 20,000Median 20,0001st Decile 20,0009th Decile 20,000Total 60 4 1 2 1 1 1 2 2Mean 86,524 99,250 30,000 68,985 50,000 140,000 72,000 100,000 85,000Median 78,995 102,000 30,000 68,985 50,000 140,000 72,000 100,000 85,0001st Decile 26,866 78,000 30,000 57,980 50,000 140,000 72,000 100,000 78,0009th Decile 137,500 115,000 30,000 79,990 50,000 140,000 72,000 100,000 92,000Total 13 1 2 1 2Mean 88,415 125,000 73,000 86,000 114,000Median 80,000 125,000 73,000 86,000 114,0001st Decile 58,600 125,000 66,000 86,000 63,0009th Decile 130,000 125,000 80,000 86,000 165,000
Senior engineer/Senior lecturer
Total
Industry Sector
Chairman/Managing director/Chief executive/Vice chancellor/Vice president
Senior manager/Director/Dean/Head of department
Manager/Site Manager/Project Manager/Associate professor/Professor/Principal engineer
Engineer/Supervised team member/Lecturer
Engineering technician
Graduate in training/Engineer in training/Postdoctoral
Consultant
Other
Senior manager/Director/Dean/Head of department
Manager/Site Manager/Project Manager/Associate professor/Professor/Principal engineer
67

Section D Classified by industry sector
SECTION D / TABLE 7A: SALARY OR SELF EMPLOYED EARNINGS BY LEVEL OF RESPONSIBILITY - ASSOCIATES
Biochem Chemical Consult Consumer ContractorEducation/ university
Finance and insurance Food drink
Health, safety and
envIndustrial
gases MetalsMining and
minerals Oil productionTotal 5 1 1Mean 145,000 240,000 65,000Median 120,000 240,000 65,0001st Decile 65,000 240,000 65,0009th Decile 240,000 240,000 65,000Total 36 1 6 2 1 1 1 1 1 1 1 5Mean 111,457 70,000 93,500 87,504 120,000 56,000 60,000 105,000 140,000 80,000 95,000 160,500Median 88,000 70,000 79,000 87,504 120,000 56,000 60,000 105,000 140,000 80,000 95,000 160,0001st Decile 58,000 70,000 51,500 75,000 120,000 56,000 60,000 105,000 140,000 80,000 95,000 61,5009th Decile 200,000 70,000 150,000 100,008 120,000 56,000 60,000 105,000 140,000 80,000 95,000 321,000Total 109 4 12 6 1 5 3 1 11 3 1 1 12Mean 63,125 53,625 58,821 93,683 63,033 68,686 69,333 90,600 57,591 41,833 44,000 48,552 81,392Median 56,000 55,750 64,500 78,300 63,033 74,928 55,000 90,600 56,000 39,000 44,000 48,552 75,0001st Decile 38,500 45,000 37,500 65,500 63,033 42,000 53,000 90,600 33,000 38,500 44,000 48,552 50,0009th Decile 86,000 58,000 72,000 140,000 63,033 96,000 100,000 90,600 72,000 48,000 44,000 48,552 110,500Total 90 4 9 12 3 3 2 1 2 2 17Mean 52,507 44,197 47,767 50,675 62,844 49,199 85,000 49,500 47,000 49,500 61,880Median 48,501 44,500 46,500 45,500 62,532 44,000 85,000 49,500 47,000 49,500 54,0001st Decile 37,450 35,000 36,000 36,900 55,000 42,598 83,000 49,500 44,000 47,000 41,5009th Decile 74,000 52,788 56,500 78,000 71,000 61,000 87,000 49,500 50,000 52,000 104,000Total 258 4 27 26 6 8 6 10 2 2 60Mean 39,842 36,125 37,871 33,820 35,833 36,656 41,998 33,005 41,524 32,500 49,636Median 37,563 37,000 37,754 32,000 35,500 34,425 43,000 33,000 41,524 32,500 48,0001st Decile 29,000 33,000 29,500 25,000 29,000 30,000 35,600 27,000 35,000 29,000 32,6309th Decile 51,000 37,500 44,000 46,250 42,500 48,300 48,000 39,000 48,048 36,000 61,063Total 8 1 1 1 1Mean 39,610 36,600 40,750 32,930 89,000Median 33,965 36,600 40,750 32,930 89,0001st Decile 20,500 36,600 40,750 32,930 89,0009th Decile 89,000 36,600 40,750 32,930 89,000Total 157 14 13 1 8 1 6 1 10 2 1 34Mean 31,541 32,139 28,436 29,000 31,575 34,500 26,667 21,000 32,419 24,000 28,000 35,982Median 30,200 33,050 30,000 29,000 32,250 34,500 26,250 21,000 32,500 24,000 28,000 35,3501st Decile 25,000 24,500 22,500 29,000 30,000 34,500 25,000 21,000 24,750 20,000 28,000 26,0009th Decile 40,500 37,000 37,000 29,000 33,000 34,500 30,500 21,000 40,000 28,000 28,000 46,650Total 19 1 5 1 1 2 4Mean 56,592 33,500 32,868 99,000 30,000 31,500 79,954Median 40,000 33,500 38,800 99,000 30,000 31,500 75,9081st Decile 28,500 33,500 9,998 99,000 30,000 29,500 36,5009th Decile 99,000 33,500 47,040 99,000 30,000 33,500 131,500Total 9 1 1Mean 38,478 14,000 98,000Median 36,850 14,000 98,0001st Decile 10,000 14,000 98,0009th Decile 98,000 14,000 98,000
Senior engineer/Senior lecturer
Total
Industry Sector
Chairman/Managing director/Chief executive/Vice chancellor/Vice president
Senior manager/Director/Dean/Head of department
Manager/Site Manager/Project Manager/Associate professor/Professor/Principal engineer
Engineer/Supervised team member/Lecturer
Engineering technician
Graduate in training/Engineer in training/Postdoctoral
Consultant
Other
Senior manager/Director/Dean/Head of department
Manager/Site Manager/Project Manager/Associate professor/Professor/Principal engineer
68

Section D Classified by industry sector
SECTION D / TABLE 7B : SALARY OR SELF EMPLOYED EARNINGS BY LEVEL OF RESPONSIBILITY - ASSOCIATES
Oil refining Paper Petrochem PharmaPlant and
equipment PlasticsPower - fossil
Power - Nuclear decomm
Power - Nuclear
generationPower -
renewable Public sectorWaste
management Water OtherTotal 5 1 1 1Mean 145,000 190,000 110,000 120,000Median 120,000 190,000 110,000 120,0001st Decile 65,000 190,000 110,000 120,0009th Decile 240,000 190,000 110,000 120,000Total 36 3 1 1 1 3 2 2 2Mean 111,457 241,667 64,000 135,000 46,750 77,000 76,600 65,000 131,500Median 88,000 250,000 64,000 135,000 46,750 68,000 76,600 65,000 131,5001st Decile 58,000 200,000 64,000 135,000 46,750 58,000 72,500 65,000 90,0009th Decile 200,000 275,000 64,000 135,000 46,750 105,000 80,700 65,000 173,000Total 109 3 5 16 4 2 4 2 1 4 8Mean 63,125 74,667 105,400 52,925 51,125 57,425 51,550 40,000 38,500 53,250 51,250Median 56,000 80,000 86,000 50,500 44,250 57,425 45,000 40,000 38,500 53,250 50,0001st Decile 38,500 62,000 78,000 32,000 40,000 53,850 37,000 40,000 38,500 43,000 38,0009th Decile 86,000 82,000 150,000 84,000 76,000 61,000 79,200 40,000 38,500 63,500 75,000Total 90 3 4 7 4 1 2 2 2 1 5 4Mean 52,507 76,930 47,420 48,714 43,625 37,000 40,250 56,325 42,705 68,190 46,400 39,630Median 48,501 73,000 46,731 48,000 43,000 37,000 40,250 56,325 42,705 68,190 45,000 43,1001st Decile 37,450 67,790 41,220 45,000 39,000 37,000 34,500 54,150 41,000 68,190 39,000 24,3209th Decile 74,000 90,000 55,000 58,000 49,500 37,000 46,000 58,500 44,410 68,190 60,000 48,000Total 258 10 15 17 12 4 2 10 9 2 2 10 14Mean 39,842 43,133 38,477 36,223 34,833 43,038 32,000 38,472 38,839 35,000 34,500 32,744 38,371Median 37,563 39,715 39,000 35,000 34,250 43,575 32,000 37,700 37,000 35,000 34,500 32,515 39,2501st Decile 29,000 34,250 30,000 31,000 27,000 34,000 28,000 33,500 30,800 30,000 33,000 22,500 29,2549th Decile 51,000 56,500 43,000 43,000 41,000 51,000 36,000 42,500 52,000 40,000 36,000 42,500 49,000Total 8 1 1 1 1Mean 39,610 35,000 30,000 32,100 20,500Median 33,965 35,000 30,000 32,100 20,5001st Decile 20,500 35,000 30,000 32,100 20,5009th Decile 89,000 35,000 30,000 32,100 20,500Total 157 12 5 8 4 1 3 6 5 1 3 8 10Mean 31,541 38,116 35,490 28,975 22,282 30,000 27,667 31,464 28,860 28,000 23,667 27,081 29,410Median 30,200 38,398 36,000 29,250 22,000 30,000 26,000 31,750 30,000 28,000 22,000 26,500 28,3771st Decile 25,000 30,000 32,400 25,000 14,600 30,000 26,000 28,192 23,800 28,000 20,000 25,150 25,0009th Decile 40,500 47,000 40,000 31,300 30,529 30,000 31,000 34,567 31,000 28,000 29,000 29,000 33,750Total 19 2 2 1Mean 56,592 96,000 49,300 75,000Median 40,000 96,000 49,300 75,0001st Decile 28,500 95,000 37,000 75,0009th Decile 99,000 97,000 61,600 75,000Total 9 1 1 1 1 1 2Mean 38,478 58,000 36,850 10,000 47,000 29,450 26,500Median 36,850 58,000 36,850 10,000 47,000 29,450 26,5001st Decile 10,000 58,000 36,850 10,000 47,000 29,450 14,0009th Decile 98,000 58,000 36,850 10,000 47,000 29,450 39,000
Senior engineer/Senior lecturer
Total
Industry Sector
Chairman/Managing director/Chief executive/Vice chancellor/Vice president
Senior manager/Director/Dean/Head of department
Manager/Site Manager/Project Manager/Associate professor/Professor/Principal engineer
Engineer/Supervised team member/Lecturer
Engineering technician
Graduate in training/Engineer in training/Postdoctoral
Consultant
Other
Senior manager/Director/Dean/Head of department
Manager/Site Manager/Project Manager/Associate professor/Professor/Principal engineer
69
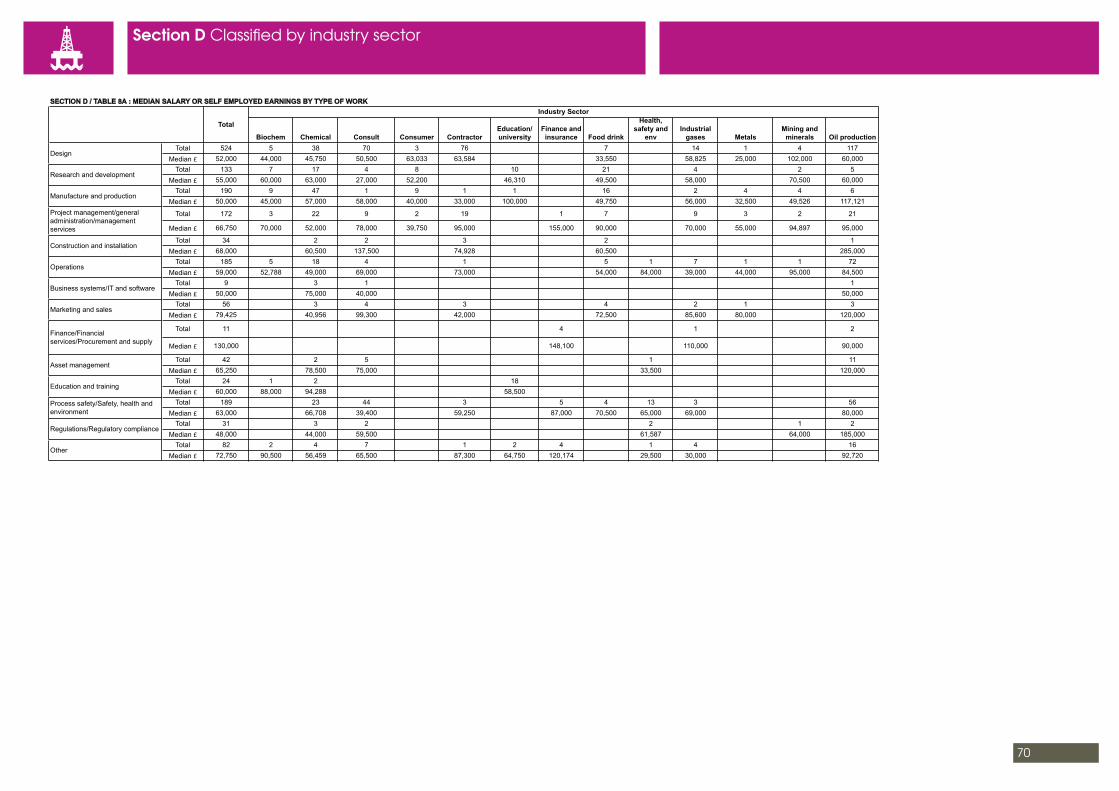
Section D Classified by industry sector
SECTION D / TABLE 8A : MEDIAN SALARY OR SELF EMPLOYED EARNINGS BY TYPE OF WORK
Biochem Chemical Consult Consumer ContractorEducation/ university
Finance and insurance Food drink
Health, safety and
envIndustrial
gases MetalsMining and
minerals Oil productionTotal 524 5 38 70 3 76 7 14 1 4 117
Median £ 52,000 44,000 45,750 50,500 63,033 63,584 33,550 58,825 25,000 102,000 60,000Total 133 7 17 4 8 10 21 4 2 5
Median £ 55,000 60,000 63,000 27,000 52,200 46,310 49,500 58,000 70,500 60,000Total 190 9 47 1 9 1 1 16 2 4 4 6
Median £ 50,000 45,000 57,000 58,000 40,000 33,000 100,000 49,750 56,000 32,500 49,526 117,121
Total 172 3 22 9 2 19 1 7 9 3 2 21
Median £ 66,750 70,000 52,000 78,000 39,750 95,000 155,000 90,000 70,000 55,000 94,897 95,000
Total 34 2 2 3 2 1Median £ 68,000 60,500 137,500 74,928 60,500 285,000
Total 185 5 18 4 1 5 1 7 1 1 72Median £ 59,000 52,788 49,000 69,000 73,000 54,000 84,000 39,000 44,000 95,000 84,500
Total 9 3 1 1Median £ 50,000 75,000 40,000 50,000
Total 56 3 4 3 4 2 1 3Median £ 79,425 40,956 99,300 42,000 72,500 85,600 80,000 120,000
Total 11 4 1 2
Median £ 130,000 148,100 110,000 90,000
Total 42 2 5 1 11Median £ 65,250 78,500 75,000 33,500 120,000
Total 24 1 2 18Median £ 60,000 88,000 94,288 58,500
Total 189 23 44 3 5 4 13 3 56Median £ 63,000 66,708 39,400 59,250 87,000 70,500 65,000 69,000 80,000
Total 31 3 2 2 1 2Median £ 48,000 44,000 59,500 61,587 64,000 185,000
Total 82 2 4 7 1 2 4 1 4 16Median £ 72,750 90,500 56,459 65,500 87,300 64,750 120,174 29,500 30,000 92,720
Project management/general administration/management services
Total
Industry Sector
Design
Research and development
Manufacture and production
Education and training
Process safety/Safety, health and environment
Regulations/Regulatory compliance
Other
Construction and installation
Operations
Business systems/IT and software
Marketing and sales
Finance/Financial services/Procurement and supply
Asset management
70

Section D Classified by industry sector
SECTION D / TABLE 8B : MEDIAN SALARY OR SELF EMPLOYED EARNINGS BY TYPE OF WORK
Oil refining Paper Petrochem PharmaPlant and
equipment PlasticsPower - fossil
Power - Nuclear decomm
Power - Nuclear
generationPower -
renewablePublic sector Waste
management Water OtherTotal 524 21 31 10 19 3 3 29 15 6 1 1 39 11
Median £ 52,000 54,500 59,700 39,000 48,000 103,490 36,000 50,500 45,000 40,000 46,700 62,000 42,000 60,180Total 133 1 1 4 15 3 2 7 4 5 1 4 8
Median £ 55,000 40,791 64,000 91,100 48,000 57,000 194,500 58,000 42,500 48,000 59,000 42,000 46,500Total 190 15 13 30 5 5 3 1 1 4 13
Median £ 50,000 67,790 50,930 49,000 40,000 48,000 36,768 79,200 33,000 35,500 44,000
Total 172 12 5 17 5 4 5 6 3 2 4 1 10
Median £ 66,750 78,500 85,000 45,800 58,000 63,719 88,000 39,000 54,150 67,750 67,345 39,000 55,000
Total 34 2 2 2 1 1 3 3 8 2Median £ 68,000 31,000 41,300 85,500 70,000 35,000 61,600 75,000 55,000 72,500
Total 185 23 5 7 2 1 2 2 3 2 2 1 11 9Median £ 59,000 60,900 43,000 34,000 33,000 40,000 105,300 44,096 52,000 76,500 51,705 38,500 41,000 42,000
Total 9 1 1 1 1Median £ 50,000 92,000 39,000 742,712 49,000
Total 56 9 3 10 1 1 6 6Median £ 79,425 102,000 78,850 77,500 36,000 28,000 59,390 49,000
Total 11 1 1 1 1
Median £ 130,000 97,500 130,000 57,000 100,000
Total 42 1 2 1 1 1 4 2 2 1 8Median £ 65,250 42,000 35,885 46,000 40,000 97,000 68,250 46,550 111,000 135,000 55,775
Total 24 1 1 1Median £ 60,000 97,000 26,000 20,000
Total 189 5 9 3 2 2 3 4 2 1 7Median £ 63,000 75,850 72,000 62,000 31,000 60,575 61,000 63,500 55,500 75,000 49,000
Total 31 2 1 3 11 1 3Median £ 48,000 99,995 53,850 35,595 36,000 45,283 34,000
Total 82 9 4 2 1 5 2 1 1 16Median £ 72,750 78,000 102,000 65,000 705,000 41,067 100,000 86,000 22,000 59,876
Total
Industry Sector
Design
Research and development
Other
Manufacture and production
Project management/general administration/management services
Construction and installation
Operations
Business systems/IT and software
Marketing and sales
Finance/Financial services/Procurement and supply
Asset management
Education and training
Process safety/Safety, health and environment
Regulations/Regulatory compliance
71

Section EClassified by type of work
72

Section E Classified by type of work
SECTION E / TABLE 1 : EMPLOYMENT STATUS
Design R&D Manufacturing Admin Construction Operations IT Sales Finance Asset manEducation and
universityHealth, safety
and env Regulatory OtherTotal 1682 524 133 190 172 34 185 9 56 11 42 24 189 31 82
% 100.0% 100.0% 100.0% 100.0% 100.0% 100.0% 100.0% 100.0% 100.0% 100.0% 100.0% 100.0% 100.0% 100.0% 100.0%Total 1606 502 129 189 167 34 182 8 54 9 40 20 174 23 75
% 95.5% 96.0% 97.0% 99.5% 97.1% 100.0% 98.4% 88.9% 96.4% 81.8% 95.2% 83.3% 92.1% 74.2% 91.5%Total 75 21 4 1 5 3 1 2 2 2 4 15 8 7
% 4.5% 4.0% 3.0% 0.5% 2.9% 1.6% 11.1% 3.6% 18.2% 4.8% 16.7% 7.9% 25.8% 8.5%
Full time
Part time
Type of workTotal
Total
73
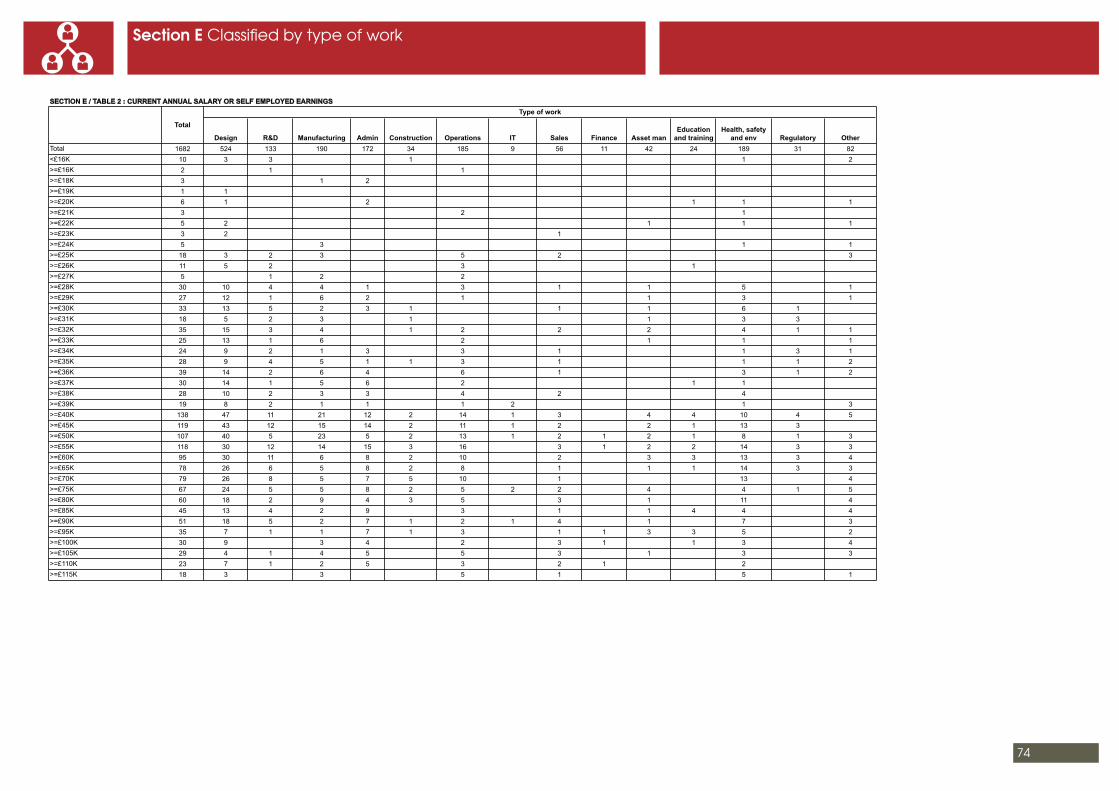
Section E Classified by type of work
SECTION E / TABLE 2 : CURRENT ANNUAL SALARY OR SELF EMPLOYED EARNINGS
Design R&D Manufacturing Admin Construction Operations IT Sales Finance Asset manEducation
and trainingHealth, safety
and env Regulatory OtherTotal 1682 524 133 190 172 34 185 9 56 11 42 24 189 31 82<£16K 10 3 3 1 1 2>=£16K 2 1 1>=£18K 3 1 2>=£19K 1 1>=£20K 6 1 2 1 1 1>=£21K 3 2 1>=£22K 5 2 1 1 1>=£23K 3 2 1>=£24K 5 3 1 1>=£25K 18 3 2 3 5 2 3>=£26K 11 5 2 3 1>=£27K 5 1 2 2>=£28K 30 10 4 4 1 3 1 1 5 1>=£29K 27 12 1 6 2 1 1 3 1>=£30K 33 13 5 2 3 1 1 1 6 1>=£31K 18 5 2 3 1 1 3 3>=£32K 35 15 3 4 1 2 2 2 4 1 1>=£33K 25 13 1 6 2 1 1 1>=£34K 24 9 2 1 3 3 1 1 3 1>=£35K 28 9 4 5 1 1 3 1 1 1 2>=£36K 39 14 2 6 4 6 1 3 1 2>=£37K 30 14 1 5 6 2 1 1>=£38K 28 10 2 3 3 4 2 4>=£39K 19 8 2 1 1 1 2 1 3>=£40K 138 47 11 21 12 2 14 1 3 4 4 10 4 5>=£45K 119 43 12 15 14 2 11 1 2 2 1 13 3>=£50K 107 40 5 23 5 2 13 1 2 1 2 1 8 1 3>=£55K 118 30 12 14 15 3 16 3 1 2 2 14 3 3>=£60K 95 30 11 6 8 2 10 2 3 3 13 3 4>=£65K 78 26 6 5 8 2 8 1 1 1 14 3 3>=£70K 79 26 8 5 7 5 10 1 13 4>=£75K 67 24 5 5 8 2 5 2 2 4 4 1 5>=£80K 60 18 2 9 4 3 5 3 1 11 4>=£85K 45 13 4 2 9 3 1 1 4 4 4>=£90K 51 18 5 2 7 1 2 1 4 1 7 3>=£95K 35 7 1 1 7 1 3 1 1 3 3 5 2>=£100K 30 9 3 4 2 3 1 1 3 4>=£105K 29 4 1 4 5 5 3 1 3 3>=£110K 23 7 1 2 5 3 2 1 2>=£115K 18 3 3 5 1 5 1
Total
Type of work
74

Section E Classified by type of work
SECTION E / TABLE 2 : CURRENT ANNUAL SALARY OR SELF EMPLOYED EARNINGS Cont'd
Design R&D Manufacturing Admin Construction Operations IT Sales Finance Asset manEducation &
trainingHealth, safety
and env Regulatory Other>=£120K 37 6 4 3 5 1 4 3 2 1 5 2 1>=£125K 20 2 1 3 3 4 2 1 2 2>=£130K 15 5 1 3 2 2 2>=£135K 12 2 1 5 1 1 1 1>=£140K 13 1 1 1 1 1 1 1 4 2>=£145K 7 1 1 2 1 1 1>=£150K 41 11 3 3 7 7 1 1 1 4 3>=£200K 17 1 1 1 3 1 3 2 1 1 2 1>=£250K 20 1 1 3 4 1 2 1 1 2 2 1 1Total 1,682 524 133 190 172 34 185 9 56 11 42 24 189 31 82Mean 70,637 60,611 65,049 63,523 84,885 74,695 75,681 133,524 84,334 119,245 92,623 65,977 73,259 58,927 83,009Median 57,000 52,000 55,000 50,000 66,750 68,000 59,000 50,000 79,425 130,000 65,250 60,000 63,000 48,000 72,7501st Decile 31,000 31,000 29,000 29,627 36,656 32,000 32,000 39,000 32,000 57,000 31,000 37,768 30,500 31,086 28,0009th Decile 120,000 100,000 98,000 114,511 135,000 120,000 135,000 742,712 129,000 156,200 147,000 99,000 120,000 79,990 135,000
TotalType of work
75

Section E Classified by type of work
SECTION E / TABLE 3 : BENEFITS IN KIND FOR SALARIED EMPLOYEES
Design R&D Manufacturing Admin Construction Operations IT Sales Finance Asset manEducation and
trainingHealth, safety
and env Regulatory Other1682 524 133 190 172 34 185 9 56 11 42 24 189 31 82
Total 4 1 2 1% 0.2% 0.2% 1.2% 2.4%
Total 2 1 1% 0.1% 0.5% 1.2%
Total 499 126 47 59 49 7 57 1 19 1 13 16 56 19 29
% 29.7% 24.0% 35.3% 31.1% 28.5% 20.6% 30.8% 11.1% 33.9% 9.1% 31.0% 66.7% 29.6% 61.3% 35.4%
Total 1013 338 73 125 102 23 106 7 34 8 24 7 113 11 42
% 60.2% 64.5% 54.9% 65.8% 59.3% 67.6% 57.3% 77.8% 60.7% 72.7% 57.1% 29.2% 59.8% 35.5% 51.2%
Total 54 16 2 2 5 1 13 1 1 1 3 3 6% 3.2% 3.1% 1.5% 1.1% 2.9% 2.9% 7.0% 11.1% 1.8% 9.1% 7.1% 1.6% 7.3%
Total 110 43 11 4 14 3 9 2 1 1 1 16 1 4% 6.5% 8.2% 8.3% 2.1% 8.1% 8.8% 4.9% 3.6% 9.1% 2.4% 4.2% 8.5% 3.2% 4.9%
Total 1007 300 75 131 115 21 126 7 40 10 26 1 101 10 44% 59.9% 57.3% 56.4% 68.9% 66.9% 61.8% 68.1% 77.8% 71.4% 90.9% 61.9% 4.2% 53.4% 32.3% 53.7%
Total 505 103 37 57 70 22 60 2 35 6 15 3 60 11 24% 30.0% 19.7% 27.8% 30.0% 40.7% 64.7% 32.4% 22.2% 62.5% 54.5% 35.7% 12.5% 31.7% 35.5% 29.3%
Total 493 141 40 62 54 9 71 20 1 12 2 51 4 26% 29.3% 26.9% 30.1% 32.6% 31.4% 26.5% 38.4% 35.7% 9.1% 28.6% 8.3% 27.0% 12.9% 31.7%
Total 619 170 47 71 66 16 85 3 30 8 16 3 64 9 31% 36.8% 32.4% 35.3% 37.4% 38.4% 47.1% 45.9% 33.3% 53.6% 72.7% 38.1% 12.5% 33.9% 29.0% 37.8%
Total 64 26 6 7 4 1 2 1 5 5 2 5% 3.8% 5.0% 4.5% 3.7% 2.3% 2.9% 1.1% 9.1% 11.9% 2.6% 6.5% 6.1%
Total 1266 422 92 136 127 28 145 5 40 7 35 5 148 21 55% 75.3% 80.5% 69.2% 71.6% 73.8% 82.4% 78.4% 55.6% 71.4% 63.6% 83.3% 20.8% 78.3% 67.7% 67.1%
Total 209 48 21 22 24 7 14 1 5 3 4 2 43 6 9% 12.4% 9.2% 15.8% 11.6% 14.0% 20.6% 7.6% 11.1% 8.9% 27.3% 9.5% 8.3% 22.8% 19.4% 11.0%
Total 152 45 17 17 20 2 18 5 1 3 14 4 6% 9.0% 8.6% 12.8% 8.9% 11.6% 5.9% 9.7% 8.9% 9.1% 7.1% 7.4% 12.9% 7.3%
Total 171 48 18 17 14 1 11 1 3 1 2 15 21 5 14% 10.2% 9.2% 13.5% 8.9% 8.1% 2.9% 5.9% 11.1% 5.4% 9.1% 4.8% 62.5% 11.1% 16.1% 17.1%
Total 53 19 3 4 4 6 2 1 1 7 1 5% 3.2% 3.6% 2.3% 2.1% 2.3% 3.2% 18.2% 2.4% 4.2% 3.7% 3.2% 6.1%
Company share scheme
TotalType of work
Total
401k savings plan (US)
Central Providence Fund (Singapore)
Defined benefit pension/Company final salary scheme
Defined contribution pension/Company money purchase scheme
Non-contributory pension
None
Medical and dental insurance
Car or car allowance
Other
Life insurance
Loans
IChemE membership fees
Other professional membership fees
Childcare
None
76

Section E Classified by type of work
SECTION E / TABLE 4 : SALARY OR SELF EMPLOYED EARNINGS BY GRADE AND SEX
Design R&D Manufacturing Admin Construction Operations IT Sales Finance Asset manEducation and
trainingHealth, safety
and env Regulatory OtherTotal 933 291 71 88 107 21 86 6 32 8 29 11 111 21 51Mean 88,406 74,955 86,839 81,757 102,878 92,095 99,780 178,952 95,615 138,400 113,400 83,234 88,838 64,674 100,462Median 73,000 68,000 70,000 64,500 85,000 75,000 82,000 75,000 93,168 132,500 82,000 88,000 72,000 57,585 84,0001st Decile 45,000 44,000 48,000 42,000 44,000 54,000 50,000 40,000 38,000 100,000 40,000 57,000 49,000 31,086 50,0009th Decile 135,000 118,000 124,311 125,000 160,000 140,000 142,000 742,712 140,000 206,000 247,464 103,000 130,000 79,990 145,000Total 749 233 62 102 65 13 99 3 24 3 13 13 78 10 31Mean 48,503 42,697 40,096 47,791 55,266 46,587 54,748 42,667 69,293 68,167 46,275 51,374 51,090 46,860 54,295Median 40,000 37,625 36,350 40,000 47,000 42,000 44,000 39,000 53,250 57,000 40,000 44,000 43,750 38,000 39,0001st Decile 28,000 29,000 26,000 28,000 30,000 30,000 26,500 39,000 28,000 50,000 29,450 26,000 29,000 31,575 24,5009th Decile 79,200 63,500 58,000 67,790 96,000 71,000 89,000 50,000 110,000 97,500 75,000 88,500 87,000 86,925 120,000Total 1,376 427 111 150 142 31 156 8 47 11 37 22 153 17 64Mean 75,024 63,849 68,619 65,911 90,545 69,891 80,196 145,339 91,238 119,245 100,626 67,084 78,473 70,435 90,102Median 60,186 55,000 58,000 50,000 71,000 68,000 60,513 62,500 90,000 130,000 75,000 60,000 65,000 57,585 79,0001st Decile 32,400 32,000 30,000 31,150 37,500 35,000 33,500 39,000 32,000 57,000 32,100 37,768 33,000 34,100 28,0009th Decile 125,000 107,000 106,200 115,000 148,000 95,000 138,787 742,712 140,000 156,200 180,000 99,000 129,575 120,000 140,000Total 306 97 22 40 30 3 29 1 9 5 2 36 14 18Mean 50,908 46,360 47,037 54,567 58,093 124,333 51,395 39,000 48,284 33,400 53,799 51,101 44,954 57,788Median 45,000 42,200 39,946 50,465 49,500 56,000 48,000 39,000 45,000 33,500 53,799 45,000 43,000 54,3761st Decile 28,000 28,000 28,000 27,000 35,000 32,000 25,000 39,000 28,000 22,500 42,598 28,000 31,036 25,0009th Decile 80,000 72,000 74,000 78,100 92,500 285,000 80,000 39,000 80,000 40,000 65,000 82,000 65,000 86,000
Female
TotalType of work
Chartered Members
Non-Chartered Members
Male
77
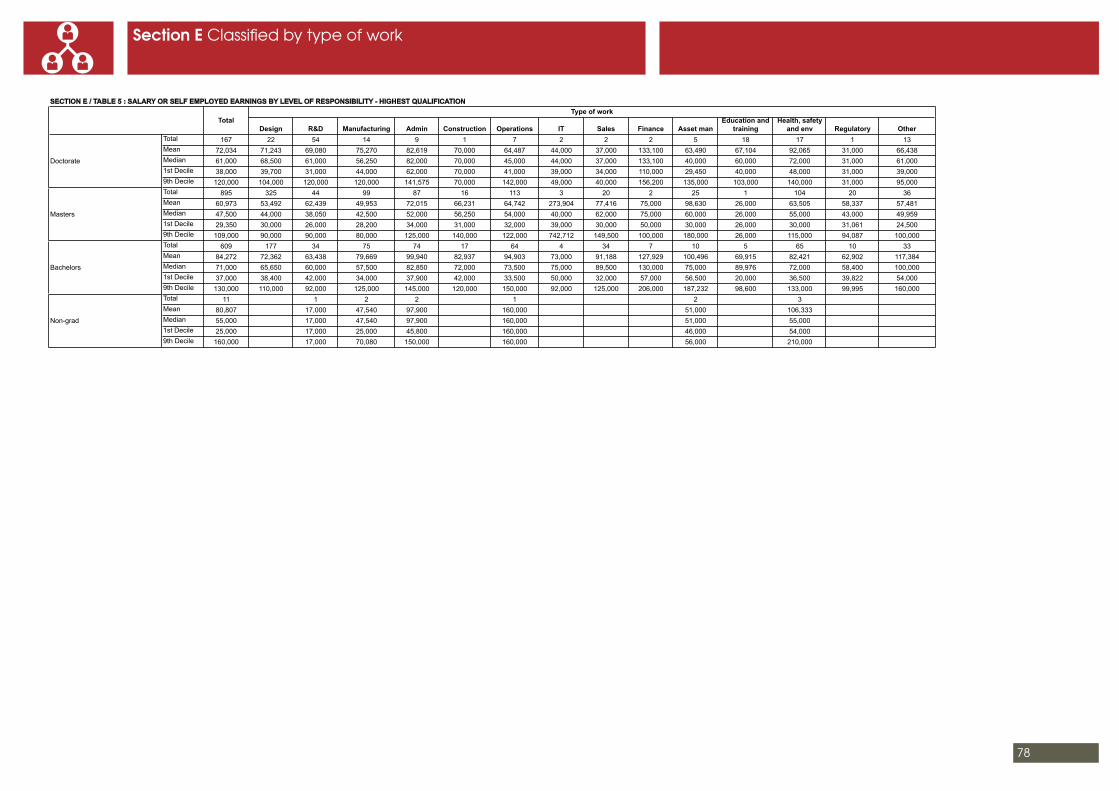
Section E Classified by type of work
SECTION E / TABLE 5 : SALARY OR SELF EMPLOYED EARNINGS BY LEVEL OF RESPONSIBILITY - HIGHEST QUALIFICATION
Design R&D Manufacturing Admin Construction Operations IT Sales Finance Asset manEducation and
trainingHealth, safety
and env Regulatory OtherTotal 167 22 54 14 9 1 7 2 2 2 5 18 17 1 13Mean 72,034 71,243 69,080 75,270 82,619 70,000 64,487 44,000 37,000 133,100 63,490 67,104 92,065 31,000 66,438Median 61,000 68,500 61,000 56,250 82,000 70,000 45,000 44,000 37,000 133,100 40,000 60,000 72,000 31,000 61,0001st Decile 38,000 39,700 31,000 44,000 62,000 70,000 41,000 39,000 34,000 110,000 29,450 40,000 48,000 31,000 39,0009th Decile 120,000 104,000 120,000 120,000 141,575 70,000 142,000 49,000 40,000 156,200 135,000 103,000 140,000 31,000 95,000Total 895 325 44 99 87 16 113 3 20 2 25 1 104 20 36Mean 60,973 53,492 62,439 49,953 72,015 66,231 64,742 273,904 77,416 75,000 98,630 26,000 63,505 58,337 57,481Median 47,500 44,000 38,050 42,500 52,000 56,250 54,000 40,000 62,000 75,000 60,000 26,000 55,000 43,000 49,9591st Decile 29,350 30,000 26,000 28,200 34,000 31,000 32,000 39,000 30,000 50,000 30,000 26,000 30,000 31,061 24,5009th Decile 109,000 90,000 90,000 80,000 125,000 140,000 122,000 742,712 149,500 100,000 180,000 26,000 115,000 94,087 100,000Total 609 177 34 75 74 17 64 4 34 7 10 5 65 10 33Mean 84,272 72,362 63,438 79,669 99,940 82,937 94,903 73,000 91,188 127,929 100,496 69,915 82,421 62,902 117,384Median 71,000 65,650 60,000 57,500 82,850 72,000 73,500 75,000 89,500 130,000 75,000 89,976 72,000 58,400 100,0001st Decile 37,000 38,400 42,000 34,000 37,900 42,000 33,500 50,000 32,000 57,000 56,500 20,000 36,500 39,822 54,0009th Decile 130,000 110,000 92,000 125,000 145,000 120,000 150,000 92,000 125,000 206,000 187,232 98,600 133,000 99,995 160,000Total 11 1 2 2 1 2 3Mean 80,807 17,000 47,540 97,900 160,000 51,000 106,333Median 55,000 17,000 47,540 97,900 160,000 51,000 55,0001st Decile 25,000 17,000 25,000 45,800 160,000 46,000 54,0009th Decile 160,000 17,000 70,080 150,000 160,000 56,000 210,000
Non-grad
TotalType of work
Doctorate
Masters
Bachelors
78
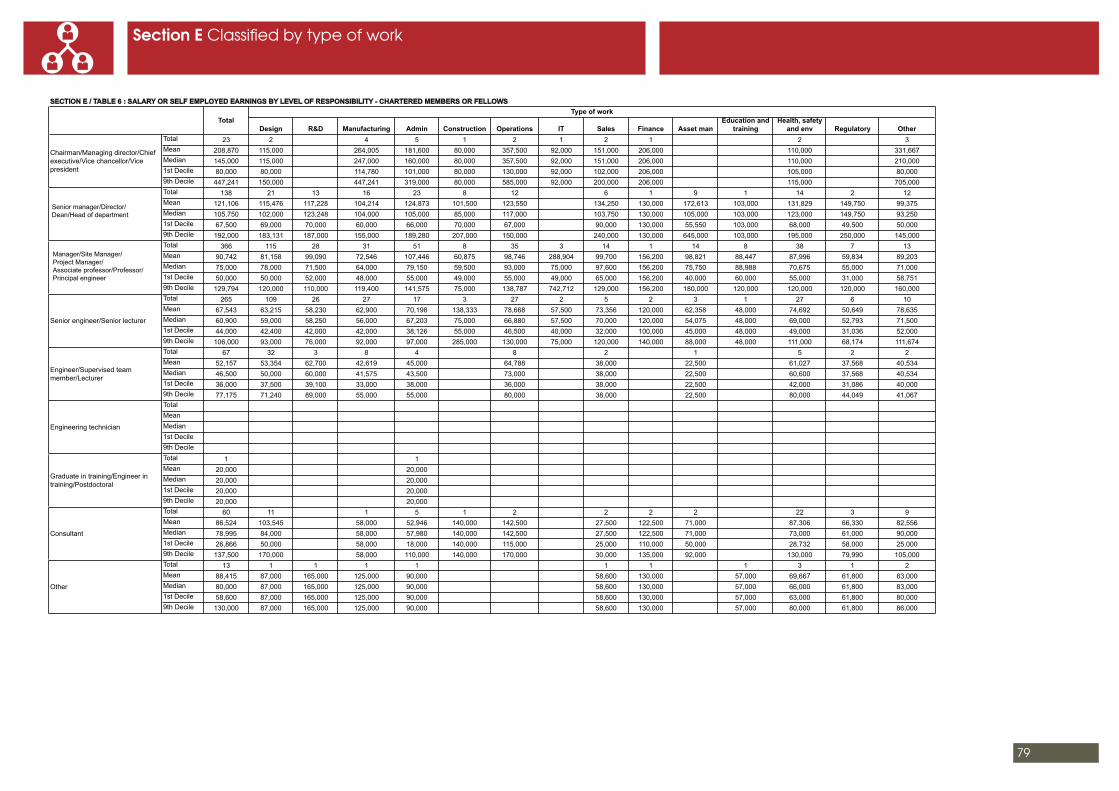
Section E Classified by type of work
SECTION E / TABLE 6 : SALARY OR SELF EMPLOYED EARNINGS BY LEVEL OF RESPONSIBILITY - CHARTERED MEMBERS OR FELLOWS
Design R&D Manufacturing Admin Construction Operations IT Sales Finance Asset manEducation and
trainingHealth, safety
and env Regulatory OtherTotal 23 2 4 5 1 2 1 2 1 2 3Mean 208,870 115,000 264,005 181,600 80,000 357,500 92,000 151,000 206,000 110,000 331,667Median 145,000 115,000 247,000 160,000 80,000 357,500 92,000 151,000 206,000 110,000 210,0001st Decile 80,000 80,000 114,780 101,000 80,000 130,000 92,000 102,000 206,000 105,000 80,0009th Decile 447,241 150,000 447,241 319,000 80,000 585,000 92,000 200,000 206,000 115,000 705,000Total 138 21 13 16 23 8 12 6 1 9 1 14 2 12Mean 121,106 115,476 117,228 104,214 124,873 101,500 123,550 134,250 130,000 172,613 103,000 131,829 149,750 99,375Median 105,750 102,000 123,248 104,000 105,000 85,000 117,000 103,750 130,000 105,000 103,000 123,000 149,750 93,2501st Decile 67,500 69,000 70,000 60,000 66,000 70,000 67,000 90,000 130,000 55,550 103,000 68,000 49,500 50,0009th Decile 192,000 183,131 187,000 155,000 189,280 207,000 150,000 240,000 130,000 645,000 103,000 195,000 250,000 145,000Total 366 115 28 31 51 8 35 3 14 1 14 8 38 7 13Mean 90,742 81,158 99,090 72,546 107,446 60,875 98,746 288,904 99,700 156,200 98,821 88,447 87,996 59,834 89,203Median 75,000 78,000 71,500 64,000 79,150 59,500 93,000 75,000 97,600 156,200 75,750 88,988 70,675 55,000 71,0001st Decile 50,000 50,000 52,000 48,000 55,000 49,000 55,000 49,000 65,000 156,200 40,000 60,000 55,000 31,000 58,7519th Decile 129,794 120,000 110,000 119,400 141,575 75,000 138,787 742,712 129,000 156,200 180,000 120,000 120,000 120,000 160,000Total 265 109 26 27 17 3 27 2 5 2 3 1 27 6 10Mean 67,543 63,215 58,230 62,900 70,198 138,333 78,668 57,500 73,356 120,000 62,358 48,000 74,692 50,649 78,635Median 60,900 59,000 58,250 56,000 67,203 75,000 66,880 57,500 70,000 120,000 54,075 48,000 69,000 52,793 71,5001st Decile 44,000 42,400 42,000 42,000 38,126 55,000 46,500 40,000 32,000 100,000 45,000 48,000 49,000 31,036 52,0009th Decile 106,000 93,000 76,000 92,000 97,000 285,000 130,000 75,000 120,000 140,000 88,000 48,000 111,000 68,174 111,674Total 67 32 3 8 4 8 2 1 5 2 2Mean 52,157 53,354 62,700 42,619 45,000 64,788 38,000 22,500 61,027 37,568 40,534Median 46,500 50,000 60,000 41,575 43,500 73,000 38,000 22,500 60,600 37,568 40,5341st Decile 36,000 37,500 39,100 33,000 38,000 36,000 38,000 22,500 42,000 31,086 40,0009th Decile 77,175 71,240 89,000 55,000 55,000 80,000 38,000 22,500 80,000 44,049 41,067TotalMeanMedian1st Decile9th DecileTotal 1 1Mean 20,000 20,000Median 20,000 20,0001st Decile 20,000 20,0009th Decile 20,000 20,000Total 60 11 1 5 1 2 2 2 2 22 3 9Mean 86,524 103,545 58,000 52,946 140,000 142,500 27,500 122,500 71,000 87,306 66,330 82,556Median 78,995 84,000 58,000 57,980 140,000 142,500 27,500 122,500 71,000 73,000 61,000 90,0001st Decile 26,866 50,000 58,000 18,000 140,000 115,000 25,000 110,000 50,000 28,732 58,000 25,0009th Decile 137,500 170,000 58,000 110,000 140,000 170,000 30,000 135,000 92,000 130,000 79,990 105,000Total 13 1 1 1 1 1 1 1 3 1 2Mean 88,415 87,000 165,000 125,000 90,000 58,600 130,000 57,000 69,667 61,800 83,000Median 80,000 87,000 165,000 125,000 90,000 58,600 130,000 57,000 66,000 61,800 83,0001st Decile 58,600 87,000 165,000 125,000 90,000 58,600 130,000 57,000 63,000 61,800 80,0009th Decile 130,000 87,000 165,000 125,000 90,000 58,600 130,000 57,000 80,000 61,800 86,000
Senior engineer/Senior lecturer
TotalType of work
Chairman/Managing director/Chief executive/Vice chancellor/Vice president
Senior manager/Director/Dean/Head of department
Manager/Site Manager/Project Manager/Associate professor/Professor/Principal engineer
Engineer/Supervised team member/Lecturer
Engineering technician
Graduate in training/Engineer in training/Postdoctoral
Consultant
Other
Senior manager/Director/Dean/Head of department
Manager/Site Manager/Project Manager/Associate professor/Professor/Principal engineer
79

Section E Classified by type of work
SECTION E / TABLE 7 : SALARY OR SELF EMPLOYED EARNINGS BY LEVEL OF RESPONSIBILITY - ASSOCIATES
Design R&D Manufacturing Admin Construction Operations IT Sales Finance Asset manEducation and
trainingHealth, safety
and env Regulatory OtherTotal 5 1 1 1 2Mean 145,000 65,000 240,000 190,000 115,000Median 120,000 65,000 240,000 190,000 115,0001st Decile 65,000 65,000 240,000 190,000 110,0009th Decile 240,000 65,000 240,000 190,000 120,000Total 36 3 2 2 7 1 8 4 1 1 4 3Mean 111,457 102,000 92,000 148,375 104,530 68,000 126,813 152,750 75,000 60,000 99,125 89,667Median 88,000 90,000 92,000 148,375 100,000 68,000 90,500 105,000 75,000 60,000 102,500 72,5001st Decile 58,000 56,000 64,000 46,750 58,000 68,000 65,000 80,000 75,000 60,000 51,500 61,5009th Decile 200,000 160,000 120,000 250,000 173,000 68,000 275,000 321,000 75,000 60,000 140,000 135,000Total 109 19 9 20 22 1 13 8 1 1 2 9 1 3Mean 63,125 65,754 55,111 65,363 59,407 74,928 53,092 56,938 50,000 46,000 54,000 85,456 53,850 91,167Median 56,000 65,700 57,000 55,250 53,500 74,928 43,000 54,500 50,000 46,000 54,000 72,000 53,850 80,0001st Decile 38,500 40,000 38,000 46,000 37,000 74,928 33,000 40,000 50,000 46,000 53,000 61,000 53,850 65,5009th Decile 86,000 82,000 85,000 92,000 85,000 74,928 72,000 82,000 50,000 46,000 55,000 140,000 53,850 128,000Total 90 35 5 8 8 2 14 1 3 12 2Mean 52,507 52,194 47,900 56,201 46,780 50,250 59,021 45,000 49,199 52,492 43,100Median 48,501 49,500 48,000 50,000 45,750 50,250 53,894 45,000 44,000 49,501 43,1001st Decile 37,450 38,200 39,000 24,320 34,500 42,000 44,410 45,000 42,598 36,900 43,1009th Decile 74,000 71,000 58,000 120,000 68,190 58,500 78,000 45,000 61,000 83,000 43,100Total 258 100 23 33 16 4 33 1 6 1 4 2 22 5 8Mean 39,842 39,279 34,870 38,652 41,187 38,500 46,273 39,000 34,756 57,000 35,143 40,384 38,977 37,279 45,490Median 37,563 37,625 33,000 37,754 39,500 38,000 40,500 39,000 34,518 57,000 35,000 40,384 36,688 36,000 35,5001st Decile 29,000 29,750 26,000 31,000 34,000 32,000 29,000 39,000 23,500 57,000 28,800 37,768 29,000 30,800 28,0009th Decile 51,000 49,300 44,620 48,000 49,200 46,000 60,125 39,000 48,000 57,000 41,770 43,000 50,000 44,000 100,000Total 8 3 1 1 1 1 1Mean 39,610 37,450 32,930 89,000 32,100 30,000 20,500Median 33,965 36,600 32,930 89,000 32,100 30,000 20,5001st Decile 20,500 35,000 32,930 89,000 32,100 30,000 20,5009th Decile 89,000 40,750 32,930 89,000 32,100 30,000 20,500Total 157 56 9 25 6 3 24 2 2 2 18 2 8Mean 31,541 31,381 33,279 31,284 31,060 25,200 34,042 26,500 37,480 23,000 32,120 33,175 26,941Median 30,200 30,765 34,500 30,000 29,500 30,000 34,250 26,500 37,480 23,000 30,750 33,175 25,0001st Decile 25,000 26,000 26,000 24,500 20,000 14,600 25,150 25,000 32,960 20,000 21,000 32,350 10,0009th Decile 40,500 37,500 40,791 40,000 48,360 31,000 47,000 28,000 42,000 26,000 43,500 34,000 39,000Total 19 2 1 1 3 1 2 1 5 3Mean 56,592 19,999 36,500 33,500 54,833 61,600 54,250 97,000 55,531 85,333Median 40,000 19,999 36,500 33,500 37,000 61,600 54,250 97,000 47,040 95,0001st Decile 28,500 9,998 36,500 33,500 28,500 61,600 33,500 97,000 38,800 29,5009th Decile 99,000 30,000 36,500 33,500 99,000 61,600 75,000 97,000 80,000 131,500Total 9 1 3 2 1 1 1Mean 38,478 36,850 12,667 78,000 29,450 47,000 39,000Median 36,850 36,850 14,000 78,000 29,450 47,000 39,0001st Decile 10,000 36,850 10,000 58,000 29,450 47,000 39,0009th Decile 98,000 36,850 14,000 98,000 29,450 47,000 39,000
Senior engineer/Senior lecturer
TotalType of work
Chairman/Managing director/Chief executive/Vice chancellor/Vice president
Senior manager/Director/Dean/Head of department
Manager/Site Manager/Project Manager/Associate professor/Professor/Principal engineer
Engineer/Supervised team member/Lecturer
Engineering technician
Graduate in training/Engineer in training/Postdoctoral
Consultant
Other
Senior manager/Director/Dean/Head of department
Manager/Site Manager/Project Manager/Associate professor/Professor/Principal engineer
80

Section E Classified by type of work
SECTION E / TABLE 8A : MEDIAN SALARY OR SELF EMPLOYED EARNINGS BY INDUSTRY SECTOR
Design R&D Manufacturing Admin Construction Operations IT Sales Finance Asset manEducation and
trainingHealth, safety
and env Regulatory OtherTotal 32 5 7 9 3 5 1 2Mean 60,842 60,232 63,857 53,500 64,000 51,258 88,000 90,500Median 56,000 44,000 60,000 45,000 70,000 52,788 88,000 90,5001st Decile 35,000 23,158 54,000 33,000 37,000 45,000 88,000 61,0009th Decile 88,000 120,000 83,000 105,000 85,000 55,000 88,000 120,000Total 184 38 17 47 22 2 18 3 3 2 2 23 3 4Mean 65,578 56,675 55,884 66,088 94,018 60,500 51,100 63,000 56,319 78,500 94,288 69,963 48,600 72,229Median 55,000 45,750 63,000 57,000 52,000 60,500 49,000 75,000 40,956 78,500 94,288 66,708 44,000 56,4591st Decile 34,000 31,000 28,000 35,100 29,000 46,000 28,560 39,000 34,000 75,000 89,976 51,500 40,000 36,0009th Decile 96,000 93,000 85,000 114,780 120,000 75,000 72,000 75,000 94,000 82,000 98,600 90,000 61,800 140,000Total 153 70 4 1 9 2 4 1 4 5 44 2 7Mean 60,817 55,908 38,250 58,000 83,306 137,500 79,000 40,000 121,650 80,815 51,897 59,500 72,378Median 51,000 50,500 27,000 58,000 78,000 137,500 69,000 40,000 99,300 75,000 39,400 59,500 65,5001st Decile 28,500 28,750 25,000 58,000 18,000 68,000 55,000 40,000 48,000 54,075 28,732 58,000 25,0009th Decile 100,008 88,650 74,000 58,000 183,000 207,000 123,000 40,000 240,000 120,000 100,000 61,000 160,000Total 22 3 8 9 2Mean 51,602 65,344 60,839 41,444 39,750Median 42,500 63,033 52,200 40,000 39,7501st Decile 29,000 57,000 17,000 28,000 38,0009th Decile 80,000 76,000 124,311 80,000 41,500Total 107 76 1 19 3 1 3 3 1Mean 73,859 68,002 33,000 104,147 72,643 73,000 57,500 57,417 87,300Median 70,000 63,584 33,000 95,000 74,928 73,000 42,000 59,250 87,3001st Decile 32,800 32,600 33,000 55,000 63,000 73,000 25,000 42,000 87,3009th Decile 109,000 109,000 33,000 124,360 80,000 73,000 105,500 71,000 87,300Total 31 10 1 18 2Mean 65,259 62,965 100,000 64,659 64,750Median 55,000 46,310 100,000 58,500 64,7501st Decile 37,768 33,715 100,000 40,000 39,5009th Decile 103,000 135,000 100,000 103,000 90,000Total 14 1 4 5 4Mean 131,511 155,000 159,300 105,120 130,837Median 130,000 155,000 148,100 87,000 120,1741st Decile 80,000 155,000 135,000 80,000 73,0009th Decile 206,000 155,000 206,000 185,000 210,000
Contracting
Education/ university
Finance, insurance and risk
TotalType of work
Biochemical engineering
Chemical and allied products
Consultancy
Consumer products
81
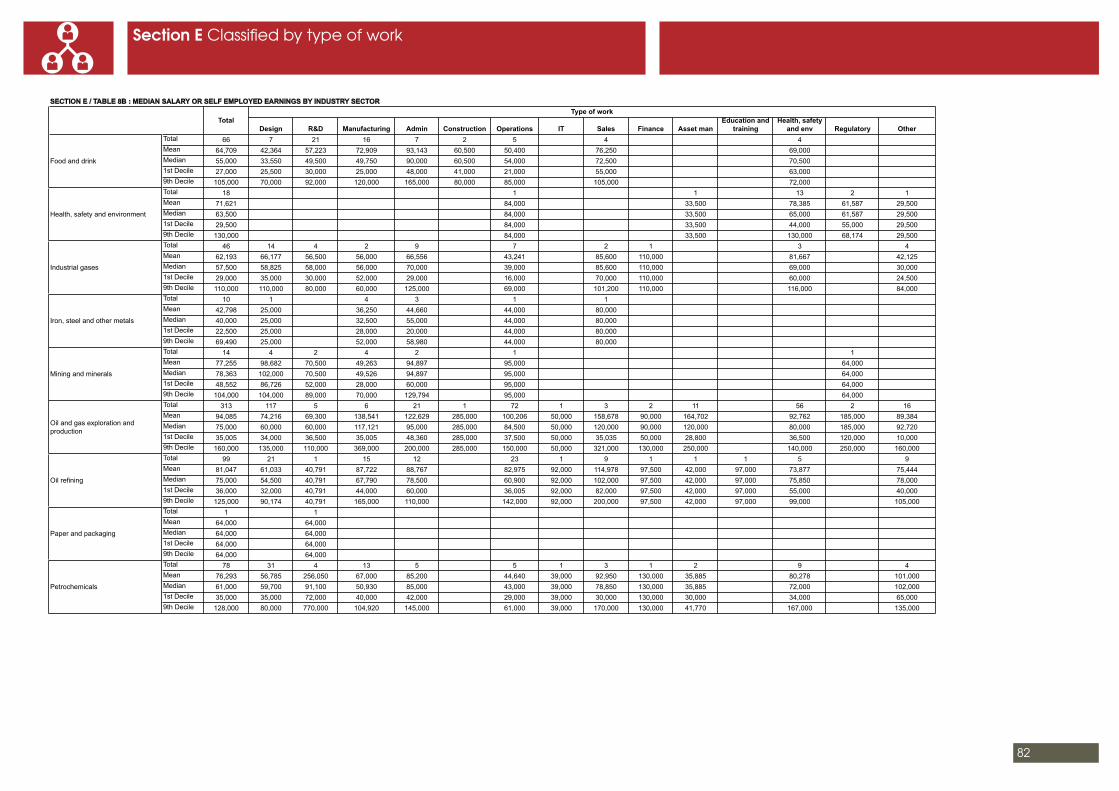
Section E Classified by type of work
SECTION E / TABLE 8B : MEDIAN SALARY OR SELF EMPLOYED EARNINGS BY INDUSTRY SECTOR
Design R&D Manufacturing Admin Construction Operations IT Sales Finance Asset manEducation and
trainingHealth, safety
and env Regulatory OtherTotal 66 7 21 16 7 2 5 4 4Mean 64,709 42,364 57,223 72,909 93,143 60,500 50,400 76,250 69,000Median 55,000 33,550 49,500 49,750 90,000 60,500 54,000 72,500 70,5001st Decile 27,000 25,500 30,000 25,000 48,000 41,000 21,000 55,000 63,0009th Decile 105,000 70,000 92,000 120,000 165,000 80,000 85,000 105,000 72,000Total 18 1 1 13 2 1Mean 71,621 84,000 33,500 78,385 61,587 29,500Median 63,500 84,000 33,500 65,000 61,587 29,5001st Decile 29,500 84,000 33,500 44,000 55,000 29,5009th Decile 130,000 84,000 33,500 130,000 68,174 29,500Total 46 14 4 2 9 7 2 1 3 4Mean 62,193 66,177 56,500 56,000 66,556 43,241 85,600 110,000 81,667 42,125Median 57,500 58,825 58,000 56,000 70,000 39,000 85,600 110,000 69,000 30,0001st Decile 29,000 35,000 30,000 52,000 29,000 16,000 70,000 110,000 60,000 24,5009th Decile 110,000 110,000 80,000 60,000 125,000 69,000 101,200 110,000 116,000 84,000Total 10 1 4 3 1 1Mean 42,798 25,000 36,250 44,660 44,000 80,000Median 40,000 25,000 32,500 55,000 44,000 80,0001st Decile 22,500 25,000 28,000 20,000 44,000 80,0009th Decile 69,490 25,000 52,000 58,980 44,000 80,000Total 14 4 2 4 2 1 1Mean 77,255 98,682 70,500 49,263 94,897 95,000 64,000Median 78,363 102,000 70,500 49,526 94,897 95,000 64,0001st Decile 48,552 86,726 52,000 28,000 60,000 95,000 64,0009th Decile 104,000 104,000 89,000 70,000 129,794 95,000 64,000Total 313 117 5 6 21 1 72 1 3 2 11 56 2 16Mean 94,085 74,216 69,300 138,541 122,629 285,000 100,206 50,000 158,678 90,000 164,702 92,762 185,000 89,384Median 75,000 60,000 60,000 117,121 95,000 285,000 84,500 50,000 120,000 90,000 120,000 80,000 185,000 92,7201st Decile 35,005 34,000 36,500 35,005 48,360 285,000 37,500 50,000 35,035 50,000 28,800 36,500 120,000 10,0009th Decile 160,000 135,000 110,000 369,000 200,000 285,000 150,000 50,000 321,000 130,000 250,000 140,000 250,000 160,000Total 99 21 1 15 12 23 1 9 1 1 1 5 9Mean 81,047 61,033 40,791 87,722 88,767 82,975 92,000 114,978 97,500 42,000 97,000 73,877 75,444Median 75,000 54,500 40,791 67,790 78,500 60,900 92,000 102,000 97,500 42,000 97,000 75,850 78,0001st Decile 36,000 32,000 40,791 44,000 60,000 36,005 92,000 82,000 97,500 42,000 97,000 55,000 40,0009th Decile 125,000 90,174 40,791 165,000 110,000 142,000 92,000 200,000 97,500 42,000 97,000 99,000 105,000Total 1 1Mean 64,000 64,000Median 64,000 64,0001st Decile 64,000 64,0009th Decile 64,000 64,000Total 78 31 4 13 5 5 1 3 1 2 9 4Mean 76,293 56,785 256,050 67,000 85,200 44,640 39,000 92,950 130,000 35,885 80,278 101,000Median 61,000 59,700 91,100 50,930 85,000 43,000 39,000 78,850 130,000 35,885 72,000 102,0001st Decile 35,000 35,000 72,000 40,000 42,000 29,000 39,000 30,000 130,000 30,000 34,000 65,0009th Decile 128,000 80,000 770,000 104,920 145,000 61,000 39,000 170,000 130,000 41,770 167,000 135,000
Iron, steel and other metals
TotalType of work
Food and drink
Health, safety and environment
Industrial gases
Mining and minerals
Oil and gas exploration and production
Oil refining
Paper and packaging
Petrochemicals
82

Section E Classified by type of work
83
SECTION E / TABLE 8C : MEDIAN SALARY OR SELF EMPLOYED EARNINGS BY INDUSTRY SECTOR Cont'd
Design R&D Manufacturing Admin Construction Operations IT Sales Finance Asset manEducation and
trainingHealth, safety
and env Regulatory OtherTotal 91 10 15 30 17 2 7 1 1 1 3 2 2Mean 61,083 48,550 56,826 50,829 54,004 31,000 54,571 742,712 57,000 46,000 52,667 99,995 65,000Median 47,000 39,000 48,000 49,000 45,800 31,000 34,000 742,712 57,000 46,000 62,000 99,995 65,0001st Decile 30,000 28,500 35,500 31,150 36,000 30,000 25,000 742,712 57,000 46,000 30,000 79,990 50,0009th Decile 88,000 86,000 90,000 74,500 88,000 32,000 190,000 742,712 57,000 46,000 66,000 120,000 80,000Total 14 3 2 5 1 2 1Mean 130,689 88,163 194,500 62,000 40,000 60,575 705,000Median 68,000 103,490 194,500 48,000 40,000 60,575 705,0001st Decile 34,000 51,000 187,000 30,000 40,000 39,150 705,0009th Decile 202,000 110,000 202,000 144,000 40,000 82,000 705,000Total 21 3 7 4 2 2 1 1 1Mean 57,475 33,352 46,209 60,716 85,500 105,300 36,000 97,000 26,000Median 58,000 36,000 58,000 63,719 85,500 105,300 36,000 97,000 26,0001st Decile 26,000 28,000 10,000 38,126 31,000 91,000 36,000 97,000 26,0009th Decile 97,000 36,057 66,000 77,300 140,000 119,600 36,000 97,000 26,000Total 57 29 4 3 5 1 2 4 3 1 5Mean 58,448 52,366 43,392 37,656 98,190 70,000 44,096 69,375 103,667 53,850 46,979Median 54,000 50,500 42,500 36,768 88,000 70,000 44,096 68,250 61,000 53,850 41,0671st Decile 34,000 34,000 34,567 28,200 80,000 70,000 28,192 45,000 55,000 53,850 33,0009th Decile 80,700 74,000 54,000 48,000 148,000 70,000 60,000 96,000 195,000 53,850 72,500Total 37 15 1 6 1 3 2 4 3 2Mean 49,521 41,908 79,200 38,250 35,000 69,333 46,550 55,750 45,283 100,000Median 45,000 45,000 79,200 39,000 35,000 52,000 46,550 63,500 35,595 100,0001st Decile 30,000 28,000 79,200 30,000 35,000 46,000 32,100 31,000 30,800 100,0009th Decile 79,200 55,000 79,200 45,000 35,000 110,000 61,000 65,000 69,454 100,000Total 17 6 3 3 2 1 2Mean 58,691 40,917 52,383 64,033 76,500 28,000 111,000Median 58,000 40,000 54,150 61,600 76,500 28,000 111,0001st Decile 30,000 30,000 37,000 58,500 60,000 28,000 95,0009th Decile 95,000 58,000 66,000 72,000 93,000 28,000 127,000Total 49 19 3 5 5 2 2 10 1 2Mean 56,903 46,765 53,000 38,000 111,020 41,300 33,000 74,500 40,000 31,000Median 45,000 48,000 57,000 40,000 58,000 41,300 33,000 77,500 40,000 31,0001st Decile 27,000 29,000 27,000 18,000 36,500 14,600 25,000 32,000 40,000 30,0009th Decile 105,000 69,000 75,000 47,000 319,000 68,000 41,000 116,500 40,000 32,000Total 26 1 5 1 2 2 1 2 11 1Mean 52,195 46,700 53,600 33,000 67,750 51,705 135,000 55,500 39,860 86,000Median 45,555 46,700 48,000 33,000 67,750 51,705 135,000 55,500 36,000 86,0001st Decile 31,086 46,700 40,000 33,000 41,000 44,410 135,000 47,000 31,036 86,0009th Decile 90,000 46,700 90,000 33,000 94,500 59,000 135,000 64,000 49,500 86,000Total 17 1 1 4 4 3 1 1 1 1Mean 54,658 62,000 59,000 35,500 67,673 80,000 38,500 20,000 75,000 22,000Median 59,000 62,000 59,000 35,500 67,345 75,000 38,500 20,000 75,000 22,0001st Decile 22,000 62,000 59,000 29,000 58,000 70,000 38,500 20,000 75,000 22,0009th Decile 78,000 62,000 59,000 42,000 78,000 95,000 38,500 20,000 75,000 22,000Total 78 39 4 1 8 11 6 8 1Mean 50,706 44,592 61,200 39,000 65,250 44,468 69,380 57,438 45,283Median 45,100 42,000 42,000 39,000 55,000 41,000 59,390 55,775 45,2831st Decile 28,500 28,500 30,800 39,000 42,000 25,150 45,000 29,450 45,2839th Decile 80,000 65,000 130,000 39,000 120,000 65,000 120,000 105,000 45,283Total 87 11 8 13 10 2 9 1 6 1 7 3 16Mean 61,917 61,879 58,969 68,232 69,678 72,500 59,222 49,000 53,917 100,000 52,542 43,783 62,559Median 55,000 60,180 46,500 44,000 55,000 72,500 42,000 49,000 49,000 100,000 49,000 34,000 59,8761st Decile 28,000 42,000 14,000 29,254 39,390 55,000 27,000 49,000 23,500 100,000 28,000 32,350 25,0009th Decile 109,000 86,000 165,000 115,000 146,500 90,000 130,000 49,000 102,000 100,000 84,292 65,000 96,500
Power generation and nuclear decommissioning
TotalType of work
Pharmaceuticals and personal care products
Plastics
Power generation and fossil fuels
Other
Power generation and nuclear generation
Power generation and renewables
Process plant and equipment
Public sector
Waste management
Water
Start your professional development journey
Gain instant access to the exclusive member benefits
Be recognised and rewarded for your success
www.icheme.org/joinnow
Find your nearest IChemE office:
www.icheme.org/contactus
Contact the membership team:
IChemE is a registered charity in England and Wales, and a charity registered in Scotland (SC039661)
www.icheme.org
Editorial by Trish Dwyer. Design by Shelley Lander.
Global headquartersUK – Rugby t: +44 (0)1788 578214 e: [email protected]
Australiat: +61 (0)3 9642 4494e: [email protected]
Malaysia t: +603 2283 1381e: [email protected]
New Zealandt: +64 (4)473 4398e: [email protected]
Singaporet: +65 6471 5043 e: [email protected]
UK – London t: +44 (0)20 7927 8200 e: [email protected]
IChemE offies
www.icheme.org
IChemE is a registered charity in England and Wales (214379) and a charity registered in Scotland (SC 039661)
1394_16