salary and compensation study for
TRANSCRIPT

1
2
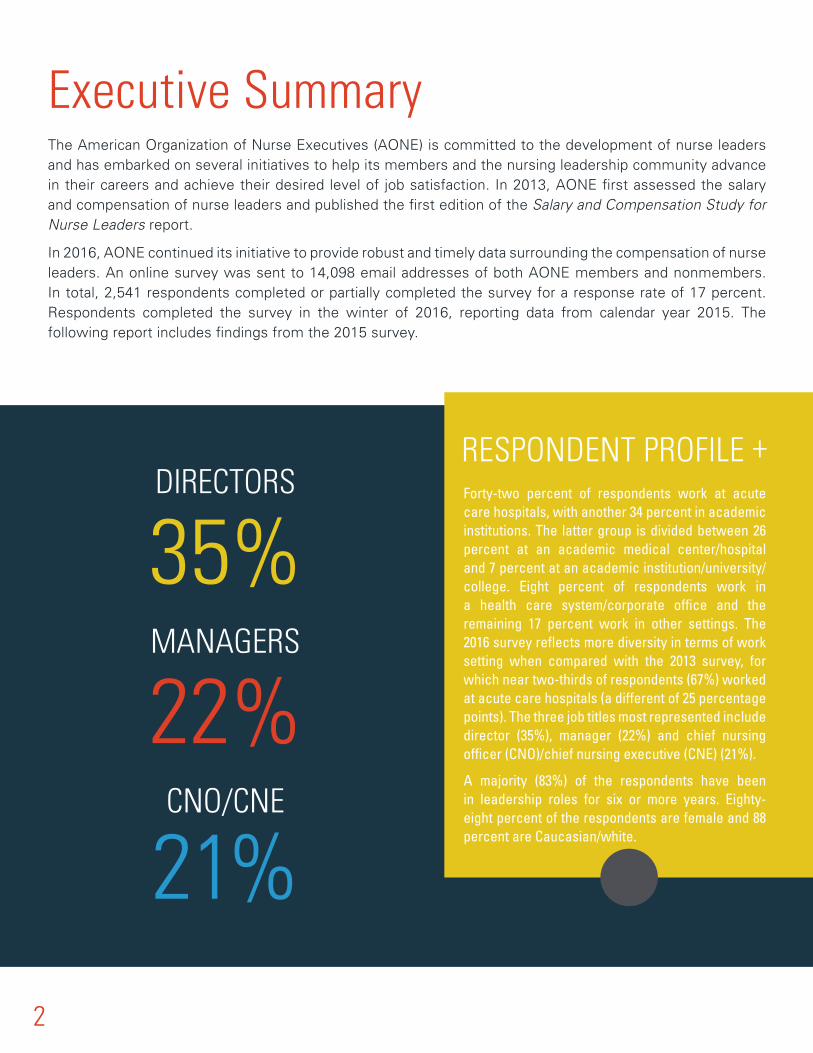
The American Organization of Nurse Executives (AONE) is committed to the development of nurse leaders and has embarked on several initiatives to help its members and the nursing leadership community advance in their careers and achieve their desired level of job satisfaction. In 2013, AONE first assessed the salary and compensation of nurse leaders and published the first edition of the Salary and Compensation Study for Nurse Leaders report.
In 2016, AONE continued its initiative to provide robust and timely data surrounding the compensation of nurse leaders. An online survey was sent to 14,098 email addresses of both AONE members and nonmembers. In total, 2,541 respondents completed or partially completed the survey for a response rate of 17 percent. Respondents completed the survey in the winter of 2016, reporting data from calendar year 2015. The following report includes findings from the 2015 survey.
Executive Summary
Forty-two percent of respondents work at acute care hospitals, with another 34 percent in academic institutions. The latter group is divided between 26 percent at an academic medical center/hospital and 7 percent at an academic institution/university/college. Eight percent of respondents work in a health care system/corporate office and the remaining 17 percent work in other settings. The 2016 survey reflects more diversity in terms of work setting when compared with the 2013 survey, for which near two-thirds of respondents (67%) worked at acute care hospitals (a different of 25 percentage points). The three job titles most represented include director (35%), manager (22%) and chief nursing officer (CNO)/chief nursing executive (CNE) (21%).
A majority (83%) of the respondents have been in leadership roles for six or more years. Eighty-eight percent of the respondents are female and 88 percent are Caucasian/white.
DIRECTORS
35%MANAGERS
22%CNO/CNE
21%
RESPONDENT PROFILE +

33
Salary Distribution
Total Percentage
Cumulative Percentage
Under $60,000 2% 2%
$60,000 – $69,999 1% 3%
$70,000 – $79,999 4% 7%
$80,000 – $89,999 6% 12%
$90,000 – $99,999 8% 20%
$100,000 – $109,999 10% 30%
$110,000 – $119,999 9% 39%
$120,000 – $129,999 8% 47%
$130,000 – $139,999 8% 55%
$140,000 – $149,999 7% 62%
$150,000 – $159,999 6% 68%
$160,000 – $169,999 5% 73%
$170,000 – $179,999 4% 77%
$180,000 – $189,999 4% 81%
$190,000 – $199,999 3% 84%
$200,000 – $209,999 3% 87%
$210,000 – $219,999 1% 88%
$220,000 – $229,999 2% 90%
$230,000 – $239,999 1% 91%
$240,000 – $249,999 2% 92%
$250,000 or more 7% 100%
n 2,143 2,143
FIGURE 1: OVERALL SALARY RANGES (ANNUALLY) +
Q: What is your current annual base salary (excluding additional income and bonus money)?
SalariesAs shown in Figure 1, annual salaries from responding nurse leaders vary largely, with half falling between $90,000 and $149,999. Of the rest, 12 percent earn less than $90,000 and the remaining respondents (38%) earn $150,000 or more, broken down as follows: 15 percent earn between $150,000 and $179,999, 13 percent earn between $180,000 and $229,999, and 10 percent earn $230,000 or more (Figure 1). These findings are consistent with salary information collected in the 2013 study.
The survey also details salary level as it correlates with years of leadership experience. The 10-year mark appears to be the tipping point for higher salaries for nurse leaders. Two-thirds of respondents with 10 years of leadership experience or less report an annual salary lower than $130,000. Respondents who have been leaders for more than 10 years make corresponding higher salaries–60 percent of those with 11 to 20 years of leadership experience earn $130,000 or more, as do 74 percent of those with 20 or more years of experience.
Not surprisingly, nurse leaders with senior-level titles earn higher incomes than do other nurse leaders. Directors and managers are most likely to earn between $100,000 and $159,999 annually, with 69 percent and 51 percent falling into that range, respectively. It is noteworthy that only 2 percent of directors and 11 percent of managers have annual salaries of less than $80,000 (Figure 2).
For non-system CNOs, more than half (58%) earn between $100,000 and $199,999. Nearly a quarter of them (23%) earn between $200,000 and $249,999, while 17 percent earn $250,000 or more. Predictably, system CNOs tend to earn higher salaries than their non-system counterparts, with more than half (52%) earning $250,000 or more.
Other non-system C-suite titles show a similar pattern, with 48 percent of those identifying as chief executive officers (CEOs), chief operating officers (COOs), chief financial officers (CFOs), chief information officers (CIOs) or chief nursing informatics officers (CNIOs) earning between $100,000 and $199,999 (Figure 2), 21 percent earning between $200,000 and $249,999, and nearly a quarter (24%) earning $250,000 or more.
Clinical staff are the most likely to be at the lower end of the salary scale with 41 percent earning $80,000 or more annually. This is followed by academic respondents (professors or deans) and specialists/coordinators (71% and 77%, respectively) earning $80,000 or more annually.

4
Total Salary CNO/CNE (non-system)
CNO/CNE (system)
Consultant Director Manager President/ VP
Professor/ Dean
Specialist/ Coordinator
Under $60,000 0% 0% 5% 0% 0% 0% 8% 6%
$60,000 - $69,999 0% 0% 1% 1% 3% 1% 7% 5%
$70,000 - $79,999 1% 1% 1% 1% 7% 0% 14% 11%
$80,000 - $89,999 1% 2% 6% 3% 14% 0% 15% 14%
$90,000 - $99,999 1% 0% 5% 5% 21% 0% 13% 19%
$100,000 - $109,999 3% 3% 8% 10% 18% 1% 8% 14%
$110,000 - $119,999 3% 4% 6% 12% 14% 4% 7% 11%
$120,000 - $129,999 6% 1% 4% 13% 8% 2% 4% 8%
$130,000 - $139,999 5% 0% 10% 14% 6% 4% 1% 4%
$140,000 - $149,999 6% 1% 8% 11% 4% 4% 1% 1%
$150,000 - $159,999 8% 1% 14% 9% 2% 7% 7% 1%
$160,000 - $169,999 7% 4% 1% 6% 1% 9% 1% 1%
$170,000 - $179,999 5% 0% 8% 5% 1% 6% 3% 4%
$180,000 - $189,999 8% 1% 1% 3% 1% 9% 4% 0%
$190,000 - $199,999 7% 8% 3% 3% 0% 8% 0% 0%
$200,000 - $209,999 7% 4% 8% 2% 0% 12% 3% 0%
$210,000 - $219,999 4% 2% 1% 1% 0% 4% 0% 0%
$220,000 - $229,999 5% 2% 0% 0% 0% 4% 0% 0%
$230,000 - $239,999 3% 2% 0% 0% 0% 2% 0% 0%
$240,000 - $249,999 4% 8% 0% 0% 0% 4% 1% 0%
$250,000 or more 17 % 52% 6% 0% 0% 20% 1% 0%
n 464 90 77 751 481 158 72 79
FIGURE 2: SALARY BY JOB TITLE (TOP EIGHT JOB TITLES SHOWN)*
Q: What is your current base salary (excluding additional income and bonus money)?

5
Salary by Employer Type and Geographic RegionThe AONE survey found that nurse leader salaries are similar across employer types. With the exception of nurse leaders employed at consulting firms and at health care systems/corporate offices, the majority in each setting earn salaries between $70,000 and $149,999 (68% for academic institutions, 58% for academic medical centers, 58% for acute care hospitals, 80% for ambulatory care facilities, 69% for military/VA/government facilities, and 78% for rural/critical access hospitals). The survey found that more than half of nurse leaders employed by consulting firms (55%) garner salaries of $150,000 or more. Nurse leaders employed by health systems/corporate offices are most likely (19%) to earn the highest salaries, at $250,000 or more, followed by academic medical centers or hospitals (9%). Respondents who work at an academic institution, university or college are most likely to have the lowest salaries with 41 percent earning less than $100,000 annually. Nurses employed in ambulatory care facilities (39%), military/VA/government facilities (24%) and rural/critical access hospitals (23%) were also likely to have salaries of $100,000 or less (Figure 3).
Among the nine AONE geographic regions, Region 9 (Alaska, California, Hawaii, Nevada, Oregon and Washington) has the greatest percentage of respondents (62%) earning $150,000 or more. This is followed by the New England states in Region 1 (Connecticut, Maine, Massachusetts, New Hampshire, Rhode Island and Vermont). Nearly half (45%) of all the nurse leaders in Region 1 earn $150,000 or more. The lowest percentage of high-earning nurse leaders ($150,000 or more, 27%) work in Region 5 (Ohio, Indiana, Illinois, Michigan and Wisconsin).
Bonus AwardsTwo-thirds (66%) of respondents said they were currently eligible for an incentive or bonus award. Nurse leaders with higher salaries and greater management responsibilities were more likely to be eligible—the tipping point appears to be $90,000.
That said, some proportion of nurse leaders in each job title, including clinical staff, indicate they were eligible for a bonus. Those with more senior titles are more likely to receive bonuses. In the case of non-discretionary bonuses, nurse leaders with C-suite titles were most likely to be eligible (ranges from 53% to 66%), followed by directors (54%), managers (44%), consultants (31%), APRNs (25%), clinical staff (25%), specialist/coordinators (24%) and professors/deans (5%) (Figure 4).
The majority (61%) of respondents received an incentive or bonus in 2015. Of those who received a bonus, organization financial performance was listed by 71 percent as a contributing factor, followed by clinical performance measures (64%) and customer or patient satisfaction (51%). Nearly half, 49 percent, said the bonus was 7.5 percent or less of their base salary. Only 13 percent of nurse leaders indicated the bonuses were more than 20 percent of their salary (Figure 5).
VERY SATISFIED
40%SOMEWHAT SATISFIED
41%
FIND JOY/MEANING IN WORK
47%
Overall Job Satisfaction

6
FIGURE 3: SALARY DISTRIBUTION BY EMPLOYER *
Total Salary Academic institution
Academic medical center
Acute care hospital
Ambulatory care facility
Consulting firm
System/ Corporate office
Military/VA/ Government
Rural/Critical access hospital
Under $60,000 5% 1% 1% 0% 2% 2% 0% 3%
$60,000 - $69,999 5% 1% 1% 6% 0% 1% 5% 0%
$70,000 - $79,999 9% 2% 4% 3% 0% 3% 5% 5%
$80,000 - $89,999 12% 5% 5% 16% 5% 5% 2% 8%
$90,000 - $99,999 11% 6% 10% 13% 3% 7% 12% 7%
$100,000 - $109,999 10% 11% 9% 16% 5% 5% 14% 17%
$110,000 - $119,999 7% 9% 9% 19% 7% 10% 7% 9%
$120,000 - $129,999 8% 8% 8% 10% 5% 5% 14% 8%
$130,000 - $139,999 7% 10% 7% 0% 10% 5% 5% 15%
$140,000 - $149,999 4% 7% 6% 3% 7% 6% 10% 9%
$150,000 - $159,999 4% 6% 6% 0% 10% 9% 14% 9%
$160,000 - $169,999 4% 5% 5% 6% 0% 3% 5% 4%
$170,000 - $179,999 3% 4% 3% 3% 13% 4% 0% 1%
$180,000 - $189,999 3% 4% 4% 0% 10% 3% 5% 1%
$190,000 - $199,999 1% 4% 4% 3% 0% 5% 0% 1%
$200,000 - $209,999 3% 2% 4% 0% 12% 2% 0% 0%
$210,000 - $219,999 0% 1% 2% 0% 2% 2% 0% 0%
$220,000 - $229,999 2% 1% 3% 0% 0% 1% 0% 1%
$230,000 - $239,999 0% 2% 1% 0% 0% 1% 0% 0%
$240,000 - $249,999 1% 2% 2% 0% 0% 3% 0% 0%
$250,000 or more 2% 9% 6% 0% 8% 19% 2% 0 %
n 155 554 910 31 60 175 42 75
Q: What is your current annual base salary (excluding additional income and bonus money)?

7
FIGURE 4: ELIGIBLE FOR INCENTIVE OR BONUS AWARDS BY TITLE*
Q: Are you currently eligible for an incentive or bonus award?
Q: How large was your total bonus award (discretionary and non-discretionary) as a percentage of your 2015 base salary? (n = 2,148)
FIGURE 5: 2015 BONUS AWARD AS A PERCENTAGE OF BASE SALARY
14% 12% 12% 14%9% 11% 10% 10% 6% 6% 7%
66%63%
59% 53%54%
44%
31%25%
24% 25%
5%
7%8%
8%10%
5%
5%
9%12%
5% 4
5%
12%15% 21% 23%
29%37%
45% 4962%
49%76%
2% 3% 4% 4% 3% 3%
16%7%
0%
10%
20%
30%
40%
50%
60%
70%
80%
90%
100%
President/VP CNO/CNE(non-system)
CNO/CNE(non-system)
Other C-suite(non-system)(n = 159)
(n = 89) (n = 464) (n = 70)
Director(n = 758) (n = 486) (n = 77) (n = 59)
(n = 78)(n = 51)
(n = 74)
Manager Consultant APRN Clinical StaffSpecialist|Coordinator
Professor/Dean
Yes, non-discretionaryYes, discretionary UnsureEligible for both Not eligible
21%19%
9%
13%
22%
10%
3% 3%
1% – 2.5% 2.6% – 5% 5.1% – 7.5% 7.6% – 10% 10.1% – 20% 20.1% – 30% 20.1% – 30% Not Sure

8
40%
25%
35%41%
34%37%
14%
24%20%
4%
Your job overall(n= 2,023)
Your compensation(n= 2,025)
5, very satisfied
Your benefits(n= 2,020)
12%6%
1%5%
2%
4 3 2 1, not at all satistfied
FIGURE 6: JOB AND COMPENSATION SATISFACTION *
Job SatisfactionOverall job satisfaction is high among nurse leaders, with 81 percent rating their satisfaction on a five-point scale as either “5, very satisfied” (40%) or “4, somewhat satisfied” (41%). When asked why they choose to stay in their current job, the top response (47%) is, “I find joy and meaning in my work.”
However, respondents indicate they are less satisfied with their benefits and compensation. The percentage of nurse leaders highly satisfied with benefits is just over one-third (35%) and only one-quarter (25%) are highly satisfied with their compensation. However, combining the categories of very satisfied and somewhat satisfied, nurse leaders seem generally satisfied with benefits (72% very or somewhat satisfied) and compensation (59% very or somewhat satisfied) (Figure 6).
When the job satisfaction results are analyzed by title, the pattern is repeated. System CNOs and non-system CNOs are generally satisfied with their jobs overall, with 83 and 85 percent respectively stating they are somewhat or very satisfied. However, fewer of these nurse leaders report being happy with their compensation–65 percent of non-system CNOs say they are somewhat or very satisfied with pay, while 63 percent of system CNOs report the same. In fact, four other nurse leader titles had a lower percentage of respondents in the very or somewhat satisfied categories compared with the overall average for compensation: manager (50%), specialist/coordinator (52%) and professor/dean (35%) (Figure 7).
Overall, those with the title of president/vice president were most satisfied with aspects of their job—except for job security, where they were second-most satisfied (75%). In job security, specialists/coordinators took the top spot (79%). In general, professors/deans were the least satisfied with aspects of their job, with compensation the most problematic category (just 35% very or somewhat satisfied).
Similarly, most respondents felt that their organizations treat nursing in a way that’s equal to other, non-nursing departments. While a majority of nurse leaders in all titles are very or somewhat satisfied with the level of equal treatment that they experience compared with non-nursing departments, this percentage hovers at or below 70 percent. The only respondent title expressing a higher percentage of satisfaction in this regard is president/vice president (74%). Professors/deans have the lowest percentage of respondents satisfied with equal treatment of nursing (38%) followed by managers (52%).
Other aspects of the nursing leader’s job that received high satisfaction scores across job titles were relationships with co-workers and finding joy and meaning in work. (Figure 7).
Q: How satisfied or dissatisfied are you with the following aspects of your job?

9
Percent of 4 and 5, somewhat or very satisfied
CNO/CNE (non-system)
CNO/CNE (system)
Consultant Director Manager President/ VP
Professor/ Dean
Specialist/ Coordinator
Job overall 85% 83% 84% 82% 76% 87% 72% 78%
Compensation 65% 63% 59% 62% 50% 77% 35% 52%
Benefits 74% 72% 70% 72% 73% 80% 64% 65%
Industry work 92% 94% 89% 93% 88% 95% 91% 92%
Areas of responsibility
86% 89% 79% 81% 77% 87% 79% 79%
Amount of authority 84% 79% 71% 80% 69% 82% 58% 56%
Opportunity for growth
69% 67% 55% 67% 62% 70% 57% 54%
Job security 72% 74% 66% 74% 73% 75% 72% 79%
Relationship with supervisor
82% 76% 76% 79% 75% 82% 64% 81%
Relationship co-workers
90% 85% 83% 90% 90% 92% 76% 80%
Relationship with direct reports
96% 98% 78% 92% 93% 97% 75% 84%
Equal treatment with other, non-nursing departments
67% 68% 59% 66% 52% 74% 38% 55%
Joy and meaning 85% 84% 81% 82% 73% 86% 78% 78%
n 453 82 75 704 446 152 72 74
FIGURE 7: SATISFACTION WITH ASPECTS OF JOB BY TITLE
Q: How satisfied or dissatisfied are you with the following aspects of your job?
10
ConclusionThe nursing profession is quite diverse, and these survey results underscore that fact. At the same time, there is enough commonality among nurse leaders that key themes and core trends emerge from the data. The full study describes these and other characteristics in detail. Additionally, the descriptive study will provide information related to other components of a nursing leadership career, including employer benefits, job satisfaction and personal fulfillment.Supporting data, including data tables and charts for information included in this executive summary, are available in the full report.
We thank you for your support and trust you will find this information to be valuable to your work in nursing leadership.
Like all surveys, there are multiple sources of potential errors that exist beyond sampling error, such as measurement bias and survey non-response. These factors should be considered in the interpretation of the results. The researchers have taken careful steps to eliminate and/or minimize survey errors where possible and the margin of error for responses is +/- 1.77 at a confidence level of 95 percent.
In some instances, participants were given the opportunity to select more than one response. In these cases, the corresponding charts and graphs have been noted with an asterisk (*). Additionally, percentages have been rounded to the nearest whole number. In cases where rounding has occurred, percent totals may not equal 100 percent and have been noted with a plus sign (+).
Data for this survey and corresponding reports were collected confidentially and have been shared throughout in aggregate form. The collection of data and presentation in this report follows the safety zone requirements described in the Statement of Department of Justice and Federal Trade Commission Enforcement Policy on provider participation in exchanges of price and cost information.
American Organization of Nurse Executives
155 N Wacker Drive, Suite 400 Chicago, IL 60606
www.aone.org
© Copyright 2016, by the American Organization
of Nurse Executives. All rights reserved.
Preferred Citation
APA: AONE. (2016). Salary and Compensation Study for Nurse Leaders - Executive Summary (2nd ed., Rep.). Chicago, IL: American Organization of Nurse Executives.
MLA: AONE. Salary and Compensation Study for Nurse Leaders - Executive Summary. Rep. 2nd ed. Chicago: American Organization of Nurse Executives, 2016. Print.