safety research and reactor technology (ief-6)
TRANSCRIPT

Scientific Report 2008
Institute for Energy Research- Safety Research and Reactor Technology (IEF-6)
Safety Research for Nuclear Reactors
Page 1 of 34

Page 2 of 34
Contents: page
Deep burn-up and transmutation of plutonium for a selected HTGR reference design Ch. Pohl, H. J. Rütten, K. Nünighoff, K. Haas
3
Optimisation of Neutron Physical and Thermodynamic Simulation Processes by Analysing Direct and Iterative Solvers for Nonsymmetric Sparse Linear Systems C. Druska, S. Kasselmann, K. Nünighoff
6
Verification of MGT by simulating dynamic experiments at AVR and comparison with TINTE K. Nünighoff, C. Druska, S. Kasselmann
9
Development of a new data analysis and visualization software for the reactor dynamics code MGT S. Kasselmann, K. Nünighoff, S. Scholthaus, C. Druska
12
Studies on combined heat pipe/catalyst elements for hydrogen control in nuclear power plants Ch. Granzow, E.-A. Reinecke, T. Nohner, T. Zimmermann, H.-J. Allelein
14
Thermohydraulic analysis of the wet storage of spent fuel at the ILL research reactor with CFD J. Baggemann, St. Kelm, H. Guyon, W. Jahn, H.-J. Allelein
17
Study of the Burnup Behavior, Safety Characteristics and Transmutation Performance of the LWRs with Innovative Fuel Concepts R. Nabbi, H.-J. Allelein, W. von Lensa, O. Schitthelm
20
Kopplung des Monte-Carlo-Codes MCNP und des Aktivierungscodes FISPACT mit automatischer Visualisierung P. Bourauel, R. Nabbi, W. Biel, R. Forrest
29
Monte-Carlo-based simulation of LWR cores with innovative fuel concepts R. Nabbi, H.-J. Allelein, O. Schitthelm, D. F. da Cruz
32
Deep burn-up and transmutation of plutonium for a selected HTGR reference design
Ch. Pohl, H. J. Rütten, K. Nünighoff, K. Haas
Institute for Energy Research - Safety Research and Reactor Technology (IEF-6), Forschungszentrum Jülich
Corresponding author: [email protected]
Abstract: This article comprises results of equilibrium core calculations for a simplified HTGR (high tem-perature gas cooled reactor) based on the PBMR reactor design with a pure plutonium oxide fuel (first genera-tion plutonium of a light water reactor). Different aspects were investigated as isotope compositions of pluto-nium, minor actinides and fission products in the equilibrium core and the discharged fuel, temperature reac-tivity coefficients for different core conditions, fuel temperatures and control rod worth. Additional some safety aspects of the fuel were discussed. The results give an impression of the high fuel burn-up of about 674 GWd/tHM and the related safety aspects which not satisfy the typical safety conditions of nuclear reactors. Further calculations will show an optimisation to a thorium/plutonium oxide fuel and a high burn-up in relation to the safety aspects. These calculations were done as part of the PUMA project (plutonium and minor actinides management in thermal high temperature reactors) of the EU FP6 program which focus on demonstrating the full potential of HTRs to transmute/utilise Pu/MA fuel.
Introduction The use of nuclear energy is strongly connected with plutonium and minor actinides and their influence on final high active waste disposal and the proliferation problem of weapon grade material. To minimise both aspects a promising concept is the combination of LWRs (light water reactor) and HTGR (high temperature gas cooled reactor). This gives the opportunity for deep burn-up of the resulting plutonium from LWR and a partial transmutation of plutonium and minor actinide isotopes. To investigate the range of achievable burn-up and iso-tope compositions with respect to high safety characteris-tics of the reactor design a reference design of an HTGR with typical global parameters was studied with the pro-gram code V.S.O.P.(99/05) as part of the EU FP6 PUMA program [1]. Code design and fuel compositions The considered PUMA reference HTGR [2] is a graphite moderated helium cooled pebble bed design with an an-nular core of 1x11 m, a central moderator of 2 m in di-ameter and a thermal power of 400 MW, based on the PBMR reactor design. For the pebble bed a simplified 5 channel flow scheme is assumed without a cone at the lower end of the core. The helium cooling system is con-figured with 90 bar coolant system pressure, 192.7 kg/s mass flow, 500 °C inlet and 900 °C outlet temperature. Coolant bypass flows were not taken into account. For the fuel pure plutonium oxide is considered (2.59 % Pu-238, 53.85 % Pu-239, 23.66 % Pu-240, 13.13 % Pu-241 and 6.78 % Pu-242) which is equivalent to the first gen-eration plutonium of a LWR. A heavy metal load of 2 g for the standard 6 cm in diameter pebbles is assumed. The equilibrium conditions were achieved for a residence time of the pebbles in the core of 1536.5 days
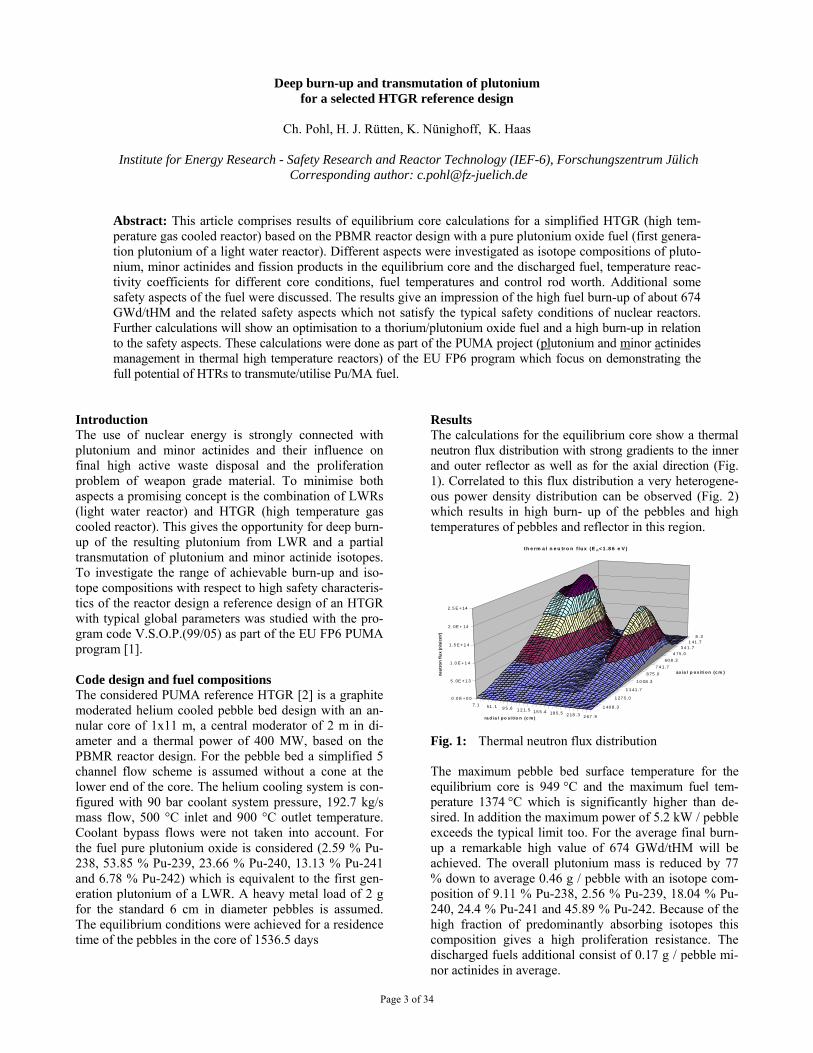
Results The calculations for the equilibrium core show a thermal neutron flux distribution with strong gradients to the inner and outer reflector as well as for the axial direction (Fig. 1). Correlated to this flux distribution a very heterogene-ous power density distribution can be observed (Fig. 2) which results in high burn- up of the pebbles and high temperatures of pebbles and reflector in this region. Fig. 1: Thermal neutron flux distribution
8 . 31 41 .7
3 4 1. 74 75 .0
60 8 .37 4 1. 7
8 75 .0
1 0 08 .3
1 1 41 .7
1 27 5 .0
1 40 8 .37. 1 51 . 1 9 5 .6 1 2 1. 5 15 5 .4 18 5 .5 2 18 . 3 2 67 . 9
0 .0 E + 0 0
5 . 0E + 1 3
1 .0 E + 1 4
1 .5 E + 1 4
2 . 0E + 14
2. 5 E + 14
neut
ron
flux
(n/s
/cm
²)
ax ia l p o s it i o n (c m )
ra d ia l p o si t io n (c m )
th e rm a l n e u tr o n f lu x (E n< 1 .8 6 e V )
The maximum pebble bed surface temperature for the equilibrium core is 949 °C and the maximum fuel tem-perature 1374 °C which is significantly higher than de-sired. In addition the maximum power of 5.2 kW / pebble exceeds the typical limit too. For the average final burn-up a remarkable high value of 674 GWd/tHM will be achieved. The overall plutonium mass is reduced by 77 % down to average 0.46 g / pebble with an isotope com-position of 9.11 % Pu-238, 2.56 % Pu-239, 18.04 % Pu-240, 24.4 % Pu-241 and 45.89 % Pu-242. Because of the high fraction of predominantly absorbing isotopes this composition gives a high proliferation resistance. The discharged fuels additional consist of 0.17 g / pebble mi-nor actinides in average.
Page 3 of 34

225.
0
308.
3
375.
0
441.
7
508.
3
575.
0
641.
7
708.
3
775.
0
841.
7
908.
3
975.
0
1041
.7
1108
.3
1175
.0
1241
.710 4. 5 12 1. 5 13 8 .5 1 55 .4 1 72 .4
0 .0 0
2. 00
4. 0 0
6 .0 0
8. 00
1 0 .0 0
1 2 .0 0
1 4.00
1 6 .0 0
pow
er d
ensi
ty (W
/cm
³)
ax i al p os iti on (c m )
rad ia l po si tio n (c m )
Fig. 2: Power density distribution At equilibrium condition the core contains an amount of 475.7 kg heavy metal isotopes which consists of 434.1 kg of plutonium isotopes and 41.6 kg of other actinides, mainly Am-241, Am, 243 and Cm-244. According to this a wide range of fission products is present in the core with about 49.8 kg of the important1 fission products. The pebbles were refilled 6 times and then discharged with a rate of 293.9 pebbles per day which is equivalent to the fresh fuel load rate. This implies a load of 587.8 g and a discharge of 135.5 g of plutonium isotopes per day. Safety aspects One safety aspect of the considered fuel is characterized by the change of reactivity with increasing temperature. This safety aspect is described by the temperature reac-tivity coefficient α and was determined for equilibrium core condition HFP (hot full power) and further core conditions as HZP (hot zero power) and CZP (cold zero power). For the HFP a negative value of α = -2.98 pcm/K is achieved. This means with higher temperature the criticality decreases which gives an intrinsic self regulat-ing effect to the reactor as desired. For the other core conditions only a positive α could be determined (CZP: α = 11.75 pcm/K, HZP: α = 1.47 pcm/K) which is in par-ticular for the starting of the reactor not acceptable. This behaviour of the reactivity for HZP and CZP is induced by the fission resonance of Pu-239 and Pu-241 of about 0.3 eV, which is not compensated by a resonance ab-sorber material as U-238 or Th-232. A higher moderator temperature shifts the neutron flux spectrum to a higher energy (Fig. 3) which results in an increasing effective-ness of the fission resonances. With further increase of temperature a compensation of the effect of the fission resonances by the resonance absorption of Pu-2402 and Pu-242 rise up to the situation of the negative tempera-ture reactivity at equilibrium core condition (HFP). An-other safety aspect is the influence of the moderation ratio3 to the reactivity of the reactor. An optimal ratio is obtained at a maximum of the fission to absorp-tion/leakage rate. For an equilibrium core with a modera-tion ratio beside this optimum (under moderated, over 1 because of their higher neutron interaction cross section 2 applied without doppler broadening 3 number of moderator atoms to number of heavy metal atoms
moderated) a dynamic change of the ratio then may be lead to an increase of reactivity. Fig. 3: Change of the in neutron flux spectra in case of water ingress
0.00
0.01
0.10
1.00
0.00 0.01 0.10 1.00 10.00
energy E (eV)
norm
aliz
ed th
erm
al n
eutr
on fl
ux (n
/cm
²/s
1000 °C750 °C500 °C250 °C20 °C
This safety aspect can be determined by a simulation of water ingress to the core which is equivalent to an in-crease of the moderation ratio. In Fig. 4 an increase of the reactivity for a stepwise water ingress up to a partial pressure of 130 bar is shown which is characteristic for an under moderated core. Additional in Fig. 4 the change of reactivity for water ingress for lower heavy metal loads per pebble are given. For a heavy metal load of about 0.75 g / pebble the increase of the reactivity reach their maximum of about 1.47 Nile (HFP) and then again decrease. This behaviour of a only very limited increase of the reactivity is recommended with respect of safety requirements.
Fig. 4: Change of reactivity in case of water ingress Summary These calculations present the high achievable burn-up for a pure plutonium oxide fuel in a HTGR of about 674 GWd/tHM. This is correlated with a significant reduction of the overall plutonium stock (LWR first generation plutonium composition) of about 77 %. Additional a high reduction of the predominantly fissionable plutonium isotopes is achieved which gives a high proliferation re-sistance of the residual plutonium. Because of insuffi-cient safety behaviour of this fuel further modifications
Page 4 of 34

Page 5 of 34
as absorber material or burnable poison in the fuel will be taken into account in future calculations. Outlook Based on this calculations a fuel composition for the HTGR will developed, which combines a high plutonium burn-up with a sufficient safety behaviour. A promising combination for this fuel is a mixture of plutonium oxide and thorium oxide. Additionally some modifications will be investigate to reduce the value of critical parameters
of the core as maximum fuel temperature or maximum power density Acknowledgement The work presented in this article was partly funded by the European Union Sixth Framework Program, under contract no. 036457. References [1] EU FP6 project, Contract Number: 036457 [2] EU FP6 project PUMA, contribution D121

Optimisation of Neutron Physical and Thermodynamic Simulation Processes by Analysing Direct and Iterative Solvers for Nonsymmetric Sparse Linear Systems
C. Druska, S. Kasselmann, K. Nünighoff
Institute of Energy Research - Safety Research and Reactor Technology (IEF-6), Forschungszentrum Jülich
Corresponding author: [email protected] The reactor dynamics program MGT (Multi Group TINTE) is a further development of the TINTE code (Timedependent Nucleonics and Temperatures). The diffusion equations for determining the neutron fields can be formulated in MGT with up to 43 energy groups. TINTE was limited to two energy groups. However, this new approach requires significantly more computing time since the coupled differential equations can now no longer be solved analytically. For this reason, the study aimed to compare new solution procedures for the matrices occurring in MGT with regard to their efficiency and computing time with the solution procedure in use so far.
Objectives By making use of the thermodynamic and chemical feed-back, the TINTE program (TImedependent Nucleonics and TEmperatures, [1]) is able to calculate the neutron fields occurring in two energy groups in two-dimensional r-z geometry. For the calculation of the parameters such as temperature and neutron fluxes, different lattices are defined (see Fig. 1).
Fig. 1: The reactor model as used in MGT with its
different calculation zones.
Current requirements for increased precision and func-tional extensions on the one hand, as well as the demand for the availability of ever higher computing power on the other hand led to the development of a new software called MGT in 2007 (Multi Group TINTE) [2].
First tests with this software quickly showed that due to extended modelling the computing time for reactor-physical simulations increased from a few minutes to many times this period. In an earlier study, calculations were already conducted for different multi-group models using MGT. Here, significant, but not unexpected differ-ences were identified in the results [3]. The desire to use the new software also for parameter studies or model optimisations therefore led to the neces-sity of optimising the existing solver routine for the cou-pled differential equations occurring in MGT. Therefore, direct and iterative solution procedures for sparse linear equation systems as an alternative to the existing solution procedure were compared within the framework of this study. The matrices used for the analysis result from the discretisation in time and space of parabolic partial dif-ferential equations as developed during the calculation of diffusion fluxes and the solution of heat conduction equa-tions. The results of this work were obtained with the energy group numbers 2, 4, 6, 8, 10, 20 and 43. Results The values shown in Fig. 2 for a 43 energy-group calcu-lation were obtained through an analysis of the relative frequency and dimension of matrices occurring within MGT. Of the overall 20 different matrix dimensions, 6 dimensions are independent of the selected energy group number; whereas in each case 2 dimensions depend on this number. Therefore, for each of the seven energy group models exactly 8 different matrix dimensions are obtained.
Page 6 of 34

Fig. 2: Matrix dimensions and relative frequencies
within a 43-energy group calculation.
For the analysis, a representative selection of matrices of all dimensions occurring in MGT was saved from the previous MGT run. The selection of the matrices was made in an unprejudiced manner over the whole time period of the transient. Based on these matrices, different new solution procedures were investigated with regard to their application in MGT. Five procedures eventually proved to be suitable in principle (see legend in Fig. 3). In the first part of the analysis, these five procedures were first investigated in an environment outside of MGT. To this end, the required cpu times were measured for the solution of 1000 matrices each. For the prepara-tion of these measurements, tests of different time meas-uring routines were conducted with respect to the preci-sion and reproducibility of time measurements. Here, the X05BAF() routine from the NAG library was found to be the most suitable one. As a result, it can be established that the BiCGSTAB procedure with incomplete LU de-composition as a pre-conditioner provided the best re-sults for all dimensions (see Fig. 3).
Fig. 3: cpu times for different solvers and matrix
dimensions d > 900. The gain in speed for the ATLAS_BLAS and the BiCGSTAB+ILU(0) solvers is clearly visible.
In the second part of the work, the new solvers were in-tegrated into the MGT program. The results of the indi-vidual tests substantiated the use of the BiCGSTAB pro-cedure and the DGBSV() + ATLAS_BLAS routine. Be-sides these two procedures, the times were additionally determined with the TIBAMA_REF() reference routine and an optimised version TIBAMA_OPT() used for comparative purposes. The two latter procedures are based on the Gaussian elimination procedure reduced to the range of the respective matrix in which the histori-cally caused implementation of the pivoting in TIBAMA_OPT() as opposed to the TIBAMA_REF() routine was eliminated. The measurements of the times of an MGT run with the test transient showed that the iterative BiCGSTAB pro-cedure is not recommendable for program use since in some cases no convergence is obtained and thus no solu-tion of the system could be calculated. The measurements for the DGBSV() function making use of the ATLAS_BLAS routines, which achieved the fastest running times over all matrix dimensions in the individual measurements, revealed a surprising result (see Fig. 3). Contrary to the trend of the test environ-ment, the MGT overall run was slower for up to 10 en-ergy groups with this routine by a factor of 3.0 (2-group calculation) to 1.8 (10-group calculation) than the pro-gram run with the reference solver (see Fig. 4). Only for the energy group numbers 20 and 43 was the DGBSV() routine faster by a factor of 1.1 to 2.3 than the reference solver TIBAMA_REF(). This unexpected behaviour still needs to be explained and will thus be investigated as part of future investigations.
Fig. 4: Acceleration factors for TIBAMA_OPT and
ATLAS_BLAS as compared to TIBAMA_REF
Due to the results obtained, the matrix solver TIBAMA_REF() implemented so far in MGT was re-placed by TIBAMA_OPT(). The application of the solver DGBSV() using ATLAS_BLAS seems to be worthwhile with a view to the use of the maximum energy group structure. Therefore, the 43-group calculations will be-come more attractive in future since the computing
Page 7 of 34

Page 8 of 34
power of MGT using the new solver can be accelerated by factor 2 to 4. Outlook A further approach to improving the running time behav-iour regarding the solution of equation systems is based on a modified approach for the discretisation of the dif-ferential equations occurring. In this way, a new area of optimisation strategies would be accessible. However, to this end larger changes in the program structure would be necessary. A further option is the parallelisation of the solution pro-cedures with a view to the use of large computer clusters. This could significantly reduce the running time beyond the results already gained. This will be a part of the fu-ture work in this area.
References [1] H. Gerwin (1987) “Das zweidimensionale Reaktordynamikprogramm
TINTE, Teil 1: Grundlagen und Lösungsverfahren, Teil 2: Anwendungsbeispiele”, Reports of the Nuclear Research Centre Jülich - No. 2167, 2266
[2] A. Lauer (2007) "MGT - A Multi-Energy Group Derivative of Tinte”
Presentation, IAEA Technical Meeting, Beijing
[3] C. Druska, St. Kasselmann, A. Lauer (2009), “Investigations of space-dependent safety-related parameters of a PBMR-like HTR in transient operating conditions applying a multi-group diffusion code”, Nuclear Engineering and Design, Volume 239, Issue 3, March 2009, Pages 508-520, ISSN 0029-5493, DOI: 10.1016/j.nucengdes.2008.11.019.
[4] C. Druska (02/2009) "Analyse direkter und iterativer Lösungsverfahren für
Gleichungssysteme mit nicht-symmetrischen, dünnbesetzten Matrizen zur Optimierung neutronenphysikalischer sowie thermodynamischer Simulationsverfahren", master's thesis, Aachen University of Applied Sciences in Jülich

Verification of MGT by simulating dynamic experiments at AVR and comparison with TINTE
K. Nünighoff, C. Druska, S. Kasselmann Institute for Energy Research - Safety Research and Reactor Technology (IEF-6), Forschungszentrum Jülich
Corresponding author: [email protected]
The main objective of this work was the code-to-code comparison of the latest TINTE version 3.2 with the first MGT release 1.0. Both codes agree within less than ±0.10 %. It could be proven that the new algorithm in MGT for solving the neutron transport equations does not seriously deviate from results obtained with the old formalism in TINTE. Comparing the simulated data with experimental data from AVR shows a very nice agreement with both codes. It is remarkable that after more than 20 years of code development experimental data of former experiments can be reproduced.
Objectives Both codes TINTE 3.2 and MGT 1.0 where applied to simulate the dynamic experiments carried out at the AVR [1-3]. This study focuses on the comparison of MGT with TINTE (verification) and with experimental data (validation). Three kind of transients were simulated:
• blower speed reduction, • xenon transient, and • rod movement transient.
It must be noticed, that the exact nuclide densities used in the cross section representation could not be verified. However, the agreement with the experimental data is remarkable. Blower Speed Transient During this transient the blower speed was first reduced to 48 % within 20 s. After 30 minutes the blower speed was raised up to 79 % within 28 s. As the blower speed is not a parameter within the TINTE/MGT code, the mass flow was adjusted accordingly. The following equation shows, that the mass flow is linearly correlated with the blower speed [1]:
35002 nVm ⋅⋅⋅= ρ&&
Here, is the mass flow, V the volume flow, m& & ρ the density, and the number of revolutions. The nominal mass flow is =12.9 kg/s and was reduced to
=6.2 kg/s and later raised up to =10.2 kg/s. Fig.1 shows the response of the neutron flux after reducing the mass flow (upper graph) and increasing the mass flow (lower graph). A very good agreement of both codes can be seen. The deviation of both codes is plotted in Fig.2 and is in the order of ±0.015 %.
nm&
m& m&
30405060708090
100
0 50 100 150 200 250 300 350 400 450 500
30405060708090
100
1800 1900 2000 2100 2200 2300 2400 2500 2600
blower speed 100% - 48%blower speed 100% - 48%blower speed 100% - 48%blower speed 100% - 48%
AVRMGT neutron fluxTINTE neutron fluxblower speed
rela
tive
neu
tron
flu
x in
%
blower speed 48% - 79%blower speed 48% - 79%blower speed 48% - 79%blower speed 48% - 79%blower speed 48% - 79%
AVRMGT neutron fluxTINTE neutron fluxblower speed
time in s
Fig.1: Relative neutron flux after variation of the blower speed simulated with TINTE 3.2 and MGT 1.0 as well as the experimental data from AVR.
time (s)
0 500 1000 1500 2000 2500 3000
ref
) / y
ref
100
* (y
- y
-0.015
-0.010
-0.005
0.000
0.005
0.010
0.015
Fig.2: Relative deviation in % between TINTE 3.2 and
MGT 1.0 when simulating a transient varying the blower speed.
Page 9 of 34

Xenon Transient In the second transient the number of revolutions was instantaneously reduced to 80 %. During the simulation the mass flow was directly reduced to m =10.32 kg/s. The aim of this transient was to investigate the build up and decay of Xe due to a power variation.
&
70
75
80
85
90
95
100
0 50 100 150 200 250 300 350 400 450
6065707580859095
100
0 5 10 15 20 25 30 35 40 45 50
AVRMGT neutron fluxTINTE neutron flux
time in s
rela
tive
neu
tron
flu
x in
%
AVRMGT neutron fluxTINTE neutron flux
time in h
Fig.3: Relative neutron flux simulated with TINTE and
MGT and compared with AVR data after reduc-ing the blower speed to 80 %.
The agreement of both codes with AVR data can be seen in Fig.3. The upper graph shows the first 450 s. The ad-justment to the new power level is evident. The lower graph shows the long term behaviour of the reactor after reducing the blower speed. Due to this power transient the production, decay and burn-up of Xe is misbalanced and the new equilibrium state has to be achieved. The drop down in the neutron flux after approximately 5 h can be explained by the build up of Xe.
time (s)
0 1000 2000 3000 4000 5000 6000
ref
) / y
ref
100
* (y
- y
-0.10
-0.05
0.00
0.05
0.10
Fig.4: Relative deviation of MGT compared to TINTE
in case of an instantaneous power transient.
Both codes agree very well within ±0.1 %, as can be seen in Fig.4.
Rod Movement Transient The third transient describes the response of the neutron flux due to movements of the control rods. In the first step the control rods were inserted causing a reactivity change of ρ= -60 mNile. Instead of applying the ROMO (linear rod motion model) module [4] in TINTE/MGT the method of a time dependent superposition of the ab-sorber concentration in the appropriate mesh zone was chosen. Fig. 5 shows the results of a TINTE and MGT simulation compared with experimental data from AVR.
AVRMGT neutron fluxTINTE neutron flux
time in s
rela
tive
neu
tron
flu
x in
%
70
75
80
85
90
95
100
105
110
0 50 100 150 200 250 300
Fig.5: Relative neutron flux after a reactivity change of
ρ= -60 mNile simulated with TINTE/MGT and compared with AVR data.
The deviation between TINTE and MGT for this tran-sient is illustrated as function of time in Fig.6. The agreement is better than 0.005 %.
time (s)
0 100 200 300 400 500 600 700
ref
) / y
ref
100
* (y
- y
-0.003
-0.002
-0.001
0.000
0.001
Fig.6: Relative deviation of MGT compared to TINTE
in case of a reactivity transient.
Page 10 of 34

Page 11 of 34
Conclusion The new multigroup code MGT was compared with TINTE and experimental data from AVR. The two group cross sections were provided using a polynomial repre-sentation. It could be demonstrated that both codes agree within ±0.1 %. Here, the new algorithm in MGT could be verified by comparing the results with the TINTE code. A recalculation of the dynamic experiments at the AVR facility in the 1980’s proofed, that the new code MGT is able to reproduce the experimental results. Even more it point out that over a period of more than 20 years the development of the dynamic code TINTE and its succes-sor MGT was carefully carried out.
References [1] H. Gerwin, Das zweidimensionale Reaktordynamik-
programm TINTE - Teil 2: Anwendungsbeispiele, Jül Bericht 2266, KFA Jülich, 1989 [2] M. Wimmer und P. Pohl, Planning and Performance
of Dynamic Experiments with the AVR Power Plant, Nucl.Sci.&Eng. 97(1987)53-57 [3] W. Scherer et al., Analysis of Reactivity and Temperature Transient Experiments at the AVR High-Temperature Reactor, Nucl.Sci.&Eng. 97(1987)58-63 [4] A. Lauer, TINTE User Manual Supplement: The
Rod Motion Extension ROMO, ISR-IB-1/2004, For-schungszentrum Jülich GmbH, 2004

Development of a new data analysis and visualization software for the reactor dynamics code MGT
S. Kasselmann, K. Nünighoff, S. Scholthaus, C. Druska
Institute for Energy Research - Safety Research and Reactor Technology (IEF-6), Forschungszentrum Jülich
Corresponding author: [email protected] For the systematic analysis of MGT output data, a new post processing software called MAVIS (MGT Data Analysis and Visualisation) has been developed. In the past ASCII data were produced from the MGT binary data files which afterwards had to be copied into a spreadsheet to create histograms. This turned out to be impractical when larger datasets of MGT had to be compared to each other or to results from codes like TINTE. To get the highest possible flexibility with respect to future extensions, an object-oriented approach with C++ as the programing language was chosen. Concerning the graphic data output, MAVIS is based on ROOT [1], a widely used analysis framework originally developed for the field of high-energy physics. MAVIS drastically reduced the turn around time in the case of parameter studies and is an important tool for revision comparison studies in the ongoing MGT development process.
Objectives In the past, MGT used to write its simulation data to a binary file which afterwards was read by several interfac-ing programs to convert the data into plain text. To select the data to be visualized by a spreadsheet program like EXCEL, another program based on REXX [2] (REstruc-tured eXtended eXecutor) served as a control program. To analyze and visualize all kinds of MGT data, at least four different programs had to be involved during the post processing. For the first time, this became impracti-cal when large datasets of MGT had to be compared to each other or to TINTE during Code-to-Code validation tests. So the demand to be able to quickly look into the data and to compare datasets of different runs lead to the development of MAVIS. At the moment, MAVIS offers for the following features:
• visualization of space- and time-dependent parame-ters
• visualization of the input geometry and the material definitions of MGT input files
• comparison of different parameter sets (e.g. absolute and relative deviations)
• determination of local or global minima / maxima • persistent storage of graphical objects in files • automated graphical output (PDF, GIF) • movies of time-dependent data fields • configuration by interactive input or predefined
config files
MAVIS is based on ROOT, a widely used analysis framework originally developed for the field of high-energy physics [1].
Results The first study where MAVIS was extensively used was a comparison of different energy group models within MGT [3]. As a first simple example, Fig.1 shows the solid temperature of a HTR reactor model in r-z view (not true to scale). Of course, the fuel area, as the place of heat source, reaches the highest temperatures.
As another example, Fig.2 shows a result obtained by MAVIS. Here, for each time point in the simulation of a TWCR (Total Withdrawal of Control Rods) transient, the spatial mean of the nuclear heat source was calculated for each energy group model. The relative deviation from a reference case (2 groups) is drawn for all other models up to 10 energy groups. Another example of the visualization capabilities of MAVIS is shown in Fig.3. Here, the geometry mesh of a
Page 12 of 34

Fig. 2: Relative deviation of the nuclear heat source (spa-tial mean for each time point) inside the pebble bed be-tween the 10-group and the 2-group energy model for the TWCR scenario. HTR reactor is visualized. The different colors indicate the most important materials used in a reactor model:
• core / fuel (red) • reflector (dark grey) • rods (black) • gas (yellow) • vessel (bright red) • concrete (light grey) • cooling (blue)
This feature helps to check the correctness of the input files and the material definitions. Of course there are also regions where a mixing of materials is defined (not shown in Fig.3). Outlook MAVIS is a tool to analyze and visualize MGT input and output data and has been successfully used in recent MGT studies. The result of a simulation can be quickly inspected, even while the result file is still being written to. In addition, there is no need for any additional com-mercial software package. Although a lot of features are already implemented in MAVIS, there are still ideas for future developments. New versions may include the possibility to plot a spe-cific parameter from different data sets on one histogram. In addition, there are plans to develop a graphical user interface next to the command line control implemented so far.
Fig. 3: Visualization of the r-z-grid of calculation zones (meshes) and thermal hydraulic material asignemts of a 2-D HTR reactor model. References [1] R. Brun, F. Rademakers, et al. (2007),
“ROOT—An Object Oriented Data Analysis Frame-work”, Ver. 5.16, July 2007.
[2] Michael Cowlishaw, “The Rexx Language: A Prac-
tical Approach to Programming.” ISBN 0137806515
[3] C. Druska, St. Kasselmann, A. Lauer (2009), “In-
vestigations of space-dependent safety-related pa-rameters of a PBMR-like HTR in transient operating conditions applying a multi-group diffusion code”, Nuclear Engineering and Design, Volume 239, Issue 3, March 2009, Pages 508-520, ISSN 0029-5493, DOI: 10.1016/j.nucengdes.2008.11.019.
Page 13 of 34

Studies on combined heat pipe/catalyst elements for hydrogen control in nuclear power plants
Ch. Granzow1, E.-A. Reinecke1, T. Nohner1, T. Zimmermann1, H.-J. Allelein1,2
1 Institute for Energy Research - Safety Research and Reactor Technology (IEF-6), Forschungszentrum Jülich 2Institute for Reactor Safety and Reactor Technology, RWTH University of Aachen
Corresponding author : [email protected]
Passive auto-catalytic recombiners (PAR) are used in light water reactors for the conversion of accidentally released hydrogen to water vapour. The flameless recombination takes place in an exothermal reaction on the surface of catalyst elements. The reaction heat has to be sufficiently removed in order to keep the temperature of the catalyst elements below the ignition temperature of the hydrogen/air-mixture under all conditions. Con-sequently, measures have to be taken for passive cooling of the catalyst elements. One option is the combina-tion of a PAR with a passive heat removal device such as heat pipes. A heat pipe may transport large quanti-ties of heat with a very small temperature difference between the hotter and colder interfaces. It consists of an evacuated tube made of a material with high thermal conductivity, filled with a small amount of working fluid. A wick structure, in which the liquid fluid is transported by means of capillary pressure, is mounted on the inner wall of the tube. Heat transfer is realised by evaporating liquid fluid out of the capillary structure into the tube. The heat is then transported as vapour to the cold end of the tube and the heat is released by condensation of the vapour to liquid into the capillary structure. The rate of the heat transfer depends on the condensation rate of the working fluid. The combination of a PAR with passive heat removal by means of Heat Pipes is studied with three different designs. For this purpose, experiments are performed in the REKO-1 facility. The paper gives an overview of the general approach and results achieved so far.
Introduction Passive auto-catalytic recombiners are used in the con-tainments of light water reactors for the conversion of hydrogen to water. Hydrogen may be released during a core melt accident from the reaction of metals with hot steam. The recombination reaction of hydrogen with oxygen takes place on the surface of catalyst elements. When designing a catalytic recombiner, the sufficient removal of the reaction heat generated in the exothermal process has to be taken into account in order to avoid temperatures above the ignition limit of a hydrogen/air mixture. Consequently, measures for the passive cooling of such a device are required. One option is the combination of the catalyst elements with a passive cooler according to the heat pipe principle. Heat pipes are passive heat exchangers with a high effi-ciency as heat is removed with a steam flow at high ve-locity from the heat source. The enthalpy difference of two phases of a working fluid is used in order to realise a cooling circuit. Present research activities aim at design-ing heat pipe cooled recombiners for different applica-tions. Principle of heat pipes A heat pipe is a two phase device for heat transport with a very high thermal conductivity. It consists of an evacu-ated tube filled with a working fluid (Fig. 1). A heat pipe is used for passive heat transport at minimal temperature gradients due to the enthalpy difference of both phases of the working fluid from the heat source to the heat sink [2]. The basic principle is a closed two-phase system. In
heat pipes, the pressure difference for return transport of the liquid is induced by means of capillary forces.
Fig. 1: Working principle of heat pipes [1]
For this purpose, the inner surface of the closed tube is coated with a capillary structure which is saturated with the liquid working fluid. Typical capillary structures are longitudinal grooves, wire mesh or screen wick, sinter metals, or a combination of these materials [3]. If one end of the heat pipe is heated, the liquid evaporates out of the capillaries. The vapour flows to the cold end of the tube where it condenses back into the capillary system. Due to the suction effect of the capillary structure, the condensate is driven back to the evaporator end. Between evaporator and condenser, the so-called adiabatic trans-port zone is located.
Page 14 of 34
A broad range of applications reaches from temperatures around 5 K until 2200 K. For the different application temperatures, different working fluids are used, from hydrogen at extreme low temperatures via water for tem-peratures between 300 K and 600 K up to silver for tem-peratures above 1800 K [4]. The involved heat transfer mechanism can be described by a corresponding thermal resistance. By means of a wiring diagram, a first simple thermotechnical descrip-tion of the heat pipe is possible. (Fig. 2).The reaction heat absorption takes place at the evaporator end of the heat pipe into the cladding material. By means of heat conduction a small amount of the heat is transported di-rectly through the cladding material in axial direction to the condenser end, while the major part is transferred into the capillary structure where it enters the vapour region via evaporation. The vapour moves to the condenser end and condenses into the capillaries. The heat of condensa-tion is transferred via heat conduction into the cladding material and is transferred to the surrounding atmosphere by means of cooling elements.
Fig. 2: Wiring diagram of thermal resistances
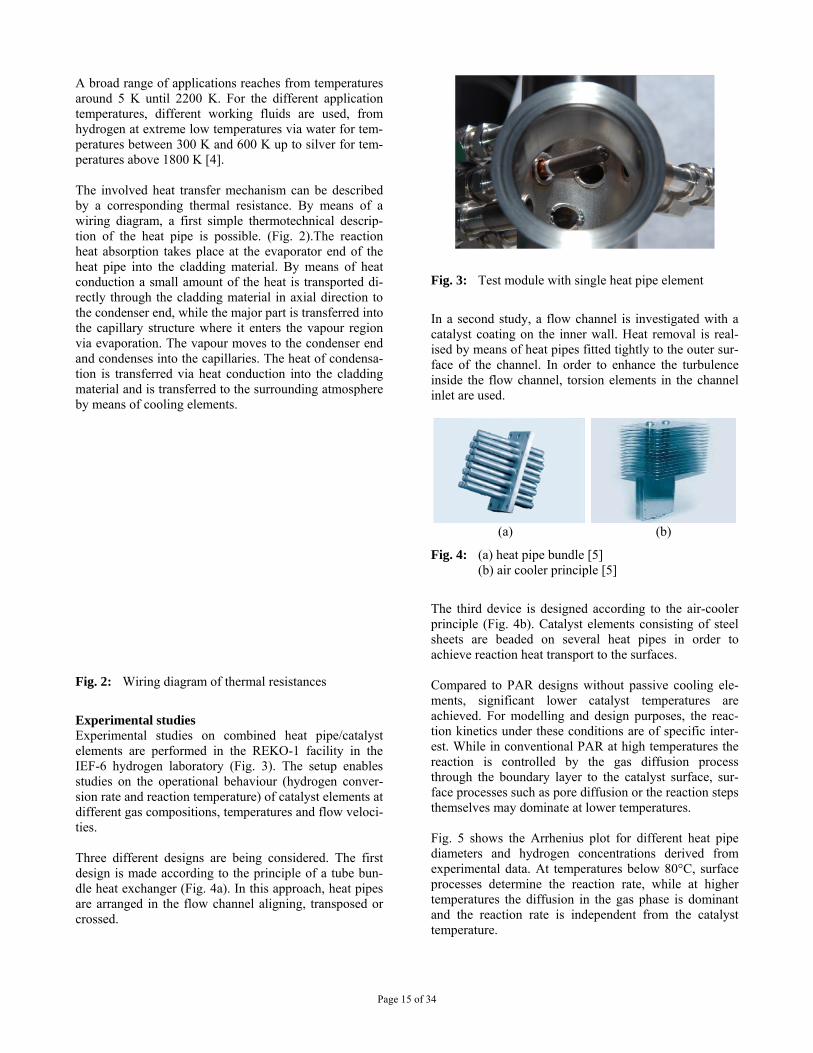
Experimental studies Experimental studies on combined heat pipe/catalyst elements are performed in the REKO-1 facility in the IEF-6 hydrogen laboratory (Fig. 3). The setup enables studies on the operational behaviour (hydrogen conver-sion rate and reaction temperature) of catalyst elements at different gas compositions, temperatures and flow veloci-ties. Three different designs are being considered. The first design is made according to the principle of a tube bun-dle heat exchanger (Fig. 4a). In this approach, heat pipes are arranged in the flow channel aligning, transposed or crossed.
Fig. 3: Test module with single heat pipe element
In a second study, a flow channel is investigated with a catalyst coating on the inner wall. Heat removal is real-ised by means of heat pipes fitted tightly to the outer sur-face of the channel. In order to enhance the turbulence inside the flow channel, torsion elements in the channel inlet are used.
(a) (b)
Fig. 4: (a) heat pipe bundle [5] (b) air cooler principle [5]
The third device is designed according to the air-cooler principle (Fig. 4b). Catalyst elements consisting of steel sheets are beaded on several heat pipes in order to achieve reaction heat transport to the surfaces. Compared to PAR designs without passive cooling ele-ments, significant lower catalyst temperatures are achieved. For modelling and design purposes, the reac-tion kinetics under these conditions are of specific inter-est. While in conventional PAR at high temperatures the reaction is controlled by the gas diffusion process through the boundary layer to the catalyst surface, sur-face processes such as pore diffusion or the reaction steps themselves may dominate at lower temperatures. Fig. 5 shows the Arrhenius plot for different heat pipe diameters and hydrogen concentrations derived from experimental data. At temperatures below 80°C, surface processes determine the reaction rate, while at higher temperatures the diffusion in the gas phase is dominant and the reaction rate is independent from the catalyst temperature.
Page 15 of 34

Page 16 of 34
References
-1,0
-0,8
-0,6
-0,4
-0,2
0,0
0,2
0,4
0,6
0,8
1,0
1,2
0,0020 0,0022 0,0024 0,0026 0,0028 0,0030 0,0032 0,0034
T-1 / K-1
ln k
HP8H10 0.5 m/s 8 vol.%HP6H8 0.5 m/s 4 vol.%HP8H10 0.5 m/s 5 vol.%HP8H10 0.5 m/s 6 vol.%
mass transferregime
surface reactionregime
[1] www.deltatronic.de [2] A. Faghri: Heat Pipe Science and Technology, Tay-
lor & Francis, 1995 [3] D. A. Reay, P. A. Kew: Heat pipes, Theory, Design
and Application; Butterworth Heinemann, 2006 [4] VDI-Wärmeatlas, Springer Verlag, CD-ROM Aus-
gabe, 1998 [5] www.dau-at.com
Fig. 5: Arrhenius plot for the recombination reaction Outlook First studies have indicated that catalyst temperatures
well below the ignition temperature of a hydrogen /air mixture can be achieved by combining catalyst elements with heat pipes. Further investigations aim at testing dif-ferent designs and deriving numerical models for applied studies.

Thermohydraulic analysis of the wet storage of spent fuel at the ILL research reactor with CFD
J. Baggemann1,2, St. Kelm1, H. Guyon3, W. Jahn1, H.-J. Allelein1,4
1 Institute for Energy Research - Safety Research and Reactor Technology (IEF-6), Forschungszentrum Jülich 2 Aachen University of Applied Sciences, Campus Juelich, Field of nuclear physics
3 Institute Laue-Langevin, Grenoble/France, Reactor Division 4Institute for Reactor Safety and Reactor Technology, RWTH University of Aachen
Corresponding author : [email protected]
The Institute Laue Laugvine (ILL) in southern France operates a strong neutron source for scientific use. This heavy water moderated pool type reactor has a single, compact fuel assembly. After being unloaded from the reactor pool, such a fuel element has a high residual power of about 160 kW and thus has to be cooled suffi-ciently in the fuel storage pool. For this purpose, a passive cooling concept has been developed at ILL: The fuel element is placed at the storage pool in an “exchange flask”. The residual heat is removed from the ex-change flask by internal natural circulation to the pool. The aim of a numerical study performed at Juelich in cooperation with Aachen University of Applied Sciences is to investigate the safety margins of this storage and cooling concept. For a subsequent accident analysis, it is important to gain an insight into each cooling channel of the fuel assembly and determine local effects, thus the fuel assembly has to be geometrically re-solved. The model development is performed in 3 steps. In first subchannel studies, the effects of grid resolu-tion, wall treatment, turbulence and buoyancy model have been investigated on a single channel. As a second step, in order to get a first insight into the flow in the exchange flask and address the influence of the bound-ary conditions, the complete exchange flask is considered but the plates and the water channels are modelled by a porous medium. Based on the results of these scoping tests, a final half symmetry model was built, re-solving the subchannels of the fuel element and the flow in the exchange flask.
Introduction The Institute Laue Laugvine (ILL) in southern France was founded on the initiative of Heinz Maier-Leibnitz and Louis Néel in 1967 in order to operate a strong neu-tron source for scientific use. Due to the fact that there were continuous modernisations and one complete re-placement of the reactor housing (vessel), it is still the world's most intensive neutron source. The heavy water moderated pool type reactor has 46 equivalent full power days at 58,3 MWth. Its core design is optimised to reach a high neutron flux of up to 1019 n/(m²s). The single, com-pact fuel assembly with 93 wt.% enriched U-235 reaches a burnup of 316 GWd/t. After unloading from the reactor pool, such a fuel element has a high residual power of about 160 kW and thus has to be cooled sufficiently in the fuel storage pool. For this purpose a passive cooling concept has been developed at ILL: The fuel element is placed into an exchange flask which is connected to a heat exchanger. This storage assembly is then moved to the storage pool where the residual heat is removed by internal natural circulation to the pool. The aim of a numerical study performed at Juelich in cooperation with Aachen University of Applied Sciences is to investigate the safety margins of this storage and cooling concept. In a first step, the thermal hydraulic phenomena in the storage assembly under normal condi-tions are simulated with ANSYS CFX 11 [1] and com-pared with temperature measurements at ILL.
System description The compact fuel assembly (Fig. 1a) consists of 280 evolvent shaped plates which are arranged between two concentrical aluminium cylinders of 260 and 414 mm diameter. Each plate has a height of 903 mm, a width of 67 mm and a thickness of 1.27 mm. The fuel zone in the centre of these plates consists of UAlx (x=3 and 4) inter-metallic sintered powder in an aluminium matrix of 70 wt.% aluminium. The intermetallic sintered powder is coated with a thin aluminium layer [2].
(a) (b)
Fig. 1: Drawing of (a) fuel assembly; (b) exchange flask
Page 17 of 34

The exchange flask (Fig. 1b) consists primarily of an aluminium cylinder with an inner diameter of 424 mm. The fuel element is drawn into the flask at the bottom side which can be sealed. Thus a closed cooling circuit is realized. The storage assembly is filled with heavy water and stored in 7 m depth in the fuel pool. A relief valve keeps the pressure within the flask constant. The DN 150 supply lines to and from the tube bundle heat exchanger are mounted on one side of the exchange flask above and beneath the fuel assembly. The fuel ele-ment hangs between these supply lines so that in normal operation a natural circulation through the element is established, the residual heat is transferred to the fuel pool by the heat exchanger and cold water is fed to the lower plenum of the flask again. Model development For a subsequent accident analysis it is important to gain an insight into each cooling channel of the fuel assembly and determine local effects and insufficient cooling, thus the fuel assembly has to be geometrically resolved. The fuel element itself is rotationally symmetric, but due to the lateral supply and discharge of coolant the condi-tions at the inlet of each of the 280 cooling channels of the fuel element is different. To account for all effects due to the sidewise in and outflow it is necessary to model at least half symmetry of the exchange flask. The model development is performed in 3 steps. Subchannel studies Effects of grid resolution, wall treatment, turbulence and buoyancy model are investigated on a single channel. This setup consists of two halved plates that bound the water channel. In order to reduce feedback from the inlet and outlet boundary condition, respectively, short water blocks before and after the coolant channel are also mod-elled. The residual heat production is simulated as a ho-mogenous heat source in the plates. The impact of pres-sure losses beyond the subchannel is considered by a pressure loss coefficient at the outlet boundary which is approximated according to VDI [3]. Summarising, a grid resolution of about 6000 nodes per channel proved to be sufficient. The heavy water flow is modelled by a system of incompressible Reynolds aver-aged Navier Stokes equations which is closed by the Shear-Stress-Transport (SST) model. Material properties have been taken from Kerstin et al. [4]. Buoyancy is con-sidered by the Bossinesq approximation. Porous media setup To get a first insight into the flow in the exchange flask and address the influence of the boundary conditions, the complete exchange flask is considered but the plates and the water channels are modelled by a porous media. The model parameters porosity and permeability have been derived by subchannel calculations for the flow stream
wise direction. The subchannels straighten the flow, so that high transverse losses are specified in order to sup-press momentum in these directions. The residual heat is considered by a homogeneous heat source in the porous media. The heat exchanger is modelled by a pressure loss coefficient at the outlet boundary [3] and is assumed to be ideal, i.e. inlet temperature is equal to pool tempera-ture. Heat losses through the wall of the exchange flask are neglected. A variation of the pressure loss coefficient showed only a marginal influence on the general thermal hydraulic situation in the flask. Main result of this calculation was that the buoyancy driven flow in the flask is locally un-steady, but can be approximated by a steady-state calcu-lation. Full setup Based on the results of these scoping tests a final com-plete half symmetry model was built resolving the sub-channels of the fuel element and the flow in the exchange flask. Fig. 2 shows the thermal hydraulic situation in the ex-change flask. The velocity plot (Fig 2a) on the symmetry plane proves that the coolant flow for each subchannel is different due to the lateral inflow. The streamlines (Fig 2b) illustrate the three dimensional flow pattern and the mixing in the flask. Sections of the temperature fields on the fuel element are shown for three heights in Fig 2c.
(a) (b) (c)
Fig. 2: a) Velocity plot; b) 3D flow pattern; c) Temperature fields in the fuel element
The average temperatures of the discharged coolant are in good agreement to the measured point values at ILL for different times and decay heat powers. The tempera-ture and flow fields are in good agreement with the ex-pected values (Fig. 3). Hence, the model is able to simu-late the thermodynamic phenomena in the normal opera-tion and can be used to address hypothetical accident scenarios.
Page 18 of 34

Page 19 of 34
30
35
40
45
50
0 30 60 90 120
Residual Heat 150
[kW]
Aver
age
Out
flow
Tem
pera
ture
[°C
]
ILL DataCFX-Porous MediaCFX-Fully Resolved
residual heat [kW]
aver
age
outfl
ow te
mpe
ratu
re[°
C]
References [1] ANSYS Inc. ANSYS CFX 11, User Documentation,
2007 [2] B. Desbrière. Rapport de Sûreté, ILL Internal Reac-
tor Documentation, 1996 [3] Verein Deutscher Ingenieure. VDI–Wärmeatlas, 10.
Auflage, Juni 2005 [4] David R. Lide. CRC Handbook of Chemistry and
Physics, Taylor&Francis, 2005
Fig. 3: Measured values compared to simulation results
Summary and future work In order to investigate safety margins at the wet storage of spent ILL research reactor fuel, a CFD model was built. The model development was performed in three steps. First, a single channel was modelled in order to determine the effects of grid resolution and different models. Second, half symmetry was considered while the fuel zone was modelled by a porous media. In a last step, the model was expanded by resolving all subchannels of the fuel assembly. The model predicts plausible values for the coolant tem-peratures compared to measurements at ILL and thus is considered to be suitable to predict the thermal hydrau-lics in postulated accident scenarios as well. Future work will address additional 3D effects in a full 360 degree model and hypothetic accident scenarios like failure of the fuel assembly mounting and falling down of the fuel assembly to the bottom of the exchange flask due to an earth quake.
Study of the Burnup Behavior, Safety Characteristics and Transmutation Performance of the LWRs with Innovative Fuel Concepts
R. Nabbi, H.-J. Allelein, W. von Lensa, O. Schitthelm
Research Center Juelich, D-52425 Juelich, Germany, Phone: ++49 2461 615065 Fax: ++49 2461 612450
Comprehensive research works have been conducted during the last years to investigate the neutronic per-formance, transmutation potential and safety characteristics of the so called Inert Matrix Fuels (IMF) in the aim of reducing the current excess stockpiles of plutonium and other transuranium elements. As a new option metallic matrix consisting of depleted Molybdenum (CERMET) as well as thoria based matrix exhibit well-promising core physics behaviour with considerable transmutation potential for transuranium (TRU). Using parallelized MCNP Monte-Carlo Code and ORIGEN (MONTE-BURNS) as well as the NJOY data process-ing code system sophisticated core physics analysis was performed to determine at what extent and how the neutronic performance is influenced by the change of fuel type from MOX to (Th/Pu)O2 fuel and IMF variant.
As first the burnup behavior is studied for three selected core loadings: MOX, (Th/Pu)O2 and IMF type, re-spectively. The two first fuel types show similar characteristics due to the neutronic influence of Pu existing in these two fuels and small difference in the cross section of the respective fertile isotopes. In the case of a homogeneous LWR core with the IMF fuel the variation of multiplication factor exhibits an enhanced fuel depletion rate due to the absence of fertile isotopes and breeding respectively. The higher excess reactivity resulting from the initial plutonium contents in this fuel type is controlled by the use of gadolinium oxide (dispersed) in the metallic matrix. By comparison an IMF loaded CERMET core displays a harder neutron spectrum that positively influences the transmutation process.
In comparison to the standard MOX and Thoria core the IMF loaded core shows smaller values for the fuel temperature coefficient of the reactivity due to the small resonance absorption lines of Molybdenum (-60 %). The moderator coefficient is also considerably lower and partly positive at the beginning of cycle due to higher initial loading of plutonium and resulting resonance absorption rate in upper thermal energy range. With the consumption of Pu and progress of burnup the temperature coefficients becomes considerable nega-tive causing positive safety characteristics.
The simulation of the transmutation process indicates an enhanced performance of (Th/Pu)O2 and IMF fu-elled cores in both, reduction of plutonium and TRU (per MW reactor power). In particular, the incineration of plutonium in these two fuel variants is about three times as much as in the MOX fuel per MWd. This is due to the replacement of U-238 (MOX) by Thorium and Molybdenum respectively. The fraction of plutonium reduction leading to higher isotopes (minor actinides) is comparable for (Th/Pu)O2 and IMF and varies from 7 to about 10 %. In case of the MOX fuel, the conversion of U-238 to new plutonium causes less effective plutonium reduction. The simulation shows that approx. 17.6 % of the total converted plutonium result in the production of minor actinides.
1. Introduction The use of the MOX fuel in LWR does not consid-
erably contribute to the reduction of the plutonium stock-piles because of the continuous production of new Pu under irradiation. Also further reprocessing steps aiming at the recycling with second and third generation pluto-nium from the MOX fuel irradiation as after reaching a high burnup seems not to be particularly favourable. To avoid the continuous Uranium-Plutonium conversion, burning of Pu and fissile actinides in advanced nuclear reactors requires inactive materials as matrix, so-called “Inert Matrix Fuels” (IMF) including Thoria-based fuel
(Th/PuO2) with lesser breeding of long-lived higher acti-nides [1].
During the last years, comprehensive research works
have been performed to study the neutronic performance, transmutation potential and safety characteristics of the IMF concepts in the aim of reducing the current excess stockpiles of plutonium and other transuranium elements [2-4]. Among the others and as a new option metallic matrix consisting of depleted Molybdenum is considered as a feasible concept [5,6]. In comparison to the conven-
Page 20 of 34

tional fuel of UO2 and MOX type, the new CERMET fuel as well as thoria-based fuel matrix are expected to have optimum neutronic behaviour and safety character-istics with considerable transmutation potential for TRU trans-mutation.
The purpose of the present work is to investigate at what extent and how the neutronic performance is influ-enced by the change of fuel type from MOX to (Th/Pu)O2 fuel and IMF variant. Due to the complexity of reactor core configurations and respective neutronic processes, advanced models and methods are needed. For this aim parallelized MONTE-BURNS code based on the MCNP Monte-Carlo Code and ORIGEN is employed in combination with NJOY for the gene-ration of nuclear data files [7-9] 2. Fuel Types and Core Configurations
The design of the fuel assembly is oriented on a standard 17x17-25 PWR one with different material compositions. In the case of the MOX core the fuel is a mixture of PuO2 and UO2 with the enrichment of 3.8 /0.71 wt% for Pufiss and U-235 respectively. Plutonium is originating from the 1st generation Plutonium discharged from current fleet of LWR’s with a final burnup of 33 MWd/kg [10] composed with naturally enriched ura-nium (Table 1). Regarding the (Th/Pu)O2 fuel the initial composition derives from the recovered Pu from a refer-ence UO2-core after a target burnup of approx. 35 MWd/kg HM (with a decay period of 7 years) which is composed with the respective boron content in the cool-ant. The adopted Pu fissile content is 3.3 wt% which is comparable with the content of the MOX fuel. The com-position of the individual fuel pins is given in Table 1.
In the case of IMF, Molybdenum is used to replace
the fertile material U-238 in low-enriched UO2 fuel. The fuel pellets are composed of PuO2 particles dispersed in a matrix consisting of depleted molybdenum with a low fraction of neutron absorbing isotopes. The PuO2 content is 12 % of the total volume with a Pu vector equivalent to the 1st generation Pu discharged from standard UO2 core with a EOC burnup of 41 MWd/kg (see Table 1). For the control of the reactivity the fuel pins in the inner zone of the fuel assembly contain 7.5 % of Gd2O3 dispersed homo-geneously in the matrix. The main geometrical design data of the fuel assembly are summarized in table 2.
TABLE 1 Composition of different fuel concepts (number
density 1/cm barn)
3. Geometry Modelling and Simulation Method
The complex structure of the reactor requires a pre-cise geometrical description as possible in the MCNP Monte-Carlo code. Due to the complexity of reactor core configurations and respective neutronic processes, ad-vanced models and methods are needed. For this aim parallelized MONTE-BURNS code based on the MCNP Monte-Carlo Code and ORIGEN is employed in combi-nation with NJOY for the generation of nuclear data files [7-9]. It is applied to study the behaviour of fuel assem-bly and to produce core physics parameters, cross sec-tions for using in the isotope depletion code ORIGEN. The MCNP model of fuel assembly is a complete 3-dimensional full-scale model of a LWR 17x17-25 lattice with a high level of geometric fidelity (Fig. 1). For the comparison of the neutronics of the loading configura-tions (MOX, Th/Pu-O2 and IMF respecttively), a ho-mogenous core consis-ting of one fuel type was applied allowing the reduction of the core physics analysis to the fuel assembly (FA) level. Each cell in the lattice contains a detailed model of the fuel pin of the respective compo-sition, cladding (Zircalloy), gap and surrounding modera-tor with the additive of boron (Table 2. The effect of the surrounding fuel assemblies is taking into account by applying white (reflected) boundary conditions. In all cases a total power of 1000 MWe was assumed to present a standard PWR. The variation of the isotopic concentra-tions in every fuel pin of the assembly is calculated by performing depletion runs with the ORIGEN code for different burnup steps. For the main nuclides the ENDF/B-VI and VII data libraries were used.
Isotop MOX Th/Pu-O2 IMF
(PuO2-Mo) Th-232 --- 2.06E-02 --- U-235 1.40E-04 --- --- U-238 1.95E-02 --- --- Pu-238 2.27E-05 2.29E-05 7.95E-05Pu-239 7.45E-04 7.48E-04 1.65E-03Pu-240 2.91E-04 2.90E-04 7.20E-04Pu-241 1.54E-04 1.53E-04 3.98E-04Pu-242 5.05E-05 5.01E-05 2.05E-04Mo-total --- --- 5.05E-02O-16 4.18E-02 4.37E-02 6.10E-03Pu - tot 5.4 % 5.2 % 12 %Pu - fis 3.8 % 3.7 % 8.6 %
Page 21 of 34

TABLE 2 Main design data of the fuel assembly with different fuel types
Type of data MOX Th/Pu-O2 IMF General Burnup MWd/kg_HM 40 40 228 Power MW 17.83 17.83 17.83 Eq. Full power days 941 800 800 Enrichment wt-% 4.4% 3.7% 8.6% Mean Boron concentration ppm 277 1160 277 Element size 17x17 17x17 17x17 Fuel rods 264 264 264 Densities Cladding density adapted g/cm³ 6.55 6.55 6.55 Moderator density g/cm³ 0.7 0.7 0.7 HM density g/cm³ 8.26 8.44 1.21 Fuel density g/cm³ 9.37 9.60 9.46 Geometry Fuel diameter cm 0.82 0.82 0.82 Gap diameter cm 0.83 0.83 0.83 Clad diameter cm 0.95 0.95 0.95 Pin Pitch cm 1.26 1.26 1.26 Assembly pitch cm 21.5 21.5 21.5 Nuclide densities (nominal) Cladding temperature T=586 K Zr – nat 1/(barn*cm) 4.33E-2 4.33E-2 4.33E-2 Moderator temperature T=586 K H-1 1/(barn*cm) 4.69E-02 4.77E-02 4.69E-02 O-16 1/(barn*cm) 2.35E-02 2.39E-02 2.35E-02 B-10 1/(barn*cm) 1.62E-05 3.95E-06 1.62E-05 B-11 1/(barn*cm) 6.57E-05 1.59E-05 6.57E-05 B-tot 1/(barn*cm) 8.19E-05 2.00E-05 8.19E-05
Due to the high demand on the CPU-time and system memory the Parallel version of the MCNP (using MPI) is run on the existing IBM massive parallel computer sys-tem using 16 processors. To get a high level of calcula-tion accuracy, all simulations were run with 150 cycles of 10,000 particles each. Due to the high number of histo-ries, a standard deviation of 0.001 -corresponding to 0.10 % dk/k for the reactivity- was achieved. 4. Results of Neutronic and Core Physics Analysis
The analysis of the core physics of a LWR for three different fuel concepts is focused on the neutronics, fuel depletion, safety characteristics as well as on the trans-mutation behavior.
4.a Burnup and Neutronic Behavior Fig. 2 shows the variation of the multiplication factor
for three different core loadings: MOX, (Th/Pu)O2 and IMF respectively. For the IMF fuelled core the variation of keff is different from the two other variants due to the effect of burnable absorber (Gadolinium) existing in the fuel matrix. As a consequence of burning process (ab-sorber) the reduction of keff caused by the consumption of Pu is compensated. In the earlier phase the keff is gradually reducing due to the generation of fission prod-ucts and compensation by the Gd burnup. In the 2nd phase the contribution of Gd loss exceeds the effect of fuel de-pletion that jointly results in a net increase of the multi-plication factor.
Page 22 of 34

Page 23 of 34
Fig. 1: Fuel rod, assembly and its MCNP model for neutronic analysis
0.9
0.95
1
1.05
1.1
1.15
1.2
1.25
0% 20% 40% 60% 80% 100%
cyclelength [%]
Mul
tiplic
atio
n fa
ctor
IMF MOX ThPu
Fig. 2: Multiplication factor as a function of burn-up for different PWR core loadings

Page 24 of 34
orium/plutonium xide and MOX fuel type respectively.
4.c
l type remains more efficient than the ther variants.
Fig. 3: Comparison of the neutron spectrum in the fuel pin for different fuel types
1.0E-10
1.0E-08
1.0E-06
1.0E-04
1.0E-02
1.0E+00
1.0E-09 1.0E-07 1.0E-05 1.0E-03 1.0E-01 1.0E+01
Energy [MeV]
N-F
lux
(rel
.)
0.00
0.05
0.10
0.15
0.20
0.25
N-F
lux(
rel.)
MOX-fuel(Th/Pu-O2)-fuelIMF(Molybdenum)
The two first fuel types show similar behavior due to the neutronic influence of Pu existing in these two fuels and small difference in the cross section of the fertile isotopes Th-232 and U-238. In both fuel variants the con-sumption of fissile Pu is slowed because of the genera-tion of fissile material from the existing fertile uranium and thorium respectively (breeding).
This result is also explained by comparison of the
spectra as depicted in Fig. 3 for the core loaded with (Th/Pu)O2 fuel as well as with IMF. Due to the lower absorption cross sections of molybdenum (IMF) exhibits a significant shifting of the spectrum from thermal to epithermal region. For the demonstration of this effect, the thermal part is additionally displayed in Fig. 3 in lin-ear scale.
4.b Safety Characteristics
The safety characteristics of different fuels expressed in terms of temperature coefficients of the reactivity are summarized in table 2 and depicted in Fig. 4 and Fig. 5 for different stage of the operational cycle. In comparison to the MOX fuel assembly, the IMF one shows smaller values due to the neutronic effect of Molybdenum due to smaller absorption cross-sections in the whole energy range. The different isotopes of this element existing in the matrix have a moderate resonance lines resulting in a less doppler broadening and neutron absorption rate in the epithermal energy range. The moderator coefficient is also considerably lower (partly positive) as a conse-quence of the higher initial loading of Pu having a reso-nance line in upper thermal energy range which causes an enhanced fission rate. Due to the depletion of Pu with
burnup the coefficient changes significantly from BOC to EOC. The effect of the temperature on the boron worth is also considerably lower in the case of IMF fuelled core in comparison to the MOX and (Th/Pu)O2 fuel respectively. Accordingly the boron coefficient in the IMF fuel is sig-nificantly lower than in the case of tho
Transmutation behavior Burning Plutonium in a thermal spectrum produces
higher isotopes such as Americium or Curium. In Fig 6. the incineration performance in terms of integrated con-version rate for Plutonium is depicted as a function of burnup. Accordingly the percentage of plutonium reduc-tion via breeding higher isotopes is comparable for (Th/Pu)O2 and IMF and varies from 7 to about 10.5 % at the end of cycle. In the case of MOX fuel, the conversion of U-238 to new plutonium causes a less effective pluto-nium reduction. According to Fig. 6 approx. 14.15 % of the total converted Plutonium result in the production of higher isotopes (minor actinides). As shown in the figure, the unfavorable conversion of Plutonium to higher iso-topes increases for the MOX as well as for the (Th/Pu)O2 fuel with burnup. In contrast the behavior of the IMF fuel shows a slightly decreasing effect over the cycle length. In terms of net Plutonium conversion due to fission, (Th/Pu )O2 fueo

TABLE 3 Temperature coefficients of reactivity for PWR loaded with different fuel types
Fuel
Doppler (pcm/°C)
Moderator (pcm/°C)
Boron worth (pcm/ppm)
MOX -2.53 -42.1 -3.90
(Th/Pu)-O2 -4.36 -71.4 -9.35
IMF(PuO2-Mo) -1.94 +31.1 -2.07
-5
-4,5
-4
-3,5
-3
-2,5
-2
-1,5
-1
-0,5
0
Dop
pler
coe
fficien
t [pc
m/K
]
IMFThoriumMOX
BOC MOC EOC
Fig. 4: Doppler coefficient for the PWR cores loaded with different fuel types
-100
-80
-60
-40
-20
0
20
40
Mod
erat
or coe
fficien
t [pc
m/K
]
IMFThoriumMOX
BOC MOC EOC
Fig. 5: Moderator coefficient for the PWR cores loaded with different fuel types
Page 25 of 34
Page 26 of 34
4.0%
6.0%
8.0%
10.0%
12.0%
14.0%
16.0%
0 10 20 30 40 50 60 70 80 90 1
cyclelength [%]
fract
ion
00
IMFTh PuMOX
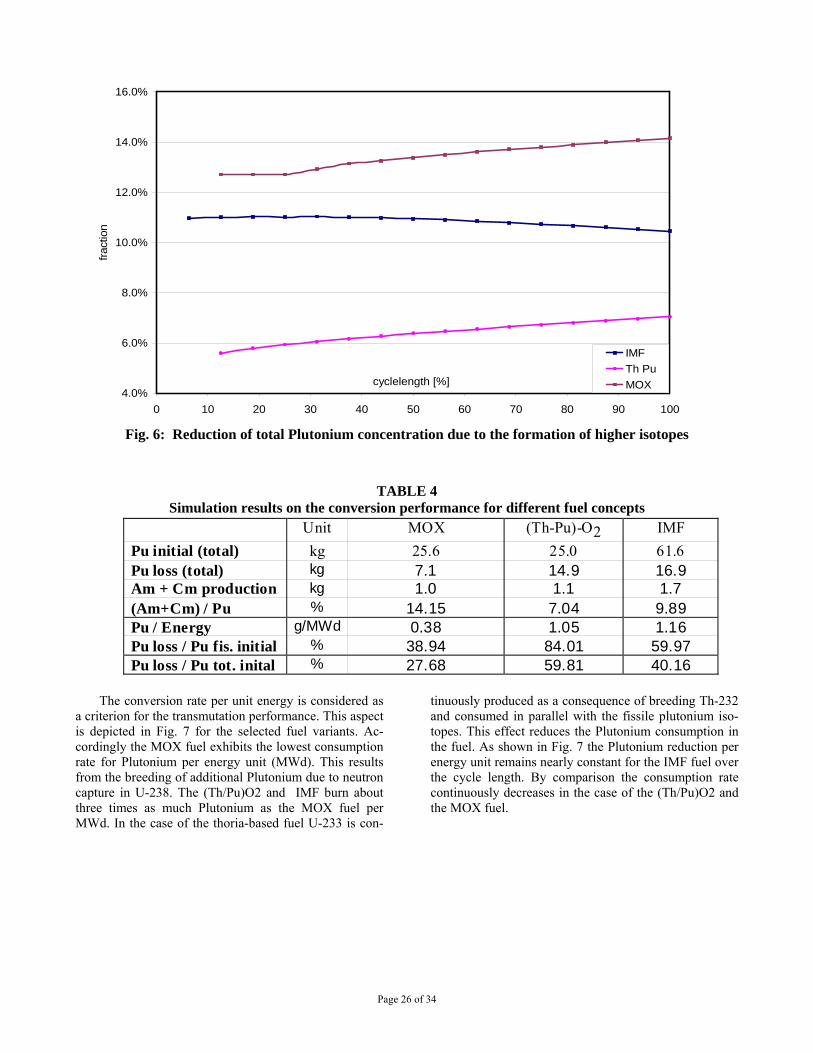
Fig. 6: Reduction of total Plutonium concentration due to the formation of higher isotopes
TABLE 4 Simulation results on the conversion performance for different fuel concepts
Unit MOX (Th-Pu)-O2 IMF Pu initial (total) kg 25.6 25.0 61.6 Pu loss (total) kg 7.1 14.9 16.9 Am + Cm production kg 1.0 1.1 1.7 (Am+Cm) / Pu % 14.15 7.04 9.89 Pu / Energy g/MWd 0.38 1.05 1.16 Pu loss / Pu fis. initial % 38.94 84.01 59.97 Pu loss / Pu tot. inital % 27.68 59.81 40.16
The conversion rate per unit energy is considered as a criterion for the transmutation performance. This aspect is depicted in Fig. 7 for the selected fuel variants. Ac-cordingly the MOX fuel exhibits the lowest consumption rate for Plutonium per energy unit (MWd). This results from the breeding of additional Plutonium due to neutron capture in U-238. The (Th/Pu)O2 and IMF burn about three times as much Plutonium as the MOX fuel per MWd. In the case of the thoria-based fuel U-233 is con-
tinuously produced as a consequence of breeding Th-232 and consumed in parallel with the fissile plutonium iso-topes. This effect reduces the Plutonium consumption in the fuel. As shown in Fig. 7 the Plutonium reduction per energy unit remains nearly constant for the IMF fuel over the cycle length. By comparison the consumption rate continuously decreases in the case of the (Th/Pu)O2 and the MOX fuel.
0.20
0.40
0.60
0.80
1.00
1.20
0 20 40 60 80
cyclelength [%]
Mas
sred
uctio
n [g
/MW
d]
1.40
100
IMFTh PuMOX
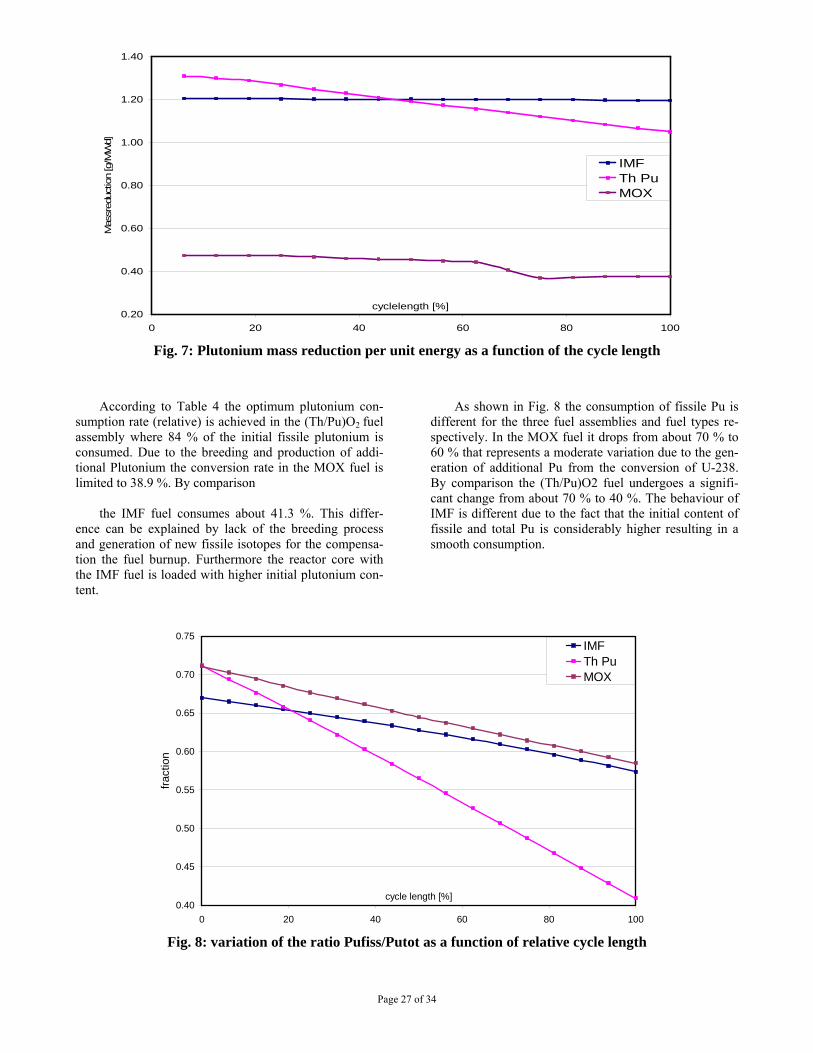
Fig. 7: Plutonium mass reduction per unit energy as a function of the cycle length
According to Table 4 the optimum plutonium con-sumption rate (relative) is achieved in the (Th/Pu)O2 fuel assembly where 84 % of the initial fissile plutonium is consumed. Due to the breeding and production of addi-tional Plutonium the conversion rate in the MOX fuel is limited to 38.9 %. By comparison
the IMF fuel consumes about 41.3 %. This differ-
ence can be explained by lack of the breeding process and generation of new fissile isotopes for the compensa-tion the fuel burnup. Furthermore the reactor core with the IMF fuel is loaded with higher initial plutonium con-tent.
As shown in Fig. 8 the consumption of fissile Pu is different for the three fuel assemblies and fuel types re-spectively. In the MOX fuel it drops from about 70 % to 60 % that represents a moderate variation due to the gen-eration of additional Pu from the conversion of U-238. By comparison the (Th/Pu)O2 fuel undergoes a signifi-cant change from about 70 % to 40 %. The behaviour of IMF is different due to the fact that the initial content of fissile and total Pu is considerably higher resulting in a smooth consumption.
0.40
0.45
0.50
0.55
0.60
0.65
0.70
0.75
0 20 40 60 80
cycle length [%]
fract
ion
100
IMFTh PuMOX
Fig. 8: variation of the ratio Pufiss/Putot as a function of relative cycle length
Page 27 of 34

5. Conclusions The neutronic and transmutation behaviour of a 1000
MWe LWR core loaded with MOX, thoria and IMF fuel studied at a fuel assembly model level. The reactor core with the first two fuel types show similar characteristics due to the similar Pu content and nuclear properties of both fertile materials. They show minor difference re-garding the neutron spectrum and fuel temperature feed-back effect (doppler coefficient). In contrast the thorium fuel variant is characterized by an enhanced modera-tor/void coefficient.
By comparison the IMF assembly shows smaller values for the fuel temperature coefficient and partly positive moderator coefficient for the beginning of cycle as a consequence of the high initial Pu-fiss content. Its effect is reduced by the continous consumption of there isotopes. The use of burnable absorber (gadolinium ox-ide) in this CERMET fuel is needed to reduce the higher local power peaking and to compensate the reactivity swing resulting from the high amount of initial Pu.
Both the (Th/Pu)O2 as well as the IMF fuelled core are associated with an enhanced performance in reduc-tion of Plutonium and TRU (per MW reactor power). In view of long-lived radwaste generation the fraction of plutonium reduction leading to minor actinides is compa-rable for (Th/Pu)O2 and IMF. In the case of MOX fuel a considerable higher fraction of the total converted Pluto-nium result in the production of higher isotopes.
References 1. G. Lombardi, et al, Neutronic analysis for U-free
inert matrix and Thoria fuels for plutonium disposi-tion in PWR, J. Nuclear Materials, 274 (1999), p. 181-188
2. A. Galperin, et al, Thorium Fuel for Light Water Reactors, Science & Global Security 6, (1997)
3. T.H. Pigford, Thorium Fuel Cycles Compared to Uranium Fuel Cycles, J. Phys. IV (1999)
4. T. Bodewich, Optimized Transmutation of Pluto-nium and Americium in PWR”, Report of Research Centre Juelich, Juel-4131 (2004)
5. International Atomic Energy Agency, Viability of inert matrix fuel in reducing plutonium amounts in reactors, IAEA-TECDOC-1516 (2006)
6. T.Ogawa, Tulenko, J. Porta, Innovative fuel forms for better fuel management of nuclear Waste, OECD NEA Workshop on the back end of the fuel cycle, Avignon, France, (1998)
7. D. I. Posten et al, “Monte-burns 2.0: User’s Man-ual”, LA-UR-99-4999, (1999)
8. X-5 Monte-Carlo Team, “ MCNP: A General Monte Carlo N-Particle Transport Code, Version 5” LA-UR-03-1987, (2003)
9. R. Nabbi, et al, “Application of Coupled Monte Carlo and Burnup Method using High Performance Computers” , ANS Conf. on MC Methods, Chatta-nooga, USA (2005)
10. IAEA, Potential of thorium based fuel cycles to con-strain plutonium and reduce long lived waste toxic-ity, Final report of a co-ordinated research Project (April 2003)
Page 28 of 34

Kopplung des Monte-Carlo-Codes MCNP und des Aktivierungscodes FISPACT mit automatischer Visualisierung
P. Bourauel 1, R. Nabbi1, W. Biel1, R. Forrest2
1 FZ Jülich, Institut für Energieforschung, Leo-Brandt-Strasse, D-52428 Jülich 2 UKAEA, Culham Science Center, Abingdon, OX14 3DB, GB
1. Einleitung
Der 3D Monte-Carlo Computercode MCNP [1] wird neben Kritikalitätsberechnungen für kerntechnische Sys-teme auch für die Simulation des Strahlen- und Partikel-transports benutzt. Die daraus gewonnenen Ergebnisse über die Neutro-nenflussverteilung und der dazugehöri-gen Spektra erlauben es, mit Aktivierungscodes wie FISPACT [2] und den entsprechenden nuklearen Daten-banken Aussagen über die Materialaktivierung, nukleare Aufheizung und Strahlenschäden zu erlangen.
Durch den stochastischen Charakter der Teilchen- und Strahlentransportvorgänge werden die Ergebnisse mit den Materialzellen verknüpft, aus denen das Geomet-riemodell von MCNP aufgebaut wird. Ist eine hohe räumliche Auflösung für die Flux-Mapping- und Aktivie-rungsberechnungen mit FISPACT erforderlich, wird eine feine Segmentierung der MCNP-Geometrie zwingend, was wiederum einen beträchtlichen Aufwand für den Modellierungsprozess bedeutet. Aus diesem Grunde werden weltweit mehrere Simulationsmethoden entwi-ckelt mit dem Ziel, die Datenübergabe zwischen MCNP und FISPACT zu automatisieren und zu optimieren [3].
In der vorliegenden Arbeit wird eine neue Methode vorgestellt, welche eine geometrische Segmen-tierung für einen gekoppelten Einsatz von MCNP und FISPACT vornimmt, indem sogenannte, überlagerte Mesh-Tallies und interne Partikel-verfolgung (Particle Tracing) kom-biniert werden. Das Verfahren bietet ebenfalls eine Rou-tine zur detaillierten graphischen Darstellung bzw. Vi-sualisierung der Aktivierungsanalyse, sowie der Neutro-nenflussverteilung über die gesamte Geometrie eines jeden beliebigen Modells. Die Methode wurde aus dem Bedarf hinaus entwickelt, das Modell mit dem Aufbau eines Port Plugs, als Komponente für den internationalen Fusionsreaktor ITER, neutronenphysikalisch zu untersu-chen. Durch die komplexe Geometrie des Bauteils und fortlaufenden Änderungen innerhalb des Designprozesses soll das neue Verfahren eine effiziente und zeitsparende Analyse für jede mögliche Konfiguration erlauben.
2. Beschreibung des ITER Port Plugs
Einer der komplexen Port Plugs beinhaltet das soge-nannte Ladungsaustausch- Rekombinationsspektrometer (CXRS), das der Erfassung und Analyse der elektromag-netischen Strahlung aus dem Plasmabereich und den Randschichten der Fusionskammer dient. Das System wird in einem der oberen Port Plugs installiert und be-steht aus zahlreichen Komponenten, wie Glasfaseropti-sche Kanäle, Spektrometer und Detektoren (Abb. 1). Da das dort herrschende Neutronen- und Strahlenfeld einen maßgeblichen Einfluss auf Funktion, Materialschäden, Lebensdauer, Abschirmverhalten und Aktivierung der Komponenten hat, ist eine genaue Modellierung und neu-tronenphysikalische Analyse des gesamten Systems von besonderer Bedeutung. Im Rahmen dieser Arbeit wurde ein detailliertes Modell erstellt, um das Verhalten der Komponenten und Strukturen im Hinblick auf die Neut-ronenflussverteilung, nukleare Aufheizung und Strahlen-schäden zu untersuchen [4].
Abb. 1: Detailmodell des Port Plug
Page 29 of 34

3. Simulationsverfahren für die Aktivierungsanalyse
Die Verfahren nutzt die FMESH-Technik von MCNP, wobei ein dreidimensionales Gitter über den zu analysierenden Bereich der Geometrie gelegt wird, wel-ches beliebig in der Größe und Auflösung variieret wer-den kann. Für jedes Element dieses Gitters wird die Neu-tronen-flussdichte während eines MCNP-Laufs ermittelt und in Form einer zweidimensionalen Matrix ausgege-ben, welche zusammen mit dem Geometriemodell der MCNP-Berechnung zwei- oder dreidimensional (z.B. 3D-Field) graphisch dargestellt wird (Abb.2). Die Nut-zung der FMESH-Technik für Visualisierungszwecke ist besonders hilfreich bei der Darstellung von Daten über das gesamte Geometriemodell und ein effizientes Werk-zeug für das Verständnis der unterliegenden physikali-sche
Spektrum zu einem FISPACT-Inpu
nungen (mit ilfe von MCNP) durchführen zu können.
Abb. 2: Neutronenflussdichte in ITER
4. A
n Prozesse.
Für die Aktivierungsberechnungen mit FISPACT müssen die Ergebnisse von MCNP entsprechend aufbe-reitet werden. Während letzteres dreidimensionale Ver-teilungen liefert, erzeugt FISPACT mit der Lösung von Nuklidbilanzgleichungen nulldimensionale Nuklidvekto-ren unter Anwendung eigener nuklearer Datenbibliothe-ken. Um eine dreidimensionale Aktivitätsverteilung zu erhalten, werden die MCNP-Daten auf äquidistante Stützstellen bzw. Gitterelemente verteilt, deren Abstände den FMESH-Maschenpunkten entsprechen. Für jedes Gitterelement müssen außerdem noch Materialzusam-mensetzung und Masse bestimmt werden, was über eine separate Samplingroutine geschieht. Zu diesem Zweck werden mit Hilfe von MCNP zufällige Source-Ereignisse im gesamten Maschennetz generiert, deren relative Häu-figkeit in den Elementen den Volumenanteil und die Nuklidkonzentration im jeweiligen Element bestimmt. Diese werden anschließend mit der lokalen Neutronen-flussdichte und dem
tfile kombiniert.
Die einzelnen FISPACT Ausgabedateien werden wiederum in ein Format umgewandelt, welches verschie-dene Größen wie Aktivitätsinventar, nukleare Wärme-leistung und Gammadosis nuklidspezifisch beinhaltet. Diese werden in Verbindung mit dem Geometriemodell zur Visualisierung der Ergebnisse herangezogen. Darüber hinaus wird das von FISPACT erzeugte Gammaspektrum der Aktivierungsprodukte in ein neues Source-File um-gewandelt, um damit für dasselbe Geometriemodell und die Konfiguration GammatransportberechH
nalyse der Rechenergebnisse
Die vorgestellte Schnittstellenroutine wurde mittels existierender MCNP-Modelle für den Kernfusions-reaktor ITER und den CXRS-Port-Plug getestet und ge-prüft, wobei die eigenen früheren Berechnungen als auch diese von anderen Forschungsgruppen herangezogen wurden [5][6]. Zu diesem Zweck wurde auf der Basis eines hochaufgelösten MESH-Gitters sowohl für das gesamte ITER-Modell als auch für die ausgewählten Komponenten eine Langzeit-simulation durchgeführt. Die daraus gewonnenen Ergebnisse wurden mit Hilfe der hier vorgestellten Schnittstellenroutine für die Aktivie-rungsanalyse mit FISPACT verwendet. Als Vergleichs-größe wurden das Aktivitätsinventar, die Verteilung der Zerfallsprodukte und Zerfallswärme herangezogen und mit solchen der anderen Gruppen, insbesondere für den CXRS Port Plug verglichen. An der Position des ersten Spiegels im Labyrinth wurden 7.30E+13 n/cm²s und 1.95 W/cm³ für Neutronenfluss (Abb.3 rechts) bzw. nukleare Wärmeleistung bestimmt. An der Position des hinteren Fensters ergaben sich 4.66E+7 n/cm²s für den Neutro-nenfluss und 1.20E-6 W/cm³ für die nukleare Aufhei-zung.
Berechnet wurde außerdem die Verteilung der Heli-umproduktionsrate an einer kritischen Position an der Vorderseite des Port Plugs. Demnach beträgt das Maxi-mum an dieser Stelle 0.15 ppm, was unterhalb der oberen Grenze von 1 ppm liegt. Die He-Produktionsrate in den geschweißten Bauteilen ist um zwei Größen-ordnungen geringer als in den umgebenden Komponenten. Der Grund hierfür ist ein höherer Kühlwassergehalt in diesen Strukturen. Der Vergleich mit den Ergebnissen anderer
Page 30 of 34

Page 31 of 34
Referenzen Gruppen zeigt eine Abweichung von weniger als 2 % für den Neutronenfluss und weniger als 10 % für die Heli-umkonzentration als Aktivierungsprodukt. Die Abwei-chungen sind möglicherweise auf die Unterschiede der nuklearen Datenbibliotheken verschiedener Versionen und Updates und die statistischen Unsic
[1] BRIESMEISTER, J.F.; MCNP5 MONTE CARLO N-PARTICLE TRANSPORT CODE SYSTEM, RSICC, LOS ALAMOS, 2000, CCC-0730
[2] FORREST, R.A., ET AL; FISPACT 2005: USER MANUAL, UKAEA FUSION, REPORT UKAEA FUS 514, 2005
herheiten deMon
n andererseits im Hinblick auf die Designop-mierung.
s te-Carlo-Verfahrens zurückzuführen.
Die Anwendung des neuen Verfahrens auf die kom-plexe geometrische Struktur und Konfiguration des ITER-Port-Plugs zeigt eine gute Übereinstimmung mit den Ergebnissen anderer Gruppen. Die somit verifizierte Methode bietet ein neuartiges Verfahren zur detaillierten Analyse der neutronenphysikalischen Vorgänge und des nuklearen Materialverhaltens sowohl für die Strukturen des ITER, als auch für jede Anordnung von Materialzel-len beliebiger Geometrie. Die darin integrierten Visuali-sierungsroutinen erlauben die Darstellung physikalischer Vorgänge in hoher Auflösung einerseits und die Untersu-chung der Auswirkungen auf die Modell- und Geomet-rievariatione
[3] CHEN, Y., FISCHER, U.; RIGOROUS MCNP BASED SHUTDOWN DOSE RATE CALCULATIONS: COMPUTATIONAL SCHEME, VERIFICATION CALCULATIONS AND APPLICATION TO ITER, FUSION ENGINEERING AND DESIGN 63-64 (2002) 107 - 114
[4] BOURAUEL, P. NABBI, R.; SOPHISTICATED NEUTRONIC CALCULATION OF THE ITER UPPER PORT DIAGNOSTIC SYSTEM USING MONTE CARLO METHOD , RRFM CONFERENCE, HAMBURG 2008
[5] SHATALOV G.E., SHELUDIKOV, S.V.; UPPER PORT #3 NEUTRONIC ANALYSIS, MOSCOW 2002, REF NO. G55 MD 161 03-10-06 W 0.1. ti
[6] SERIKOV, A, ET AL; RADIATION SHIELDING ANALYSES FOR THE ITER UPPER PORT ECRH LAUNCHER; THE ANS TOPICAL MEETING OF THE RADIATION PROTECTION AND SHIELDING DIVISION,USA,200
Abb. 3: B lug: Materialschäden [log[dpa]] (links), erechnungen für den ITER-CXRS-Port-PNeutronenflussdichte [log[1/cm²s]] (rechts)

MONTE-CARLO-BASED SIMULATION OF LWR CORES WITH INNOVATIVE FUEL CONCEPTS
R. Nabbi*, H.-J. Allelein*, O. Schitthelm*, D. F. da Cruz**
*Forschungszentrum, D-52425 Juelich, Germany **NRG, P.O. Box 25, 1755 ZG Petten, The Netherlands
High resolution Monte-Carlo simulations show that the neutron spectrum, fuel burnup and fuel temperature feedback effect of a PWR core loaded with Thoria-based fuel (Th/Pu-O2) do not significantly differ from the MOX fuelled one due to the similar neutronic characteristics of both fertile materials (Th-232, U-238). The core physics of this fuel variant is characterized by an enhanced moderator/void temperature coefficient (by factor 2.4) and high incineration rate for Pu (approx. 60 %). A PWR core loaded with the Molybdenum-based inert matrix fuel (IMF) -in contrast to MOX-, shows a harder spectrum, resulting in small temperature coefficients of reactivity and particularly in a higher fuel de-pletion rate as well as an enhanced TRU reduction performance. The incineration of Pu amounts to 46 % re-sulting, in turn, in generation of minor actinides of about 10 % of the total Pu consumption. The higher excess reactivity resulting from the initial Pu contents is controlled by the use of gadolinium oxide (dispersed) in the metallic matrix.
1. Introduction
During the last years, comprehensive research works have been conducted to study the neutronic performance, trans-mutation potential and safety characteristics of the so called Inert Matrix Fuels (IMF) including thoria-based fuel in the aim of reducing the current excess stockpiles of plutonium and other trans-uranium elements [1-3]. Among the others and as a new option metallic matrix consisting of depleted Molybdenum is proven to be one of the promising and feasible concept [4]. In comparison to the conventional fuel of UO2 and MOX type, the new CERMET fuel as well as the thoria-based fuel matrix exhibit well-promising neutronic behaviour and safety characteristics with considerable transmutation potential for transuranium (TRU).
The purpose of the present work is to investigate at what extent and how the neutronic performance is influ-enced by the change of fuel type from MOX to Th/Pu-O2 fuel and IMF variant. Due to the complexity of reactor core configurations and respective neutronic processes, advanced models and methods are needed. For this aim parallelized MONTE-BURNS code based on the MCNP Monte-Carlo Code and ORIGEN is employed in combi-nation with NJOY for the generation of nuclear data files [5-7].
2. Specification of fuel variants
The design of the fuel assembly is based on a stan-dard 17x17-25 PWR one of different fuel loadings. The MOX fuel assembly (14x14-16) contains a mixtures of PuO2 and UO2 with the enrichment of 3.90/0.71 wt% for Pufiss and U-235 respectively. Pu is originating from the 1st generation Pu discharged from current fleet of LWRs with a final burnup of 41 MWd/kgHM. Regarding the (Th/Pu)O2 fuel the initial composition derives from the recovered Pu from a reference UO2-core after a target burnup of 60 MWd/kgHM. With respect to the reactivity control boron is added to in the coolant in a certain con-centration.
The IMF fuel pellets are composed of PuO2 particles dispersed in a matrix consisting of depleted molybde-num. The PuO2 content is 12 % (vol) with a Pu vector equivalent to the 1st generation Pu dis-charged from a standard UO2 core after a burnup level of 41 MWd/kgHM. With respect to the control of the excess reactivity at BOC the fuel pins contain 6.0 wt% of Gd2O3 dispersed homogeneously in the matrix.
Page 32 of 34
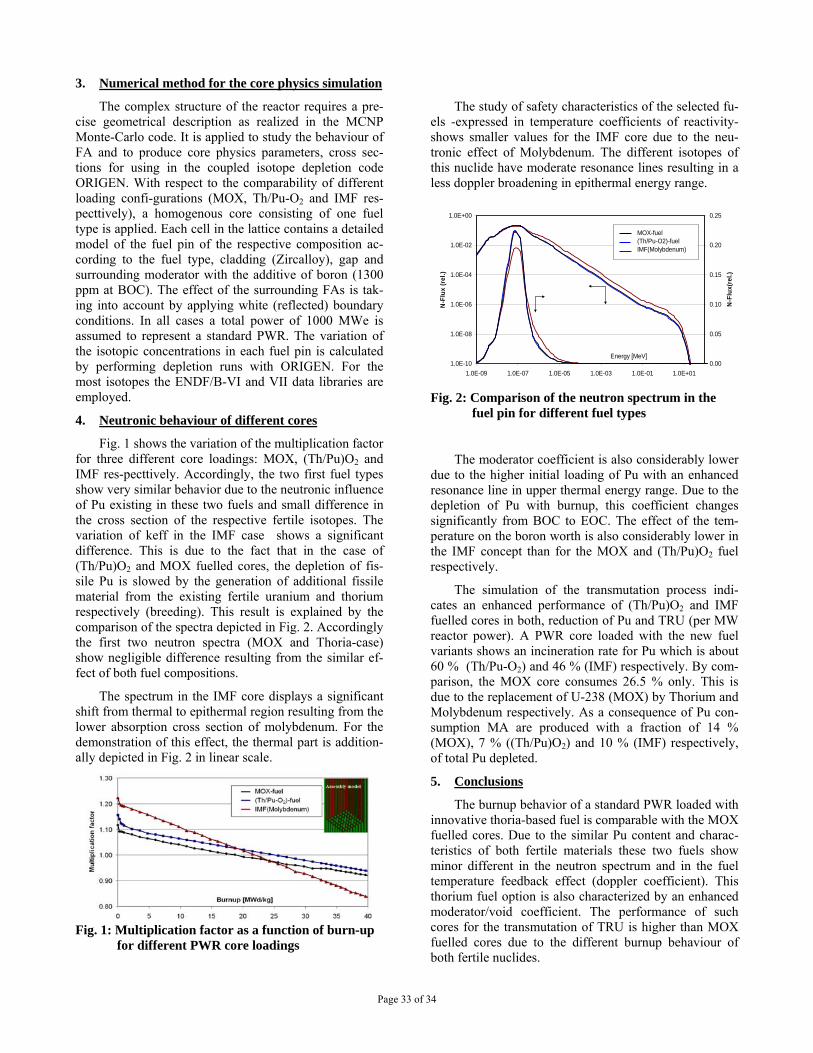
3. Numerical method for the core physics simulation
The complex structure of the reactor requires a pre-cise geometrical description as realized in the MCNP Monte-Carlo code. It is applied to study the behaviour of FA and to produce core physics parameters, cross sec-tions for using in the coupled isotope depletion code ORIGEN. With respect to the comparability of different loading confi-gurations (MOX, Th/Pu-O2 and IMF res-pecttively), a homogenous core consisting of one fuel type is applied. Each cell in the lattice contains a detailed model of the fuel pin of the respective composition ac-cording to the fuel type, cladding (Zircalloy), gap and surrounding moderator with the additive of boron (1300 ppm at BOC). The effect of the surrounding FAs is tak-ing into account by applying white (reflected) boundary conditions. In all cases a total power of 1000 MWe is assumed to represent a standard PWR. The variation of the isotopic concentrations in each fuel pin is calculated by performing depletion runs with ORIGEN. For the most isotopes the ENDF/B-VI and VII data libraries are employed.
1.0E-10
1.0E-08
1.0E-06
1.0E-04
1.0E-02
1.0E+00
Energy [MeV]
N-F
lux
(rel
.)
0.00
0.05
0.10
0.15
0.20
0.25
N-F
lux(
rel.)
1.0E-09 1.0E-07 1.0E-05 1.0E-03 1.0E-01 1.0E+01
MOX-fuel(Th/Pu-O2)-fuelIMF(Molybdenum)
4. Neutronic behaviour of different cores
Fig. 1 shows the variation of the multiplication factor for three different core loadings: MOX, (Th/Pu)O2 and IMF res-pecttively. Accordingly, the two first fuel types show very similar behavior due to the neutronic influence of Pu existing in these two fuels and small difference in the cross section of the respective fertile isotopes. The variation of keff in the IMF case shows a significant difference. This is due to the fact that in the case of (Th/Pu)O2 and MOX fuelled cores, the depletion of fis-sile Pu is slowed by the generation of additional fissile material from the existing fertile uranium and thorium respectively (breeding). This result is explained by the comparison of the spectra depicted in Fig. 2. Accordingly the first two neutron spectra (MOX and Thoria-case) show negligible difference resulting from the similar ef-fect of both fuel compositions.
The spectrum in the IMF core displays a significant shift from thermal to epithermal region resulting from the lower absorption cross section of molybdenum. For the demonstration of this effect, the thermal part is addition-ally depicted in Fig. 2 in linear scale.
Fig. 1: Multiplication factor as a function of burn-up
for different PWR core loadings
The study of safety characteristics of the selected fu-els -expressed in temperature coefficients of reactivity- shows smaller values for the IMF core due to the neu-tronic effect of Molybdenum. The different isotopes of this nuclide have moderate resonance lines resulting in a less doppler broadening in epithermal energy range.
Fig. 2: Comparison of the neutron spectrum in the fuel pin for different fuel types
The moderator coefficient is also considerably lower due to the higher initial loading of Pu with an enhanced resonance line in upper thermal energy range. Due to the depletion of Pu with burnup, this coefficient changes significantly from BOC to EOC. The effect of the tem-perature on the boron worth is also considerably lower in the IMF concept than for the MOX and (Th/Pu)O2 fuel respectively.
The simulation of the transmutation process indi-cates an enhanced performance of (Th/Pu)O2 and IMF fuelled cores in both, reduction of Pu and TRU (per MW reactor power). A PWR core loaded with the new fuel variants shows an incineration rate for Pu which is about 60 % (Th/Pu-O2) and 46 % (IMF) respectively. By com-parison, the MOX core consumes 26.5 % only. This is due to the replacement of U-238 (MOX) by Thorium and Molybdenum respectively. As a consequence of Pu con-sumption MA are produced with a fraction of 14 % (MOX), 7 % ((Th/Pu)O2) and 10 % (IMF) respectively, of total Pu depleted.
5. Conclusions
The burnup behavior of a standard PWR loaded with innovative thoria-based fuel is comparable with the MOX fuelled cores. Due to the similar Pu content and charac-teristics of both fertile materials these two fuels show minor different in the neutron spectrum and in the fuel temperature feedback effect (doppler coefficient). This thorium fuel option is also characterized by an enhanced moderator/void coefficient. The performance of such cores for the transmutation of TRU is higher than MOX fuelled cores due to the different burnup behaviour of both fertile nuclides.
Page 33 of 34

Page 34 of 34
The new IMF variant is distinguished by high fuel consumption rate and transmutation of TRU generated with the fission process. The core physics of such a core is characterised by a harder neutron spectrum and moder-ate safety parameters. Due to higher conductivity of the metallic matrix of this fuel a moderate temperature pro-file is expected in the fuel rods. For the control of the excess reactivity resulting from the high initial Pu load-ing burnable absorber (gadolinium oxide 6.0 wt%) is used that leads to the smoothing of the power density distribution and reactivity swing.
REFERENCES 1. G. Lombardi, et al, “Neutronic analysis for U-free
inert matrix and Thoria fuels for plutonium disposi-tion in PWR”, J. Nuclear Materials 274 (1999), p. 181-188
2. A. Galperin, et al, “Thorium Fuel for Light Water Reactors”, Science & Global Security 6 (1997)
3. T. Bodewich, “Optimized transmutation of Pluto-nium and Americium in PWR” Report of Research Centre Juelich, Juel-4131, May 2004
4. T.Ogawa, Tulenko, J. Porta,”Innovative fuel forms for better fuel management of nuclear Waste” OECD NEA Workshop on the back end of the fuel cycle, Avignon, France, Oct. 1998
5. D. I. Posten et al, “Monteburns 2.0: User’s Manual”, LA-UR-99-4999, (1999)
6. X-5 Monte-Carlo Team, “ MCNP: A General Monte Carlo N-Particle Transport Code, Version 5” LA-UR-03-1987, (2003)
7. R. Nabbi, et al, “Application of Coupled Monte-Carlo and Burnup Method using High Perfor- mance Computers” , ANS Conf. on MC Methods, Chattanooga, USA (2005)