safety nets in the rural sector, mexico luis f. lópez-calva universidad de las américas, puebla...
TRANSCRIPT

Safety Nets in the Safety Nets in the Rural Sector, Rural Sector,
Mexico Mexico
Luis F. López-CalvaLuis F. López-Calva
Universidad de las Américas, Universidad de las Américas, PueblaPuebla
ROA ProjectROA Project
Rome, October 2003Rome, October 2003

ObjectiveObjective
• This part of the study looks at the This part of the study looks at the existence of informal safety nets in the existence of informal safety nets in the rural sector, and whether such networks rural sector, and whether such networks depend on characteristics that are depend on characteristics that are specific to the rural sectorspecific to the rural sector
• The idea is to look at a different The idea is to look at a different dimension of rural poverty: vulnerabilitydimension of rural poverty: vulnerability
• As we shall see, access to formal markets As we shall see, access to formal markets is limitedis limited

Objective (2)Objective (2)
• In order for such networks to be In order for such networks to be sustainable, according to the theory sustainable, according to the theory of coopeerative arrangements in of coopeerative arrangements in non-cooperative settings, one has to non-cooperative settings, one has to look at:look at:– Information flows and observabilityInformation flows and observability– Acces to formal marketsAcces to formal markets– Existence of other types of contingent Existence of other types of contingent
flows (government)flows (government)

Objective (3)Objective (3)
• Among the policy implications, two Among the policy implications, two are worth emphasizing:are worth emphasizing:– Government transfers have to be Government transfers have to be
designed in a way that does not conflict designed in a way that does not conflict with pre-existing local arrangements or with pre-existing local arrangements or consider that they may do soconsider that they may do so
– In principle, pre-existing networks In principle, pre-existing networks could be the basis of a government could be the basis of a government intervention, in a bottom-up fashion intervention, in a bottom-up fashion (Morduch and Sharma, 2002) (Morduch and Sharma, 2002)

MethodologyMethodology
• Theoretical models have analyzed Theoretical models have analyzed conditions under which informal conditions under which informal insurance and credit networks can insurance and credit networks can be sustainable in non-cooperative be sustainable in non-cooperative environments (without altruism)environments (without altruism)
• The main models are: Coate and The main models are: Coate and Ravallion (1993), Kandori (1992), Ravallion (1993), Kandori (1992), Ghosh and Ray (1996), Genicot and Ghosh and Ray (1996), Genicot and Ray (2002)Ray (2002)

Methodology (2)Methodology (2)
• The main issues for sustainability are:The main issues for sustainability are:– Information flows (moral hazard and Information flows (moral hazard and
adverse selection issues)adverse selection issues)
– Outside opportunities, in order for the Outside opportunities, in order for the social punishment to work (participation social punishment to work (participation constraint)constraint)
– Access to formal insurance and credit Access to formal insurance and credit marketsmarkets

Methodology (3)Methodology (3)
• Empirically, efforts have been focused Empirically, efforts have been focused on:on:– Showing the existing of consumption Showing the existing of consumption
smoothing in absence of formal marketssmoothing in absence of formal markets– Showing different mechanisms to smooth Showing different mechanisms to smooth
consumption (livestock, child labor, inter-consumption (livestock, child labor, inter-vivos transfers)vivos transfers)
– Proving the existence and relative Proving the existence and relative importance of iner-vivos transfersimportance of iner-vivos transfers
– Analyzing the role of public transfers on Analyzing the role of public transfers on the sustainiability of the arrangementsthe sustainiability of the arrangements

ConsequencesConsequences• Examples of actions to face shocks are (Morduch and
Sharma, 2002):– Pulling school-age children out of school either to save
on schooling costs or, more commonly, to place them in the labor market to earn additional income (e.g., Jacoby and Skoufias 1997; Jensen 2000);
– Reducing or even canceling planned investments in maintenance of business assets that may result in reduced income in future periods.
– Depleting free-access community resources such as forest products in order to finance current consumption;
– Reducing consumption of nutritious foods that are likely to have more serious longer-term consequences on the health status of children

Consequences (2)Consequences (2)• Choosing not to honor social obligations such as
payment of taxes or other contributions to community- level activities, leading to erosion of social cohesion and social instability;
• Engaging in distress sales of productive assets such as land or other household assets that permanently damage future earning potential;
• Participating in patron-client relationships with grossly disadvantageous terms of trade, e.g., bonded laboring;
• Resorting to distress- induced migration, often to urban centers where there are not only additional risks in employment but also even more limited informal insurance than previously.

Main ReferencesMain References
• Townsend (1994), IndiaTownsend (1994), India• Dearden and ravallion (1988), Dearden and ravallion (1988),
IndonesiaIndonesia• Cox and Jimenez (various), Central Cox and Jimenez (various), Central
Asia and Eastern EuropeAsia and Eastern Europe• Jacoby and Skoufias, Perú and IndiaJacoby and Skoufias, Perú and India• García-Verdú (2002), MéxicoGarcía-Verdú (2002), México
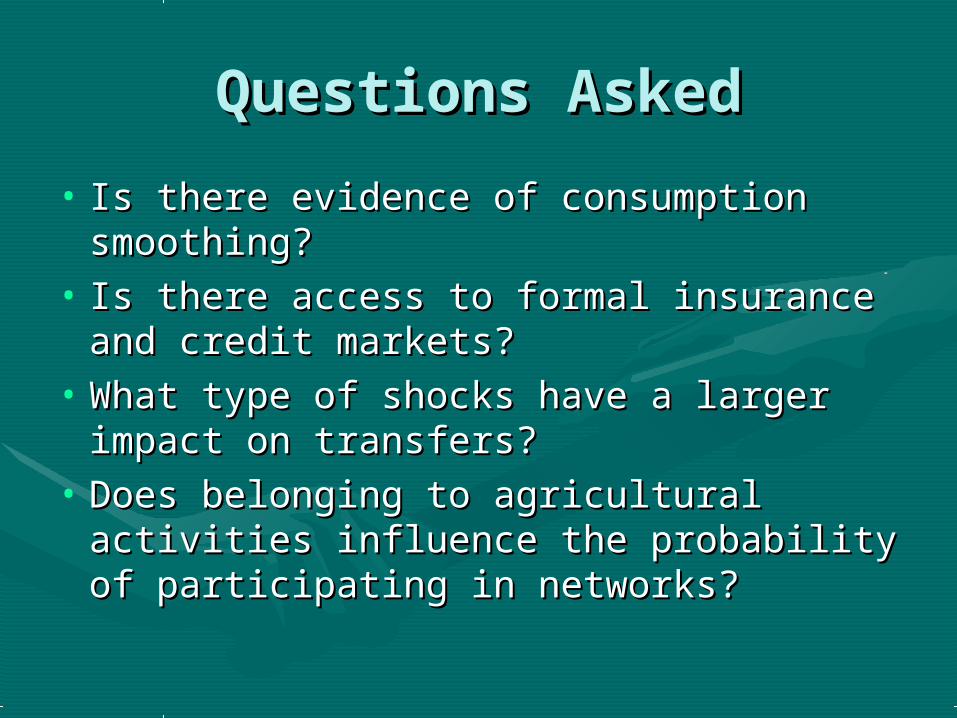
Questions AskedQuestions Asked
• Is there evidence of consumption Is there evidence of consumption smoothing?smoothing?
• Is there access to formal insurance Is there access to formal insurance and credit markets?and credit markets?
• What type of shocks have a larger What type of shocks have a larger impact on transfers?impact on transfers?
• Does belonging to agricultural Does belonging to agricultural activities influence the probability of activities influence the probability of participating in networks?participating in networks?

Questions Asked (2)Questions Asked (2)
• What is the role of “social capital” in What is the role of “social capital” in the community?the community?

DataData• In 1997, the federal government of In 1997, the federal government of
Mexico introduced the Programa de Mexico introduced the Programa de Educación, Salud y Alimentación (the Educación, Salud y Alimentación (the Education, Health, and Nutrition Education, Health, and Nutrition Program), known by its Spanish acronym, Program), known by its Spanish acronym, PROGRESA, as part of its renewed effort PROGRESA, as part of its renewed effort to break the intergenerational to break the intergenerational transmission of poverty. transmission of poverty.
• ENCEL and ENCASEH consist of one ENCEL and ENCASEH consist of one baseline and five follow-up surveys baseline and five follow-up surveys collected approximately every six months collected approximately every six months from 1998 to 2000. from 1998 to 2000.

Data (2)Data (2)
• These surveys form a longitudinal or panel data These surveys form a longitudinal or panel data set which follows the same households over a set which follows the same households over a three-year period. The panel consists of three-year period. The panel consists of approximately 26,000 households on 138,000 approximately 26,000 households on 138,000 individuals. individuals.
• One of the most innovative characteristics of One of the most innovative characteristics of Progresa is its experimental design, since once Progresa is its experimental design, since once the selection of eligible communities took place, the selection of eligible communities took place, villages were chosen randomly to participate in villages were chosen randomly to participate in the program. Thus, randomization took place at the program. Thus, randomization took place at the village level and not at the household level the village level and not at the household level (Behrman and Todd, 2001)(Behrman and Todd, 2001)

Data (4)Data (4)
• This empirical study is based on a This empirical study is based on a panel of 18,836 households. panel of 18,836 households.

Data (5)Data (5)
• The PROGRESA database does not allow The PROGRESA database does not allow us, for example, to see the role of “social us, for example, to see the role of “social capital”capital”
• Access to more formal markets is Access to more formal markets is basically the same throughout the basically the same throughout the PROGRESA communitiesPROGRESA communities
• In order to analyze questions related to In order to analyze questions related to the latter, we carried out a survey in two the latter, we carried out a survey in two rural communities: Cuetzalan and rural communities: Cuetzalan and CholulaCholula

SurveySurvey
• Cuetzalan and Cholula, rural Cuetzalan and Cholula, rural municipalities in the state of Puebla, municipalities in the state of Puebla, with 350 individuals surveyed, with 350 individuals surveyed, randomly selected in poor rural randomly selected in poor rural sectorsector

Shocks and TransfersShocks and TransfersType of Impact Individuals Transfer in Money Food Clothes TimeLoss of lands for cultivation 9.42% 4.00% 71.43% 14.29% 14.29% 0.00%Loss of crops 69.79% 7.41% 77.08% 14.58% 9.38% 0.00%
Loss of dwelling 1.18% 100.00% 0.00% 0.00% 0.00% 0.00%Loss of households 0.22% 0.00% 0.00% 0.00% 0.00% 0.00%Loss of a household member 0.05% 0.00% 0.00% 0.00% 0.00% 0.00%
Loss of animals 3.02% 12.50% 71.43% 14.29% 14.29% 0.00%Injury of a household member 0.32% 16.67% 0.00% 0.00% 0.00% 0.00%Departure of a household member 1.24% 13.04% 13.04% 0.00% 0.00% 0.00%Other 7.81% 11.72% 76.47% 17.65% 5.88% 0.00%Doesn't know 6.95% 6.20% 75.00% 12.50% 12.50% 0.00%Total 100.00%
Tranfer in of those reporting impact

EstimationEstimation
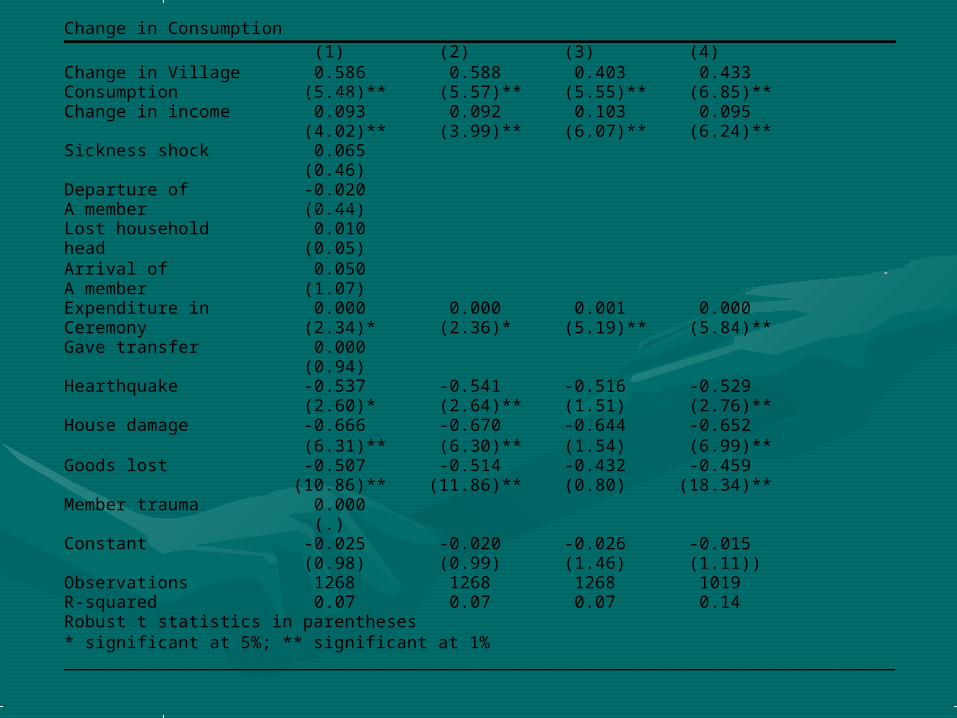
Change in Consumption (1) (2) (3) (4) Change in Village 0.586 0.588 0.403 0.433 Consumption (5.48)** (5.57)** (5.55)** (6.85)** Change in income 0.093 0.092 0.103 0.095 (4.02)** (3.99)** (6.07)** (6.24)** Sickness shock 0.065 (0.46) Departure of -0.020 A member (0.44) Lost household 0.010 head (0.05) Arrival of 0.050 A member (1.07) Expenditure in 0.000 0.000 0.001 0.000 Ceremony (2.34)* (2.36)* (5.19)** (5.84)** Gave transfer 0.000 (0.94) Hearthquake -0.537 -0.541 -0.516 -0.529 (2.60)* (2.64)** (1.51) (2.76)** House damage -0.666 -0.670 -0.644 -0.652 (6.31)** (6.30)** (1.54) (6.99)** Goods lost -0.507 -0.514 -0.432 -0.459 (10.86)** (11.86)** (0.80) (18.34)** Member trauma 0.000 (.) Constant -0.025 -0.020 -0.026 -0.015 (0.98) (0.99) (1.46) (1.11)) Observations 1268 1268 1268 1019 R-squared 0.07 0.07 0.07 0.14 Robust t statistics in parentheses * significant at 5%; ** significant at 1% ________________________________________________________________________________

Change in Consumption. (1) (2) (3) (4) (5) Change in Village 0.575 0.620 0.620 0.623 0.627 Consumption (5.36)** (12.75)** (12.61)** (12.86)** (12.77)** Change in 0.094 Income (4.03)** Sickness shock 0.051 (2.18)* Suffered 0.017 Any Impact (0.66) A member -0.067 Left household (4.57)** Lost household -0.230 head (3.62)** Constant -0.008 -0.048 -0.046 -0.041 -0.026 (0.41) (5.47)** (4.69)** (5.06)** (2.83)** Observations 1268 18802 18802 18802 18802 R-squared 0.06 0.03 0.03 0.03 0.03 Robust t statistics in parentheses * significant at 5%; ** significant at 1% ________________________________________________________________________________ Suffered Any Impact includes impacts for lost of land, crops, house, goods, family members, animals or departure of a household member.

(1) (2) (3) (4) lnCc lnCc lnCc lnCc lnCcLoc 0.878 ** 0.878 ** 0.878 0.855 (15.85) (15.84) (15.85)** (26.23)** lnYy 0.073 ** 0.073 ** 0.073 ** 0.076 ** (7.40) (7.39) (7.40) (10.50) Denferm -0.035 ** (2.70) DIseFue -0.114 ** -0.118 ** -0.118 ** -0.119 ** (8.05) (8.61) (8.62) (8.88) DCivilSolo -0.093 (1.13) DILlego 0.010 (0.59) GtoenCeremonias00 0.000 ** 0.000 ** 0.000 ** 0.000 ** (3.34) (3.35) (3.35) (6.34) TransfOut00 0.000 (1.04) Dterrem -0.369 * -0.383 * -0.375 * -0.312 ** (2.25) (2.28) (2.22) (2.90) DImpacCasa -0.103 (1.28) DImpacCosas 0.243 (1.24) Constant 0.021 0.022 * 0.022 * 0.025 ** (1.92) (2.09) (2.11) (3.80) Observations 11193 11193 11193 11193 R-squared 0.07 0.07 0.07 0.08 Robust t statistics in parentheses * significant at 5%; ** significant at 1%
Only change in food consumption (with autoconsumption)Only change in food consumption (with autoconsumption)

(1) (2) (3) (4) lnCc lnCc lnCc lnCc lnCcLoc 0.865 ** 0.843 ** 0.842 ** 0.851 ** (15.32) (24.98) (24.86) (25.39) lnYy 0.076 ** (7.66) Denferm -0.065 ** (3.52) DCivilSolo -0.174 ** (3.51) DIseFue -0.128 ** (11.93) Constant 0.007 0.002 -0.003 0.028 ** (0.83) (0.30) (0.59) (3.97) Observations 11193 18410 18410 18410 R-squared 0.06 0.05 0.05 0.05 Robust t statistics in parentheses * significant at 5%; ** significant at 1%

Determinants of Transfers Determinants of Transfers (Results)(Results)
Following Cox and Jiménez (1992)
--------------------------------------------------------------------------------------------------------
| Robust logTEpc | Coef. Std. Err. t P>|t| [95%
Conf. Interval]-------------
+------------------------------------------------------------------------------------------ sexo | .1420506 .0626449 2.27 0.024 .0187764
.2653248 enfer | .1803624 .064456 2.80
0.005 .0535244 .3072005 Muertejefe | .7144453 .2286573 3.12
0.002 .2644879 1.164403 nacim| .022522 .1982723 5.16
0.000 .6323574 1.412687 Agricola| .1492115 .0555691 2.69 0.008 .0398613
.2585616 cons | -.0883049 .0574466 -1.54 0.125
-.2013497 .02474
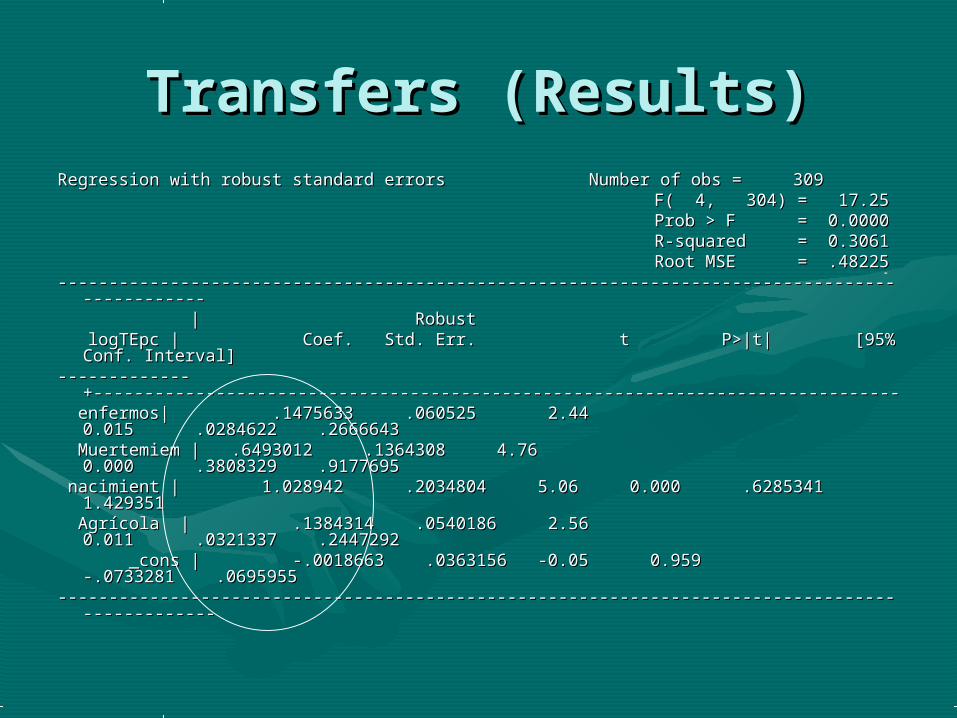
Transfers (Results)Transfers (Results)Regression with robust standard errors Number of obs = 309Regression with robust standard errors Number of obs = 309 F( 4, 304) = 17.25F( 4, 304) = 17.25 Prob > F = 0.0000Prob > F = 0.0000 R-squared = 0.3061R-squared = 0.3061 Root MSE = .48225Root MSE = .48225-------------------------------------------------------------------------------------------------------------------------------------------------------------------------------------------- | Robust| Robust logTEpc | Coef. Std. Err. t P>|t| [95% Conf. Interval]logTEpc | Coef. Std. Err. t P>|t| [95% Conf. Interval]-------------+---------------------------------------------------------------------------------------+------------------------------------------------------------------------------------ enfermos| .1475633 .060525 2.44 0.015 .0284622 .2666643enfermos| .1475633 .060525 2.44 0.015 .0284622 .2666643 Muertemiem | .6493012 .1364308 4.76 0.000 .3808329 .9177695Muertemiem | .6493012 .1364308 4.76 0.000 .3808329 .9177695 nacimient | 1.028942 .2034804 5.06 0.000 .6285341 1.429351nacimient | 1.028942 .2034804 5.06 0.000 .6285341 1.429351 Agrícola | .1384314 .0540186 2.56 0.011 .0321337 .2447292Agrícola | .1384314 .0540186 2.56 0.011 .0321337 .2447292 _cons | -.0018663 .0363156 -0.05 0.959 -.0733281 .0695955_cons | -.0018663 .0363156 -0.05 0.959 -.0733281 .0695955----------------------------------------------------------------------------------------------------------------------------------------------------------------------------------------------

Participation in the Participation in the Network (Results)Network (Results)
Probit estimates Number of obs = 308 LR chi2(6) = 4.52
Prob > chi2 = 0.6068Log likelihood = -76.994586 Pseudo R2 = 0.0285---------------------------------------------------------------------------------------------------------
pert | dF/dx Std. Err. z P>|z| x-bar [ 95% C.I. ]---------+-----------------------------------------------------------------------------------------------
Agr*| .0491653 .0362499 1.33 0.082 .529221 -.021883 .120214sKa*| .0143003 .0288019 0.49 0.026 .616883 -.04215 .070751lnipc| .0038482 .0116615 0.33 0.742 5.93567 -.019008 .026704Acc*| -.016988 .0501757 0.36 0.017 .103896 -.081355 .115331Gov*| -.0181572 .0410038 -0.40 0.689 .094156 -.098523 .062209
p82*| .0093162 .0360636 0.26 0.794 .409091 -.061367 .08---------+------------------------------------------------------------------------------------------------
obs. P | .0714286 ----------------------------------------------------------------------------------------------------------
(*) dF/dx is for discrete change of dummy variable from 0 to 1 z and P>|z| are the test of the underlying coefficient being 0

Access to marketsAccess to markets
• Cuetzalan 8% yes vs. 92% noCuetzalan 8% yes vs. 92% no
• CholulaCholula 15% yes vs. 85% no 15% yes vs. 85% no

Main Findings Main Findings (PROGRESA)(PROGRESA)
• There is robust evidence of consumption There is robust evidence of consumption smoothing, especially food consumptionsmoothing, especially food consumption
• Illness in family, losing household head, Illness in family, losing household head, facing a death in family or a birth do result facing a death in family or a birth do result in transfers into the householdin transfers into the household
• Aggregate shocks have a higher impact on Aggregate shocks have a higher impact on consumption, given the difficulty to hedgeconsumption, given the difficulty to hedge
• No evidence of government crowding out No evidence of government crowding out private transfers (as in García Verdú, 2002)private transfers (as in García Verdú, 2002)

Main Findings (Survey)Main Findings (Survey)
• Social capital, measured as perception of Social capital, measured as perception of trust, does matter for participation in the trust, does matter for participation in the networknetwork
• No evidence of government transfers having No evidence of government transfers having an impact on private transfersan impact on private transfers
• The more agriculture-dependent the family is, The more agriculture-dependent the family is, the more likely they will participate in the more likely they will participate in networknetwork
• Also, being more agriculture-dependent Also, being more agriculture-dependent increases transfersincreases transfers
• Having access to formal markets does reduce Having access to formal markets does reduce the probability of belonging to the networkthe probability of belonging to the network