saathi bachpan ke diarrhea prevention and management ...pdf.usaid.gov/pdf_docs/pa00hpfg.pdf ·...
TRANSCRIPT
Saathi Bachpan KeDiarrhea Prevention and ManagementBaseline Report
Findings | Summary | Recommendations
SAATHI BACHPAN KEDIARRHEA PREVENTION AND MANAGEMENT
BASELINE REPORT
FINDINGS | SUMMARY | RECOMMENDATIONS
DISCLAIMERThis Report is made possible by the support of the American People through the United States
Agency for International Development (USAID). The contents of this Report are the sole
responsibility of Abt Associates India Pvt. Ltd. and do not necessarily reflect the views of USAID or
the United States Government.
ACKNOWLEDGEMENTS
Funded by the United States Agency for International Development (USAID),
the Market-based Partnerships for Health (MBPH) project is being
implemented by Abt Associates and its consortium of partners. Developed
by MBPH, Saathi Bachpan Ke is a pilot program that builds partnerships and
leverages the strengths of the public and private sectors (pharmaceutical,
soap and hygiene product partners) for childhood diarrhea management.
Abt leads the design and implementation of the program’s research
component for assessing the effect of the intervention on the supply and
use of health commodities as well as the financial viability of the model. Data
collection for the program’s qualitative and quantitative baselines studies
were completed with assistance from local research firms.
MBPH would like to thank TNS Mode and Purple Audacity research teams
led by Sandeep Ghosh and Sharmila Das respectively, for their efforts in
collecting and analyzing the data for this report. The project is also indebted
to numerous individuals who participated in the baseline studies. By
responding to the quantitative study questionnaires and participating in
the in-depth interviews and focus group discussions that were the basis
for the qualitative research study, they helped provide valuable information
for both improving the design of the pilot program as well as for assessing
its impact.
The Abt research team also thanks USAID|India for its support, especially
Sheena Chhabra and Moni Sagar whose inputs and guidance have been
invaluable in shaping the design and implementation of the program. Finally,
the pilot program would not have been possible without the collaboration,
ideas and enthusiasm of our key partners Reckitt Benckiser- Dettol, Tata
Chemicals- Tata Swach and Alkem Laboratories- Alkem Ulticare.
Cover Design : J Walter Thompson
Photo Credits : Anand V Sinha, Kavita Ayyagari
TABLE OF CONTENTS
Acronyms..................................................................................................................... 4
Executive Summary.................................................................................................. 5
Background.................................................................................................................. 10
Research Objectives................................................................................................ 11
Methodology............................................................................................................... 12
Key Findings and Recommendations................................................................. 14
Planned activities....................................................................................................... 35
Annexure I: Indicator List with Baseline Values............................................. 41
Annexure II: Sample Size Determination.......................................................... 42
Annexure III: List of Variables for Segmentation............................................ 43
Annexure IV: Profiling Respondents.................................................................. 44
Annexure V: ORS Awareness................................................................................ 46
Annexure VI: Profile of a Non-behaver............................................................. 47
ACRONYMS
AIDS Acquired Immune Deficiency Syndrome
AWP Active Water Purification
FGD Focus Group Discussion
HH Household
HW Hand Washing
HWTS Household Water Treatment Systems
HWWS Hand washing with Soap
IDI Intensive Depth Interviews
IPC Inter Personal Communication
ISMH Indian System of Medicine and Homeopathy
KAP Knowledge Attitude and Practice
MBPH Market-based Partnerships for Health
MoU Memorandum of Understanding
NGO Non-Government Organization
ORS Oral Rehydration Salt
ORT Oral Rehydration Therapy
PSU Primary Sampling Units
RO Reverse Osmosis
SEC Socio Economic Category
TG Target Group
UP Uttar Pradesh
USAID United States Agency for International Development
UV Ultra Violet
WHO World Health Organization
4
EXECUTIVE SUMMARY
INTRODUCTION
Implemented by the USAID funded Market-based Partnerships for Health (MBPH) project, Saathi
Bachpan Ke (‘Friends of Childhood’ in Hindi) is a program that aims at improving child health by
reducing the incidence of diarrheal diseases in children under five (the second highest cause of deaths
among this age group). This is done by promoting simple and effective behaviors, namely, hand washing
with soap, treating water and using oral rehydration therapy (ORT).
The program is currently being piloted in 12 slums each in the cities of Varanasi, Lucknow and Kanpur
in the state of Uttar Pradesh (UP) in India. Saathi Bachpan Ke aims to garner the strength of the public
and private sectors (pharmaceutical, soap and hygiene product partners) for diarrhea management. At
present, the program is partnering actively with marketers of Dettol soap, Swach water filters and
Orhydrate oral rehydration salts (ORS) and encouraging them to play an important role in the
promotion of positive health behaviors by supporting the incorporation of integrated public health
messages into their different marketing initiatives and interventions.This is in line with MBPH’s belief
that having commercial partners who are better informed about public health issues will also make
them better advocates for improved child health and more committed to building a market for
products that prevent and help manage childhood diarrhea over the long term.While the results from
this research study will help establish program baselines and will shape the category campaign for
Saathi Bachpan Ke, MBPH also expects commercial partners to make use of the results of the
consumer research and incorporate the key insights into their marketing strategies.
RESEARCH OBJECTIVES
The objectives of the study were to:
• Establish baseline values for performance indicators around knowledge, attitudes and practices
of consumers
• Establish an evidence base for prioritizing target population segments
• Identify and prioritize key barriers to the adoption of desired behaviors
METHODOLOGY
The research objectives discussed above were addressed through a mix of quantitative and qualitative
studies, described below:
QUANTITATIVE STUDY:In October 2010, Abt commissioned TNS Mode, an international market research agency with
extensive experience in social research to carry out a population-based survey of households. The
survey was conducted in 36 project slums of Lucknow, Varanasi and Kanpur districts of UP. Data was
collected through home visits using structured questionnaires.The target respondents for the hand
washing and water treatment were caregivers of children under the age of 5 years. For ORT/ ORS, the
5
Saathi Bachpan Ke Baseline Report
Diarrhea Prevention and Management
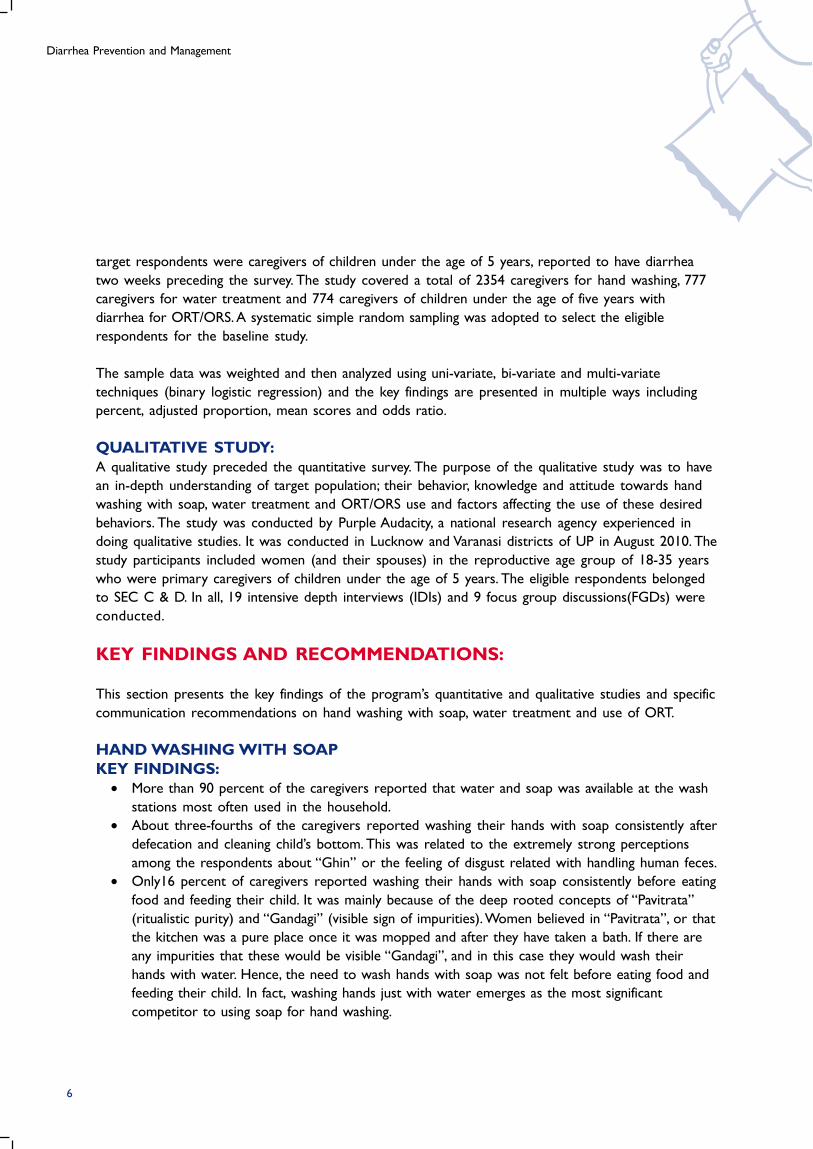
target respondents were caregivers of children under the age of 5 years, reported to have diarrhea
two weeks preceding the survey. The study covered a total of 2354 caregivers for hand washing, 777
caregivers for water treatment and 774 caregivers of children under the age of five years with
diarrhea for ORT/ORS. A systematic simple random sampling was adopted to select the eligible
respondents for the baseline study.
The sample data was weighted and then analyzed using uni-variate, bi-variate and multi-variate
techniques (binary logistic regression) and the key findings are presented in multiple ways including
percent, adjusted proportion, mean scores and odds ratio.
QUALITATIVE STUDY:A qualitative study preceded the quantitative survey. The purpose of the qualitative study was to have
an in-depth understanding of target population; their behavior, knowledge and attitude towards hand
washing with soap, water treatment and ORT/ORS use and factors affecting the use of these desired
behaviors. The study was conducted by Purple Audacity, a national research agency experienced in
doing qualitative studies. It was conducted in Lucknow and Varanasi districts of UP in August 2010. The
study participants included women (and their spouses) in the reproductive age group of 18-35 years
who were primary caregivers of children under the age of 5 years. The eligible respondents belonged
to SEC C & D. In all, 19 intensive depth interviews (IDIs) and 9 focus group discussions(FGDs) were
conducted.
KEY FINDINGS AND RECOMMENDATIONS:
This section presents the key findings of the program’s quantitative and qualitative studies and specific
communication recommendations on hand washing with soap, water treatment and use of ORT.
HAND WASHING WITH SOAPKEY FINDINGS:• More than 90 percent of the caregivers reported that water and soap was available at the wash
stations most often used in the household.
• About three-fourths of the caregivers reported washing their hands with soap consistently after
defecation and cleaning child’s bottom. This was related to the extremely strong perceptions
among the respondents about “Ghin” or the feeling of disgust related with handling human feces.
• Only16 percent of caregivers reported washing their hands with soap consistently before eating
food and feeding their child. It was mainly because of the deep rooted concepts of “Pavitrata”
(ritualistic purity) and “Gandagi” (visible sign of impurities). Women believed in “Pavitrata”, or that
the kitchen was a pure place once it was mopped and after they have taken a bath. If there are
any impurities that these would be visible “Gandagi”, and in this case they would wash their
hands with water. Hence, the need to wash hands with soap was not felt before eating food and
feeding their child. In fact, washing hands just with water emerges as the most significant
competitor to using soap for hand washing.
6
Saathi Bachpan Ke Baseline Report
• By far, the most important factor influencing the consistent use of soap before eating food and
feeding their child was the belief that it is indeed important to wash one’s hands with soap
before eating food and feeding their child. Findings further revealed that those caregivers, who
were uneducated, were the ones more likely to not wash their hands with soap consistently
before eating food and feeding their child.
HAND WASHING WITH SOAPRECOMMENDATIONS:Based on the findings, following recommendations are proposed:
• Program communication activities should focus on promoting washing hands with soap
consistently versus just washing with water, before eating food and feeding their child. Focusing
on washing hands with soap before meals will in turn increase the use of hand washing with
soap on all five critical occasions: after defecation, after cleaning child’s bottom, before eating,
before feeding their child/children and before cooking. Communication need not emphasize the
importance of washing after defecation since this is largely understood and practiced.
• Focus on changing the beliefs that washing hands with water is considered to make them pure
(“Pavitrata”) and washing hands with water alone removes “Gandagi”. For this, it is important to
communicate that hand washing means washing with water ‘and’ soap, not with water alone.
• Access to soap and water was not an issue at households. However there are opportunities at
schools, especially around mid-day meals, to provide access and increase cases of hand washing
with soap before eating.While these activities at schools will not specifically target under five
children, there ought to be a spillover effect of educating the elder siblings who are a key
influencer group.
WATER TREATMENTKEY FINDINGS:• The predominant source of drinking water among the respondents was tube wells or hand
pumps. The majority of caregivers did not follow safe water storage practice and did not treat
their drinking water. The study suggests that the source of water played an important role in the
perception of quality of water. Hand pumps were perceived as the safest source. Hence, the
perceived need to treat their drinking water was low.
• About 32 percent of caregivers who said that they felt the need to treat their drinking water, did
not currently use any Active Water Purification (AWP) methods such as boiling, chlorine tablets,
iodine tablets, alum, ceramic filter, gravity filter, reverse osmosis (RO) or ultra violet ray (UV)
consistently. Even though there was a perceived need to treat their drinking water, it had not
translated into the consistent use of AWP methods. Only 7 percent of caregivers felt the need
and were also using an AWP method consistently.
• The most critical determinant for motivating caregivers who have the perceived need to use an
AWP method consistently is instilling the belief that water which looks clean, tastes good or
comes from a pipe may not be safe to drink. Research finds that those who have access to water
from pipes or tubewells/ hand pumps, have the highest potential for using an AWP method
consistently.
7
Diarrhea Prevention and Management
• The qualitative study findings explain that purity of water was associated with its transparency,
taste and smell. As long as the water looked clean, tasted sweet and had no smell, there was no
need for any additional water treatment. In addition, there is a tradition of drinking fresh water as
it is considered to be safe and there is an understanding that stale water should be thrown
away.The low risk perception also came from the fact that the younger generation had always
seen their parents follow this system and nothing ‘bad’ had happened to them.
WATER TREATMENTRECOMMENDATIONS:Based on the findings, the following recommendations are proposed:
• Communication activities should focus on changing the belief that water which looks clear or
does not taste bad or does not smell bad smell is safe to drink.
• The program should mainly target those caregivers whose predominant drinking water source is
either water from pipes or tube well/ hand pumps.
• Practice of safe storage of drinking water is very low. Hence, the program should focus on
solutions that enable and enhance safe storage procedures.
• The program also needs to include healthcare providers to build the connection between
unsafe water and disease and illness, and spread this message for motivating use of water
treatment methods.
USE OF ORTKEY FINDINGS:• A majority of caregivers took some action either at home (39%) or sought external advice (77%)
to treat their child who was suffering from diarrhea. Only about 14 percent of caregivers did not
take any action for treatment.
• Among those caregivers who sought external advice, 76 percent of the caregivers visited private
health facilities, 19 percent went to the government health facilities and 2 percent of the
caregivers consulted chemists.
• Around 65 percent of caregivers reported giving ORT to their child suffering from diarrhea.
Around 49 percent of them reported giving ORS and 33 percent of caregivers gave either
sugar-salt solution or gruel. The qualitative study revealed that sugar-salt solution was thought to
be equivalent to ORS and was trusted since it is made at home and hence is more convenient.
• Although use of ORT is quite high, consistent use is relatively low and it declined significantly
from 65 percent to 39 percent when caregivers were asked about the use of ORT after every
liquid stool. A similar pattern was observed with ORS use which declined from 49 percent to 27
percent.
• The two significant determinants that could trigger behavior change among those who did not
give ORT frequently to their child during last diarrheal episode were: a) recommendations by
healthcare providers and b) knowledge that ORT should be administered in small quantities to
facilitate the child’s acceptance of ORT.
• The qualitative study showed that there was low perceived self-efficacy and most respondents
were not aware of correct preparation or dosage of ORT (both for sugar-salt solution and ORS).
8
Saathi Bachpan Ke Baseline Report
9
• Caregivers who were uneducated and had a monthly income of 2000 or less were less likely
to use ORT frequently.
USE OF ORTRECOMMENDATIONS:Based on the findings, the following recommendations are proposed:
• The program communication needs to focus on informing caregivers that ORT should be
administered frequently after every liquid stool.
• Focus on emphasizing that ORT should be administered in small quantities if the child initially
refuses to take ORT.
• Increase the awareness of correct preparation and dosage of ORT. This includes the need to
focus on both sugar-salt solution and ORS, in order to increase correct use of ORT.
• Recommendation of ORT/ORS by healthcare providers is an important trigger for use among
caregivers. Ensuring that these recommendations are made by providers is likely to have a larger
impact in having caregivers administer ORT frequently during diarrheal episodes. Training
sessions among providers should highlight this fact and advocate recommending ORT/ORS to
caregivers.
Diarrhea Prevention and Management
BACKGROUND
Funded by USAID, Saathi Bachpan Ke (‘Friends of Childhood’ in Hindi) is a program implemented by
the Market-based Partnerships for Health (MBPH) project. The aim of the program is to improve child
health by reducing the incidence of diarrheal diseases in children under five (the second highest cause
of deaths among this age group) by promoting simple and effective behaviors, namely, hand washing
with soap, treating water and using ORT.
The program, being piloted in the state of UP in India has been designed keeping in mind the fact that
despite the existence of inexpensive and efficient means of prevention and treatment, diarrhea kills
more children than AIDS, malaria and measles put together. Diarrhea is the second largest killer of
children under five in India, with 386,6001 deaths each year and 25 percent of these deaths occur in
UP. Research indicates that 88 percent2 of these deaths are preventable through:
1. Hand washing with Soap (HWWS), especially at five critical times: after defecation, after cleaning
the child bottom, before eating, before feeding their child/children and before cooking3
2. Treating drinking water using appropriate Household Water Treatment Systems (HWTS)
3. Providing oral rehydration therapy (ORT)
Saathi Bachpan Ke aims to garner the strength of the public and private sectors (pharmaceutical, soap
and hygiene product partners) for diarrhea management. Keeping this objective in mind, at present, the
program is partnering actively with marketers of Dettol soap, Swach water filters and Orhydrate oral
rehydration salt (ORS) and encouraging them to play an important role in the promotion of positive
health behaviors by supporting integrated public health messages and incorporating them into their
different marketing initiatives and interventions. MBPH believes that having commercial partners who
are better informed about the public health issues will also make them better advocates for improved
child health and more committed to building a sustainable market for products that prevent and help
manage childhood diarrhea.
The need for a comprehensive study was envisaged to aid the development of communication strategy
by bridging key knowledge gaps pertaining to use of public health products for comprehensive
diarrhea prevention and management, and to understand the current levels of key program indicators
(see Annexure I) to enable evaluation of the program performance over time.
1World Health Organization, Global Burden of Disease Estimates, 2004 Update2Child Survival II. The Lancet, Vol 362. July 5, 20033 WHO and UNICEF, 1999 (http://www.who.int/child_adolescent_health/en/and http://www.usaid.gov/our_work/global_health/eh/techareas/handwashing.html)
10
Saathi Bachpan Ke Baseline Report
RESEARCH OBJECTIVES
The objectives of the study were:
1. To establish baseline values for performance indicators around knowledge, attitudes and practices
of consumers. MBPH expects that the knowledge, attitudes and reported behaviors of the target
populations will change as a result of the interventions being implemented and promoted by the
program.
2. To establish an evidence base for prioritizing target population segments. It is important for
program and communication activities to focus on the segment of the target population that is
most at risk and most likely to adopt the desired behavior/s.
3. To identify and prioritize key barriers to the adoption of desired behaviors. Potential target
populations do not adopt desired preventive practices, even though they reflect the desired
attitudes, due to a variety of reasons. An in-depth understanding of these reasons or barriers to
behavior change will help the MBPH project design effective and comprehensive behavior change
strategies and activities. Further, the findings of this study will help with key management decisions
regarding prioritization of activities that address the most important barriers for effective
management of resources.
11
Diarrhea Prevention and Management
METHODOLOGY
The research objectives discussed above were addressed through a mix of quantitative and qualitative
studies, described below:
QUANTITATIVE STUDY:
In October 2010, Abt commissioned TNS Mode, an international market research agency with
experience in social research to carry out a population-based survey of households. The survey was
conducted in 36 project slums of Lucknow, Varanasi and Kanpur districts of UP. Data was collected
through home visits using structured questionnaires.The target respondents for the hand washing and
water treatment were caregivers of children under the age of 5 years and for ORT/ ORS, the target
respondents were caregivers of children under the age of 5 years, who reported having suffered from
diarrhea two weeks preceding the survey. A total of 2,354 caregivers for hand washing, 777 caregivers
for water treatment and 774 caregivers of children under the age of five years with diarrhea for ORT/
ORS were covered under the study (see Annexure II).
A systematic simple random sampling was adopted to select the eligible respondents for the baseline study.
The slums included in the program were taken as primary sampling units (PSU) for the study. A listing of a
minimum of 110 and a maximum of 500 households was finalized in each PSU and the eligible respondents
were identified using a small questionnaire to determine socio-economic classification of the household and
the presence of children less than 5 years of age. In each PSU, household listing was conducted until 21
households with a ‘diarrhea child’1 aged 0-5 years were identified. After establishing the household lists, 36
caregivers were selected from the eligible households using systematic simple random sampling for the
hand washing section. Of the 36 caregivers in each PSU, 12 caregivers were also selected for administering
the water treatment section using the same methodology. All the caregivers from the listed households with
a ‘diarrhea child’ aged 0-5 years were selected for the ORT/ORS section of the survey.
The instrument was designed for a structured face-to-face interview in a private setting, where the
interviewer would code responses given by the respondent. The questionnaire was translated in local
language and pre-tested before finalization. A well trained and experienced field team of TNS Mode
conducted the survey with appropriate data quality checks. Responses to open-ended questions were
translated and coded appropriately and the data was entered in SPSS for analysis.
The data analysis was done using uni-variate and bivariate methods and these findings were presented
in percent and mean scores. In addition, a multivariate technique (binary logistic regression) was used
to control for socio-demographic characteristics of respondents and identify triggers and barriers for
desired behavior. The results of multivariate analyses are presented as odds ratios, adjusted proportion
and means score with statistical significance in this report. The sample was weighted for the analysis.
1 A child who suffered from diarrhea in the last 15 days
12
Saathi Bachpan Ke Baseline Report
QUALITATIVE STUDY:
The purpose of the preceding qualitative study was to have an in-depth understanding of target
population; their behavior, knowledge and attitude towards hand washing with soap, water treatment
and ORT/ORS use and factors affecting the use of these desired behaviors. The study was conducted
by Purple Audacity, a research agency with experience in doing qualitative studies. It was conducted in
Lucknow and Varanasi districts of UP in the month of August 2011. The study participants included
women (and their spouses) in the reproductive age group of 18-35 years who were the primary
caregivers oftheir children under the age of 5 years. The eligible respondents belonged to SEC C & D.
The study involved habitat visits and observations with impromptu discussions with household
members; IDIs and FGDs with mothers and fathers and some health providers. A total of 19 IDIs and
9 FGDs were conducted.
13
Diarrhea Prevention and Management
Most often
wash station
30%
18%
46%
12%
1%
Wash Area
Inside/ within 10 paces of the
toilet facility
Inside/ within 10 paces of
the kitchen/ cooking place
Elsewhere in home or yard
Outside yard
Others
N
Water
available
94%
92%
94%
83%
45%
Soap
available
95%
86%
90%
75%
48%
Local cleansing
agent (Ash/mud/sand)
available
23%
30%
20%
23%
6%
Table 1:Availability of water, soap and cleansing agent athousehold wash stations (reported)
2354
KEY FINDINGS ANDRECOMMENDATIONS
This section provides the key findings from both the quantitative and qualitative studies, first for hand
washing with soap followed by water treatment and then the use of ORT.
HAND WASHING
A total of 2354 caregivers of children under the age of 5 were interviewed regarding hand washing
with soap. This section presents findings relating to the hand washing station characteristics, use of
soap at the five critical times, potential target population and barriers to hand washing with soap.
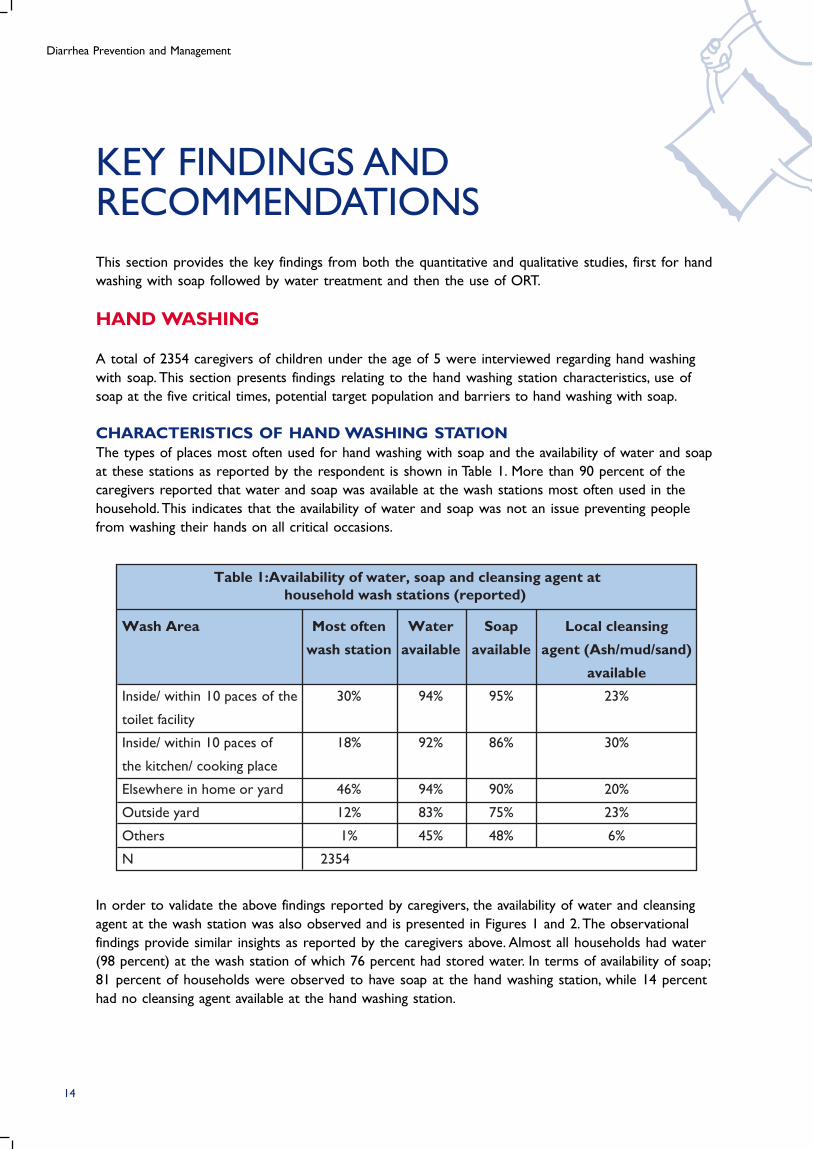
CHARACTERISTICS OF HAND WASHING STATIONThe types of places most often used for hand washing with soap and the availability of water and soap
at these stations as reported by the respondent is shown in Table 1. More than 90 percent of the
caregivers reported that water and soap was available at the wash stations most often used in the
household. This indicates that the availability of water and soap was not an issue preventing people
from washing their hands on all critical occasions.
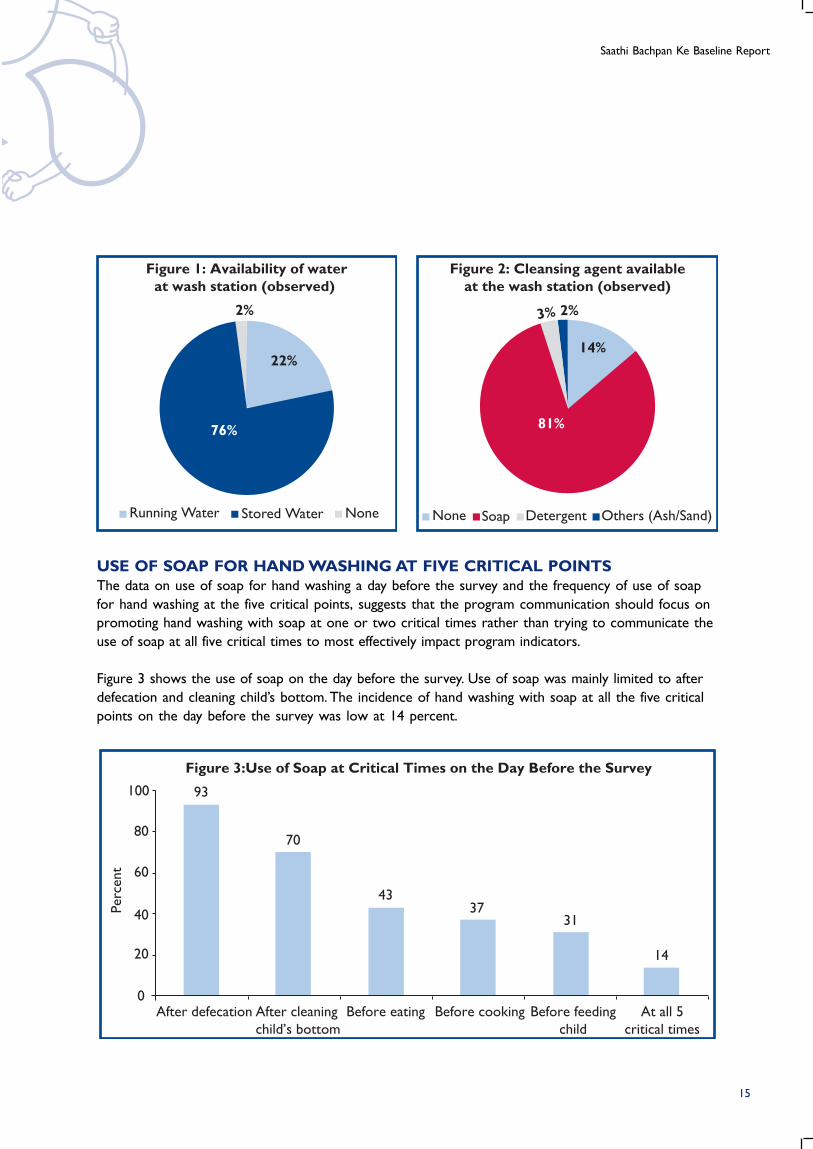
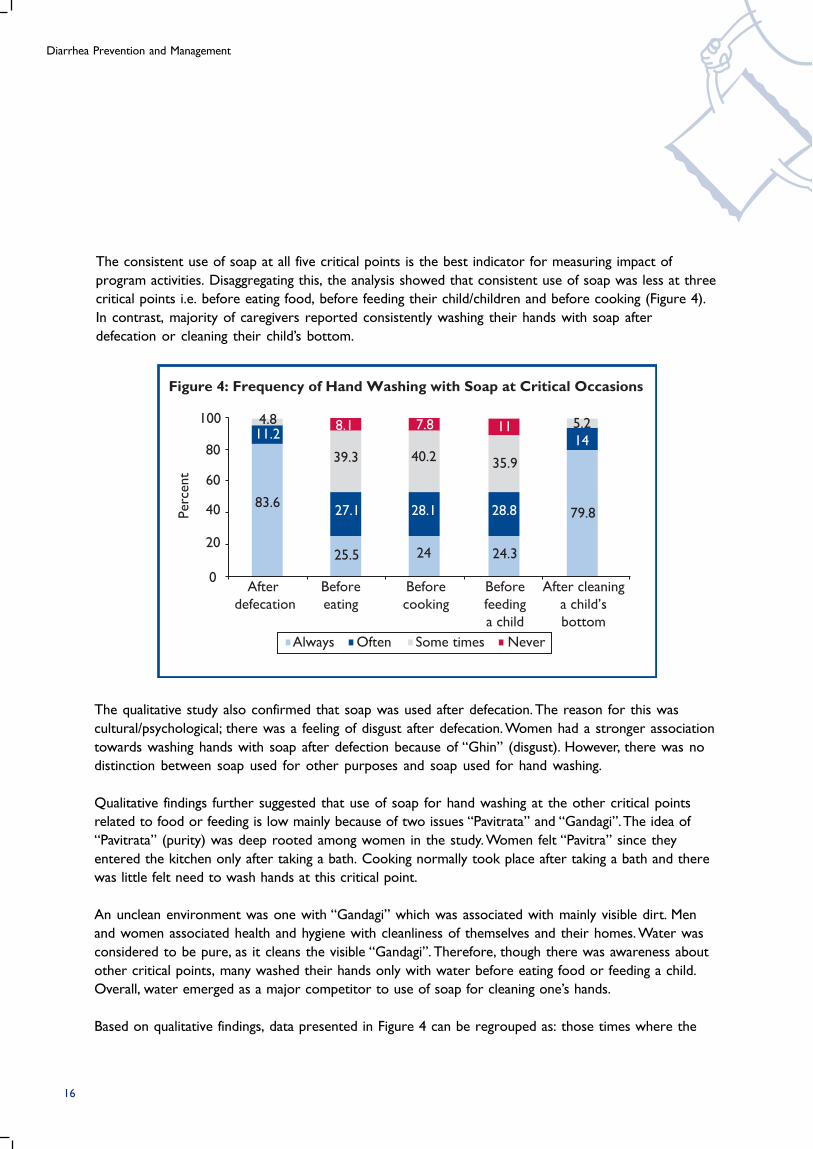
In order to validate the above findings reported by caregivers, the availability of water and cleansing
agent at the wash station was also observed and is presented in Figures 1 and 2. The observational
findings provide similar insights as reported by the caregivers above. Almost all households had water
(98 percent) at the wash station of which 76 percent had stored water. In terms of availability of soap;
81 percent of households were observed to have soap at the hand washing station, while 14 percent
had no cleansing agent available at the hand washing station.
14
Saathi Bachpan Ke Baseline Report
Figure 3:Use of Soap at Critical Times on the Day Before the Survey
93
Perc
ent
100
80
60
40
20
0
70
After defecation After cleaning
child’s bottom
Before eating Before cooking At all 5
critical times
Before feeding
child
4337
31
14
Figure 2: Cleansing agent availableat the wash station (observed)
Others (Ash/Sand)DetergentSoapNone
2%3%
14%
81%
Figure 1: Availability of waterat wash station (observed)
76%
22%
2%
Running Water Stored Water None
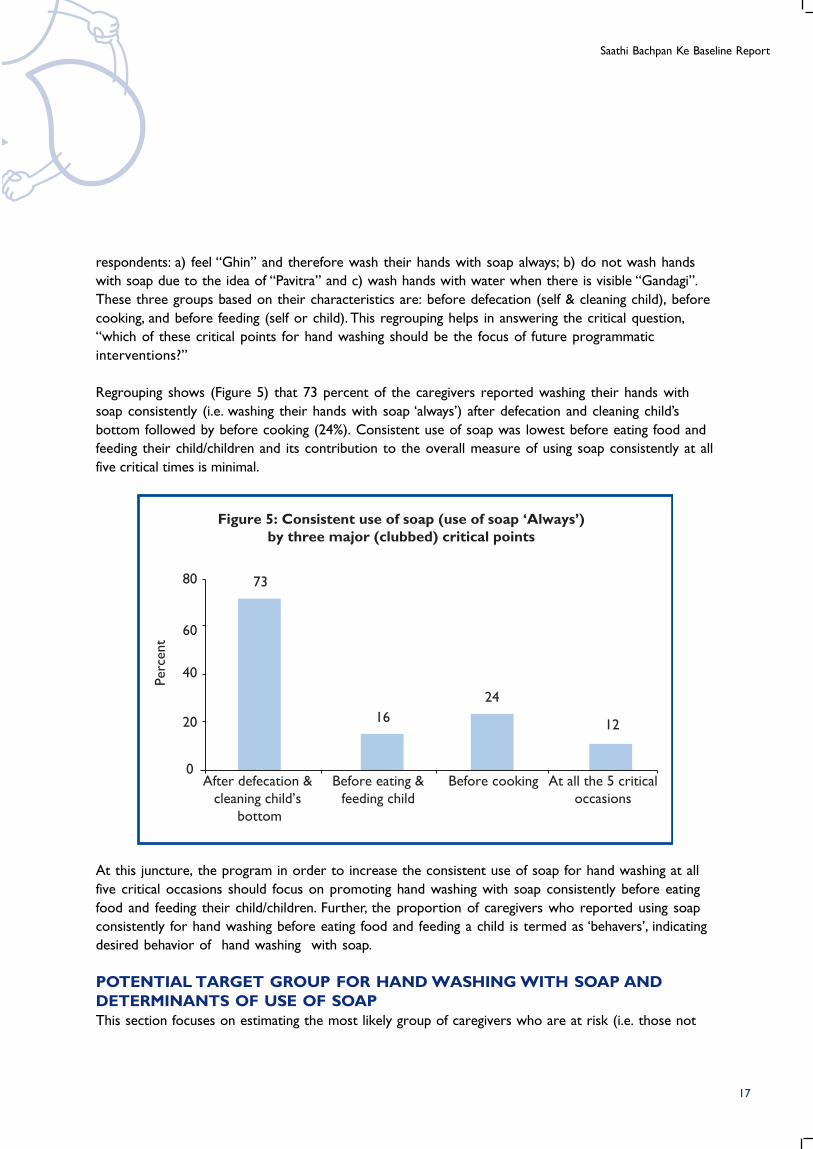
USE OF SOAP FOR HAND WASHING AT FIVE CRITICAL POINTSThe data on use of soap for hand washing a day before the survey and the frequency of use of soap
for hand washing at the five critical points, suggests that the program communication should focus on
promoting hand washing with soap at one or two critical times rather than trying to communicate the
use of soap at all five critical times to most effectively impact program indicators.
Figure 3 shows the use of soap on the day before the survey. Use of soap was mainly limited to after
defecation and cleaning child’s bottom. The incidence of hand washing with soap at all the five critical
points on the day before the survey was low at 14 percent.
15
Diarrhea Prevention and Management
Figure 4: Frequency of Hand Washing with Soap at Critical Occasions
4.8 8.1 7.811.2
39.3 40.2
28.1
24 24.3
28.8
35.9
11 5.2
14
79.827.1
25.5
83.6
Perc
ent
100
80
60
40
20
0After
defecation
Before
eating
Before
cooking
Before
feeding
a child
After cleaning
a child’s
bottom
Always Often Some times Never
The consistent use of soap at all five critical points is the best indicator for measuring impact of
program activities. Disaggregating this, the analysis showed that consistent use of soap was less at three
critical points i.e. before eating food, before feeding their child/children and before cooking (Figure 4).
In contrast, majority of caregivers reported consistently washing their hands with soap after
defecation or cleaning their child’s bottom.
The qualitative study also confirmed that soap was used after defecation. The reason for this was
cultural/psychological; there was a feeling of disgust after defecation. Women had a stronger association
towards washing hands with soap after defection because of “Ghin” (disgust). However, there was no
distinction between soap used for other purposes and soap used for hand washing.
Qualitative findings further suggested that use of soap for hand washing at the other critical points
related to food or feeding is low mainly because of two issues “Pavitrata” and “Gandagi”. The idea of
“Pavitrata” (purity) was deep rooted among women in the study. Women felt “Pavitra” since they
entered the kitchen only after taking a bath. Cooking normally took place after taking a bath and there
was little felt need to wash hands at this critical point.
An unclean environment was one with “Gandagi” which was associated with mainly visible dirt. Men
and women associated health and hygiene with cleanliness of themselves and their homes. Water was
considered to be pure, as it cleans the visible “Gandagi”. Therefore, though there was awareness about
other critical points, many washed their hands only with water before eating food or feeding a child.
Overall, water emerged as a major competitor to use of soap for cleaning one’s hands.
Based on qualitative findings, data presented in Figure 4 can be regrouped as: those times where the
16
Saathi Bachpan Ke Baseline Report
Figure 5: Consistent use of soap (use of soap ‘Always’)by three major (clubbed) critical points
Perc
ent
80 73
16
24
12
60
40
20
0After defecation &
cleaning child’s
bottom
Before eating &
feeding child
Before cooking At all the 5 critical
occasions
At this juncture, the program in order to increase the consistent use of soap for hand washing at all
five critical occasions should focus on promoting hand washing with soap consistently before eating
food and feeding their child/children. Further, the proportion of caregivers who reported using soap
consistently for hand washing before eating food and feeding a child is termed as ‘behavers’, indicating
desired behavior of hand washing with soap.
POTENTIAL TARGET GROUP FOR HAND WASHING WITH SOAP ANDDETERMINANTS OF USE OF SOAPThis section focuses on estimating the most likely group of caregivers who are at risk (i.e. those not
respondents: a) feel “Ghin” and therefore wash their hands with soap always; b) do not wash hands
with soap due to the idea of “Pavitra” and c) wash hands with water when there is visible “Gandagi”.
These three groups based on their characteristics are: before defecation (self & cleaning child), before
cooking, and before feeding (self or child). This regrouping helps in answering the critical question,
“which of these critical points for hand washing should be the focus of future programmatic
interventions?”
Regrouping shows (Figure 5) that 73 percent of the caregivers reported washing their hands with
soap consistently (i.e. washing their hands with soap ‘always’) after defecation and cleaning child’s
bottom followed by before cooking (24%). Consistent use of soap was lowest before eating food and
feeding their child/children and its contribution to the overall measure of using soap consistently at all
five critical times is minimal.
17
Diarrhea Prevention and Management
16% Always wash
hands with soap
73% Wash hands with water
11% Never/Sometimes wash hands with water
Behavers
Non-Behavers
Figure 6: Potential Market Segment:Caregivers likely to use Soap Always (Non-Behavers)
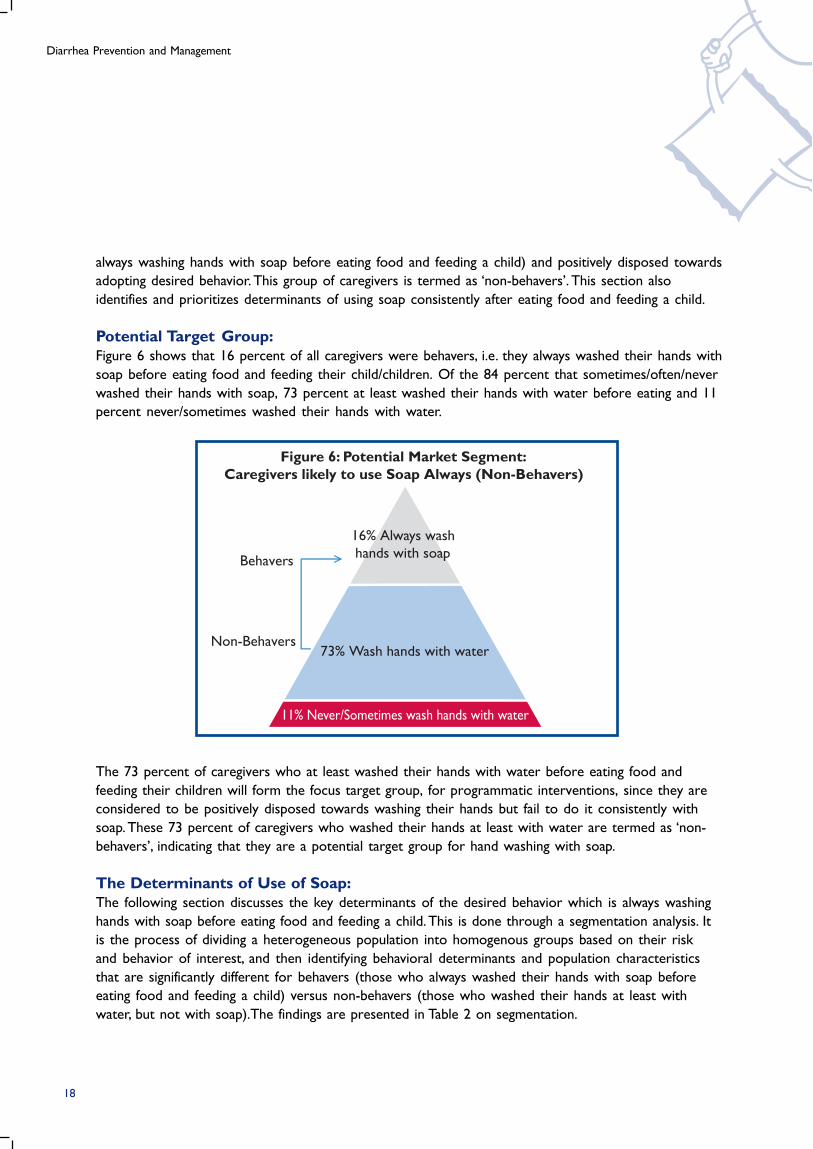
The 73 percent of caregivers who at least washed their hands with water before eating food and
feeding their children will form the focus target group, for programmatic interventions, since they are
considered to be positively disposed towards washing their hands but fail to do it consistently with
soap. These 73 percent of caregivers who washed their hands at least with water are termed as ‘non-
behavers’, indicating that they are a potential target group for hand washing with soap.
The Determinants of Use of Soap:The following section discusses the key determinants of the desired behavior which is always washing
hands with soap before eating food and feeding a child. This is done through a segmentation analysis. It
is the process of dividing a heterogeneous population into homogenous groups based on their risk
and behavior of interest, and then identifying behavioral determinants and population characteristics
that are significantly different for behavers (those who always washed their hands with soap before
eating food and feeding a child) versus non-behavers (those who washed their hands at least with
water, but not with soap).The findings are presented in Table 2 on segmentation.
always washing hands with soap before eating food and feeding a child) and positively disposed towards
adopting desired behavior. This group of caregivers is termed as ‘non-behavers’. This section also
identifies and prioritizes determinants of using soap consistently after eating food and feeding a child.
Potential Target Group:Figure 6 shows that 16 percent of all caregivers were behavers, i.e. they always washed their hands with
soap before eating food and feeding their child/children. Of the 84 percent that sometimes/often/never
washed their hands with soap, 73 percent at least washed their hands with water before eating and 11
percent never/sometimes washed their hands with water.
18
Saathi Bachpan Ke Baseline Report
Odds Ratio
3.07
1.50
1.22
1.27
1.38
2.46
Belief that it is important to wash hands before eating
food and feeding their child
Soaps are always available at the wash station
Believe in washing hands even though hands look clean
Population Characteristics
Kanpur (Ref: Lucknow)
High school competed (Ref: Illiterates)
Educated secondary or above (Ref: Illiterates)
No HWWS
before eating
food and
feeding their
child/children
(N=1710)
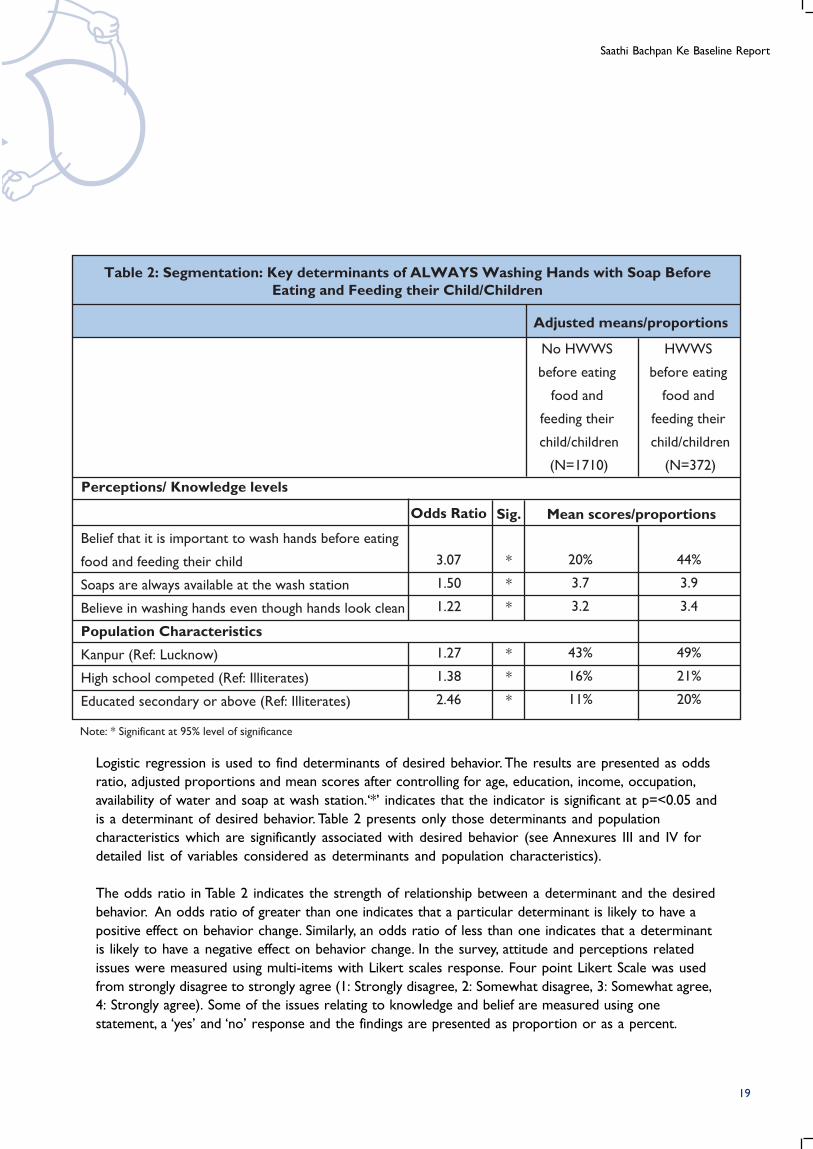
Table 2: Segmentation: Key determinants of ALWAYS Washing Hands with Soap BeforeEating and Feeding their Child/Children
HWWS
before eating
food and
feeding their
child/children
(N=372)
Perceptions/ Knowledge levels
Sig.
*
*
*
*
*
*
20%
3.7
3.2
43%
16%
11%
44%
3.9
3.4
49%
21%
20%
Note: * Significant at 95% level of significance
Adjusted means/proportions
Mean scores/proportions
Logistic regression is used to find determinants of desired behavior. The results are presented as odds
ratio, adjusted proportions and mean scores after controlling for age, education, income, occupation,
availability of water and soap at wash station.‘*’ indicates that the indicator is significant at p=<0.05 and
is a determinant of desired behavior. Table 2 presents only those determinants and population
characteristics which are significantly associated with desired behavior (see Annexures III and IV for
detailed list of variables considered as determinants and population characteristics).
The odds ratio in Table 2 indicates the strength of relationship between a determinant and the desired
behavior. An odds ratio of greater than one indicates that a particular determinant is likely to have a
positive effect on behavior change. Similarly, an odds ratio of less than one indicates that a determinant
is likely to have a negative effect on behavior change. In the survey, attitude and perceptions related
issues were measured using multi-items with Likert scales response. Four point Likert Scale was used
from strongly disagree to strongly agree (1: Strongly disagree, 2: Somewhat disagree, 3: Somewhat agree,
4: Strongly agree). Some of the issues relating to knowledge and belief are measured using one
statement, a ‘yes’ and ‘no’ response and the findings are presented as proportion or as a percent.
19
Diarrhea Prevention and Management
Table 2 indicates that caregivers who believed that it was important to wash their hands before eating
food and feeding their child, have an odds ratio of 3.07. This means that the caregivers who believed
this, are three times more likely to always wash their hands with soap before eating food and feeding a
child than those who do not believe so. The other significant determinants are ‘soaps are always
available at the wash station’ and ‘believe in washing hands even though hands look clean’.
Adjusted proportion or the mean score of non-behavers provides the scope for change. If the mean
score of a determinant among non-behavers is low, there is high scope for the particular determinant
to change.Table 2 further indicates that the caregivers who were ‘non-behavers,’ rated the determinant
‘soaps are always available at the wash station’ as 3.7 on a scale of 1 (strongly disagree) to 4 (strongly
agree). Similar pattern was noticed among non-behavers for the determinant ‘believe in washing hands
even though hands look clean’. This indicates that though these determinants have a positive
association with desired behavior, the scope for change is minimal. Whereas, the adjusted proportion
for the determinant ‘believed that it was important to wash their hands before eating food and feeding
their child’ among non-behavers is 20 percent, indicating a high scope for change.
Table 2 further indicates that among all the population characteristics controlled for its effect in
logistic regression, district and education categories showed a significant difference in use of soap
‘always’ for hand washing before eating and feeding. The caregivers who completed high school were
1.4 times likely and those who were secondary or further educated were 2.5 times likely to always
wash their hands with soap before eating food and feeding their children than those who were
illiterate. This means that those caregivers, who were uneducated, were the ones who did not follow
the desired behaviour.
The findings of segmentation Table 2 overall reveals that the key determinant of desired behavior are
caregivers who believed that it was important to wash their hands before eating food and feeding their
child as it has a very strong association with the desired behavior (odds ratio=3.07) and greater scope
for change (non-behavers=20%). The key population characteristic is illiteracy as the uneducated
caregivers were the ones not following the desired behaviour. This profile of non-behavers is helpful in
developing a marketing mix that appeals to this specific group.
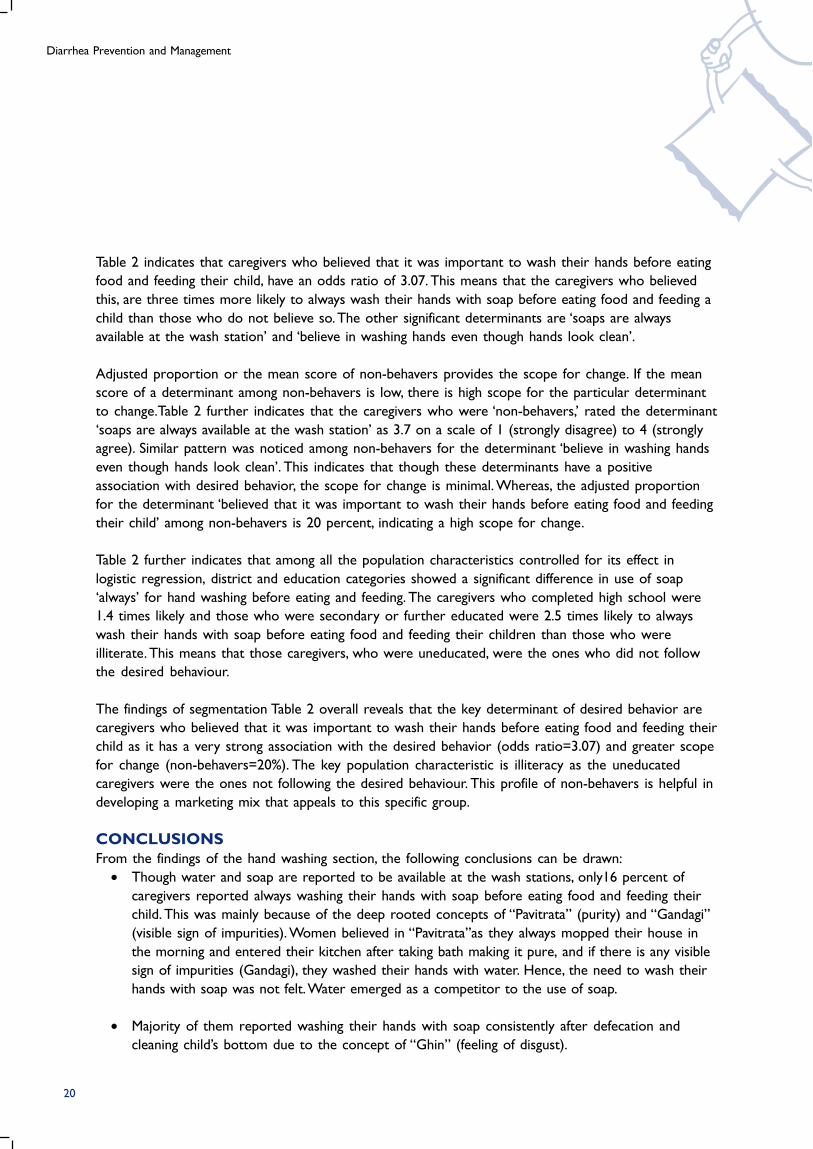
CONCLUSIONSFrom the findings of the hand washing section, the following conclusions can be drawn:
• Though water and soap are reported to be available at the wash stations, only16 percent of
caregivers reported always washing their hands with soap before eating food and feeding their
child. This was mainly because of the deep rooted concepts of “Pavitrata” (purity) and “Gandagi”
(visible sign of impurities). Women believed in “Pavitrata”as they always mopped their house in
the morning and entered their kitchen after taking bath making it pure, and if there is any visible
sign of impurities (Gandagi), they washed their hands with water. Hence, the need to wash their
hands with soap was not felt. Water emerged as a competitor to the use of soap.
• Majority of them reported washing their hands with soap consistently after defecation and
cleaning child’s bottom due to the concept of “Ghin” (feeling of disgust).
20
Saathi Bachpan Ke Baseline Report
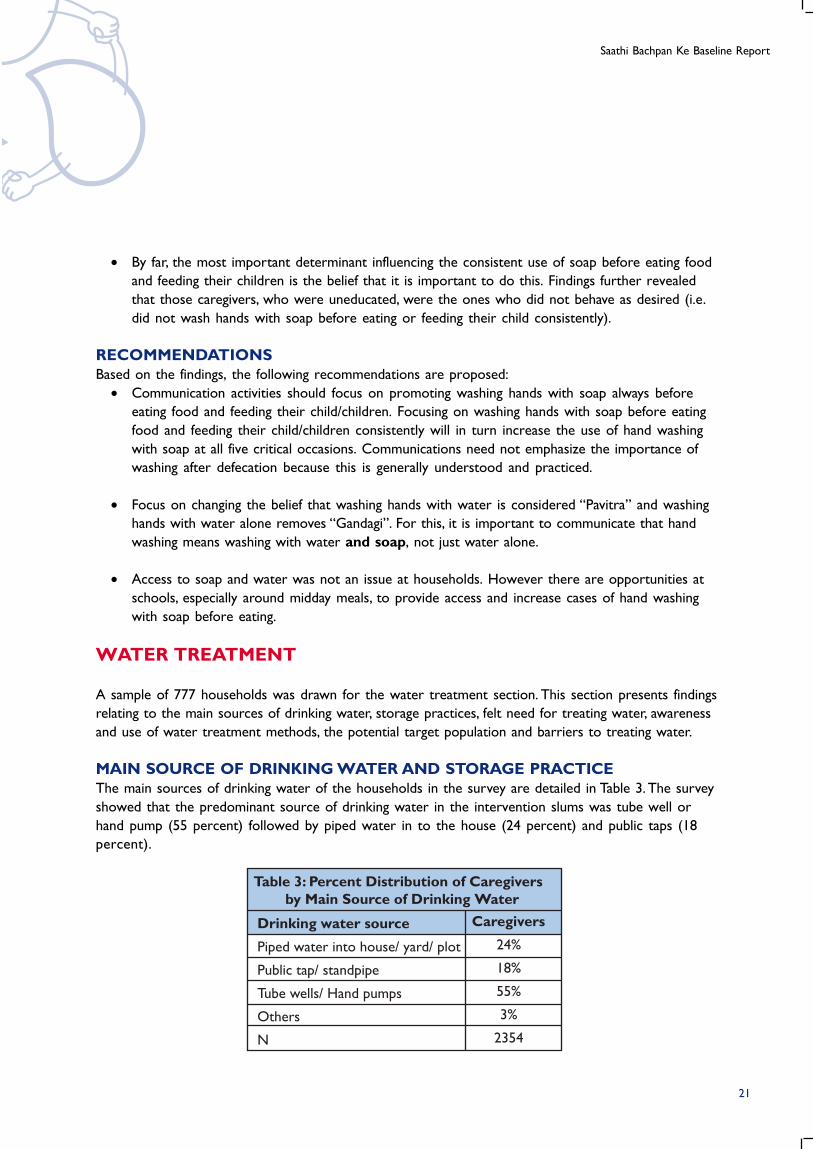
Table 3: Percent Distribution of Caregivers by Main Source of Drinking Water
Drinking water source
Piped water into house/ yard/ plot
Public tap/ standpipe
Tube wells/ Hand pumps
Others
N
Caregivers
24%
18%
55%
3%
2354
• By far, the most important determinant influencing the consistent use of soap before eating food
and feeding their children is the belief that it is important to do this. Findings further revealed
that those caregivers, who were uneducated, were the ones who did not behave as desired (i.e.
did not wash hands with soap before eating or feeding their child consistently).
RECOMMENDATIONSBased on the findings, the following recommendations are proposed:
• Communication activities should focus on promoting washing hands with soap always before
eating food and feeding their child/children. Focusing on washing hands with soap before eating
food and feeding their child/children consistently will in turn increase the use of hand washing
with soap at all five critical occasions. Communications need not emphasize the importance of
washing after defecation because this is generally understood and practiced.
• Focus on changing the belief that washing hands with water is considered “Pavitra” and washing
hands with water alone removes “Gandagi”. For this, it is important to communicate that hand
washing means washing with water and soap, not just water alone.
• Access to soap and water was not an issue at households. However there are opportunities at
schools, especially around midday meals, to provide access and increase cases of hand washing
with soap before eating.
WATER TREATMENT
A sample of 777 households was drawn for the water treatment section. This section presents findings
relating to the main sources of drinking water, storage practices, felt need for treating water, awareness
and use of water treatment methods, the potential target population and barriers to treating water.
MAIN SOURCE OF DRINKING WATER AND STORAGE PRACTICEThe main sources of drinking water of the households in the survey are detailed in Table 3. The survey
showed that the predominant source of drinking water in the intervention slums was tube well or
hand pump (55 percent) followed by piped water in to the house (24 percent) and public taps (18
percent).
21
Diarrhea Prevention and Management
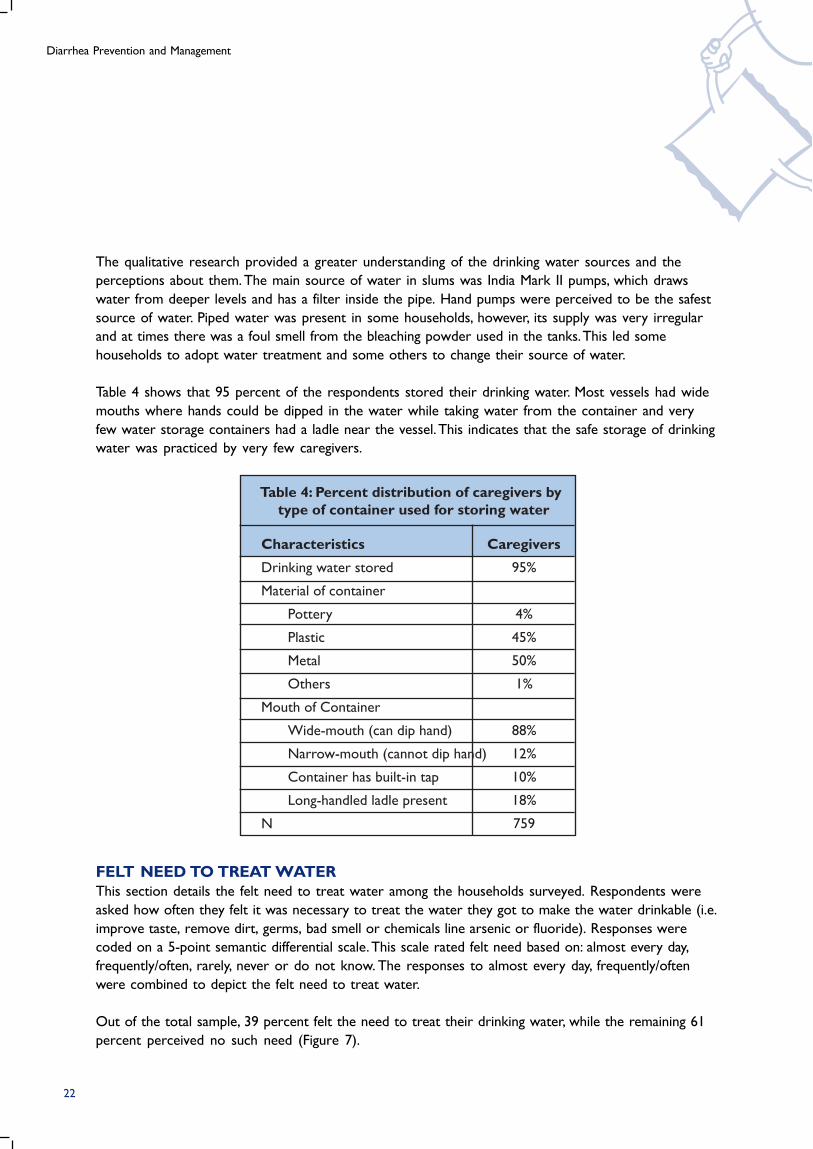
Table 4: Percent distribution of caregivers bytype of container used for storing water
Characteristics
Drinking water stored
Material of container
Pottery
Plastic
Metal
Others
Mouth of Container
Wide-mouth (can dip hand)
Narrow-mouth (cannot dip hand)
Container has built-in tap
Long-handled ladle present
N
Caregivers
95%
4%
45%
50%
1%
88%
12%
10%
18%
759
The qualitative research provided a greater understanding of the drinking water sources and the
perceptions about them. The main source of water in slums was India Mark II pumps, which draws
water from deeper levels and has a filter inside the pipe. Hand pumps were perceived to be the safest
source of water. Piped water was present in some households, however, its supply was very irregular
and at times there was a foul smell from the bleaching powder used in the tanks. This led some
households to adopt water treatment and some others to change their source of water.
Table 4 shows that 95 percent of the respondents stored their drinking water. Most vessels had wide
mouths where hands could be dipped in the water while taking water from the container and very
few water storage containers had a ladle near the vessel. This indicates that the safe storage of drinking
water was practiced by very few caregivers.
FELT NEED TO TREAT WATERThis section details the felt need to treat water among the households surveyed. Respondents were
asked how often they felt it was necessary to treat the water they got to make the water drinkable (i.e.
improve taste, remove dirt, germs, bad smell or chemicals line arsenic or fluoride). Responses were
coded on a 5-point semantic differential scale. This scale rated felt need based on: almost every day,
frequently/often, rarely, never or do not know. The responses to almost every day, frequently/often
were combined to depict the felt need to treat water.
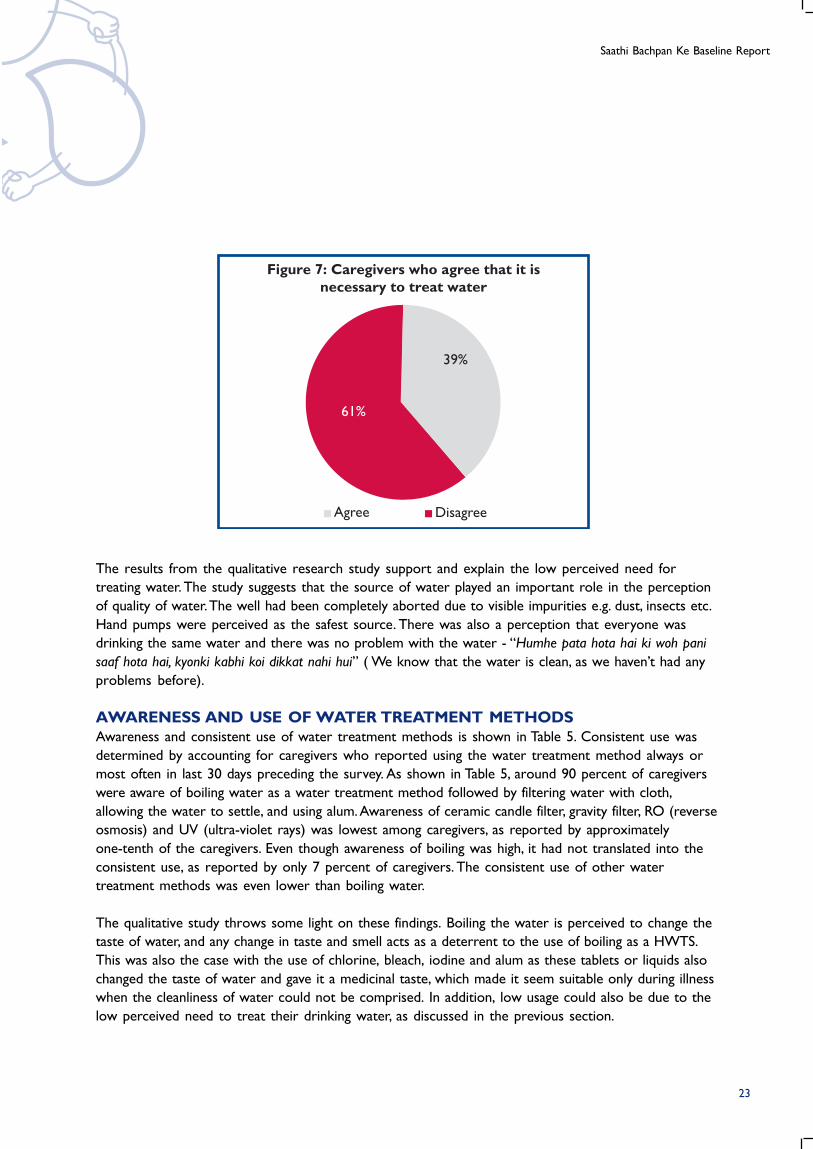
Out of the total sample, 39 percent felt the need to treat their drinking water, while the remaining 61
percent perceived no such need (Figure 7).
22
Saathi Bachpan Ke Baseline Report
Figure 7: Caregivers who agree that it isnecessary to treat water
Agree Disagree
39%
61%
The results from the qualitative research study support and explain the low perceived need for
treating water. The study suggests that the source of water played an important role in the perception
of quality of water. The well had been completely aborted due to visible impurities e.g. dust, insects etc.
Hand pumps were perceived as the safest source. There was also a perception that everyone was
drinking the same water and there was no problem with the water - “Humhe pata hota hai ki woh pani
saaf hota hai, kyonki kabhi koi dikkat nahi hui” ( We know that the water is clean, as we haven’t had any
problems before).
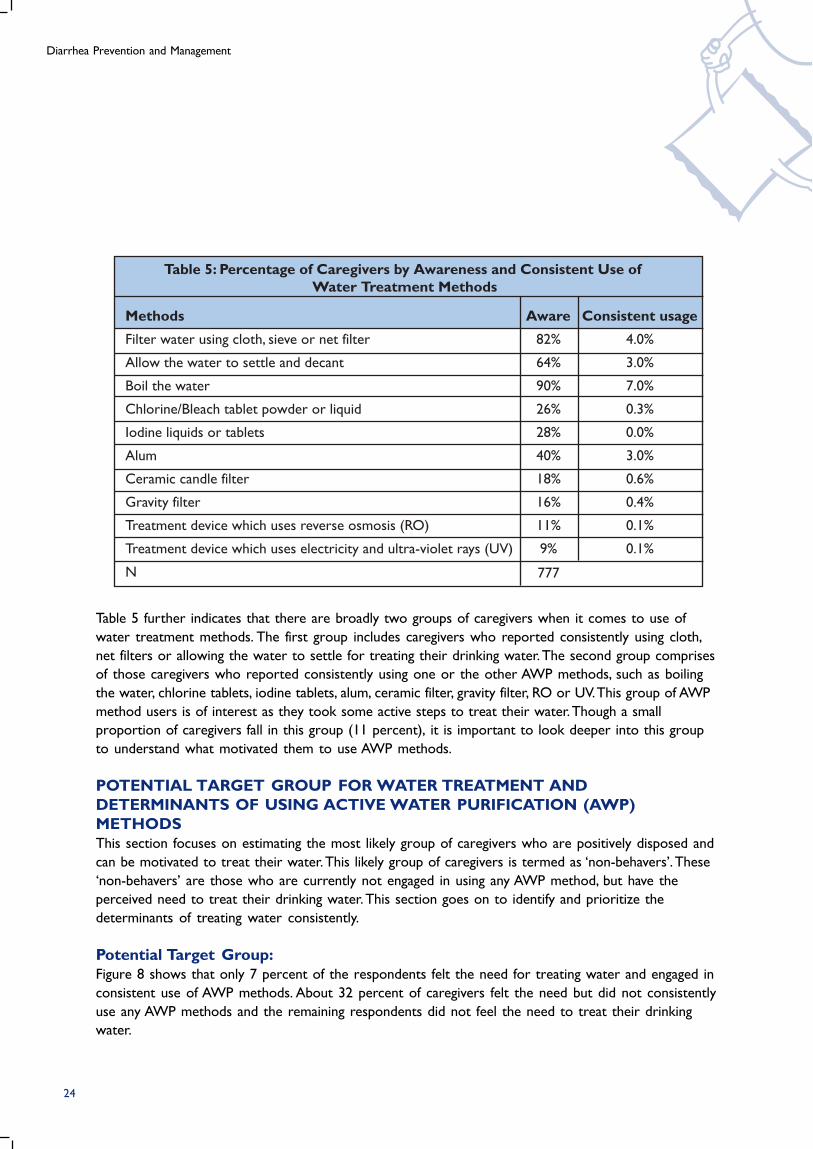
AWARENESS AND USE OF WATER TREATMENT METHODSAwareness and consistent use of water treatment methods is shown in Table 5. Consistent use was
determined by accounting for caregivers who reported using the water treatment method always or
most often in last 30 days preceding the survey. As shown in Table 5, around 90 percent of caregivers
were aware of boiling water as a water treatment method followed by filtering water with cloth,
allowing the water to settle, and using alum. Awareness of ceramic candle filter, gravity filter, RO (reverse
osmosis) and UV (ultra-violet rays) was lowest among caregivers, as reported by approximately
one-tenth of the caregivers. Even though awareness of boiling was high, it had not translated into the
consistent use, as reported by only 7 percent of caregivers. The consistent use of other water
treatment methods was even lower than boiling water.
The qualitative study throws some light on these findings. Boiling the water is perceived to change the
taste of water, and any change in taste and smell acts as a deterrent to the use of boiling as a HWTS.
This was also the case with the use of chlorine, bleach, iodine and alum as these tablets or liquids also
changed the taste of water and gave it a medicinal taste, which made it seem suitable only during illness
when the cleanliness of water could not be comprised. In addition, low usage could also be due to the
low perceived need to treat their drinking water, as discussed in the previous section.
23
Diarrhea Prevention and Management
Table 5: Percentage of Caregivers by Awareness and Consistent Use ofWater Treatment Methods
Methods
Filter water using cloth, sieve or net filter
Allow the water to settle and decant
Boil the water
Chlorine/Bleach tablet powder or liquid
Iodine liquids or tablets
Alum
Ceramic candle filter
Gravity filter
Treatment device which uses reverse osmosis (RO)
Treatment device which uses electricity and ultra-violet rays (UV)
N
Consistent usage
4.0%
3.0%
7.0%
0.3%
0.0%
3.0%
0.6%
0.4%
0.1%
0.1%
Aware
82%
64%
90%
26%
28%
40%
18%
16%
11%
9%
777
Table 5 further indicates that there are broadly two groups of caregivers when it comes to use of
water treatment methods. The first group includes caregivers who reported consistently using cloth,
net filters or allowing the water to settle for treating their drinking water. The second group comprises
of those caregivers who reported consistently using one or the other AWP methods, such as boiling
the water, chlorine tablets, iodine tablets, alum, ceramic filter, gravity filter, RO or UV. This group of AWP
method users is of interest as they took some active steps to treat their water. Though a small
proportion of caregivers fall in this group (11 percent), it is important to look deeper into this group
to understand what motivated them to use AWP methods.
POTENTIAL TARGET GROUP FOR WATER TREATMENT ANDDETERMINANTS OF USING ACTIVE WATER PURIFICATION (AWP)METHODSThis section focuses on estimating the most likely group of caregivers who are positively disposed and
can be motivated to treat their water. This likely group of caregivers is termed as ‘non-behavers’. These
‘non-behavers’ are those who are currently not engaged in using any AWP method, but have the
perceived need to treat their drinking water. This section goes on to identify and prioritize the
determinants of treating water consistently.
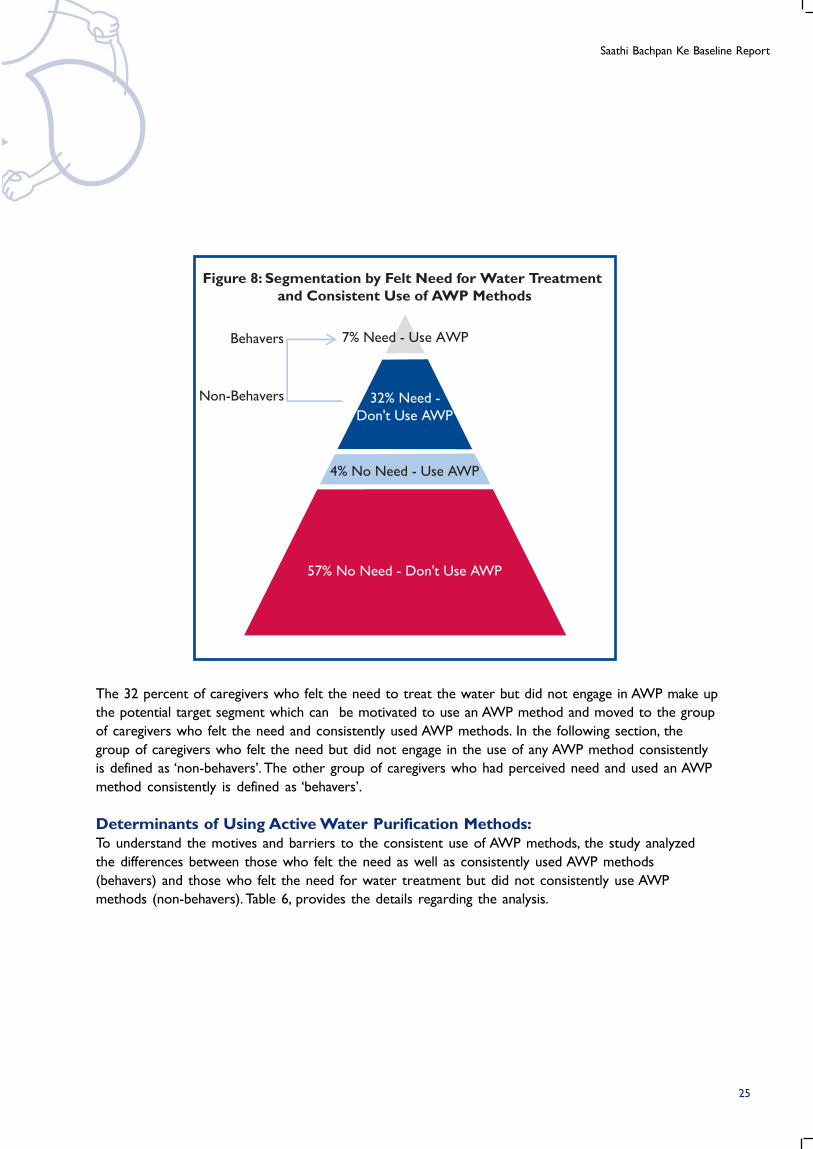
Potential Target Group:Figure 8 shows that only 7 percent of the respondents felt the need for treating water and engaged in
consistent use of AWP methods. About 32 percent of caregivers felt the need but did not consistently
use any AWP methods and the remaining respondents did not feel the need to treat their drinking
water.
24
Saathi Bachpan Ke Baseline Report
Behavers
Non-Behavers
7% Need - Use AWP
32% Need -
Don't Use AWP
4% No Need - Use AWP
57% No Need - Don't Use AWP
Figure 8: Segmentation by Felt Need for Water Treatmentand Consistent Use of AWP Methods
The 32 percent of caregivers who felt the need to treat the water but did not engage in AWP make up
the potential target segment which can be motivated to use an AWP method and moved to the group
of caregivers who felt the need and consistently used AWP methods. In the following section, the
group of caregivers who felt the need but did not engage in the use of any AWP method consistently
is defined as ‘non-behavers’. The other group of caregivers who had perceived need and used an AWP
method consistently is defined as ‘behavers’.
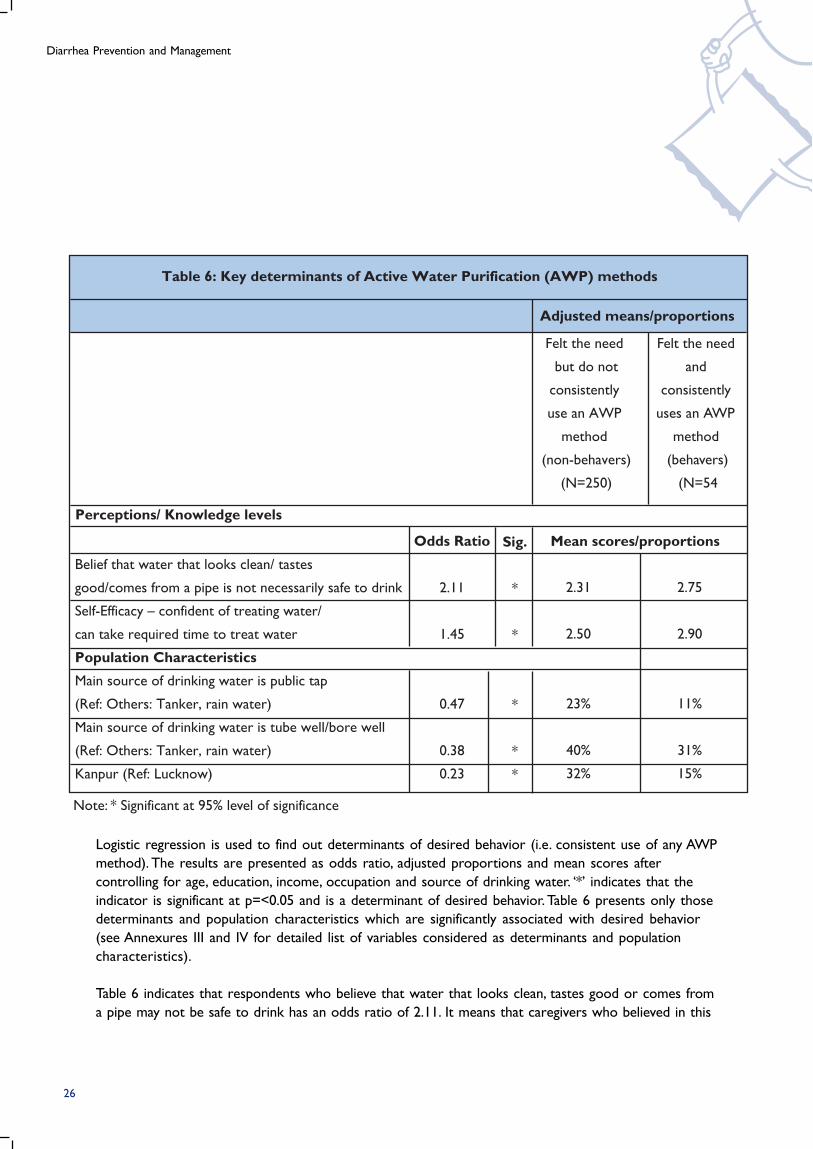
Determinants of Using Active Water Purification Methods:To understand the motives and barriers to the consistent use of AWP methods, the study analyzed
the differences between those who felt the need as well as consistently used AWP methods
(behavers) and those who felt the need for water treatment but did not consistently use AWP
methods (non-behavers). Table 6, provides the details regarding the analysis.
25
Diarrhea Prevention and Management
Odds Ratio
2.11
1.45
0.47
0.38
0.23
Belief that water that looks clean/ tastes
good/comes from a pipe is not necessarily safe to drink
Self-Efficacy – confident of treating water/
can take required time to treat water
Population Characteristics
Main source of drinking water is public tap
(Ref: Others: Tanker, rain water)
Main source of drinking water is tube well/bore well
(Ref: Others: Tanker, rain water)
Kanpur (Ref: Lucknow)
Felt the need
but do not
consistently
use an AWP
method
(non-behavers)
(N=250)
Table 6: Key determinants of Active Water Purification (AWP) methods
Felt the need
and
consistently
uses an AWP
method
(behavers)
(N=54
Perceptions/ Knowledge levels
Sig.
*
*
*
*
*
2.31
2.50
23%
40%
32%
2.75
2.90
11%
31%
15%
Note: * Significant at 95% level of significance
Adjusted means/proportions
Mean scores/proportions
Logistic regression is used to find out determinants of desired behavior (i.e. consistent use of any AWP
method). The results are presented as odds ratio, adjusted proportions and mean scores after
controlling for age, education, income, occupation and source of drinking water. ‘*’ indicates that the
indicator is significant at p=<0.05 and is a determinant of desired behavior. Table 6 presents only those
determinants and population characteristics which are significantly associated with desired behavior
(see Annexures III and IV for detailed list of variables considered as determinants and population
characteristics).
Table 6 indicates that respondents who believe that water that looks clean, tastes good or comes from
a pipe may not be safe to drink has an odds ratio of 2.11. It means that caregivers who believed in this
26

Saathi Bachpan Ke Baseline Report
were twice more likely to exhibit consistent use of AWP methods than those who did not share the
same beliefs. The other significant determinant was ‘self-efficacy’, or respondent’s confidence in being
able to, or take the time to treat water. This determinant also improves caregivers’ likelihood of engaging
in frequent use of AWP methods. Comparison of these two determinants in terms of odds ratio
indicates that the determinant “belief that the water that looks clean, tastes good or comes from a pipe
may not be safe to drink” is more strongly associated with the desired behaviour than the determinant
of ‘self-efficacy’ as it has a higher odds ratio.
Table 6 further indicates that caregivers who were ‘non behavers’ rated the determinant ‘believed that
water that looks clean, tastes good or comes from a pipe may not be safe to drink’ at 2.31 on scale of 1
(strongly disagree) to 4 (strongly agree). A similar pattern was noticed among the ‘non-behavers’ for
the determinant ‘self-efficacy’. This indicates that both determinants have high scope for change.
Table 6 reveals that among all the population characteristics controlled for in the logistic regression,
district and source of water showed a significant difference and played an important role in use of
AWP methods. Those who received water from public taps and tubewells/borewells/hand pumps
were less likely to treat their water than those who received water from tankers/rain water. The odds
ratios for the source of water being public taps and tubewells/borewells/ hand pumps are 0.47 and
0.38 respectively.
As stated earlier, qualitative findings indicate that the source of drinking water adds to the perception
of quality of water. In addition, the qualitative study also finds that purity of water was associated with
its transparency, taste and smell. As long as the water looked clean, tasted sweet and had no smell, there
was no need for water treatment. Most people felt it was the best way to judge how safe it was to
drink, since impurities had to be visible i.e. “Gandagi” ( visible signs of impurities). In addition, any
difference in smell or taste also meant that the water was impure. In addition,there was a tradition of
drinking fresh water as it was considered to be safe and there was an understanding that stale water
should be thrown away - “Taza pani thanda aur meetha hota hai, humhe pata hota hai ki who achcha hota
hai” (fresh water is cool and sweet, we know this is good). They had always seen their parents/earlier
generations follow this system and nothing had happened till then, therefore they felt that it was safe
to continue with this practice.
The findings of Table 6 overall reveals that the key determinant of desired behavior is the belief that
water that looks clean, tastes good or comes from a pipe may not be safe to drink, as it has a very
strong association with the desired behavior (odds ratio: 2.11) and a significant scope for change (non-
behavers mean score: 2.31). The key population characteristic is caregivers with tube well/ hand pumps
as source of their drinking water as these caregivers are the ones who are less likely to use AWP
method consistently. This profile of non-behavers is helpful in developing a marketing mix that appeals
to this specific group.
27
Diarrhea Prevention and Management
CONCLUSIONSFrom the findings of the water treatment section, the following conclusions can be drawn:
• The predominant source of drinking water was tube wells or hand pumps. A majority of
caregivers did not follow safe water storage practice. The study suggests that the source of
water played an important role in the perception of quality of water. Hand pumps were
perceived as the safest source. Hence, the perceived need to treat their drinking water is low.
• Only 7 percent of caregivers felt the need and were using an AWP method consistently. 32
percent of caregivers who felt the need were not using AWP methods such as boling the water,
chlorine tablets, iodine tablets, alum, ceramic filter, gravity filter, RO or UV consistently. This makes
it clear that even though there is a perceived need among caregivers to treat their drinking
water, it has not translated into consistent use of AWP methods.
• The most critical determinant for motivating caregivers who have the perceived need to use an
AWP method consistently is the belief that water that looks clean, tastes good or comes from a
pipe may not be safe to drink. The data analysis suggests that the largest potential lies among
those who have access to piped water or tube-wells/ hand pumps.
• The qualitative study findings explain that purity of water was associated with its transparency,
taste and smell. As long as the water looked clean, tasted sweet and had no smell, there was no
need for water treatment. In addition, there is a tradition of drinking fresh water as it was
considered to be safe and there was an understanding that stale water should be thrown away
since many participants said that their parents had followed this practice with no ill effects, they
felt that they too could continue this way.
RECOMMENDATIONSBased on the findings, the following recommendations are proposed:
• Communication activities should focus on changing the belief that drinking water which looks
clear or tastes better or does not have bad smell, is safe to drink as it still may be contaminated.
• The program should mainly target those caregivers whose predominant drinking water source is
either piped water or tube well/ hand pumps.
• Since the practice of safe storage of drinking water is rare, the program should look for solutions
that focus on safe storage practices.
• The program also needs to include health care providers in order to establish linkages between
unsafe water and disease/illness, and spread the message for usage of water treatment methods.
28

Saathi Bachpan Ke Baseline Report
Households reporting Diarrhea cases
(774)
Both (treated at home
and sought external
advice)
(30.1%)
Sought external
advice/
treatment only
(47.0%)
Treated at home only
(8.8%)
Neither of
the two
(14.1%)
ORAL REHYDRATION THERAPY (ORT)
The sample for the ORT section of the study was drawn from listed households with children below 5
years of age. The sample comprised of 774 caregivers with children under the age five who suffered
from diarrhea in two weeks preceding the survey. The information captured from 3645 households
listed shows that around 22 percent of the total households with children under the age of 5 years
had at least one such child suffering from diarrhea in two weeks preceding the survey.This section
presents the findings related to action taken by caregivers during diarrhea, use of ORT and the
potential target population and barriers to use of ORT during diarrhea.
ACTIONS TAKEN BY CAREGIVERSOf the 774 households that reported diarrhea cases, a majority of caregivers reported treating their
child suffering from diarrhea either at home (39 percent) or sought external advice (77 percent).
Around 14 percent of caregivers did not do anything (Figure 9).
29
Diarrhea Prevention and Management
Table 8: Percent Distribution of caregivers bytype of providers visited
Type of provider
Private
Government
Chemist
Others
N
Caregivers
76%
19%
2.2%
2.8%
774
Table 7: Percent distribution of caregivers by top three actions taken at home or when
external advice was sought
Type treatment
Treatment at home
Sugar-salt solution
ORS
Medicine
Sought external advice
Medicines
ORS
N
Caregivers
51%
35%
37%
69%
40%
774
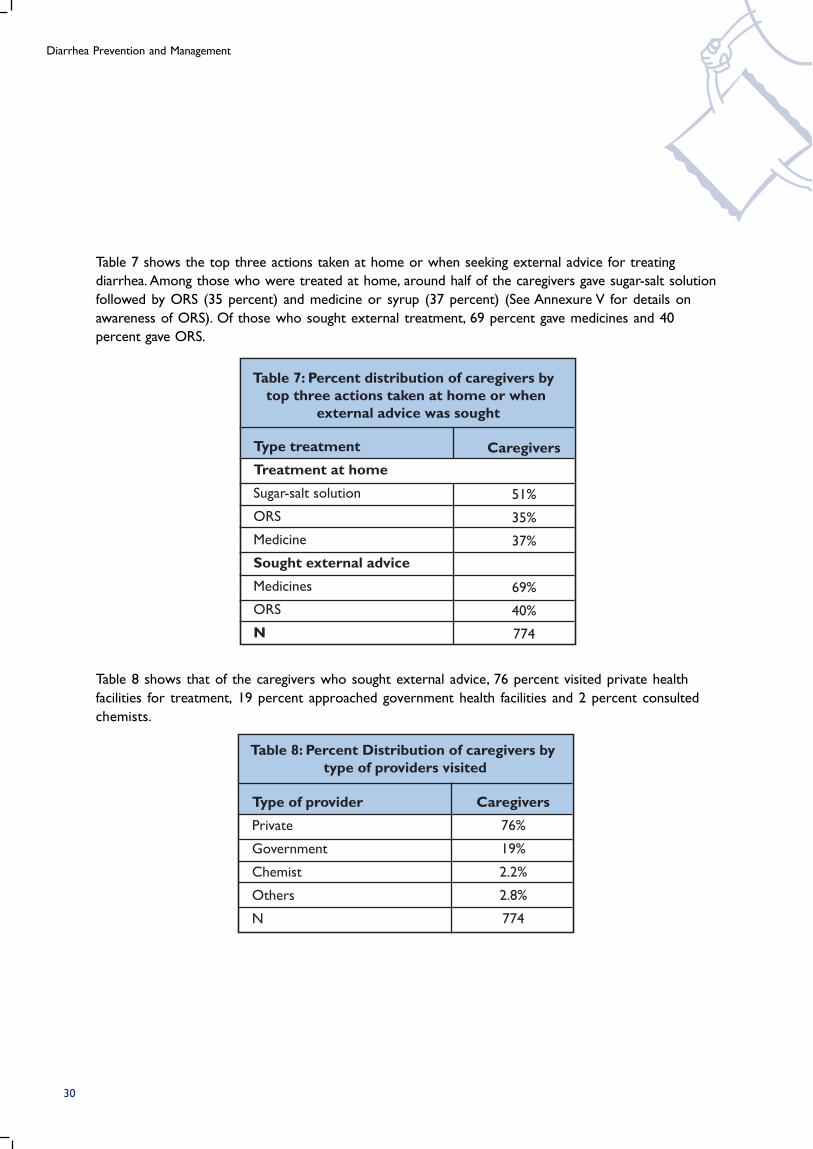
Table 8 shows that of the caregivers who sought external advice, 76 percent visited private health
facilities for treatment, 19 percent approached government health facilities and 2 percent consulted
chemists.
30
Table 7 shows the top three actions taken at home or when seeking external advice for treating
diarrhea. Among those who were treated at home, around half of the caregivers gave sugar-salt solution
followed by ORS (35 percent) and medicine or syrup (37 percent) (See Annexure V for details on
awareness of ORS). Of those who sought external treatment, 69 percent gave medicines and 40
percent gave ORS.
Saathi Bachpan Ke Baseline Report
Table 9: Percent distribution ofcaregivers by use of ORT
Action Taken
ORT
Gave ORS only
Gave Sugar & salt only
Gave both (ORS & sugar & salt)
Gave Gruel only
No ORT given
N
Caregivers
65%
32%
11%
17%
5%
35%
774
The qualitative study revealed that in case of severe diarrhea, most participants opted for treatment
from health providers. They did not feel the need to store ORS even if they were aware about ORS
and its benefits - “jaise hi beemari aati hai to doctor ke paas le jate hai”(we go to the doctor as soon as
someone is ill). However, there may have been lags in taking the child to the health provider. It was found
that the general course of diarrhea treatment was as follows: On the first day of diarrhea, mother tried
to control loose motion by skipping the child’s meal. Usually on the second day, this was followed by
elders of the family trying some home remedies, including sugar-salt solution. Finally on the third day,
the child’s father was informed, involved and the child was taken to the health care provider.
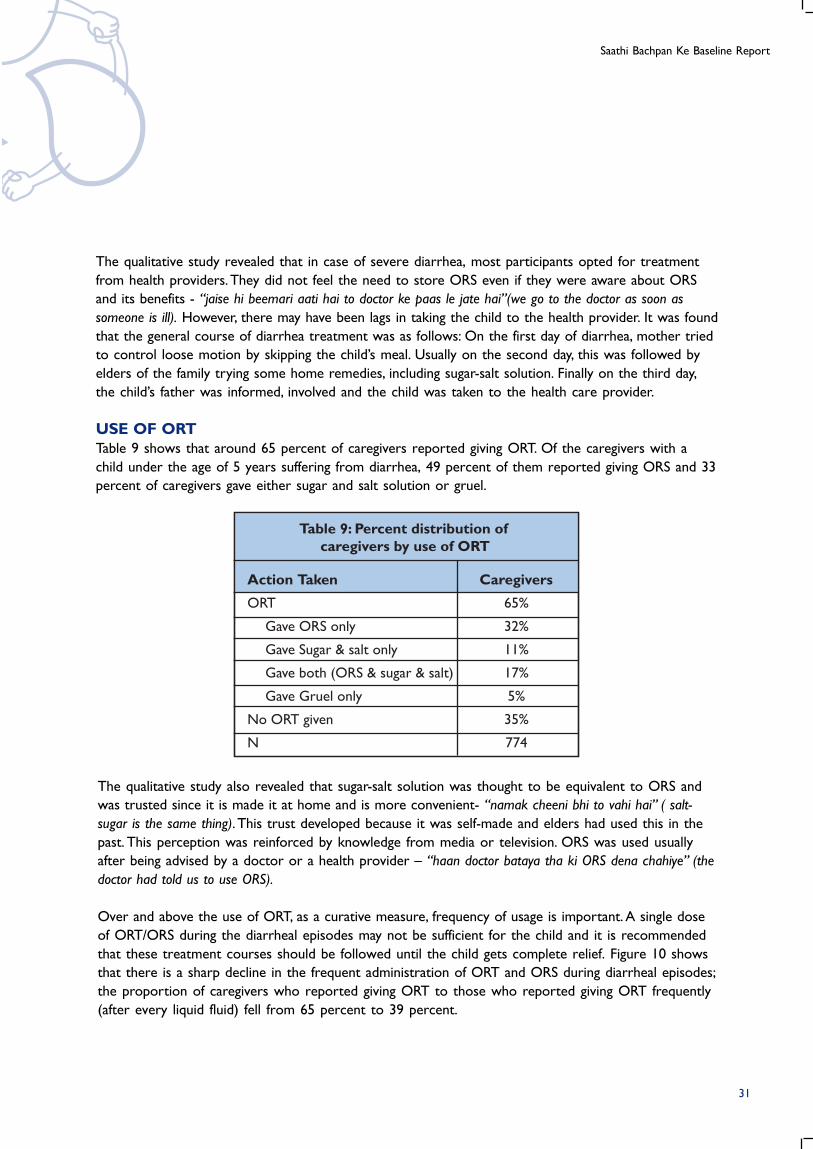
USE OF ORTTable 9 shows that around 65 percent of caregivers reported giving ORT. Of the caregivers with a
child under the age of 5 years suffering from diarrhea, 49 percent of them reported giving ORS and 33
percent of caregivers gave either sugar and salt solution or gruel.
The qualitative study also revealed that sugar-salt solution was thought to be equivalent to ORS and
was trusted since it is made it at home and is more convenient- “namak cheeni bhi to vahi hai” ( salt-
sugar is the same thing). This trust developed because it was self-made and elders had used this in the
past. This perception was reinforced by knowledge from media or television. ORS was used usually
after being advised by a doctor or a health provider – “haan doctor bataya tha ki ORS dena chahiye” (the
doctor had told us to use ORS).
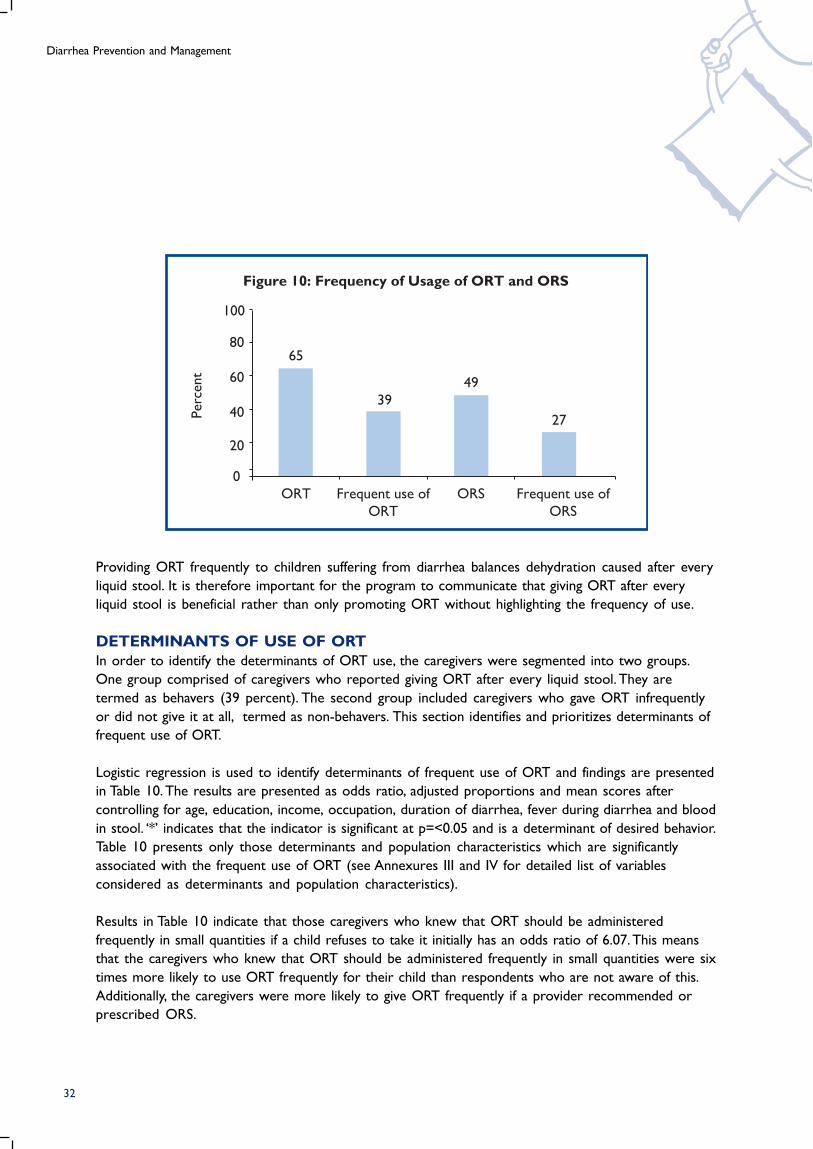
Over and above the use of ORT, as a curative measure, frequency of usage is important. A single dose
of ORT/ORS during the diarrheal episodes may not be sufficient for the child and it is recommended
that these treatment courses should be followed until the child gets complete relief. Figure 10 shows
that there is a sharp decline in the frequent administration of ORT and ORS during diarrheal episodes;
the proportion of caregivers who reported giving ORT to those who reported giving ORT frequently
(after every liquid fluid) fell from 65 percent to 39 percent.
31
Diarrhea Prevention and Management
Figure 10: Frequency of Usage of ORT and ORS
Perc
ent
100
65
39
49
27
80
60
40
20
0
ORT Frequent use of
ORT
Frequent use of
ORS
ORS
32
Providing ORT frequently to children suffering from diarrhea balances dehydration caused after every
liquid stool. It is therefore important for the program to communicate that giving ORT after every
liquid stool is beneficial rather than only promoting ORT without highlighting the frequency of use.
DETERMINANTS OF USE OF ORTIn order to identify the determinants of ORT use, the caregivers were segmented into two groups.
One group comprised of caregivers who reported giving ORT after every liquid stool. They are
termed as behavers (39 percent). The second group included caregivers who gave ORT infrequently
or did not give it at all, termed as non-behavers. This section identifies and prioritizes determinants of
frequent use of ORT.
Logistic regression is used to identify determinants of frequent use of ORT and findings are presented
in Table 10. The results are presented as odds ratio, adjusted proportions and mean scores after
controlling for age, education, income, occupation, duration of diarrhea, fever during diarrhea and blood
in stool. ‘*’ indicates that the indicator is significant at p=<0.05 and is a determinant of desired behavior.
Table 10 presents only those determinants and population characteristics which are significantly
associated with the frequent use of ORT (see Annexures III and IV for detailed list of variables
considered as determinants and population characteristics).
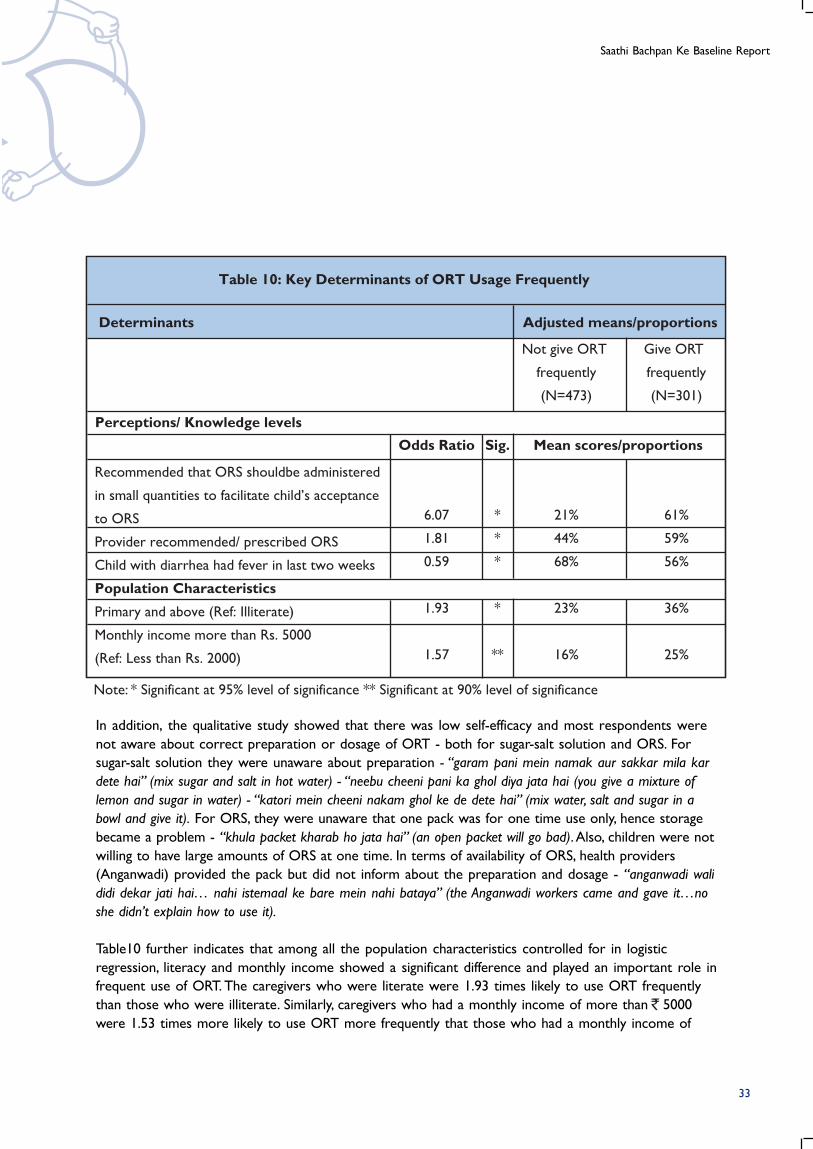
Results in Table 10 indicate that those caregivers who knew that ORT should be administered
frequently in small quantities if a child refuses to take it initially has an odds ratio of 6.07. This means
that the caregivers who knew that ORT should be administered frequently in small quantities were six
times more likely to use ORT frequently for their child than respondents who are not aware of this.
Additionally, the caregivers were more likely to give ORT frequently if a provider recommended or
prescribed ORS.
Saathi Bachpan Ke Baseline Report
33
Odds Ratio
6.07
1.81
0.59
1.93
1.57
Recommended that ORS shouldbe administered
in small quantities to facilitate child’s acceptance
to ORS
Provider recommended/ prescribed ORS
Child with diarrhea had fever in last two weeks
Population Characteristics
Primary and above (Ref: Illiterate)
Monthly income more than Rs. 5000
(Ref: Less than Rs. 2000)
Not give ORT
frequently
(N=473)
Table 10: Key Determinants of ORT Usage Frequently
Give ORT
frequently
(N=301)
Perceptions/ Knowledge levels
Determinants
Sig.
*
*
*
*
**
21%
44%
68%
23%
16%
61%
59%
56%
36%
25%
Note: * Significant at 95% level of significance ** Significant at 90% level of significance
Adjusted means/proportions
Mean scores/proportions
In addition, the qualitative study showed that there was low self-efficacy and most respondents were
not aware about correct preparation or dosage of ORT - both for sugar-salt solution and ORS. For
sugar-salt solution they were unaware about preparation - “garam pani mein namak aur sakkar mila kar
dete hai” (mix sugar and salt in hot water) - “neebu cheeni pani ka ghol diya jata hai (you give a mixture of
lemon and sugar in water) - “katori mein cheeni nakam ghol ke de dete hai” (mix water, salt and sugar in a
bowl and give it). For ORS, they were unaware that one pack was for one time use only, hence storage
became a problem - “khula packet kharab ho jata hai” (an open packet will go bad). Also, children were not
willing to have large amounts of ORS at one time. In terms of availability of ORS, health providers
(Anganwadi) provided the pack but did not inform about the preparation and dosage - “anganwadi wali
didi dekar jati hai… nahi istemaal ke bare mein nahi bataya” (the Anganwadi workers came and gave it…no
she didn’t explain how to use it).
Table10 further indicates that among all the population characteristics controlled for in logistic
regression, literacy and monthly income showed a significant difference and played an important role in
frequent use of ORT. The caregivers who were literate were 1.93 times likely to use ORT frequently
than those who were illiterate. Similarly, caregivers who had a monthly income of more than 5000
were 1.53 times more likely to use ORT more frequently that those who had a monthly income of
Diarrhea Prevention and Management
34
2000 or less. This indicates that the caregivers who were uneducated and had monthly income of
2000 or less, were the ones who did not give ORT frequently to their child suffering from diarrhea.
This appears as a constant trend across use of all three health behaviours: water, soap and ORT.
CONCLUSIONSFrom the findings on ORT use, the following conclusions can be drawn:
• Around 65 percent of caregivers reported using ORT. Consistent use was much lower and
declined significantly to 39 percent when caregivers were asked about the use of ORT after
every liquid stool.
• The two significant determinants that could trigger behavior change among those who did not
give ORT frequently to their child during diarrheal episode were: a) recommendations by health
care providers and b) knowledge that ORT should be administered in small quantities to
facilitate child’s acceptance to ORT.
• The qualitative study showed that there was low self-efficacy and most respondents were not
aware of correct preparation or dosage of ORT - both for sugar-salt solution and ORS.
• Caregivers who were uneducated and had monthly income of Rs. 2000 or less were less likely
to use ORT frequently.
RECOMMENDATIONSBased on the findings, the following recommendations are proposed:
• The program communication needs to focus on creating awareness that ORT should be
administered frequently after every liquid stool.
• Focus on emphasizing that ORT should be administered in small quantities if the child initially
refuses to take ORT.
• Increase the awareness of correct preparation and dosage of ORT. This would need to focus on
both sugar-salt solution and ORS, in order to increase correct use of ORT.
• Health care providers’ recommendation of ORT/ORS is important to trigger use among
caregivers. Providing these recommendations through health care providers is likely to have a
larger impact in having caregivers administer ORT frequently during diarrheal episodes. Training
sessions among health care providers should highlight this fact and advocate recommending
ORT/ORS to caregivers.
• Caregivers who are uneducated and have monthly income of 2000 or less are a potential
segment for increasing frequent use of ORT. The program interventions should focus on
developing appropriate marketing mix that appeals to this group of caregivers.
Saathi Bachpan Ke Baseline Report
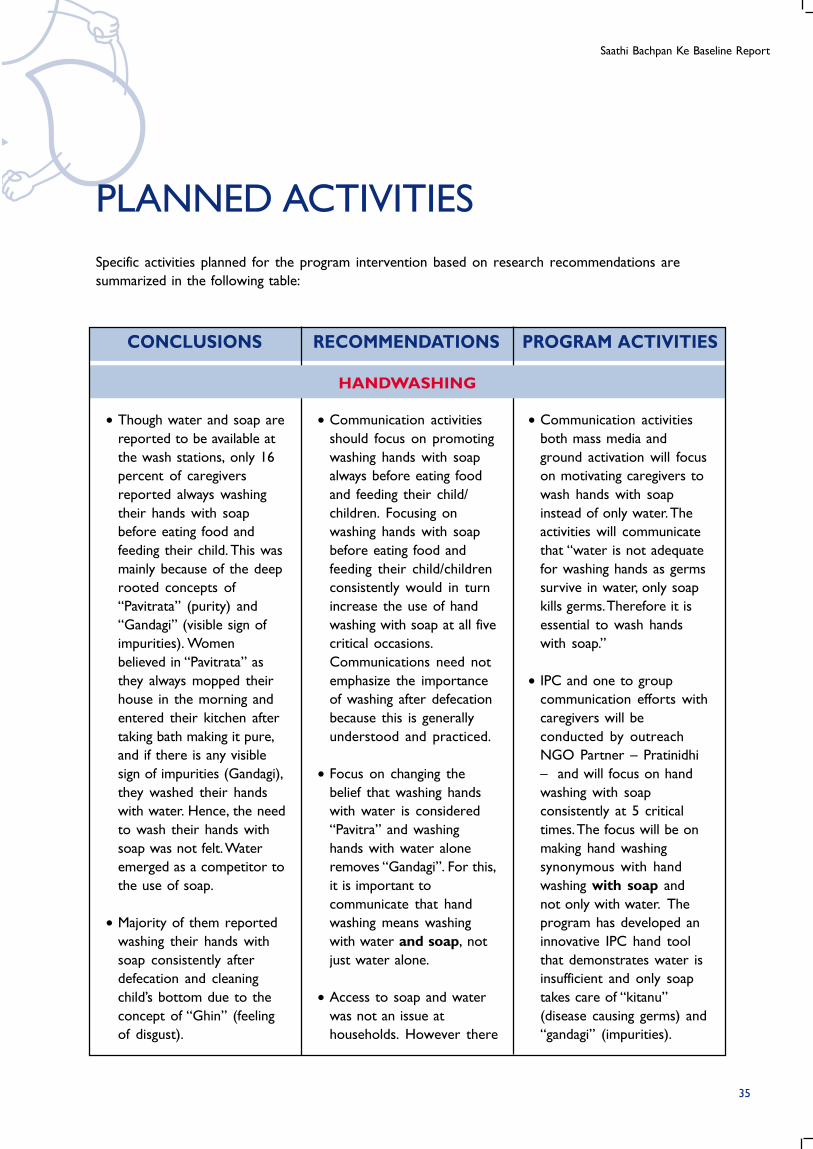
CONCLUSIONS RECOMMENDATIONS PROGRAM ACTIVITIES
• Communication activities
both mass media and
ground activation will focus
on motivating caregivers to
wash hands with soap
instead of only water. The
activities will communicate
that “water is not adequate
for washing hands as germs
survive in water, only soap
kills germs. Therefore it is
essential to wash hands
with soap.”
• IPC and one to group
communication efforts with
caregivers will be
conducted by outreach
NGO Partner – Pratinidhi
– and will focus on hand
washing with soap
consistently at 5 critical
times. The focus will be on
making hand washing
synonymous with hand
washing with soap and
not only with water. The
program has developed an
innovative IPC hand tool
that demonstrates water is
insufficient and only soap
takes care of “kitanu”
(disease causing germs) and
“gandagi” (impurities).
• Communication activities
should focus on promoting
washing hands with soap
always before eating food
and feeding their child/
children. Focusing on
washing hands with soap
before eating food and
feeding their child/children
consistently would in turn
increase the use of hand
washing with soap at all five
critical occasions.
Communications need not
emphasize the importance
of washing after defecation
because this is generally
understood and practiced.
• Focus on changing the
belief that washing hands
with water is considered
“Pavitra” and washing
hands with water alone
removes “Gandagi”. For this,
it is important to
communicate that hand
washing means washing
with water and soap, not
just water alone.
• Access to soap and water
was not an issue at
households. However there
• Though water and soap are
reported to be available at
the wash stations, only 16
percent of caregivers
reported always washing
their hands with soap
before eating food and
feeding their child. This was
mainly because of the deep
rooted concepts of
“Pavitrata” (purity) and
“Gandagi” (visible sign of
impurities). Women
believed in “Pavitrata” as
they always mopped their
house in the morning and
entered their kitchen after
taking bath making it pure,
and if there is any visible
sign of impurities (Gandagi),
they washed their hands
with water. Hence, the need
to wash their hands with
soap was not felt. Water
emerged as a competitor to
the use of soap.
• Majority of them reported
washing their hands with
soap consistently after
defecation and cleaning
child’s bottom due to the
concept of “Ghin” (feeling
of disgust).
PLANNED ACTIVITIES
Specific activities planned for the program intervention based on research recommendations are
summarized in the following table:
35
HANDWASHING
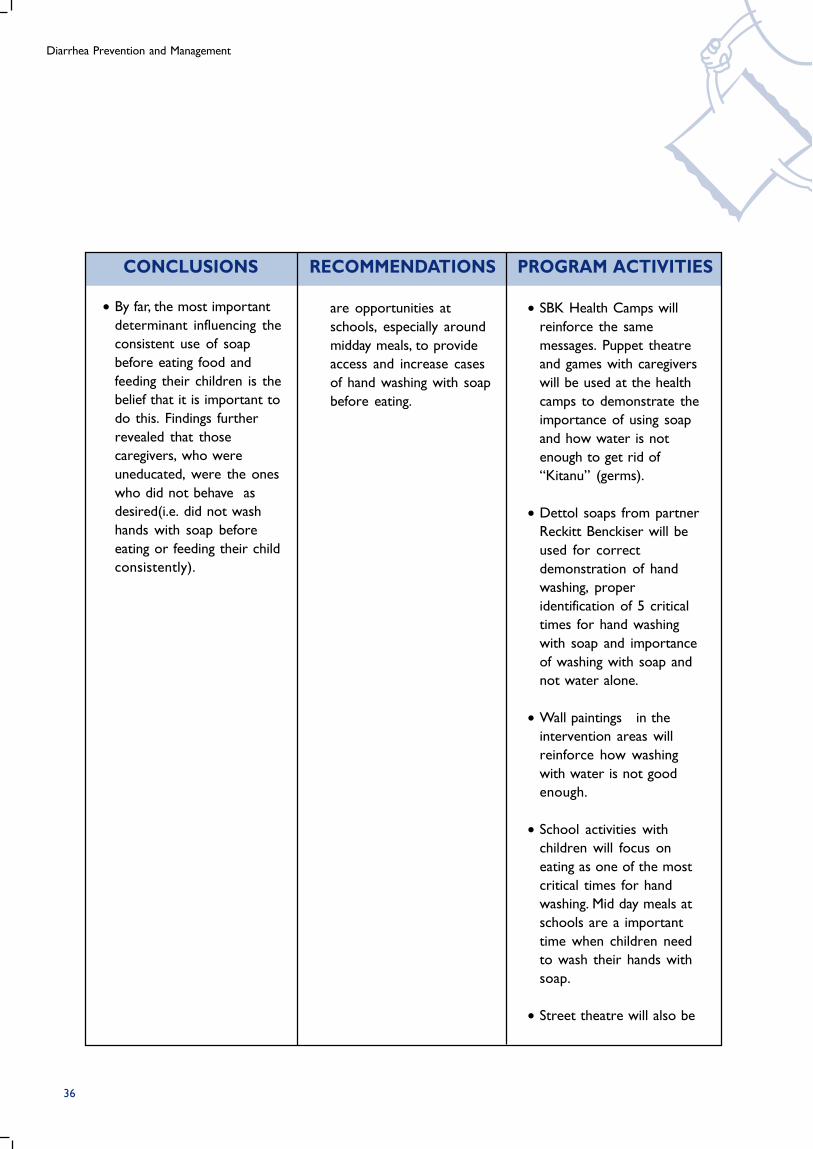
Diarrhea Prevention and Management
CONCLUSIONS RECOMMENDATIONS PROGRAM ACTIVITIES
• By far, the most important
determinant influencing the
consistent use of soap
before eating food and
feeding their children is the
belief that it is important to
do this. Findings further
revealed that those
caregivers, who were
uneducated, were the ones
who did not behave as
desired(i.e. did not wash
hands with soap before
eating or feeding their child
consistently).
are opportunities at
schools, especially around
midday meals, to provide
access and increase cases
of hand washing with soap
before eating.
• SBK Health Camps will
reinforce the same
messages. Puppet theatre
and games with caregivers
will be used at the health
camps to demonstrate the
importance of using soap
and how water is not
enough to get rid of
“Kitanu” (germs).
• Dettol soaps from partner
Reckitt Benckiser will be
used for correct
demonstration of hand
washing, proper
identification of 5 critical
times for hand washing
with soap and importance
of washing with soap and
not water alone.
• Wall paintings in the
intervention areas will
reinforce how washing
with water is not good
enough.
• School activities with
children will focus on
eating as one of the most
critical times for hand
washing. Mid day meals at
schools are a important
time when children need
to wash their hands with
soap.
• Street theatre will also be
36
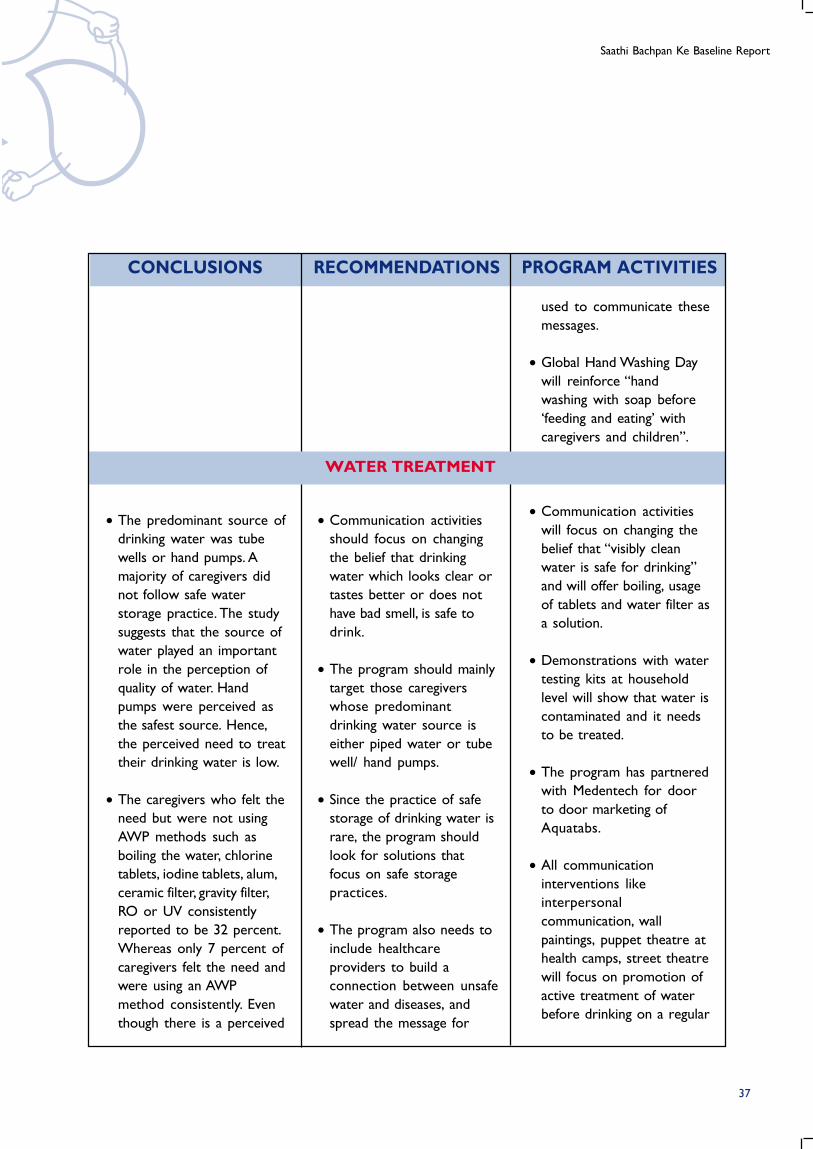
Saathi Bachpan Ke Baseline Report
CONCLUSIONS RECOMMENDATIONS PROGRAM ACTIVITIES
used to communicate these
messages.
• Global Hand Washing Day
will reinforce “hand
washing with soap before
‘feeding and eating’ with
caregivers and children”.
• Communication activities
will focus on changing the
belief that “visibly clean
water is safe for drinking”
and will offer boiling, usage
of tablets and water filter as
a solution.
• Demonstrations with water
testing kits at household
level will show that water is
contaminated and it needs
to be treated.
• The program has partnered
with Medentech for door
to door marketing of
Aquatabs.
• All communication
interventions like
interpersonal
communication, wall
paintings, puppet theatre at
health camps, street theatre
will focus on promotion of
active treatment of water
before drinking on a regular
• Communication activities
should focus on changing
the belief that drinking
water which looks clear or
tastes better or does not
have bad smell, is safe to
drink.
• The program should mainly
target those caregivers
whose predominant
drinking water source is
either piped water or tube
well/ hand pumps.
• Since the practice of safe
storage of drinking water is
rare, the program should
look for solutions that
focus on safe storage
practices.
• The program also needs to
include healthcare
providers to build a
connection between unsafe
water and diseases, and
spread the message for
• The predominant source of
drinking water was tube
wells or hand pumps. A
majority of caregivers did
not follow safe water
storage practice. The study
suggests that the source of
water played an important
role in the perception of
quality of water. Hand
pumps were perceived as
the safest source. Hence,
the perceived need to treat
their drinking water is low.
• The caregivers who felt the
need but were not using
AWP methods such as
boiling the water, chlorine
tablets, iodine tablets, alum,
ceramic filter, gravity filter,
RO or UV consistently
reported to be 32 percent.
Whereas only 7 percent of
caregivers felt the need and
were using an AWP
method consistently. Even
though there is a perceived
37
WATER TREATMENT
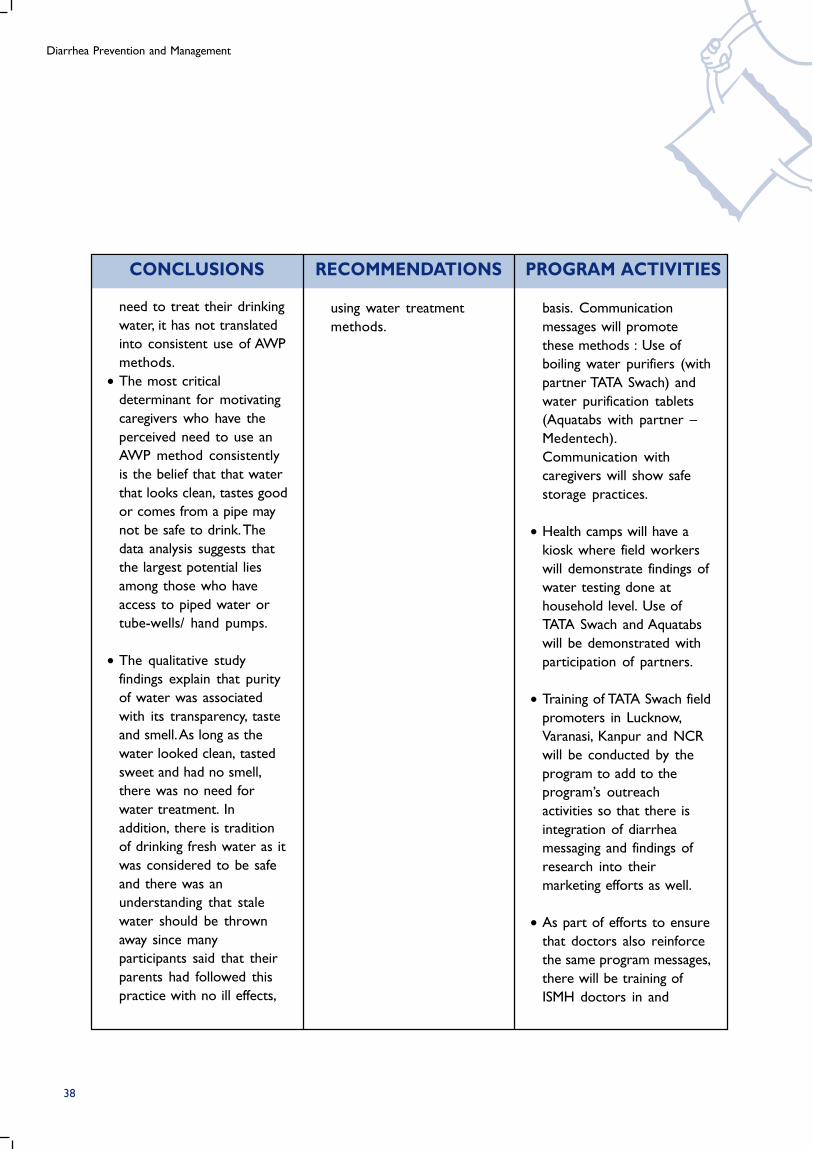
Diarrhea Prevention and Management
CONCLUSIONS RECOMMENDATIONS PROGRAM ACTIVITIES
need to treat their drinking
water, it has not translated
into consistent use of AWP
methods.
• The most critical
determinant for motivating
caregivers who have the
perceived need to use an
AWP method consistently
is the belief that that water
that looks clean, tastes good
or comes from a pipe may
not be safe to drink. The
data analysis suggests that
the largest potential lies
among those who have
access to piped water or
tube-wells/ hand pumps.
• The qualitative study
findings explain that purity
of water was associated
with its transparency, taste
and smell. As long as the
water looked clean, tasted
sweet and had no smell,
there was no need for
water treatment. In
addition, there is tradition
of drinking fresh water as it
was considered to be safe
and there was an
understanding that stale
water should be thrown
away since many
participants said that their
parents had followed this
practice with no ill effects,
using water treatment
methods.
basis. Communication
messages will promote
these methods : Use of
boiling water purifiers (with
partner TATA Swach) and
water purification tablets
(Aquatabs with partner –
Medentech).
Communication with
caregivers will show safe
storage practices.
• Health camps will have a
kiosk where field workers
will demonstrate findings of
water testing done at
household level. Use of
TATA Swach and Aquatabs
will be demonstrated with
participation of partners.
• Training of TATA Swach field
promoters in Lucknow,
Varanasi, Kanpur and NCR
will be conducted by the
program to add to the
program’s outreach
activities so that there is
integration of diarrhea
messaging and findings of
research into their
marketing efforts as well.
• As part of efforts to ensure
that doctors also reinforce
the same program messages,
there will be training of
ISMH doctors in and
38

Saathi Bachpan Ke Baseline Report
CONCLUSIONS RECOMMENDATIONS PROGRAM ACTIVITIES
around intervention slums
on importance of water
treatment in diarrhea
prevention. There will be
demonstration of
purification methods
(Aquatabs water
purification tablets and
TATA Swach Filters) at the
training.
• Mass media advertising for
frequent use of ORS will
focus on motivating
mothers to continue giving
ORS “even when child
refuses” in small quantities,
repeatedly.
• IPC will focus on all aspects
of ORS use – correct
making of ORS solution,
correct dosage according
to age, correct use after
every diarrheal episode and
correct storage – for 24
hours only.
• IPC will also focus on other
home remedies like sugar-
salt solution and on what
to give and not to give
besides reinforcing
breastfeeding and
continuation of feeding
during episodes of diarrhea.
• The program
communication needs to
focus on creating
awareness that ORT should
be administered frequently
after every liquid stool.
• Focus on emphasizing that
ORT should be
administered in small
quantities if the child
initially refuses to take
ORT.
• Increase the awareness of
correct preparation and
dosage of ORT. This would
need to focus on both
sugar-salt solution and ORS,
in order to increase
correct use of ORT.
• Health care providers’
recommendation of ORT/
ORS is important to trigger
and hence they felt that
they too could continue
this way.
• Around 65 percent of
caregivers reported using
ORT. Consistent use was
much lower and declined
significantly to 39 percent
when caregivers were
asked about the use of
ORT after every liquid
stool.
• The two significant
determinants that could
trigger behavior change
among those who did not
give ORT frequently to
their child during diarrheal
episode were
a) recommendations by
health care providers and
b) knowledge that ORT
should be administered in
small quantities to facilitate
child’s acceptance to ORT.
• The qualitative study
39
ORAL REHYDRATION THERAPY (ORT)
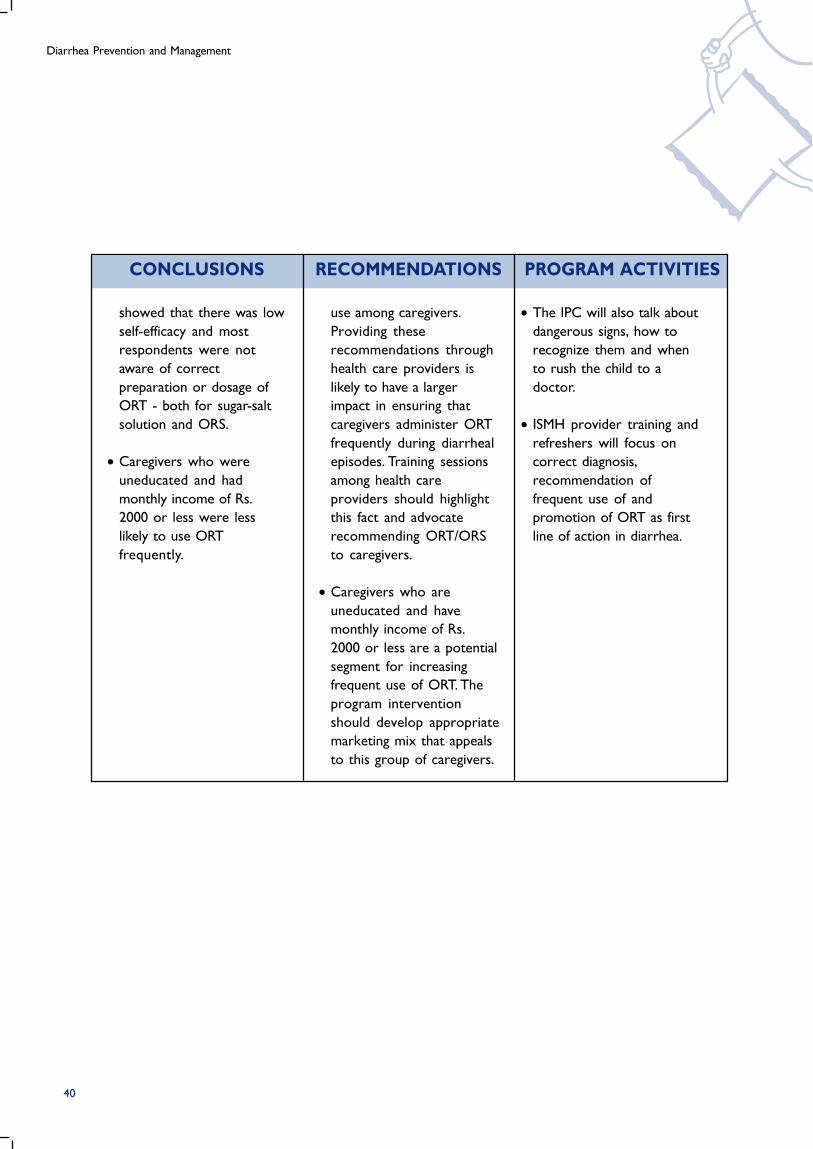
Diarrhea Prevention and Management
CONCLUSIONS RECOMMENDATIONS PROGRAM ACTIVITIES
showed that there was low
self-efficacy and most
respondents were not
aware of correct
preparation or dosage of
ORT - both for sugar-salt
solution and ORS.
• Caregivers who were
uneducated and had
monthly income of Rs.
2000 or less were less
likely to use ORT
frequently.
use among caregivers.
Providing these
recommendations through
health care providers is
likely to have a larger
impact in ensuring that
caregivers administer ORT
frequently during diarrheal
episodes. Training sessions
among health care
providers should highlight
this fact and advocate
recommending ORT/ORS
to caregivers.
• Caregivers who are
uneducated and have
monthly income of Rs.
2000 or less are a potential
segment for increasing
frequent use of ORT. The
program intervention
should develop appropriate
marketing mix that appeals
to this group of caregivers.
• The IPC will also talk about
dangerous signs, how to
recognize them and when
to rush the child to a
doctor.
• ISMH provider training and
refreshers will focus on
correct diagnosis,
recommendation of
frequent use of and
promotion of ORT as first
line of action in diarrhea.
40
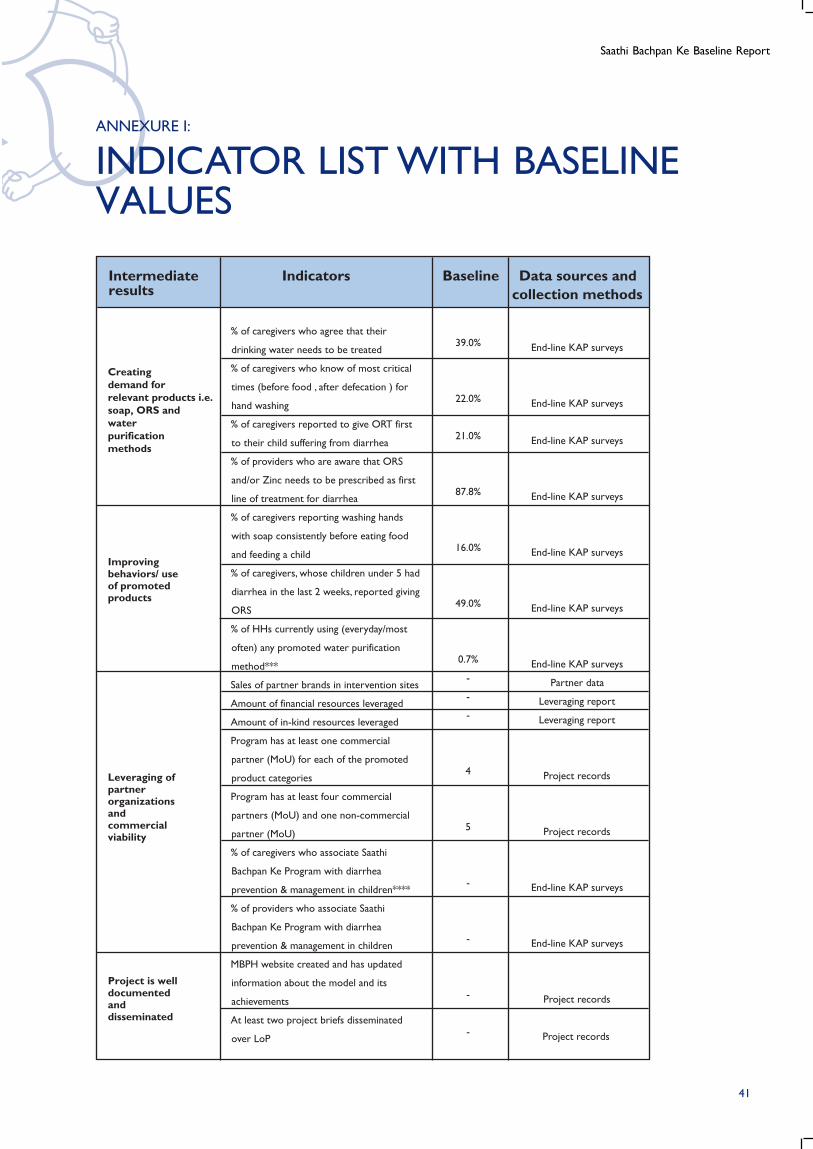
Saathi Bachpan Ke Baseline Report
Creating demand for relevant products i.e. soap, ORS and water purification methods
Improving behaviors/ use of promoted products
Leveraging of partner organizations and commercial viability
Project is well documented and disseminated
End-line KAP surveys
End-line KAP surveys
End-line KAP surveys
End-line KAP surveys
End-line KAP surveys
End-line KAP surveys
End-line KAP surveys
Partner data
Leveraging report
Leveraging report
Project records
Project records
End-line KAP surveys
End-line KAP surveys
Project records
Project records
39.0%
22.0%
21.0%
87.8%
16.0%
49.0%
0.7%
-
-
-
4
5
-
-
-
-
% of caregivers who agree that their
drinking water needs to be treated
% of caregivers who know of most critical
times (before food , after defecation ) for
hand washing
% of caregivers reported to give ORT first
to their child suffering from diarrhea
% of providers who are aware that ORS
and/or Zinc needs to be prescribed as first
line of treatment for diarrhea
% of caregivers reporting washing hands
with soap consistently before eating food
and feeding a child
% of caregivers, whose children under 5 had
diarrhea in the last 2 weeks, reported giving
ORS
% of HHs currently using (everyday/most
often) any promoted water purification
method***
Sales of partner brands in intervention sites
Amount of financial resources leveraged
Amount of in-kind resources leveraged
Program has at least one commercial
partner (MoU) for each of the promoted
product categories
Program has at least four commercial
partners (MoU) and one non-commercial
partner (MoU)
% of caregivers who associate Saathi
Bachpan Ke Program with diarrhea
prevention & management in children****
% of providers who associate Saathi
Bachpan Ke Program with diarrhea
prevention & management in children
MBPH website created and has updated
information about the model and its
achievements
At least two project briefs disseminated
over LoP
Intermediateresults
Indicators Baseline Data sources andcollection methods
ANNEXURE I:
INDICATOR LIST WITH BASELINEVALUES
41
Diarrhea Prevention and Management
ANNEXURE II:
SAMPLE SIZE DETERMINATION
The target respondents for the hand washing and water treatment were caregivers of children under
the age of 5 years and for ORT/ ORS, the target respondents were caregivers of children under the
age of 5 years, who reported that their children suffered from diarrhea two weeks preceding the
survey. A total of 2354 caregivers for hand washing, 777 caregivers for water treatment and 774
caregivers for ORT/ORS were covered under the study. The main assumptions and considerations in
sample size calculation are discussed below for the three behaviors of interest, viz. hand washing with
soap, use of promoted water treatment method and ORS/ORT, separately:
• Hand washing with soap: The baseline value of washing hand consistently with soap at critical
points was assumed to be 50 percent. A change of 5 percent was assumed during the program
intervention period at 95 percent confidence level and 80 percent power with design effect of
1.5 and 10 percent non-response. In addition, the sample size calculation also considered
measuring a difference of 20 percent between those who consistently washed hands with soaps
and those who did not among, the key determinants. Overall, a sample size of 2052 was
determined for estimating the hand washing with soap consistently and identifying triggers and
barrier to the use of soap. But, overall, a higher sample size was covered to ensure selecting a
representative sample from the project slums.
• Use of promoted water treatment method: Promoted water treatment method includes use of
gravity filter, chlorine tablets or boiling water. The baseline value for use of promoted method was
considered to be not more than 8 percent based on the field experience. A change of 5 percent
was assumed during the program period at 95 percent confidence level and 80 percent power
with design effect of 1.5 and 10 percent non-response. Overall, the estimated sample size for
determining required change in the use of promoted water treatment method was 772 care
givers of children under the age of 5 years.
• Use of ORT/ORS: The baseline value for the use of ORS was assumed to be 50 percent for
optimizing the sample size estimation. Overall, a 10 percent change was assumed during the
program intervention period at 95 percent confidence level and 80 percent power with design
effect of 1.5 and 10 percent non-response. In addition, a sample size calculation also considered
measuring a difference of 20 percent between those who used ORS and those who did not
among the key determinants. Hence, a sample size of 750 care givers was estimated for assessing
the required change in use of ORS during the program period and identifying triggers and
barriers to ORS use.
42
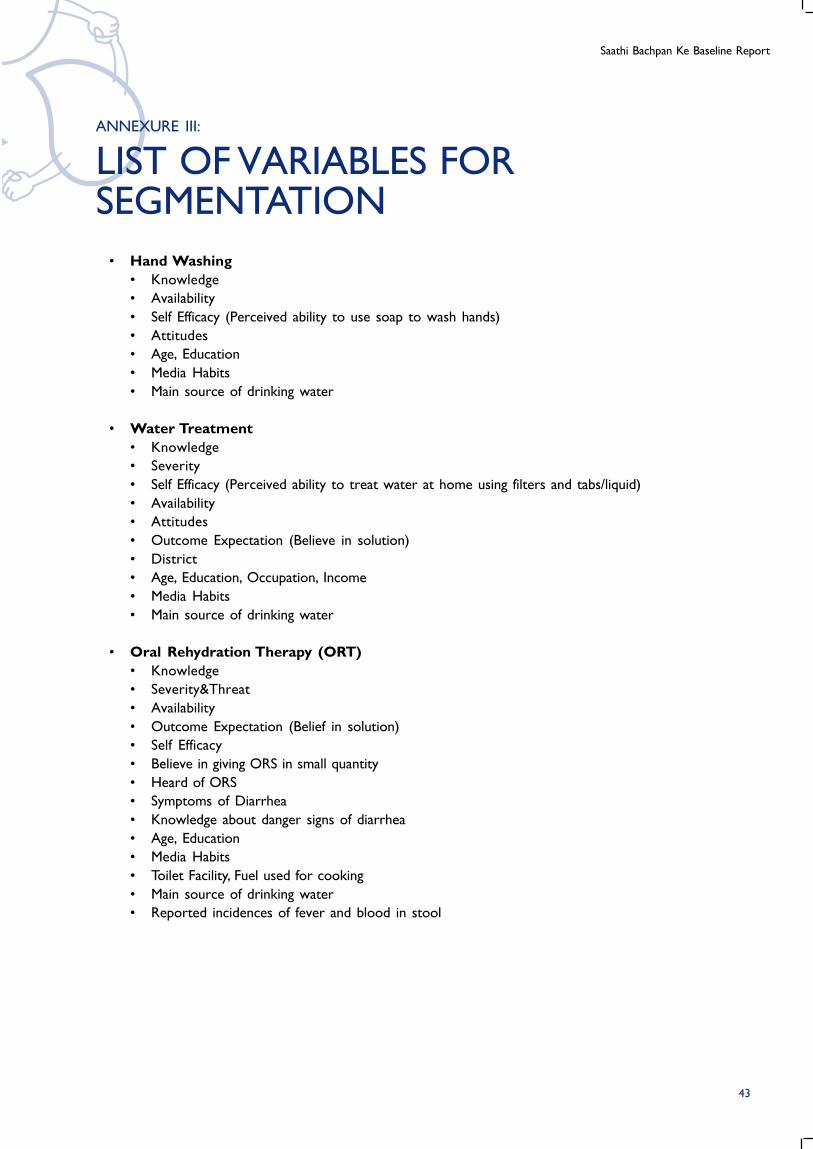
Saathi Bachpan Ke Baseline Report
ANNEXURE III:
LIST OF VARIABLES FORSEGMENTATION
• Hand Washing
• Knowledge
• Availability
• Self Efficacy (Perceived ability to use soap to wash hands)
• Attitudes
• Age, Education
• Media Habits
• Main source of drinking water
• Water Treatment
• Knowledge
• Severity
• Self Efficacy (Perceived ability to treat water at home using filters and tabs/liquid)
• Availability
• Attitudes
• Outcome Expectation (Believe in solution)
• District
• Age, Education, Occupation, Income
• Media Habits
• Main source of drinking water
• Oral Rehydration Therapy (ORT)
• Knowledge
• Severity&Threat
• Availability
• Outcome Expectation (Belief in solution)
• Self Efficacy
• Believe in giving ORS in small quantity
• Heard of ORS
• Symptoms of Diarrhea
• Knowledge about danger signs of diarrhea
• Age, Education
• Media Habits
• Toilet Facility, Fuel used for cooking
• Main source of drinking water
• Reported incidences of fever and blood in stool
43
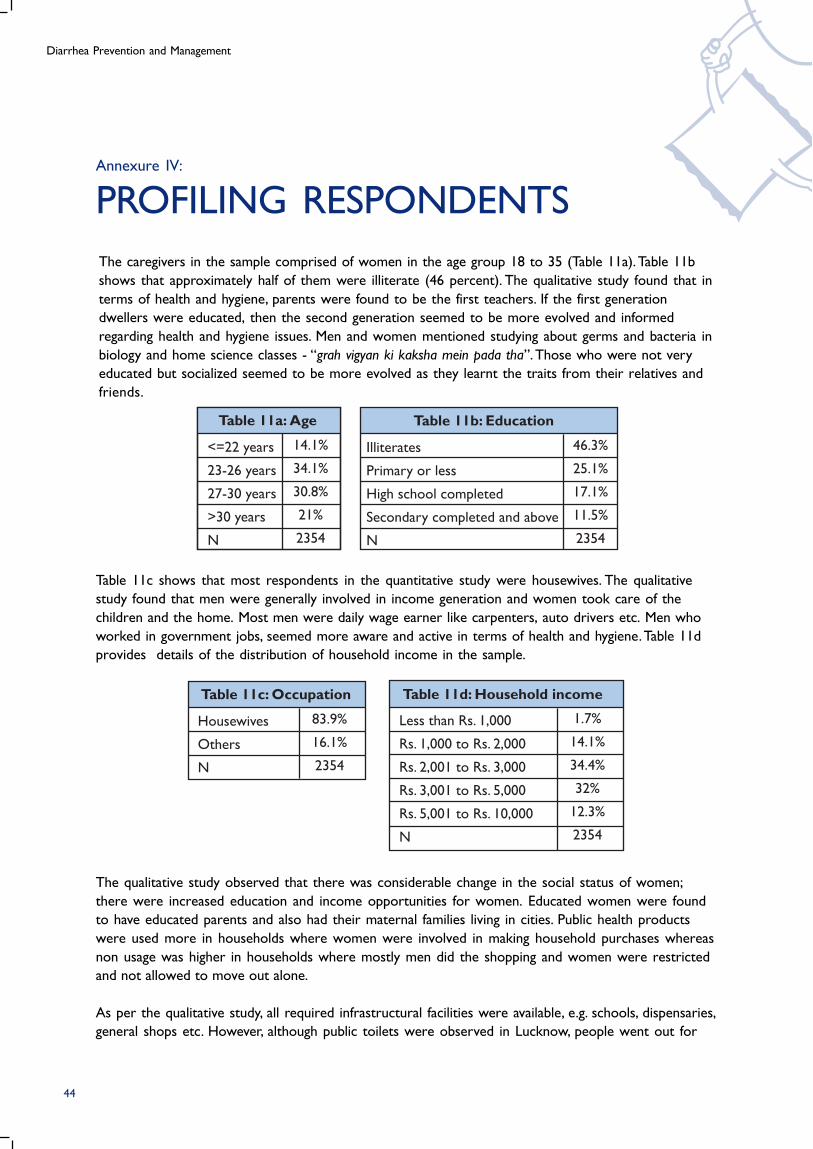
Diarrhea Prevention and Management
Annexure IV:
PROFILING RESPONDENTS
The caregivers in the sample comprised of women in the age group 18 to 35 (Table 11a). Table 11b
shows that approximately half of them were illiterate (46 percent). The qualitative study found that in
terms of health and hygiene, parents were found to be the first teachers. If the first generation
dwellers were educated, then the second generation seemed to be more evolved and informed
regarding health and hygiene issues. Men and women mentioned studying about germs and bacteria in
biology and home science classes - “grah vigyan ki kaksha mein pada tha”. Those who were not very
educated but socialized seemed to be more evolved as they learnt the traits from their relatives and
friends.
Table 11c shows that most respondents in the quantitative study were housewives. The qualitative
study found that men were generally involved in income generation and women took care of the
children and the home. Most men were daily wage earner like carpenters, auto drivers etc. Men who
worked in government jobs, seemed more aware and active in terms of health and hygiene. Table 11d
provides details of the distribution of household income in the sample.
The qualitative study observed that there was considerable change in the social status of women;
there were increased education and income opportunities for women. Educated women were found
to have educated parents and also had their maternal families living in cities. Public health products
were used more in households where women were involved in making household purchases whereas
non usage was higher in households where mostly men did the shopping and women were restricted
and not allowed to move out alone.
As per the qualitative study, all required infrastructural facilities were available, e.g. schools, dispensaries,
general shops etc. However, although public toilets were observed in Lucknow, people went out for
Table 11a: Age
<=22 years
23-26 years
27-30 years
>30 years
N
14.1%
34.1%
30.8%
21%
2354
Table 11b: Education
Illiterates
Primary or less
High school completed
Secondary completed and above
N
46.3%
25.1%
17.1%
11.5%
2354
44
Table 11c: Occupation
Housewives
Others
N
83.9%
16.1%
2354
Table 11d: Household income
Less than Rs. 1,000
Rs. 1,000 to Rs. 2,000
Rs. 2,001 to Rs. 3,000
Rs. 3,001 to Rs. 5,000
Rs. 5,001 to Rs. 10,000
N
1.7%
14.1%
34.4%
32%
12.3%
2354
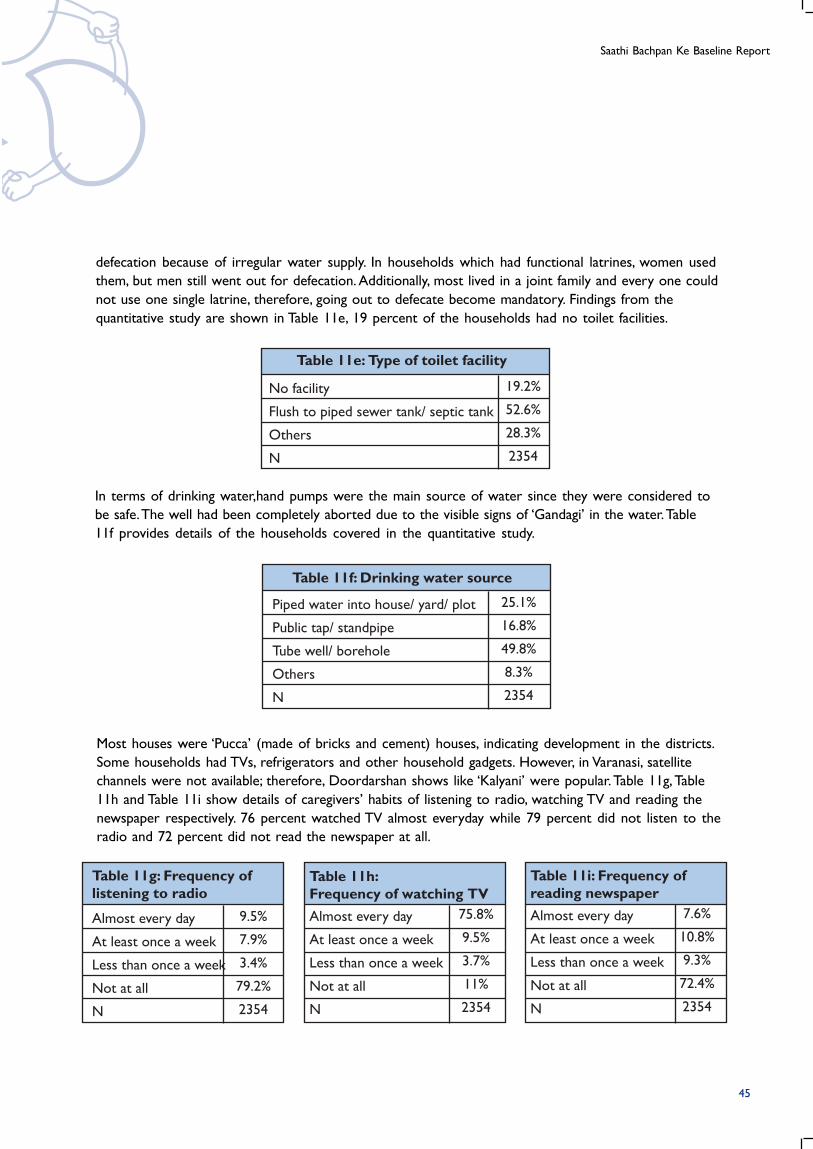
Saathi Bachpan Ke Baseline Report
Table 11f: Drinking water source
Piped water into house/ yard/ plot
Public tap/ standpipe
Tube well/ borehole
Others
N
25.1%
16.8%
49.8%
8.3%
2354
Table 11e: Type of toilet facility
No facility
Flush to piped sewer tank/ septic tank
Others
N
19.2%
52.6%
28.3%
2354
defecation because of irregular water supply. In households which had functional latrines, women used
them, but men still went out for defecation. Additionally, most lived in a joint family and every one could
not use one single latrine, therefore, going out to defecate become mandatory. Findings from the
quantitative study are shown in Table 11e, 19 percent of the households had no toilet facilities.
In terms of drinking water,hand pumps were the main source of water since they were considered to
be safe. The well had been completely aborted due to the visible signs of ‘Gandagi’ in the water. Table
11f provides details of the households covered in the quantitative study.
Most houses were ‘Pucca’ (made of bricks and cement) houses, indicating development in the districts.
Some households had TVs, refrigerators and other household gadgets. However, in Varanasi, satellite
channels were not available; therefore, Doordarshan shows like ‘Kalyani’ were popular. Table 11g, Table
11h and Table 11i show details of caregivers’ habits of listening to radio, watching TV and reading the
newspaper respectively. 76 percent watched TV almost everyday while 79 percent did not listen to the
radio and 72 percent did not read the newspaper at all.
Table 11g: Frequency oflistening to radio
Almost every day
At least once a week
Less than once a week
Not at all
N
9.5%
7.9%
3.4%
79.2%
2354
Table 11h:Frequency of watching TVAlmost every day
At least once a week
Less than once a week
Not at all
N
75.8%
9.5%
3.7%
11%
2354
Table 11i: Frequency ofreading newspaperAlmost every day
At least once a week
Less than once a week
Not at all
N
7.6%
10.8%
9.3%
72.4%
2354
45
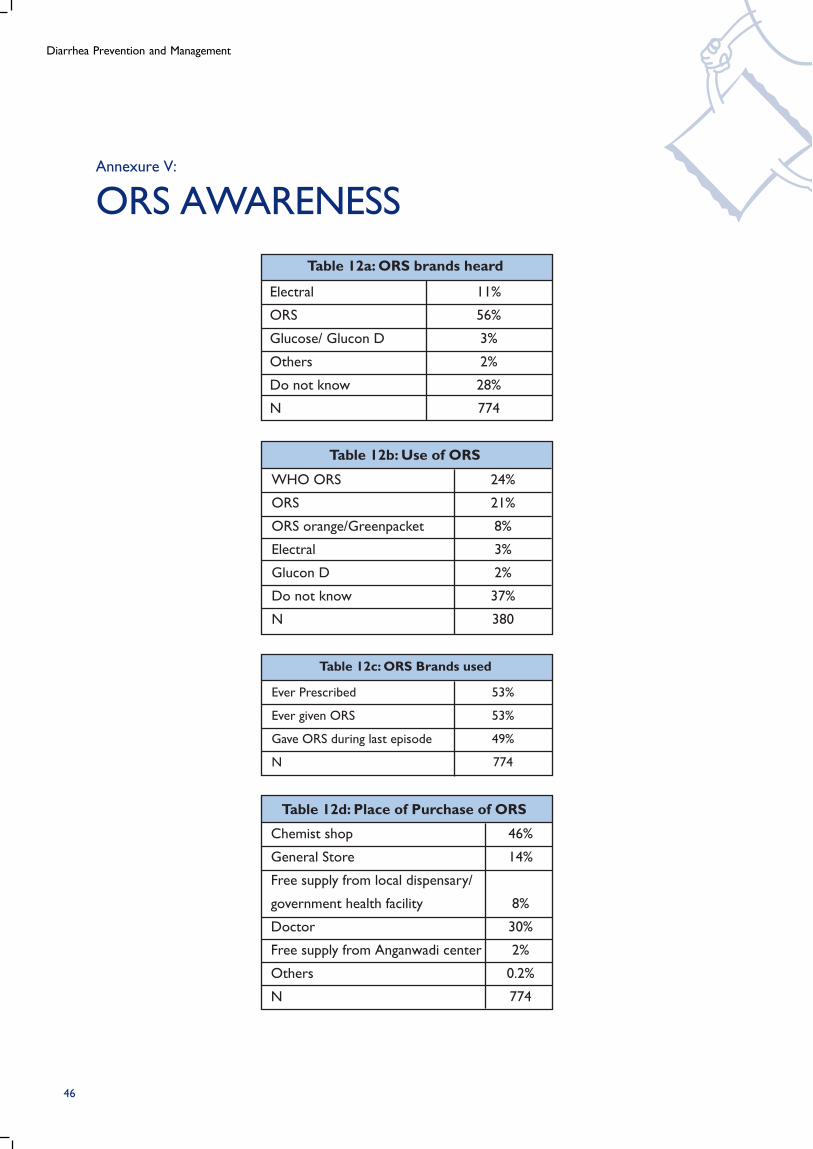
Diarrhea Prevention and Management
Table 12d: Place of Purchase of ORS
Chemist shop
General Store
Free supply from local dispensary/
government health facility
Doctor
Free supply from Anganwadi center
Others
N
46%
14%
8%
30%
2%
0.2%
774
Table 12b: Use of ORS
WHO ORS
ORS
ORS orange/Greenpacket
Electral
Glucon D
Do not know
N
24%
21%
8%
3%
2%
37%
380
Ever Prescribed
Ever given ORS
Gave ORS during last episode
N
53%
53%
49%
774
Table 12c: ORS Brands used
Table 12a: ORS brands heard
Electral
ORS
Glucose/ Glucon D
Others
Do not know
N
11%
56%
3%
2%
28%
774
Annexure V:
ORS AWARENESS
46
Saathi Bachpan Ke Baseline Report
Annexure VI:
PROFILE OF A NON-BEHAVER
Manju Devi has been married for 5 years and lives in a joint family with her husband, parents-in-law,
‘devar-devrani’ (brother-in-law and his wife) and 2 children. She is illiterate. The men are the decision
makers in the family and her opinion and that of other women is not solicited in family matters.
If she wants something, she has to let her husband know and if he feels it is necessary, he will go out
and buy it. She is not allowed to go out of the house and has little or no social interaction. Her daily
routine includes mainly household related activities - “Hum sube uthete hein, bache ko dudh pilate
hein, saf safai, manjan karwate hein, hamara husband jate hein to unke liye khana vana banate hein, baki
apna aur apne bache ki dekh bhal karte hain” (I wake up in the morning, feed milk to the child, clean up,
get them to brush, my husband leaves so I prepare food for him, the rest of the time I look after myself
and my child).
While there is a TV at home and she likes to watch the daily soap operas but finds it difficult to find
time. Sometimes the electricity fails as well, so she can’t watch it. – “light ki yahan bahut pareshani hai”
(electricity is very unpredictable).
Her perception about ‘gandagi’ is mainly visible ‘gandagi’ and cleanliness is very important to her - “ghar
mein jhado lagana, pocha lagana zaroori hota hai” (sweeping and mopping the house is important). She
has a deep rooted idea of ‘pavitrata (purity)’ and enters the kitchen only after having a bath.
She was introduced to the concept of soap for hand washing before her marriage but would
mostly wash hands with water rather than use soap. After defection, she would be more regular in
using soap. Since then she has continued to use soap post defection and when there is visible gandagi
(dirt) in her hands as she sees a visible difference - “mail nakhono mein bhar jate hai” (dirt collects
under the nails). But, she does not feel the need to wash her hands with soap at other critical points
every time.
Further, she does not know anything about the necessity of water treatment. Her husband though
educated, also does not feel the need for water treatment and her maternal home is also completely
unaware about water treatment. Everyone in family thinks that since they are drinking hand pump
water and their forefathers also drank the same water, there should not be a problem. If nothing
happened in the past, then nothing will happen in the present or the future. Therefore, they feel that
their source of water is completely pure - Pani meetha hai, achcha hai” (the water is sweet so it is
good) and “Shuru se peete aa rahein hain, kabhi kuch nahi hua” (we have been drinking this water
since the start and nothing has happened to us).
She feels helpless about her children falling sick and blames the environment in the slum. She trusts
her home remedies for initial treatment and provides sugar salt solution since it is convenient and
she has seen her parents using the same methods- “kyonki humko inpe vishvas hai... Kyonki humare
maa baap bhi bahut pehele se ye sab karte aa rahe hai” (we use this because we believe in it, our
parents have also been following this practice from a long time ago) and “Bazaar jane main samaye na
barbaad ho isliye” (going to the market takes a lot of time). She would take her child to the doctor only
after a few days of persistent sickness and provide ORS solution for diarrhea only if it was prescribed
by the doctor.
47

Diarrhea Prevention and Management
For more information, visit www.mbph.in