saarnai saökyaa 6.1 k::½...
TRANSCRIPT

Aaó½añegak utpaadnaH 25
Industrial Production:
saarNai saöKyaa 6.1 K::½ padaTaý
Table No. 6.1 - Food Products
A)la maI jaÜna jaÚlaaI AgastaesatambarAVtaÜbar navambar edsambar janavari Prvari maaca
Apr May Jun Jul Aug Sep Oct Nov Dec Jan Feb MarSugar (Thousand tonnes) phuh (gtkj-Vu)
2007-08 3716 1359 489 160 210 227 230 1272 4697 5455 5278 4759 2008-09 2915 939 261 187 123 182 221 1484 4221 4039 2635 1201 2009-10 380 188 133 32 90 .. ..Milk powder (Tonnes) nwX/k ikmMj (Vu)
2007-08 11569 9854 7023 7162 7221 8719 10962 14687 17992 21302 28432 17278 2008-09 14326 12328 9642 9639 10977 11459 10213 15323 17889 21533 15683 14037 2009-10 10990 8571 7906 5724 6940 .. ..Biscuits (Tonnes) fcLdqV (Vu)
2007-08 98927 97471 107480 107785 112173 103992 102026 99678 105338 106142 105532 105557 2008-09 106416 116688 117044 121509 123198 123904 115422 118664 118081 117682 116313 121349 2009-10 122659 124540 130164 128957 127866 .. ..Chocolate & sugar confectionary (Tonnes) pk¡dysV o Pkhuh dUQSD'kujh (Vu)
2007-08 4126 4045 4187 4844 4941 4766 4986 4687 5166 5169 4840 4813 2008-09 4786 4867 4196 5147 5748 5621 5760 5566 5274 5505 5995 5579 2009-10 4435 4284 4916 5540 5186 .. ..Malted food (Tonnes) ekYVM [kk| inkFkZ (Vu)
2007-08 6316 8577 5538 6457 6292 7656 7290 6128 7261 8208 6665 7452 2008-09 4051 4495 4117 4127 4836 4697 4469 4329 4375 4457 3847 5117 2009-10 4302 4432 4113 3949 4365 .. ..Wheat flour/maida ('000 tonnes) xsgwa dk vkVk/eSnk (*000 Vu) 2007-08 188 181 185 179 181 175 185 170 180 182 174 171 2008-09 177 176 170 171 186 193 187 177 182 180 179 188 2009-10 184 198 190 211 216 .. ..Salt ('000 tonnes) ued (*000 Vu)
2007-08 2305.8 2796.0 5733.6 560.2 254.8 587.0 791.8 342.1 820.0 871.6 1358.8 1423.6 2008-09 2069.8 2854.9 4717.1 768.3 335.7 484.2 673.4 680.1 1188.2 1368.5 1685.5 2379.3 2009-10 3088.9 3621.3 4718.1 650.1 336.9 .. ..Source:- Department of Industrial Policy & Promotion L=ksr :- vkS|ksfxd mRiknu lwpdakd ds vkWadM+sDevelopment Commissioner (Small-scale Industries)/Directorate of Sugar - for IIP Data
phuh (gtkj-Vu) nwX/k ikmMj (Vu)
0
1000
2000
3000
4000
5000
6000
Apr07 Nov 07 Jun 08 Jan 09 Aug09
Production of Sugar(Thousand tonnes)
500070009000
11000130001500017000190002100023000250002700029000
Apr07 Nov 07 Jun 08 Jan 09 Aug09
Production of Milk powder (Tonnes)

26
A)óla maI jaÜna jaÚlaaI Agasta esatambar AVtaÜbar navambar edsambar janavari Prvari maacaý
Apr May Jun Jul Aug Sep Oct Nov Dec Jan Feb Mar
2007-08 111847 107694 107594 113197 105972 121708 134562 129053 112518 108622 120990 106371 2008-09 114529 125744 124912 140879 134022 151991 149816 152553 178413 169437 149540 136610 2009-10 149235 128112 109414 117135 148026 .. ..Soyabean oil (Tonnes) 2007-08 97289 84774 98530 81375 75481 73827 160935 225476 222404 189333 174229 134461 2008-09 100593 88094 83783 82797 63924 30487 117477 267606 198592 159678 108736 87427 2009-10 68109 62419 54505 53181 93965 .. ..Deoiled mustard cake (Tonnes) 2007-08 159646 175778 165343 145110 115728 125766 108436 74603 106249 157999 179738 199475 2008-09 125912 138289 116302 121762 126795 93998 60275 44182 34965 30078 56543 113894 2009-10 140173 175035 123056 143003 97286 .. ..Sun flower oil (Tonnes) 2007-08 10871 12438 10647 10767 8301 7569 11642 8564 8584 8120 7287 5125 2008-09 8601 8635 19554 11815 7801 8832 6838 8963 9095 13018 7980 6597 2009-10 4521 9953 11750 11492 12657 .. ..Coconut oil (Tonnes) 2007-08 730 1664 1363 1157 1359 1718 1316 1501 1661 1945 1784 909 2008-09 1272 914 1229 1135 1363 1892 1733 1458 1379 1416 1150 1492 2009-10 1367 1608 1107 1977 1150 .. ..Source:- Directorate of Vanaspati- for IIP Data
[kk?k ouLifr rsy (Vu) lks;kchu rsy (Vu)
lwjteq[kh rsy (Vu) ukfj;y rsy (Vu)
L=ksr :- vkS|ksfxd mRiknu lwpdakd ds vkWadM+s
lwjteq[kh rsy (Vu)
Edible hydrogenated oil (Tonnes)
ukfj;y rsy (Vu)
[kk?k ouLifr rsy (Vu)
lks;kchu rsy (Vu)
fMvk;YM eLVMZ dsd (Vu
Aaó½añegak utpaadnaH
Industrial Production:saarNai saöKyaa 6.2 K::½ t:ól:
Table No. 6.2 - Edible Oil
4000
6000
8000
10000
12000
14000
16000
18000
20000
Apr 07 Nov 07 Jun 08 Jan09 Aug 09
Production of Sun flower oil (Tonnes)
0
500
1000
1500
2000
2500
3000
Apr 07 Nov 07 Jun 08 Jan09 Aug 09
Production of Coconut oil (Tonnes)
60000
80000
100000
120000
140000
160000
180000
200000
Apr 07 Nov 07 Jun 08 Jan09 Aug 09
Production of Edible hydrogenated oil (Tonnes)
20000
60000
100000
140000
180000
220000
260000
300000
Apr 07 Nov 07 Jun 08 Jan09 Aug 09
Production of Soyabean oil (Tonnes)

27Aa½aegak utpaadnaH
A)la maI jaÜna jaÚlaaI AgastaesatambarAVtaÜbar navambaredsambar janavari Prvari maaca
Apr May Jun Jul Aug Sep Oct Nov Dec Jan Feb MarGround nut oil (Tonnes) 2007-08 790 702 1710 1106 575 7 822 3316 6068 5449 3601 3204 2008-09 1878 2169 3105 2780 4331 1246 932 2454 2890 21682 16090 4586 2009-10 3271 2872 2759 2194 1212 .. ..Mustard oil / rape seed oil (Tonnes) 2007-08 14715 14785 13839 12976 9650 10685 8647 5965 16024 11590 13714 14454 2008-09 10237 10125 10787 13552 10331 6922 6208 2054 2820 10570 3454 11176 2009-10 12721 17738 10409 12544 9828 .. ..Cotton seed oil (Tonnes) 2007-08 2688 1948 1352 1140 514 - 709 3659 3804 3637 3201 3691 2008-09 2832 2561 2678 1055 508 535 418 2491 9897 5911 5427 4076 2009-10 3898 3532 1872 1676 794 .. ..Deoiled rice bran (Tonnes)
2007-08 381101 387958 378757 317751 257086 250790 245485 318737 443869 529358 534239 466095 2008-09 347034 431689 357147 345855 382390 355523 280294 406828 565715 631058 583652 537698 2009-10 456406 514352 419001 431119 281062 .. ..Rice bran oil (Tonnes) 2007-08 60621 66411 66919 59405 50465 44170 43048 56917 91197 98685 92472 75096 2008-09 59719 75967 64150 67038 71486 69306 45151 67654 102002 107264 120669 95298 2009-10 77183 78610 78249 76462 50487 .. ..Till seed oil (Tonnes) 2007-08 14 19 12 183 115 36 68 - 72 23 - - 2008-09 - - - - - - - - - - - - 2009-10 - - - - - - -Source:- Directorate of Vanaspati - for IIP Data
ewaxQyh rsy (Vu) eLVMZ@jsilhM rsy (Vu)
L=ksr :- vkS|ksfxd mRiknu lwpdakd ds vkWadM+s
jkbZl ewlh rsy (Vu)
fry cht rsy (Vu)
ewaxQyh rsy (Vu)
eLVMZ@jsilhM rsy (Vu)
fcukSyh rsy (Vu)
fMvk;YM pkoy czku (Vu)
Industrial Production:
Table No. 6.2 - Edible Oil (Concld)
saarNai saöKyaa 6.2 K::½ rsy ( lekIr)
0
2000
4000
6000
8000
10000
12000
14000
16000
18000
20000
22000
Apr 07 Nov 07 Jun 08 Jan 09 Aug 09
Production of Ground nut oil (Tonnes)
0
5000
10000
15000
20000
25000
30000
Apr 07 Nov 07 Jun 08 Jan 09 Aug 09
Production of Mustard oil/rape seed oil (Tonnes)

28
A)óla maI jaÜna jaÚlaaI Agasta esatambar AVtaÜbar navambar edsambar janavari Prvari maacaý
Apr May Jun Jul Aug Sep Oct Nov Dec Jan Feb MarTea ('000 tonnes) 2007-08 65.37 74.37 108.29 125.08 116.28 113.20 113.30 91.95 50.17 21.62 17.77 50.54 2008-09 80.04 70.27 105.44 130.95 123.00 107.01 125.81 89.65 54.00 21.57 15.27 45.04 2009-10 62.59 71.37 118.05 126.99 123.00 .. ..Coffee (Tonnes) 2007-08 33839 32237 29556 28399 19000 20000 17000 19000 1830 4000 25000 35000 2008-09 25000 25000 26000 25000 20000 22000 21000 20000 14000 5000 24000 40000 2009-10 26000 27000 27000 26000 20000 .. ..Rectified spirit (Kls) 2007-08 97047 95549 88523 85175 87492 80116 90242 93478 110637 109620 103851 99426 2008-09 97874 97464 86467 76460 87882 73068 67672 77958 95897 90032 77862 70558 2009-10 58270 57028 52579 45439 40725 .. ..Beer (Kls) 2007-08 37344 44863 43376 31813 28071 30167 26328 25372 24743 22707 46291 46590 2008-09 46746 48812 43040 34371 29750 32088 31818 32717 29061 30331 39968 53369 2009-10 50549 56197 49050 39360 32497 .. ..Indian made foreign liquor (Kls) 2007-08 22932 24736 25687 25380 24633 24458 25379 26098 28661 24771 25056 25077 2008-09 29015 31176 25688 28442 24982 28286 28193 31247 33179 26684 27336 29266 2009-10 29734 31408 29793 30375 27758 .. ..Country liquor (Kls) 2007-08 12742 14269 13685 14338 14466 15760 17259 16240 17257 16937 15879 17274 2008-09 22914 27166 26357 17973 16859 16994 18108 18635 22809 21505 19676 21287 2009-10 19172 20053 21292 19053 15082 .. ..Soft drink & soda (Mln. Bot.) 2007-08 155.9 177.9 144.4 120.4 120.9 119.7 115.1 102.4 100.3 95.1 106.4 141.1 2008-09 154.0 181.6 145.7 134.1 120.4 127.1 131.0 104.5 103.4 99.4 119.1 153.0 2009-10 170.1 182.1 173.7 132.5 140.5 .. ..Cigarettes (Mln.nos) 2007-08 7850.5 8487.4 6650.9 6757.1 6827.2 6858.1 7056.9 7587.5 7858.1 7392.5 7060.5 6577.1 2008-09 6966.8 7103.9 6850.9 7099.3 6675.3 7298.2 7067.3 8456.7 6626.0 7447.9 7046.0 8408.5 2009-10 8248.2 8051.3 4190.2 6994.3 7419.1 .. ..
Tea Board/Coffee Board - for IIP Data
flxjsV(nl yk[k dh la[;k)
pk; (*000 Vu)
dkQh (Vu)
Aaó½añegak utpaadnaH
Industrial Production: saarNai saöKyaa 6.3 p<y: p:d:T:ý t:mb::kÜ
Table No.6.3 - Beverages & Tobacco
pk; (*000 Vu)
ifj"d`r fLizV (*000 yhVj)
Source:- Department of Industrial Policy & Promotion/
ch;j (*000 yhVj)
Hkkjr esa fufeZr fons'kh 'kjkc (*000 yhVj)
ns'kh is; (*000 yhVj)
L=ksr :- vkS|ksfxd mRiknu lwpdakd ds vkWadM+s
veknd is; vkSj lksMk (nl yk[k cksrysa)
flxjsV(nl yk[k dh la[;k)
0
20
40
60
80
100
120
140
Apr 07 Nov 07 Jun 08 Jan 09 Aug 09
Production of Tea(000 tonnes)
350040004500500055006000650070007500800085009000
Apr 07 Nov 07 Jun 08 Jan 09 Aug 09
Production of Cigarettes(Million nos.)

Aaó½añegak utpaadnaH 29
Industrial Production: saarNai saöKyaa 6.4 saÜt:i v:s*:
Table No. 6.4 - Cotton Textiles
A)óla maI jaÜna jaÚlaaI Agasta esatambar AVtaÜbar navambar edsambar janavari Prvari maacaý
Apr May Jun Jul Aug Sep Oct Nov Dec Jan Feb MarCotton yarn (incl.SSI) ('000 tonnes) lwrh /kkxk (lfEefyr ,l ,l vkbZ) (*000 Vu)
2007-08 238.9 246.7 242.3 250.4 249.6 248.2 247.2 230.2 253.0 251.7 242.8 247.0 2008-09 243.4 257.6 254.2 249.9 242.6 235.0 225.6 234.8 250.3 238.9 225.0 242.4 2009-10 244.7 247.5 247.9 257.3 253.3 .. ..100% Non-cotton yarn ('000 tonnes) 100% xSj lwrh /kkxk (*000 Vu)
2007-08 30.9 30.9 31.1 31.9 34.2 32.9 30.9 28.1 32.4 31.6 30.4 32.9 2008-09 31.1 29.6 29.7 30.3 28.5 30.4 30.1 29.2 30.6 31.0 30.3 32.2 2009-10 33.6 32.6 32.2 33.7 32.1 .. ..Blended yarn ('000 tonnes) fefJr /kkxk (*000 Vu)
2007-08 50.5 54.0 55.5 58.0 59.7 57.3 60.3 54.8 57.8 57.8 55.0 55.8 2008-09 54.3 56.9 58.3 58.1 55.2 53.7 51.8 50.1 51.4 54.9 53.7 56.9 2009-10 54.2 54.7 58.4 59.4 54.7 .. ..Cotton cloth (excl.hosiery) (Mn.sq.mtrs) lwrh diM+k (gkstjh dks NksM+dj) (nl yk[k oxZ ehVj)
2007-08 1368.8 1398.1 1409.3 1535.3 1406.5 1465.7 1471.6 1360.4 1519.2 1482.6 1385.0 1420.3 2008-09 1395.5 1473.1 1410.0 1378.5 1342.0 1399.5 1304.6 1380.3 1292.1 1326.0 1370.9 1508.6 2009-10 1418.3 1443.6 1422.1 1487.0 1466.7 .. ..100% Non-cotton cloth (Mn.sq.mtrs) 100% xSj lwrh diM+k (nl yk[k oxZ ehVj)
2007-08 1533.0 1855.5 1705.8 1705.7 1864.3 1535.0 1561.6 1863.8 1685.6 1768.1 1767.6 2148.8 2008-09 1534.2 2133.3 1918.5 1346.4 1553.7 1598.1 1642.1 1775.5 1959.3 1824.1 1907.0 1986.6 2009-10 2084.8 1790.1 1997.5 2098.9 1913.3 .. ..Blended cloth (Mn.sq.mtrs) fefJr diM+k (nl yk[k oxZ ehVj)
2007-08 517.3 577.7 590.8 587.2 574.4 567.5 578.5 552.8 573.1 576.9 571.6 612.5 2008-09 590.8 659.6 576.3 608.9 568.2 591.2 549.0 572.4 587.1 550.7 642.4 643.8 2009-10 656.5 607.0 655.9 658.2 587.4 .. ..Cotton hosiery cloth (Mn.sq.mtrs) lwrh gkst+jh diM+k (nl yk[k oxZ ehVj)
2007-08 864.5 833.2 767.1 848.9 820.6 810.1 837.9 762.1 853.2 853.2 817.9 853.2 2008-09 871.1 905.9 843.2 907.7 798.9 872.7 796.5 904.3 845.5 844.4 904.7 996.1 2009-10 977.4 940.8 918.5 969.9 930.0 .. ..
Source:- Office of Textile Commissioner - for IIP Data L=ksr :- vkS|ksfxd mRiknu lwpdakd ds vkWadM+s
lwrh /kkxk (lfEefyr ,l ,l vkbZ) (*000 Vu) lwrh diM+k (gkstjh dks NksM+dj) (nl yk[k oxZ ehVj)
220
230
240
250
260
270
280
Apr 07 Nov 07 Jun 08 Jan09 Aug 09
Production of cotton yarn (incl.SSI)(000 tonnes)
1200
1300
1400
1500
1600
1700
1800
Apr 07 Nov 07 Jun 08 Jan09 Aug 09
Production of Cotton cloth (excl. hosiery) (Million sq. metres)
30
A)la maI jaÜna jaÚlaaI AgastaesatambarAVtaÜbar navambaredsambar janavari Prvari maaca
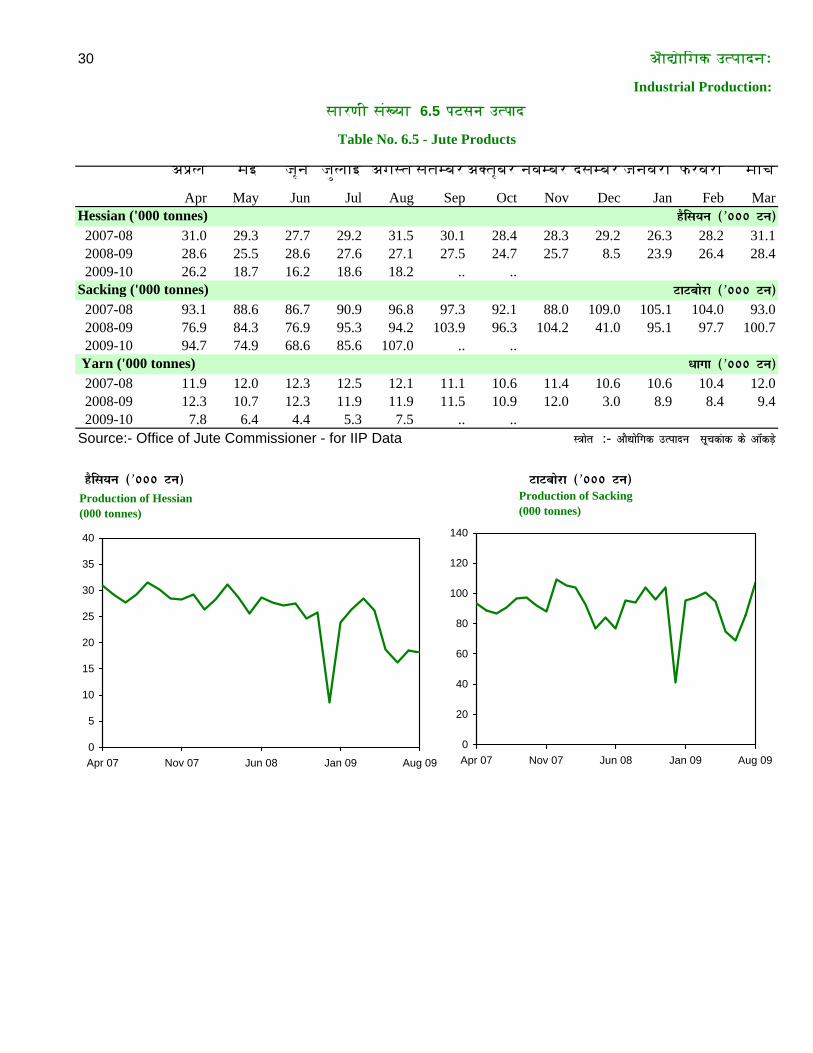
Apr May Jun Jul Aug Sep Oct Nov Dec Jan Feb MarHessian ('000 tonnes) 2007-08 31.0 29.3 27.7 29.2 31.5 30.1 28.4 28.3 29.2 26.3 28.2 31.1 2008-09 28.6 25.5 28.6 27.6 27.1 27.5 24.7 25.7 8.5 23.9 26.4 28.4 2009-10 26.2 18.7 16.2 18.6 18.2 .. ..Sacking ('000 tonnes) 2007-08 93.1 88.6 86.7 90.9 96.8 97.3 92.1 88.0 109.0 105.1 104.0 93.0 2008-09 76.9 84.3 76.9 95.3 94.2 103.9 96.3 104.2 41.0 95.1 97.7 100.7 2009-10 94.7 74.9 68.6 85.6 107.0 .. .. Yarn ('000 tonnes) 2007-08 11.9 12.0 12.3 12.5 12.1 11.1 10.6 11.4 10.6 10.6 10.4 12.0 2008-09 12.3 10.7 12.3 11.9 11.9 11.5 10.9 12.0 3.0 8.9 8.4 9.4 2009-10 7.8 6.4 4.4 5.3 7.5 .. ..Source:- Office of Jute Commissioner - for IIP Data
gSfl;u (*000 Vu) VkVcksjk (*000 Vu)
L=ksr :- vkS|ksfxd mRiknu lwpdakd ds vkWadM+s
gSfl;u (*000 Vu)
VkVcksjk (*000 Vu)
/kkxk (*000 Vu)
Aaó½añegak utpaadnaH
Industrial Production:
Table No. 6.5 - Jute Products
saarNai saöKyaa 6.5 p:Xs:n: utp::d
0
5
10
15
20
25
30
35
40
Apr 07 Nov 07 Jun 08 Jan 09 Aug 09
Production of Hessian(000 tonnes)
0
20
40
60
80
100
120
140
Apr 07 Nov 07 Jun 08 Jan 09 Aug 09
Production of Sacking(000 tonnes)

31
A)óla maI jaÜna jaÚlaaI Agasta esatambar AVtaÜbar navambar edsambar janavari Prvari maacaý
Apr May Jun Jul Aug Sep Oct Nov Dec Jan Feb MarPlywood commercial ('000 Sq. metres)
2007-08 445.8 473.9 529.0 503.5 447.5 443.0 488.1 481.3 491.9 461.3 481.4 495.5 2008-09 680.3 723.2 765.6 746.9 1267.8 1332.4 977.2 1032.3 1062.5 953.2 916.3 1247.42009-10 1288.6 1163.5 3578.4 1372.2 1391.2 .. ..
Paper & paper board (Tonnes)2007-08 512381 528254 520898 533445 531548 517076 514678 504745 531853 534319 518513 540948 2008-09 516930 529638 534905 558465 545508 538640 544751 531559 544506 547426 554677 5958342009-10 568028 588964 576227 590375 596082 .. ..
Particle board (Sq. metres) 2007-08 598137 598137 535523 564898 555168 532037 547163 449172 534658 503398 509792 610422 2008-09 435024 396472 516029 501208 494686 474438 459518 433442 401173 401522 403138 4623752009-10 557036 445907 527553 480146 526277 .. ..
Rayon grade pulp (Tonnes) 2007-08 15640 16695 15621 16274 17132 16940 17894 17064 17449 17925 14548 18012 2008-09 17055 17011 16994 16515 17275 17620 17030 11678 9698 9613 6865 96742009-10 9257 9385 15482 17272 17039 .. ..
Newsprint bleached (Tonnes) 2007-08 83061 88359 77222 82122 84986 85997 81654 87175 88517 95387 90037 94093 2008-09 88168 96546 92788 98479 97675 94254 99559 97239 95133 84533 77915 818892009-10 65939 77695 79756 85739 91867 .. ..
Corrugated boxes/cartons (Tonnes) 2007-08 1827 1763 1931 1865 1988 1892 2155 2065 2174 2058 1710 1972 2008-09 1794 1837 1518 1888 1931 2308 1999 1851 1994 1808 1560 22182009-10 1805 1995 2212 2018 1862 .. ..
IykbZoqM def'kZ;y (*000 oxZ ehVj) isij vkSj isij cksMZ (Vu)
IykbZoqM def'kZ;y (*000 oxZ ehVj)
isij vkSj isij cksMZ (Vu)
ikfVZdy cksMZ (oxZ ehVj)
L=ksr :- vkS|ksfxd mRiknu lwpdakd ds vkWadM+s
dksjxsfVM ckDl@dkVZUl (Vu)
js;u xzsM yqXnh (Vu)
U;wt fizUV CyhPM (Vu)
Source:- Department of Industrial Policy & Promotion - for IIP Data
Aaó½añegak utpaadnaH
Industrial Production:
saarNai saöKyaa 6.6 ydMhÛ t:T:: k:g:j: utp::d
Table No. 6.6 - Wood and Paper Products
400
800
1200
1600
2000
2400
2800
3200
3600
4000
Apr 07 Nov 07 Jun 08 Jan 09 Aug 09
Production of Plywood commercial(000 Sq. metres)
460000
480000
500000
520000
540000
560000
580000
600000
Apr 07 Nov 07 Jun 08 Jan 09 Aug 09
Production of Paper & PaperBoard(Tonnes)
32
A)óla maI jaÜna jaÚlaaI Agasta esatambar AVtaÜbar navambar edsambar janavari Prvari maacaý
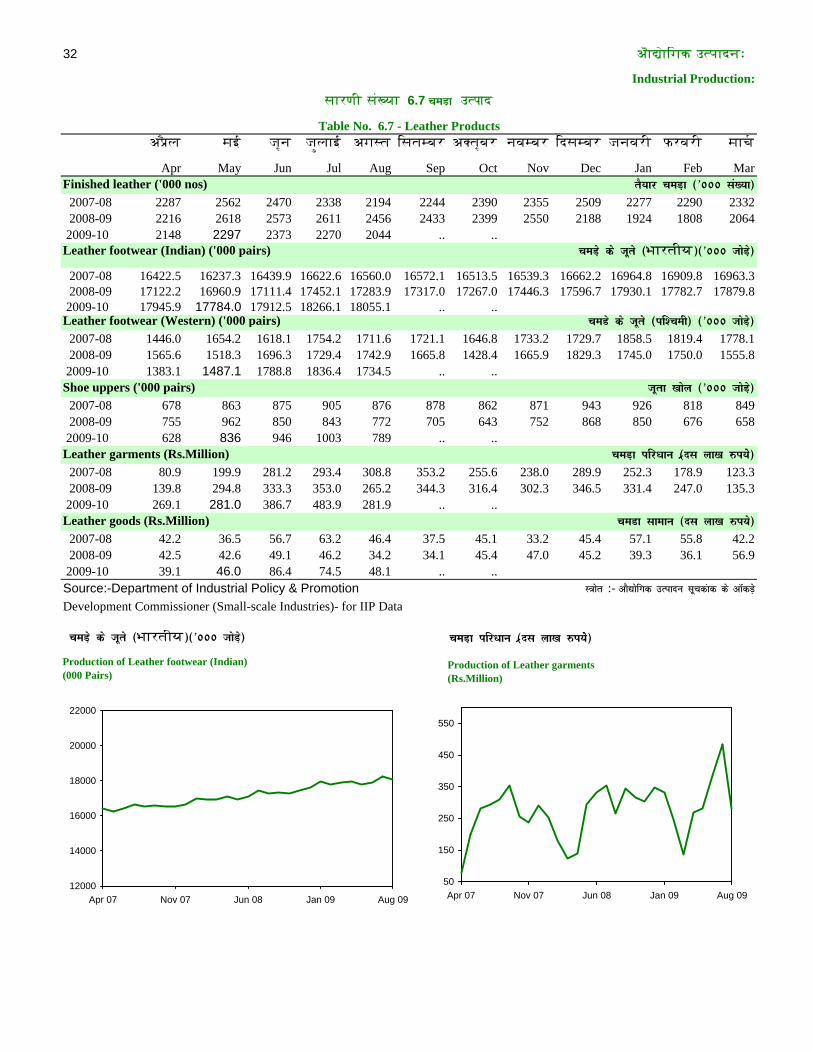
Apr May Jun Jul Aug Sep Oct Nov Dec Jan Feb MarFinished leather ('000 nos) 2007-08 2287 2562 2470 2338 2194 2244 2390 2355 2509 2277 2290 2332 2008-09 2216 2618 2573 2611 2456 2433 2399 2550 2188 1924 1808 2064 2009-10 2148 2297 2373 2270 2044 .. ..Leather footwear (Indian) ('000 pairs)
2007-08 16422.5 16237.3 16439.9 16622.6 16560.0 16572.1 16513.5 16539.3 16662.2 16964.8 16909.8 16963.3 2008-09 17122.2 16960.9 17111.4 17452.1 17283.9 17317.0 17267.0 17446.3 17596.7 17930.1 17782.7 17879.8 2009-10 17945.9 17784.0 17912.5 18266.1 18055.1 .. ..Leather footwear (Western) ('000 pairs) 2007-08 1446.0 1654.2 1618.1 1754.2 1711.6 1721.1 1646.8 1733.2 1729.7 1858.5 1819.4 1778.1 2008-09 1565.6 1518.3 1696.3 1729.4 1742.9 1665.8 1428.4 1665.9 1829.3 1745.0 1750.0 1555.8 2009-10 1383.1 1487.1 1788.8 1836.4 1734.5 .. ..Shoe uppers ('000 pairs) 2007-08 678 863 875 905 876 878 862 871 943 926 818 849 2008-09 755 962 850 843 772 705 643 752 868 850 676 658 2009-10 628 836 946 1003 789 .. ..Leather garments (Rs.Million) 2007-08 80.9 199.9 281.2 293.4 308.8 353.2 255.6 238.0 289.9 252.3 178.9 123.3 2008-09 139.8 294.8 333.3 353.0 265.2 344.3 316.4 302.3 346.5 331.4 247.0 135.3 2009-10 269.1 281.0 386.7 483.9 281.9 .. ..Leather goods (Rs.Million) 2007-08 42.2 36.5 56.7 63.2 46.4 37.5 45.1 33.2 45.4 57.1 55.8 42.2 2008-09 42.5 42.6 49.1 46.2 34.2 34.1 45.4 47.0 45.2 39.3 36.1 56.9 2009-10 39.1 46.0 86.4 74.5 48.1 .. ..Source:-Department of Industrial Policy & PromotionDevelopment Commissioner (Small-scale Industries)- for IIP Data
peM+s ds twrs (Baartaiya)(*000 tksM+s) peM+k ifj/kku (znl yk[k #i;ss)
peMk lkeku (nl yk[k #i;s)
L=ksr :- vkS|ksfxd mRiknu lwpdakd ds vkWadM+s
rS;kj peM+k (*000 la[;k)
peM+s ds twrs (Baartaiya)(*000 tksM+s)
peMs ds twrs (if'peh) (*000 tksMs+)
twrk [kksy (*000 tksMs+)
peM+k ifj/kku (znl yk[k #i;ss)
Aaó½añegak utpaadnaH
Industrial Production:
saarNai saöKyaa 6.7 peMkÛ utp::d
Table No. 6.7 - Leather Products
12000
14000
16000
18000
20000
22000
Apr 07 Nov 07 Jun 08 Jan 09 Aug 09
Production of Leather footwear (Indian)(000 Pairs)
50
150
250
350
450
550
Apr 07 Nov 07 Jun 08 Jan 09 Aug 09
Production of Leather garments(Rs.Million)

33
A)óla maI jaÜna jaÚlaaI Agasta esatambar AVtaÜbar navambar edsambar janavari Prvari maacaý
Apr May Jun Jul Aug Sep Oct Nov Dec Jan Feb MarCaustic soda ('000 tonnes) 2007-08 160.1 171.1 168.6 169.9 170.4 177.8 169.7 163.4 172.6 181.5 173.7 179.2 2008-09 171.4 170.2 176.3 178.9 178.9 175.9 175.5 155.8 155.9 158.3 160.2 176.8 2009-10 165.7 171.0 171.1 177.4 175.9 .. ..Sulphuric acid (Tonnes) 2007-08 538255 543370 577299 590864 561867 562923 558364 560617 548823 540352 502200 484381 2008-09 474436 513518 544029 572680 549594 550391 549543 524738 579232 545984 497903 492768 2009-10 469635 452063 477322 514088 503337 .. ..Chlorine ('000 tonnes) 2007-08 110.99 116.88 114.25 114.98 116.56 117.38 118.11 110.91 114.27 121.40 116.29 119.72 2008-09 117.00 115.88 119.68 122.54 122.79 120.25 121.45 106.27 107.25 108.20 109.43 115.98 2009-10 114.29 118.52 117.20 122.24 122.03 .. ..Oxygen ('000 cu.mtrs) 2007-08 41114 40908 40713 40772 40936 40707 41098 40874 42428 41078 42346 43022 2008-09 42884 42768 42672 42889 42725 42757 42380 42001 40982 40720 40765 41490 2009-10 41539 41803 42217 42542 42250 .. ..Calcium carbide (Tonnes) 2007-08 6840 8498 8473 8699 8072 7903 8663 8269 6292 8809 8086 8810 2008-09 8364 8732 8742 7563 7389 6723 5988 3616 2329 2899 2747 2734 2009-10 1669 1291 2998 1684 1733 .. ..Soda ash ('000 tonnes) 2007-08 175.1 183.4 167.2 151.5 123.2 133.7 166.3 165.9 178.6 179.9 175.7 180.5 2008-09 178.1 175.1 133.3 168.1 165.5 151.9 156.7 188.2 183.7 169.0 154.8 173.9 2009-10 176.4 185.6 154.1 150.0 158.8 .. ..Titanium dioxide (Tonnes) 2007-08 5741 5163 5184 4651 5024 4651 4890 5023 5027 5761 5764 5458 2008-09 5520 5180 3963 4900 5851 5225 4316 4118 3688 3849 4167 5622 2009-10 5557 6007 4435 5339 5371 .. ..Source:- Department of Industrial Policy & Promotion - for IIP data dkfLVd lksM+k (*000 Vu) lY¶;wfjd vEy ( Vu)
L=ksr :- vkS|ksfxd mRiknu lwpdakd ds vkWadM+s
fVVsfu;e MkbZvksDlkbZM (Vu)
dkfLVd lksM+k (*000 Vu)
lY¶;wfjd vEy ( Vu)
Dyksjhu (*000 Vu)
vkDlhtu (*000 ?ku ehVj)
dSfYl;e dkckZbZM ( Vu)
lksM+k ,'k (*000 Vu)
Aaó½añegak utpaadnaH
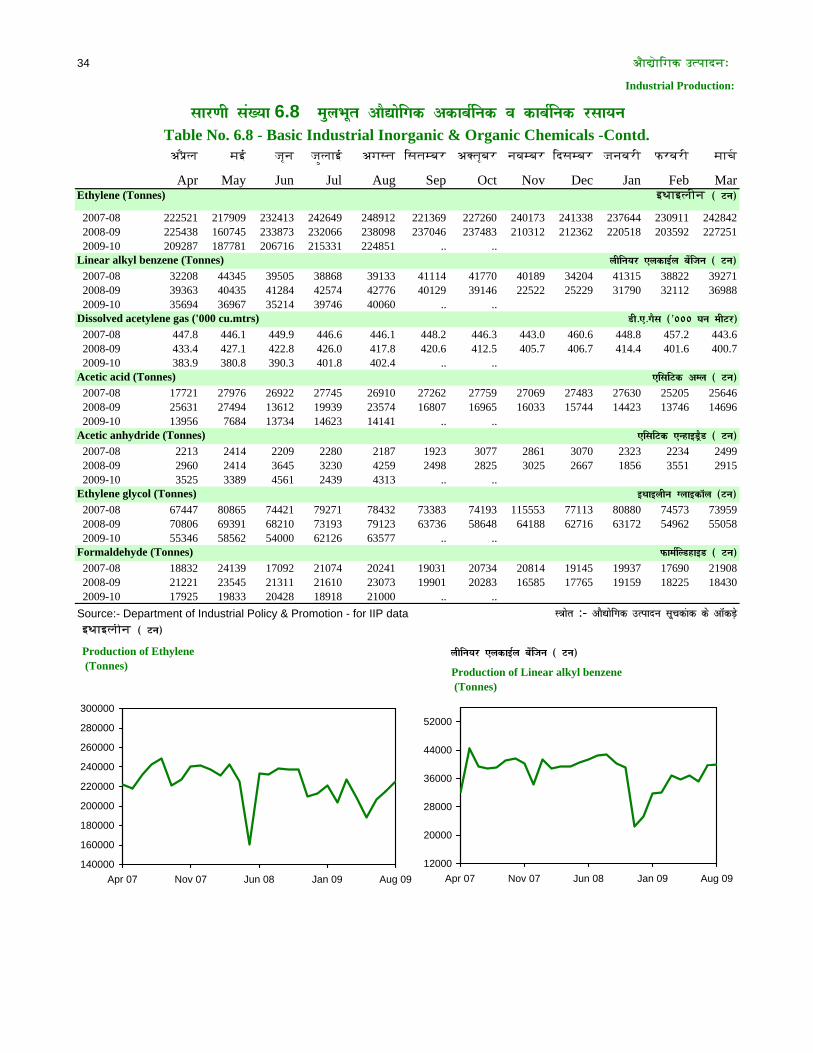
lkj.kh la[;k 6.8 eqyHkwr vkS|ksfxd vdkcZfud o dkcZfud jlk;u Table No. 6.8 - Basic Industrial Inorganic&Organic Chemicals
Industrial Production:
120
140
160
180
200
220
240
Apr 07 Nov 07 Jun 08 Jan 09 Aug 09
Production of Caustic soda (000 tonnes)
400000
450000
500000
550000
600000
650000
Apr 07 Nov 07 Jun 08 Jan 09 Aug 09
Production of Sulphuric acid (Tonnes)
34
A)óla maI jaÜna jaÚlaaI Agasta esatambar AVtaÜbar navambar edsambar janavari Prvari maacaý
Apr May Jun Jul Aug Sep Oct Nov Dec Jan Feb MarEthylene (Tonnes)
2007-08 222521 217909 232413 242649 248912 221369 227260 240173 241338 237644 230911 242842 2008-09 225438 160745 233873 232066 238098 237046 237483 210312 212362 220518 203592 227251 2009-10 209287 187781 206716 215331 224851 .. ..Linear alkyl benzene (Tonnes) 2007-08 32208 44345 39505 38868 39133 41114 41770 40189 34204 41315 38822 39271 2008-09 39363 40435 41284 42574 42776 40129 39146 22522 25229 31790 32112 36988 2009-10 35694 36967 35214 39746 40060 .. ..Dissolved acetylene gas ('000 cu.mtrs) 2007-08 447.8 446.1 449.9 446.6 446.1 448.2 446.3 443.0 460.6 448.8 457.2 443.6 2008-09 433.4 427.1 422.8 426.0 417.8 420.6 412.5 405.7 406.7 414.4 401.6 400.7 2009-10 383.9 380.8 390.3 401.8 402.4 .. ..Acetic acid (Tonnes) 2007-08 17721 27976 26922 27745 26910 27262 27759 27069 27483 27630 25205 25646 2008-09 25631 27494 13612 19939 23574 16807 16965 16033 15744 14423 13746 14696 2009-10 13956 7684 13734 14623 14141 .. ..Acetic anhydride (Tonnes) 2007-08 2213 2414 2209 2280 2187 1923 3077 2861 3070 2323 2234 2499 2008-09 2960 2414 3645 3230 4259 2498 2825 3025 2667 1856 3551 2915 2009-10 3525 3389 4561 2439 4313 .. ..Ethylene glycol (Tonnes) 2007-08 67447 80865 74421 79271 78432 73383 74193 115553 77113 80880 74573 73959 2008-09 70806 69391 68210 73193 79123 63736 58648 64188 62716 63172 54962 55058 2009-10 55346 58562 54000 62126 63577 .. ..Formaldehyde (Tonnes) 2007-08 18832 24139 17092 21074 20241 19031 20734 20814 19145 19937 17690 21908 2008-09 21221 23545 21311 21610 23073 19901 20283 16585 17765 19159 18225 18430 2009-10 17925 19833 20428 18918 21000 .. ..Source:- Department of Industrial Policy & Promotion - for IIP data ETaaElaina ( Vu)
yhfu;j ,ydkbZy csaftu ( Vu)
L=ksr :- vkS|ksfxd mRiknu lwpdakd ds vkWadM+s
bFkkbyhu XykbdkWy (Vu)
QkeZfYMgkbM ( Vu)
ETaaElaina ( Vu)
yhfu;j ,ydkbZy csaftu ( Vu)
Mh-,-xSl (*000 ?ku ehVj)
Aaó½añegak utpaadnaH
Industrial Production:
,flfVd vEy ( Vu)
,flfVd ,UgkbMªSM ( Vu)
lkj.kh la[;k 6.8 eqyHkwr vkS|ksfxd vdkcZfud o dkcZfud jlk;uTable No. 6.8 - Basic Industrial Inorganic & Organic Chemicals -Contd.
140000
160000
180000
200000
220000
240000
260000
280000
300000
Apr 07 Nov 07 Jun 08 Jan 09 Aug 09
Production of Ethylene (Tonnes)
12000
20000
28000
36000
44000
52000
Apr 07 Nov 07 Jun 08 Jan 09 Aug 09
Production of Linear alkyl benzene (Tonnes)

35
A)óla maI jaÜna jaÚlaaI Agasta esatambar AVtaÜbar navambar edsambar janavari Prvari maacaý
Apr May Jun Jul Aug Sep Oct Nov Dec Jan Feb MarMethanol (Tonnes) 2007-08 25433 27505 34436 28543 26553 30863 30401 33822 32086 33629 32015 25459 2008-09 25451 26737 15101 19710 28314 28500 25542 18261 17895 15648 15592 14664 2009-10 17309 16884 24280 29311 29360 .. ..Di-methyl terephthalate (Tonnes) 2007-08 1695 1700 574 - - - - - - - - - 2008-09 - - - - - - - - - - - - 2009-10 - - - - - - -Phenol (Tonnes) 2007-08 3410 4357 6600 5840 6721 6755 7479 7408 6726 6174 6922 6545 2008-09 6251 4357 6744 7104 6561 6779 6594 3453 5692 6332 6338 7302 2009-10 2622 4492 6433 4730 6192 .. ..Phthalic anhydride (Tonnes) 2007-08 20351 21856 19512 20906 22042 19971 22224 18606 22627 22001 18098 15943 2008-09 18298 18045 19088 21502 14194 19843 13804 9430 14324 18172 19889 19997 2009-10 18008 18276 20255 22435 22797 .. ..Fatty acids (Tonnes) 2007-08 22426 26545 20682 22951 20322 22391 14540 22997 26307 20598 20674 21047 2008-09 25961 24664 22451 23683 28346 23134 19964 24310 24923 18241 24768 21200 2009-10 19759 19707 21451 21419 18267 .. ..Glycerine (Tonnes) 2007-08 3290 2917 2899 2848 2695 2687 3029 2649 2847 2820 2299 2788 2008-09 2873 3195 2645 2950 2742 2625 2366 2436 2588 2219 2155 2770 2009-10 2480 2727 3249 3310 3411 .. ..Caprolactum (Tonnes) 2007-08 8641 4296 10409 6783 7082 6952 7180 6990 7211 7222 6757 6952 2008-09 8917 7678 8203 7112 6302 6553 6789 4189 3495 6660 7470 11093 2009-10 8389 8255 10499 10861 9893 .. ..Source:- Department of Industrial Policy & Promotion - for IIP data feFkukWy ( Vu) olk vEy ( Vu)
Xyhljhu ( Vu)
dsizksysDVe ( Vu)
L=ksr :- vkS|ksfxd mRiknu lwpdakd ds vkWadM+s
QFksfyd ,UgkbMªkbM ( Vu)
olk vEy ( Vu)
Aaó½añegak utpaadnaH
feFkukWy ( Vu)
Mh- ,e- Vh- ( Vu)
fQukWy ( Vu)
Industrial Production:
lkj.kh la[;k 6.8 eqyHkwr vkS|ksfxd vdkcZfud o dkcZfud jlk;u Table No. 6.8 - Basic Industrial Inorganic & Organic Chemicals-Concld.
10000
15000
20000
25000
30000
35000
40000
Apr 07 Nov 07 Jun 08 Jan 09 Aug 09
Production of Methanol (Tonnes)
10000
15000
20000
25000
30000
35000
40000
Apr 07 Nov 07 Jun 08 Jan 09 Aug 09
Production of Fatty Acids (Tonnes)

36
A)óla maI jaÜna jaÚlaaI Agasta esatambar AVtaÜbar navambar edsambar janavari Prvari maacaý
Apr May Jun Jul Aug Sep Oct Nov Dec Jan Feb MarNitrogenous fertilizers ('000 tonnes) 2007-08 681 844 927 974 962 938 1005 980 994 938 902 757 2008-09 782 882 850 953 987 968 962 946 984 858 835 863 2009-10 742 927 988 1049 1071 .. ..Phosphatic fertilizers ('000 tonnes) 2007-08 342 319 309 376 301 330 342 342 386 317 299 175 2008-09 182 355 311 313 324 302 331 432 289 233 160 232 2009-10 305 382 429 386 381 .. ..Endosulphan technical (Tonnes ) 2007-08 381 547 703 655 666 489 557 601 602 949 706 1097 2008-09 902 1328 1425 1816 1696 1216 1052 948 762 943 1214 1127 2009-10 1647 1782 1556 1228 1055 .. ..Monocrotophos (Tonnes) 2007-08 226 665 725 645 620 689 287 304 242 157 266 523 2008-09 451 612 264 538 524 878 564 275 198 118 352 291 2009-10 578 967 945 1019 933 .. ..Source:- Department of Industrial Policy & Promotion - for IIP data
QkWLQsfVd moZjd (*000 Vu)
ukbVªkstuhd`r moZd (*000 Vu)
b.MkslYQkuVDuhdy(Vu) eksuksØksVksQksl ( Vu)
L=ksr :- vkS|ksfxd mRiknu lwpdakd ds vkWadM+s
eksuksØksVksQksl ( Vu)
Aaó½añegak utpaadnaH
Industrial Production:
ukbVªkstuhd`r moZd (*000 Vu)
QkWLQsfVd moZjd (*000 Vu)
saarNai saöKyaa 6.9 K::d t:T:: kiXn::S:k
Table No.6.9 - Fertilisers & Pesticides
b.MkslYQkuVDuhdy(Vu)
600
700
800
900
1000
1100
1200
Apr 07 Nov 07 Jun 08 Jan 09 Aug 09
Production of Nitrogenous fertilizers (000 tonnes)
150
250
350
450
550
Apr 07 Nov 07 Jun 08 Jan 09 Aug 09
Production of Phosphatic fertilizers (000 tonnes)
150
350
550
750
950
1150
1350
1550
1750
1950
Apr 07 Nov 07 Jun 08 Jan 09 Aug 09
Production of Endosulphan technical (Tonnes)
0
200
400
600
800
1000
1200
Apr 07 Nov 07 Jun 08 Jan 09 Aug 09
Production of Monocrotophos (Tonnes)

37
A)óla maI jaÜna jaÚlaaI Agasta esatambar AVtaÜbar navambar edsambar janavari Prvari maacaý
Apr May Jun Jul Aug Sep Oct Nov Dec Jan Feb MarH.D.P.E (Tonnes) 2007-08 81320 80130 78984 82963 85649 80804 73601 80578 84073 77594 75728 86870 2008-09 73612 84601 76122 88803 85120 81354 84091 73733 70282 74825 74700 72899 2009-10 75108 65474 62256 67910 79611 .. ..PVC pipes & tubes (Tonnes) 2007-08 3390 4150 4139 3722 4415 3600 2425 3936 4480 3819 3960 4295 2008-09 3306 2563 3450 2779 2822 2974 3006 3749 4116 4372 4531 5326 2009-10 4680 5304 4815 4833 5036 .. ..P.F. moulding powder (Tonnes) 2007-08 239 216 215 196 233 267 205 185 230 207 202 210 2008-09 237 225 264 244 227 229 166 135 154 182 206 246 2009-10 219 223 249 247 257 .. ..Metallised bopp films (Tonnes) 2007-08 6395 7449 7852 8227 8891 8163 7994 7972 8498 8067 8406 8432 2008-09 6837 6989 9343 8147 8186 7494 7559 7751 8329 7451 7642 8753 2009-10 7821 7859 8423 8467 8078 .. ..L.D.P.E (Tonnes) 2007-08 16602 17558 16119 15824 17433 16589 15463 15946 17497 17589 15428 16091 2008-09 15248 17384 14958 16462 17093 16795 15811 14924 13940 17331 14076 17192 2009-10 14616 16561 15356 16782 16574 .. ..Laminates (decorative) (Tonnes) 2007-08 2592 2737 2693 2765 2704 2692 2682 2584 2903 2707 2739 2940 2008-09 2639 2670 2809 2857 2751 2749 2712 2680 2628 2261 2383 2850 2009-10 2290 2730 2867 3038 3074 .. ..Source:- Department of Industrial Policy & Promotion - for IIP data
ih- oh- lh- ikbZi vkSj V~;wc ( Vu)
,p- Mh- ih- bZ- ( Vu)
L=ksr :- vkS|ksfxd mRiknu lwpdakd ds vkWadM+s
ih- ,Q- eksfYMax ikmMj ( Vu)
esVykbLM cASi fQYe ( Vu)
,y- Mh- ih- bZ- ( Vu)
ysfeusV~l (MsdksjsfVo) ( Vu)
Aaó½añegak utpaadnaH
Industrial Production:
,p- Mh- ih- bZ- ( Vu)
ih- oh- lh- ikbZi vkSj V~;wc ( Vu)
saarNai saöKyaa 6.10 pl::esXk t:T:: p::el:m:r
Table No.6.10 - Plastics and Polymers
60000
70000
80000
90000
100000
110000
120000
Apr 07 Nov 07 Jun 08 Jan 09 Aug 09
Production of H.D.P.E. (Tonne)
1000
1500
2000
2500
3000
3500
4000
4500
5000
5500
Apr 07 Nov 07 Jun 08 Jan 09 Aug 09
Production of P.V.C.pipes & tubes (Tonnes)
38
Industrial Production
A)óla maI jaÜna jaÚlaaI Agasta esatambar AVtaÜbar navambar edsambar janavari Prvari maacaý
Apr May Jun Jul Aug Sep Oct Nov Dec Jan Feb Mar
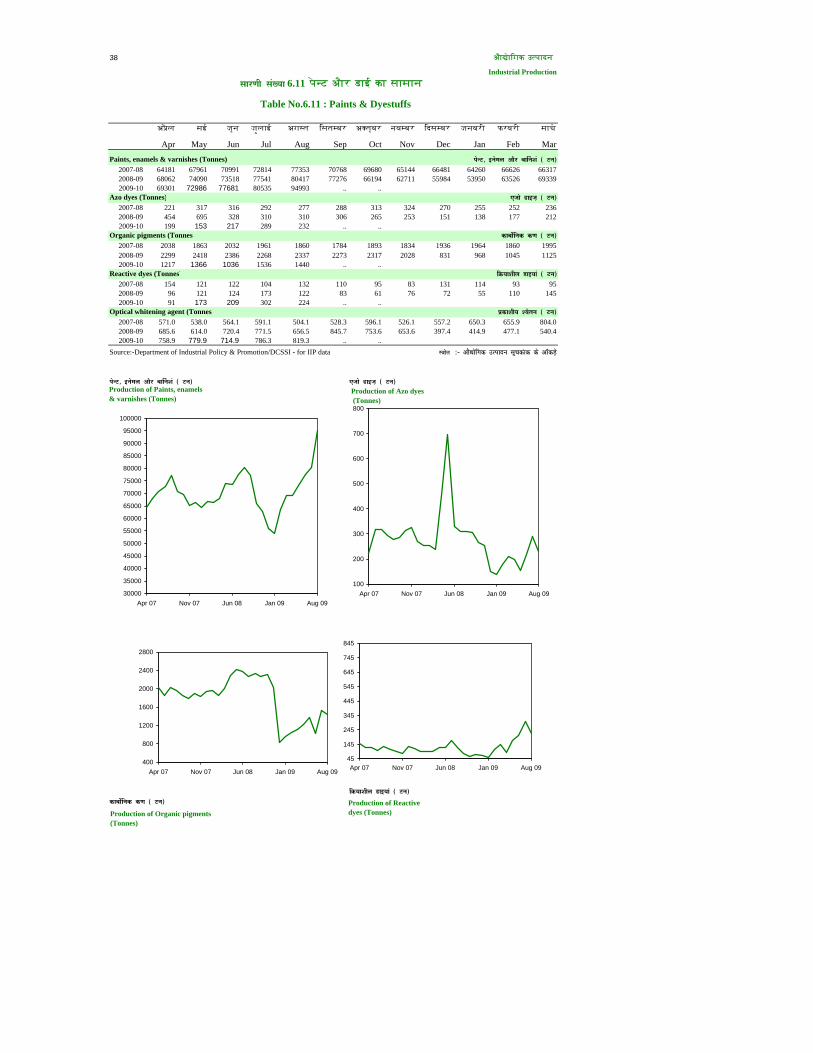
Paints, enamels & varnishes (Tonnes) 2007-08 64181 67961 70991 72814 77353 70768 69680 65144 66481 64260 66626 66317 2008-09 68062 74090 73518 77541 80417 77276 66194 62711 55984 53950 63526 69339
2009-10 69301 72986 77681 80535 94993 .. ..Azo dyes (Tonnes) 2007-08 221 317 316 292 277 288 313 324 270 255 252 236 2008-09 454 695 328 310 310 306 265 253 151 138 177 212
2009-10 199 153 217 289 232 .. ..Organic pigments (Tonnes) 2007-08 2038 1863 2032 1961 1860 1784 1893 1834 1936 1964 1860 1995 2008-09 2299 2418 2386 2268 2337 2273 2317 2028 831 968 1045 1125
2009-10 1217 1366 1036 1536 1440 .. ..Reactive dyes (Tonnes) 2007-08 154 121 122 104 132 110 95 83 131 114 93 95 2008-09 96 121 124 173 122 83 61 76 72 55 110 145
2009-10 91 173 209 302 224 .. ..Optical whitening agent (Tonnes 2007-08 571.0 538.0 564.1 591.1 504.1 528.3 596.1 526.1 557.2 650.3 655.9 804.0 2008-09 685.6 614.0 720.4 771.5 656.5 845.7 753.6 653.6 397.4 414.9 477.1 540.4
2009-10 758.9 779.9 714.9 786.3 819.3 .. ..Source:-Department of Industrial Policy & Promotion/DCSSI - for IIP data
isUV] busey vkSj ok£u'ka ( Vu) ,tks Mkbt+ ( Vu)
fØ;k'khy Mkb;ka ( Vu)
dkcksZfud d.k ( Vu)
L=ksr :- vkS|ksfxd mRiknu lwpdakd ds vkWadM+s
Aaó½añegak utpaadna
izdk'kh; 'osru ( Vu)
isUV] busey vkSj ok£u'ka ( Vu)
,tks Mkbt+ ( Vu)
lkj.kh la[;k 6.11 pañnX Aaór RaI ka saamaana
Table No.6.11 : Paints & Dyestuffs
dkcksZfud d.k ( Vu)
fØ;k'khy Mkb;ka ( Vu)
30000
35000
40000
45000
50000
55000
60000
65000
70000
75000
80000
85000
90000
95000
100000
Apr 07 Nov 07 Jun 08 Jan 09 Aug 09
Production of Paints, enamels& varnishes (Tonnes)
100
200
300
400
500
600
700
800
Apr 07 Nov 07 Jun 08 Jan 09 Aug 09
Production of Azo dyes (Tonnes)
400
800
1200
1600
2000
2400
2800
Apr 07 Nov 07 Jun 08 Jan 09 Aug 09
Production of Organic pigments(Tonnes)
45
145
245
345
445
545
645
745
845
Apr 07 Nov 07 Jun 08 Jan 09 Aug 09
Production of Reactive dyes (Tonnes)
39
Industrial Production
A)óla maI jaÜna jaÚlaaI Agasta esatambar AVtaÜbar navambar edsambar janavari Prvari maacaý
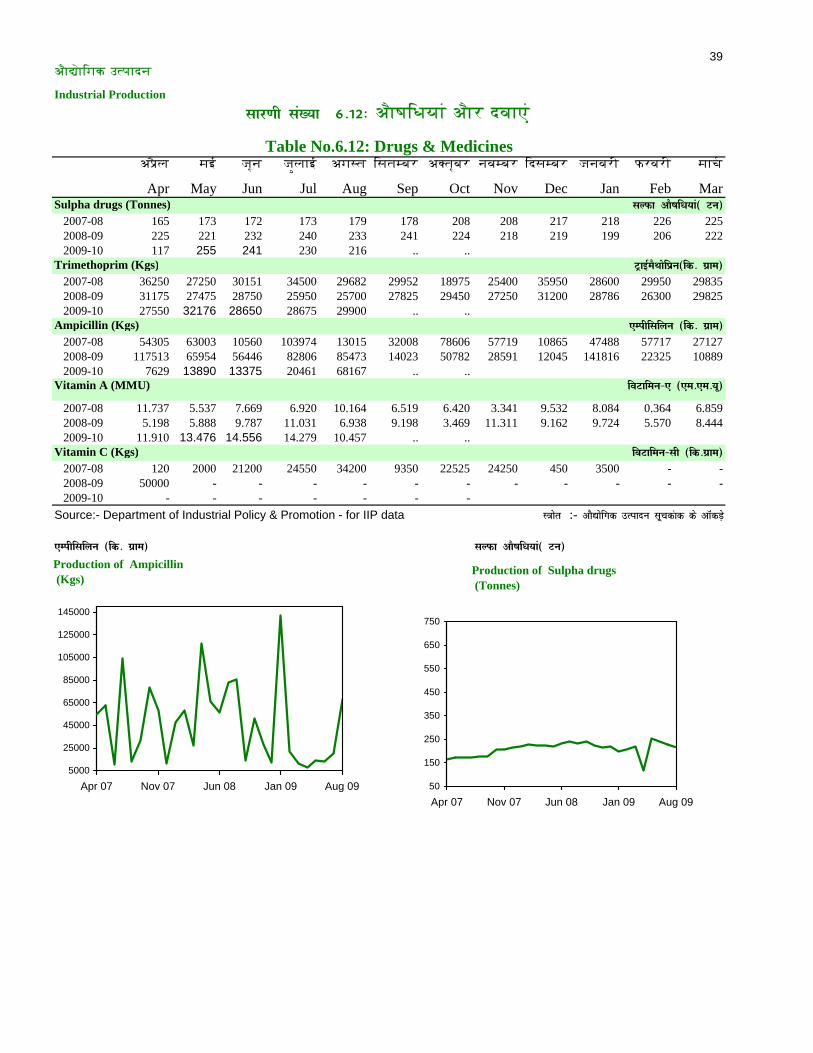
Apr May Jun Jul Aug Sep Oct Nov Dec Jan Feb MarSulpha drugs (Tonnes) 2007-08 165 173 172 173 179 178 208 208 217 218 226 225 2008-09 225 221 232 240 233 241 224 218 219 199 206 222 2009-10 117 255 241 230 216 .. ..Trimethoprim (Kgs) 2007-08 36250 27250 30151 34500 29682 29952 18975 25400 35950 28600 29950 29835 2008-09 31175 27475 28750 25950 25700 27825 29450 27250 31200 28786 26300 29825 2009-10 27550 32176 28650 28675 29900 .. ..Ampicillin (Kgs) 2007-08 54305 63003 10560 103974 13015 32008 78606 57719 10865 47488 57717 27127 2008-09 117513 65954 56446 82806 85473 14023 50782 28591 12045 141816 22325 10889 2009-10 7629 13890 13375 20461 68167 .. ..Vitamin A (MMU)
2007-08 11.737 5.537 7.669 6.920 10.164 6.519 6.420 3.341 9.532 8.084 0.364 6.859 2008-09 5.198 5.888 9.787 11.031 6.938 9.198 3.469 11.311 9.162 9.724 5.570 8.444 2009-10 11.910 13.476 14.556 14.279 10.457 .. ..Vitamin C (Kgs) 2007-08 120 2000 21200 24550 34200 9350 22525 24250 450 3500 - - 2008-09 50000 - - - - - - - - - - - 2009-10 - - - - - - -Source:- Department of Industrial Policy & Promotion - for IIP data ,Eihflfyu (fd- xzke) lYQk vkS"kf/k;ka( Vu)
L=ksr :- vkS|ksfxd mRiknu lwpdakd ds vkWadM+s
VªkbZeSFkksfizu(fd- xzke)
,Eihflfyu (fd- xzke)
foVkfeu&, (,e-,e-;w)
foVkfeu&lh (fd-xzke)
Aaó½añegak utpaadna
lYQk vkS"kf/k;ka( Vu)
lkj.kh la[;k 6-12% Aaó\aeDayaaö Aaór dvaaOö
Table No.6.12: Drugs & Medicines
50
150
250
350
450
550
650
750
Apr 07 Nov 07 Jun 08 Jan 09 Aug 09
Production of Sulpha drugs (Tonnes)
5000
25000
45000
65000
85000
105000
125000
145000
Apr 07 Nov 07 Jun 08 Jan 09 Aug 09
Production of Ampicillin (Kgs)

40Aaó½añegak utpaadna
Industrial Production
A)óla maI jaÜna jaÚlaaI Agasta esatambar AVtaÜbar navambar edsambar janavari Prvari maacaý
Apr May Jun Jul Aug Sep Oct Nov Dec Jan Feb MarSoap all kinds (IPP) (Tonnes) 2007-08 34518 35563 32757 37374 37284 33461 31073 31105 27123 34928 31886 36332 2008-09 34822 42417 37062 36813 44172 43342 35295 36019 32577 42943 41738 50589 2009-10 50200 53109 52793 53035 48300 .. ..Soap all kinds (SSI) ('000 tonnes)
2007-08 312.7 312.8 313.9 314.4 314.7 314.7 314.8 315.0 315.0 315.3 315.8 316.4 2008-09 316.6 317.3 318.3 318.8 318.9 319.0 319.7 319.8 319.9 319.9 320.0 320.3 2009-10 320.4 320.5 320.5 320.9 320.9 .. ..Detergent all kinds (Tonnes) 2007-08 90860 98498 93969 85665 82039 83971 92726 86596 96296 97398 98725 95686 2008-09 82401 85204 80383 83263 73523 79646 76438 80406 68381 79246 79306 75123 2009-10 69441 71826 68603 66194 60763 .. ..Hair oil/ayurvedic hair oil (Kls) 2007-08 2685 3075 3247 2848 2762 3232 2233 1984 2859 2866 2511 2392 2008-09 3189 3263 3506 2971 3138 3119 2357 2675 2498 2685 3094 3469 2009-10 3256 3257 3542 3467 3326 .. ..Toothpaste (Tonnes) 2007-08 3855 4845 4359 4470 4909 4649 5113 5019 5304 4887 4798 4791 2008-09 5621 5779 5439 6062 5963 5795 5736 5782 5979 5709 5874 5514 2009-10 6158 6280 6293 6841 6475 .. ..Toothpowder (Tonnes) 2007-08 575 462 480 450 544 550 609 522 595 630 689 542 2008-09 560 634 749 780 643 666 545 626 738 745 639 634 2009-10 656 677 719 679 658 .. ..Agarbathi (Rs.Million) 2007-08 42.7 42.1 41.6 41.6 43.1 41.4 42.6 43.7 42.3 41.2 41.4 46.9 2008-09 40.7 42.7 43.9 44.4 42.6 86.3 115.3 667.5 695.7 866.1 795.2 717.4 2009-10 582.7 861.8 796.9 794.4 806.0 .. ..Source:- Department of Industrial Policy & PromotionDevelopment Commissioner (Small-scale Industries) - for IIP data
lHkh izdkj ds lkcqu (vkbZ- ih-ih-) ( Vu) VwFk isLV ( Vu)
L=ksr :- vkS|ksfxd mRiknu lwpdakd ds vkWadM+s
lHkh izdkj ds lkcqu (vkbZ- ih-ih-) ( Vu)
lHkh izdkj ds lkcwu (,l-,l-vkbZ-) (*000 Vu)
lkj.kh la[;k 6-13% lkSUn;Z )saaDana Aaór )xaalana saamagaÒ i
Table No. 6.13 : Cosmetics & Toiletries
vxjcÙkh ( nl yk[k #i;s)
lHkh izdkj ds viektZd ( Vu)
ds'k rsy@ vk;qosZfnd ds'k rsy (*000 yhVj)
VwFk isLV ( Vu)
VwFk ikmMj ( Vu)
26000
32000
38000
44000
50000
56000
62000
Apr 07 Nov 07 Jun 08 Jan 09 Aug 09
Production of Soap all kinds(IPP)(Tonnes)
500
1500
2500
3500
4500
5500
6500
7500
Apr 07 Nov 07 Jun 08 Jan 09 Aug 09
Production of Toothpaste (Tonnes)

41Aaó½añegak utpaadna
Industrial Production
A)óla maI jaÜna jaÚlaaI Agasta esatambar AVtaÜbar navambar edsambar janavari Prvari maacaý
Apr May Jun Jul Aug Sep Oct Nov Dec Jan Feb MarFilament yarn ('000 tonnes)
2007-08 119.0 121.4 120.2 125.0 125.0 124.9 123.2 123.6 134.8 130.8 122.8 130.02008-09 121.9 131.4 123.9 125.5 90.1 92.5 108.3 116.0 128.9 127.8 119.4 129.22009-10 127.2 128.6 125.6 134.1 134.1 .. ..
Polyester fibre (Tonnes)2007-08 71031 73326 70541 64505 84539 81835 74436 78032 84139 78691 71401 794482008-09 74983 79628 74608 77002 54257 60413 63585 56813 70971 76562 75641 784292009-10 79594 83181 77542 87125 81983 .. ..
Viscose tyre cord (Tonnes)2007-08 620 639 613 655 664 621 625 617 610 613 560 4982008-09 414 435 423 548 608 578 596 565 600 606 414 1192009-10 115 115 165 322 356 .. ..
Nylon tyre cord (Tonnes)2007-08 6706 7198 6710 7283 6232 5709 7242 6881 7063 6827 6445 71772008-09 7031 7330 7044 7281 7258 6635 6993 5293 2275 1723 3481 62032009-10 6980 7369 7168 7704 7499 .. ..
Viscose staple fibre (Tonnes)2007-08 22406 23224 22457 23365 23290 22637 23591 22846 23638 22687 22745 249332008-09 21772 18277 17780 18721 22217 22014 21263 14864 15236 18078 18073 235202009-10 25963 23231 13688 23770 25790 .. ..
fQykesaV /kkxk (*000 Vu) iksfy,LVj js'ks ( Vu)
ukbZyksu Vk;j /kkxk ( Vu) foLdksl LVSiy js'ks ( Vu)
Source:- Department of Industrial Policy & Promotion L=ksr :- vkS|ksfxd mRiknu lwpdakd ds vkWadM+sDevelopment Commissioner (Small-scale Industries) - for IIP data
lkj.kh la[;k 6-14% saöSlañe\ata rñSañ
Table No.6.14 Synthetic Fibres
foLdksl LVSiy js'ks ( Vu)
fQykesaV /kkxk (*000 Vu)
iksfy,LVj js'ks ( Vu)
fcLdksl Vk;j /kkxk ( Vu)
ukbZyksu Vk;j /kkxk ( Vu)
65707580859095
100105110115120125130135
Apr 07 Nov 07 Jun 08 Jan 09 Aug 09
Production of Filament yarn (`000 tonnes)
40000
50000
60000
70000
80000
90000
Apr 07 Nov 07 Jun 08 Jan 09 Aug 09
Production of Polyester fibre (Tonnes)
15002000250030003500400045005000550060006500700075008000
Apr 07 Nov 07 Jun 08 Jan 09 Aug 09
Production of Nylon Tyre cord (Tonnes)
5000
10000
15000
20000
25000
30000
Apr 07 Nov 07 Jun 08 Jan 09 Aug 09
Production of Viscose staple fibre (Tonnes)

42Aaó½añegak utpaadna
Industrial Production
A)óla maI jaÜna jaÚlaaI Agasta esatambar AVtaÜbar navambar edsambar janavari Prvari maacaý
Apr May Jun Jul Aug Sep Oct Nov Dec Jan Feb MarMatches (Mln.boxes) 2007-08 7912.5 7910.3 7935.3 7549.1 7560.9 7552.5 7572.7 7542.5 7573.7 7584.7 7581.7 7591.7 2008-09 7562.7 7564.7 7539.7 7542.6 7437.3 7419.6 7384.0 7393.4 7416.3 7417.06 7414.1 7394.4 2009-10 7369.0 7402.1 7446.5 7464.2 7436.5 .. ..Industrial explosives (Tonnes) 2007-08 17370 18164 15221 14215 16649 15912 16411 16025 17861 17949 17178 17931 2008-09 17784 18452 18323 18196 17152 17481 18032 20599 21680 20032 19735 21793 2009-10 22559 22193 21748 22256 24332 .. ..Fire works (Tonnes) 2007-08 655 680 651 659 738 793 825 712 725 727 715 642 2008-09 688 728 711 755 776 832 825 671 623 669 685 746 2009-10 701 716 742 717 584 .. ..
ekfpl (nl yk[k fMfCc;ka)
vkS|ksfxd foLQksVd ( Vu) vkfr'kckth ( Vu)
Development Commissioner (Small-scale Industries) - for IIP dataL=ksr :- vkS|ksfxd mRiknu lwpdakd ds vkWadM+s
lkj.kh la[;k 6- 15% maaecasa Aaór evasPañXk saamagaÒi
Table No. 6.15 : Matches and Explosives
vkS|ksfxd foLQksVd ( Vu)
vkfr'kckth ( Vu)
ekfpl (nl yk[k fMfCc;ka)
Source:- Department of Industrial Policy & Promotion
6000
6500
7000
7500
8000
8500
9000
9500
10000
Apr 07 Nov 07 Jun 08 Jan 09 Aug 09
Production of Matches (Million boxes)
140001600018000200002200024000260002800030000320003400036000
Apr 07 Nov 07 Jun 08 Jan 09 Aug 09200
300
400
500
600
700
800
900
1000
Apr 07 Nov 07 Jun 08 Jan 09 Aug 09
Production of Fire Works (Tonnes)
Production of Industrial explosive (Tonnes)
43Aaó½añegak utpaadna
Industrial Production
A)óla maI jaÜna jaÚlaaI Agasta esatambar AVtaÜbar navambar edsambar janavari Prvari maacaý
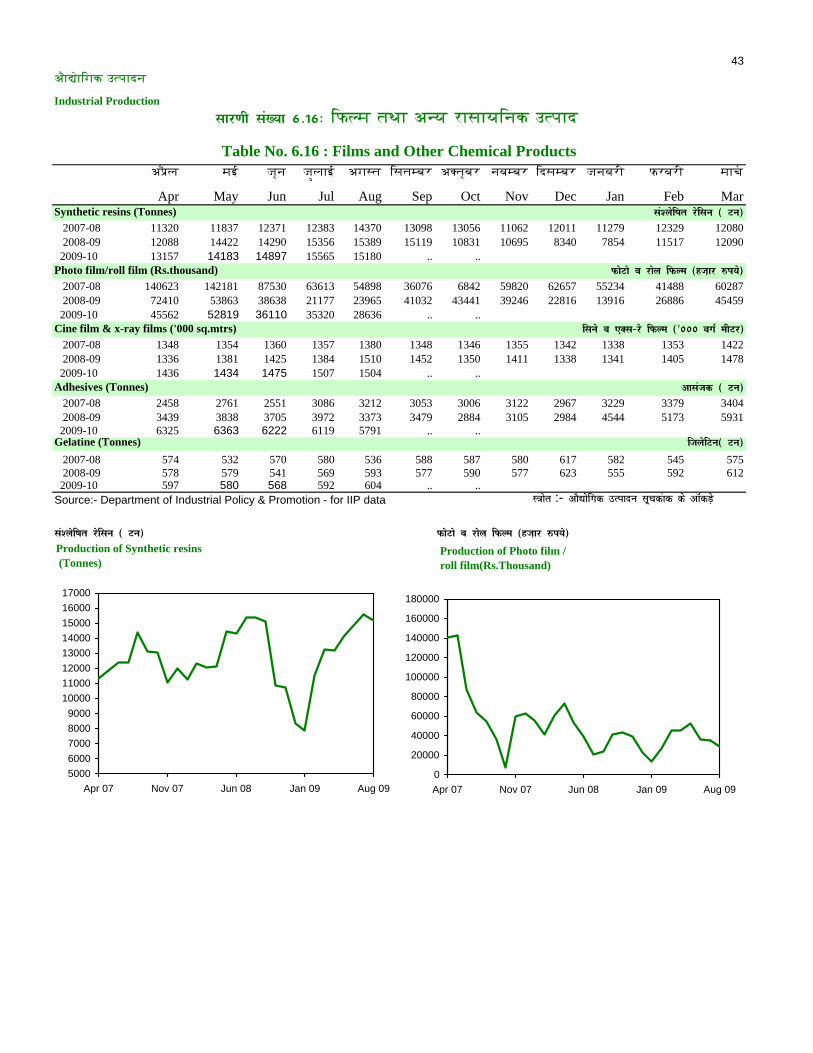
Apr May Jun Jul Aug Sep Oct Nov Dec Jan Feb MarSynthetic resins (Tonnes) 2007-08 11320 11837 12371 12383 14370 13098 13056 11062 12011 11279 12329 12080 2008-09 12088 14422 14290 15356 15389 15119 10831 10695 8340 7854 11517 12090 2009-10 13157 14183 14897 15565 15180 .. ..Photo film/roll film (Rs.thousand) 2007-08 140623 142181 87530 63613 54898 36076 6842 59820 62657 55234 41488 60287 2008-09 72410 53863 38638 21177 23965 41032 43441 39246 22816 13916 26886 45459 2009-10 45562 52819 36110 35320 28636 .. ..Cine film & x-ray films ('000 sq.mtrs) 2007-08 1348 1354 1360 1357 1380 1348 1346 1355 1342 1338 1353 1422 2008-09 1336 1381 1425 1384 1510 1452 1350 1411 1338 1341 1405 1478 2009-10 1436 1434 1475 1507 1504 .. ..Adhesives (Tonnes) 2007-08 2458 2761 2551 3086 3212 3053 3006 3122 2967 3229 3379 3404 2008-09 3439 3838 3705 3972 3373 3479 2884 3105 2984 4544 5173 5931 2009-10 6325 6363 6222 6119 5791 .. ..Gelatine (Tonnes) 2007-08 574 532 570 580 536 588 587 580 617 582 545 575 2008-09 578 579 541 569 593 577 590 577 623 555 592 612 2009-10 597 580 568 592 604 .. ..Source:- Department of Industrial Policy & Promotion - for IIP data L=ksr :- vkS|ksfxd mRiknu lwpdakd ds vkWadM+s
la'ysf"kr jsflu ( Vu) QksVks o jksy fQYe (gt+kj #i;s)
lkj.kh la[;k 6-16% ePlma taTaa Anya rasaayaenak utpaad
Table No. 6.16 : Films and Other Chemical Products
vklatd ( Vu)
ftysfVu( Vu)
la'ysf"kr jsflu ( Vu)
QksVks o jksy fQYe (gt+kj #i;s)
flus o ,Dl&js fQYe (*000 oxZ ehVj)
50006000700080009000
1000011000120001300014000150001600017000
Apr 07 Nov 07 Jun 08 Jan 09 Aug 09
Production of Synthetic resins (Tonnes)
0
20000
40000
60000
80000
100000
120000
140000
160000
180000
Apr 07 Nov 07 Jun 08 Jan 09 Aug 09
Production of Photo film /roll film(Rs.Thousand)

44
Industrial Production
A)óla maI jaÜna jaÚlaaI Agasta esatambar AVtaÜbar navambar edsambar janavari Prvari maacaý
Apr May Jun Jul Aug Sep Oct Nov Dec Jan Feb MarGiant tyres ('000 nos)
2007-08 1159.0 1153.4 1209.2 1274.8 1232.4 1179.5 1206.3 1135.1 1207.6 1206.2 1172.0 1199.6
2008-09 1150.5 1230.2 1250.0 1299.7 1095.8 1143.9 1138.4 1119.6 987.9 967.0 1060.5 1179.1 2009-10 1276.9 1273.9 1363.0 1459.2 1396.9 .. ..Two wheeler tyres ('000 nos)
2007-08 1839.2 1857.5 1897.0 1928.8 1874.8 1926.1 1982.5 1679.4 2070.1 1974.5 1958.3 1998.2 2008-09 1963.0 2069.1 2060.7 1959.5 1933.7 1987.9 2019.2 2012.7 1926.3 1855.0 2039.2 2234.3 2009-10 2178.2 1550.3 1936.8 2181.5 2224.1 .. ..Giant tubes ('000 nos) 2007-08 666.0 684.0 689.4 718.0 680.0 701.7 682.5 659.3 721.8 731.9 711.1 731.6 2008-09 716.7 687.3 691.8 723.2 652.2 663.3 608.7 562.3 611.4 497.2 613.3 678.4 2009-10 608.6 866.6 678.6 1012.7 984.8 .. ..Bicycle tubes (Million.nos) 2007-08 8.4 8.6 9.6 9.9 10.0 10.8 11.0 9.2 10.7 10.0 10.1 9.3 2008-09 7.9 8.2 9.4 8.4 13.3 9.3 8.7 8.2 8.3 8.3 8.1 8.3 2009-10 7.5 6.9 7.6 8.7 9.1 .. ..Bicycle tyres (Million.nos) 2007-08 7.5 7.1 7.8 8.0 8.0 8.7 8.6 7.3 8.5 8.3 8.0 7.6 2008-09 6.9 7.5 7.8 7.7 8.2 8.9 7.8 6.5 6.5 6.1 6.4 6.7 2009-10 6.1 5.7 6.0 6.8 6.9 .. ..Tractor tyres/a.d.v.tyres ('000 nos) 2007-08 216.1 242.8 219.2 225.1 206.8 212.6 212.4 229.0 213.8 209.3 202.0 201.5 2008-09 195.6 244.3 269.1 283.1 245.8 263.0 246.7 251.9 171.9 139.5 226.4 280.0 2009-10 292.7 305.0 307.9 313.4 294.2 .. ..Source:- Department of Industrial Policy & Promotion - for IIP data
tkbaV Vk;j (*000 la[;k)
Vqifg;k Vk;j (*000 la[;k)
Aaó½añegak utpaadna
lkj.kh la[;k 6-17% Xayar Aaór ®Üba
Table No. 6.17 :Tyres & Tubes
lkbZdy Vk;j (nl yk[k dh la[;k)
L=ksr :- vkS|ksfxd mRiknu lwpdakd ds vkWadM+s
VªsDVj@ ,-Mh-oh- Vk;j (*000 la[;k)
tkbaV Vk;j (*000 la[;k)
Vqifg;k Vk;j (*000 la[;k)
tkbaV V~;wc (*000 la[;k)
lkbZdy V~;wc (nl yk[k dh la[;k)
700
800
900
1000
1100
1200
1300
1400
1500
Apr 07 Nov 07 Jun 08 Jan 09 Aug 09900
10001100120013001400150016001700180019002000210022002300
Apr 07 Nov 07 Jun 08 Jan 09 Aug 09
Production of Giant tyres ('000 nos) Production of Two wheeler tyres
('000 nos)
45Aaó½añegak utpaadna
Industrial Production
A)óla maI jaÜna jaÚlaaI Agasta esatambar AVtaÜbar navambar edsambar janavari Prvari maacaý
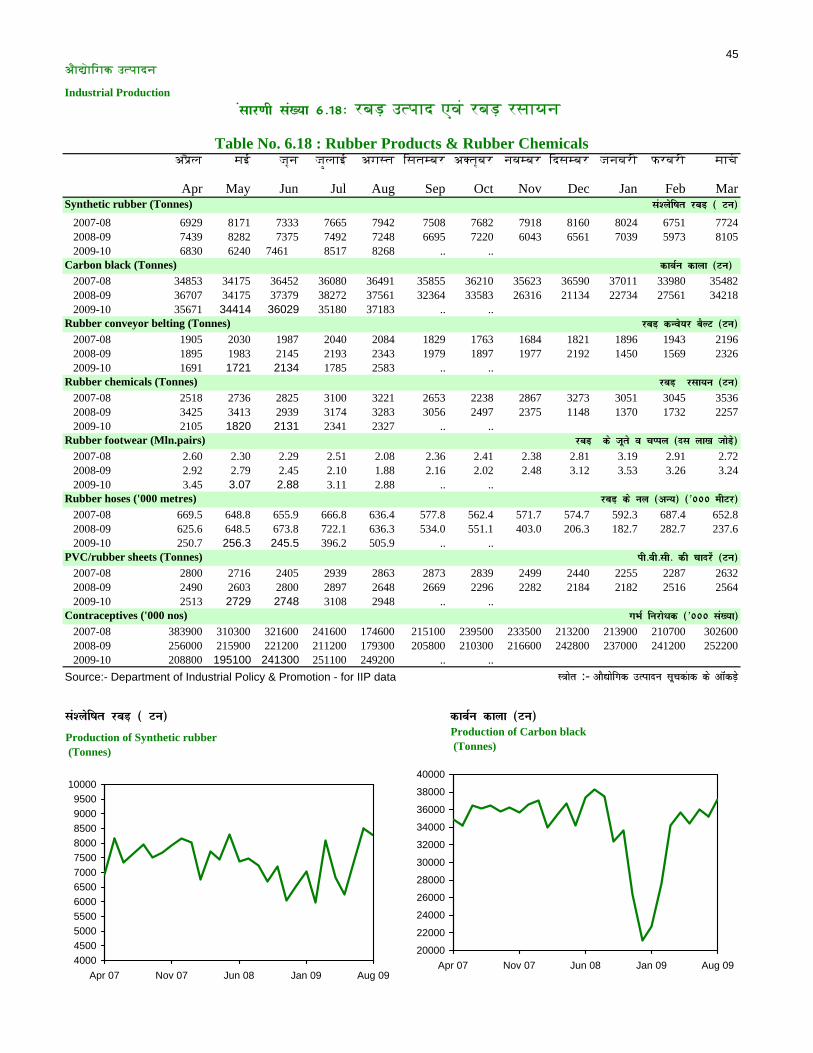
Apr May Jun Jul Aug Sep Oct Nov Dec Jan Feb MarSynthetic rubber (Tonnes) 2007-08 6929 8171 7333 7665 7942 7508 7682 7918 8160 8024 6751 7724 2008-09 7439 8282 7375 7492 7248 6695 7220 6043 6561 7039 5973 8105 2009-10 6830 6240 7461 8517 8268 .. ..Carbon black (Tonnes) 2007-08 34853 34175 36452 36080 36491 35855 36210 35623 36590 37011 33980 35482 2008-09 36707 34175 37379 38272 37561 32364 33583 26316 21134 22734 27561 34218 2009-10 35671 34414 36029 35180 37183 .. ..Rubber conveyor belting (Tonnes) 2007-08 1905 2030 1987 2040 2084 1829 1763 1684 1821 1896 1943 2196 2008-09 1895 1983 2145 2193 2343 1979 1897 1977 2192 1450 1569 2326 2009-10 1691 1721 2134 1785 2583 .. ..Rubber chemicals (Tonnes) 2007-08 2518 2736 2825 3100 3221 2653 2238 2867 3273 3051 3045 3536 2008-09 3425 3413 2939 3174 3283 3056 2497 2375 1148 1370 1732 2257 2009-10 2105 1820 2131 2341 2327 .. ..Rubber footwear (Mln.pairs) 2007-08 2.60 2.30 2.29 2.51 2.08 2.36 2.41 2.38 2.81 3.19 2.91 2.72 2008-09 2.92 2.79 2.45 2.10 1.88 2.16 2.02 2.48 3.12 3.53 3.26 3.24 2009-10 3.45 3.07 2.88 3.11 2.88 .. ..Rubber hoses ('000 metres) 2007-08 669.5 648.8 655.9 666.8 636.4 577.8 562.4 571.7 574.7 592.3 687.4 652.8 2008-09 625.6 648.5 673.8 722.1 636.3 534.0 551.1 403.0 206.3 182.7 282.7 237.6 2009-10 250.7 256.3 245.5 396.2 505.9 .. ..PVC/rubber sheets (Tonnes) 2007-08 2800 2716 2405 2939 2863 2873 2839 2499 2440 2255 2287 2632 2008-09 2490 2603 2800 2897 2648 2669 2296 2282 2184 2182 2516 2564 2009-10 2513 2729 2748 3108 2948 .. ..Contraceptives ('000 nos) 2007-08 383900 310300 321600 241600 174600 215100 239500 233500 213200 213900 210700 302600 2008-09 256000 215900 221200 211200 179300 205800 210300 216600 242800 237000 241200 252200 2009-10 208800 195100 241300 251100 249200 .. ..Source:- Department of Industrial Policy & Promotion - for IIP data
la'ysf"kr jcM+ ( Vu) dkcZu dkyk (Vu)
jcM+ ds uy (vU;) (*000 ehVj)
L=ksr :- vkS|ksfxd mRiknu lwpdakd ds vkWadM+s
alkj.kh la[;k 6-18% rba_ utpaad Ovaö rba_ rsaayana
Table No. 6.18 : Rubber Products & Rubber Chemicals
ih-oh-lh- dh pknjsa (Vu)
xHkZ fujks/kd (*000 la[;k)
la'ysf"kr jcM+ ( Vu)
dkcZu dkyk (Vu)
jcM+ dUos;j cSYV (Vu)
jcM+ jlk;u (Vu)
jcM+ ds twrs o pIiy (nl yk[k tksMs+)
400045005000550060006500700075008000850090009500
10000
Apr 07 Nov 07 Jun 08 Jan 09 Aug 09
Production of Synthetic rubber (Tonnes)
20000
22000
24000
26000
28000
30000
32000
34000
36000
38000
40000
Apr 07 Nov 07 Jun 08 Jan 09 Aug 09
Production of Carbon black (Tonnes)
46Aaó½añegak utpaadna
Industrial Production
A)óla maI jaÜna jaÚlaaI Agasta esatambar AVtaÜbar navambar edsambar janavari Prvari maacaý
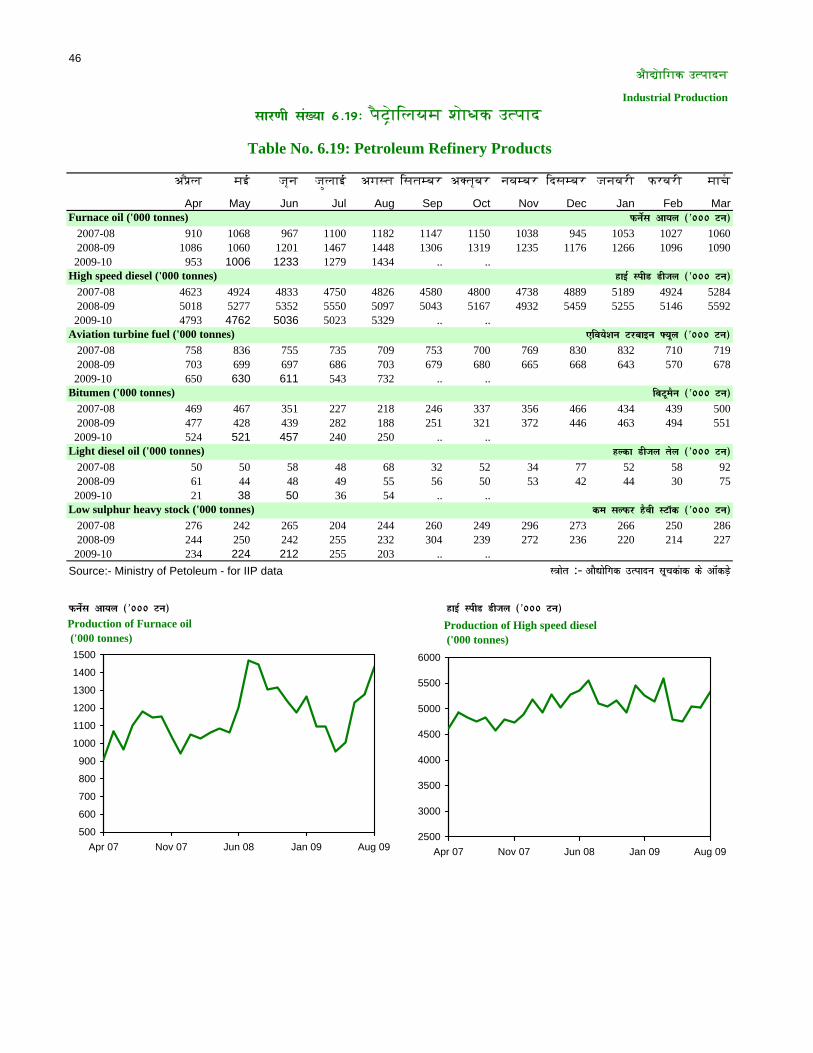
Apr May Jun Jul Aug Sep Oct Nov Dec Jan Feb MarFurnace oil ('000 tonnes) 2007-08 910 1068 967 1100 1182 1147 1150 1038 945 1053 1027 1060 2008-09 1086 1060 1201 1467 1448 1306 1319 1235 1176 1266 1096 1090 2009-10 953 1006 1233 1279 1434 .. ..High speed diesel ('000 tonnes) 2007-08 4623 4924 4833 4750 4826 4580 4800 4738 4889 5189 4924 5284 2008-09 5018 5277 5352 5550 5097 5043 5167 4932 5459 5255 5146 5592 2009-10 4793 4762 5036 5023 5329 .. ..Aviation turbine fuel ('000 tonnes) 2007-08 758 836 755 735 709 753 700 769 830 832 710 719 2008-09 703 699 697 686 703 679 680 665 668 643 570 678 2009-10 650 630 611 543 732 .. ..Bitumen ('000 tonnes) 2007-08 469 467 351 227 218 246 337 356 466 434 439 500 2008-09 477 428 439 282 188 251 321 372 446 463 494 551 2009-10 524 521 457 240 250 .. ..Light diesel oil ('000 tonnes) 2007-08 50 50 58 48 68 32 52 34 77 52 58 92 2008-09 61 44 48 49 55 56 50 53 42 44 30 75 2009-10 21 38 50 36 54 .. ..Low sulphur heavy stock ('000 tonnes) 2007-08 276 242 265 204 244 260 249 296 273 266 250 286 2008-09 244 250 242 255 232 304 239 272 236 220 214 227 2009-10 234 224 212 255 203 .. ..Source:- Ministry of Petoleum - for IIP data
QusZl vk;y (*000 Vu) gkbZ LihM Mhty (*000 Vu)
L=ksr :- vkS|ksfxd mRiknu lwpdakd ds vkWadM+s
QusZl vk;y (*000 Vu)
gkbZ LihM Mhty (*000 Vu)
lkj.kh la[;k 6-19% paóXÔañelayama SaañDak utpaad
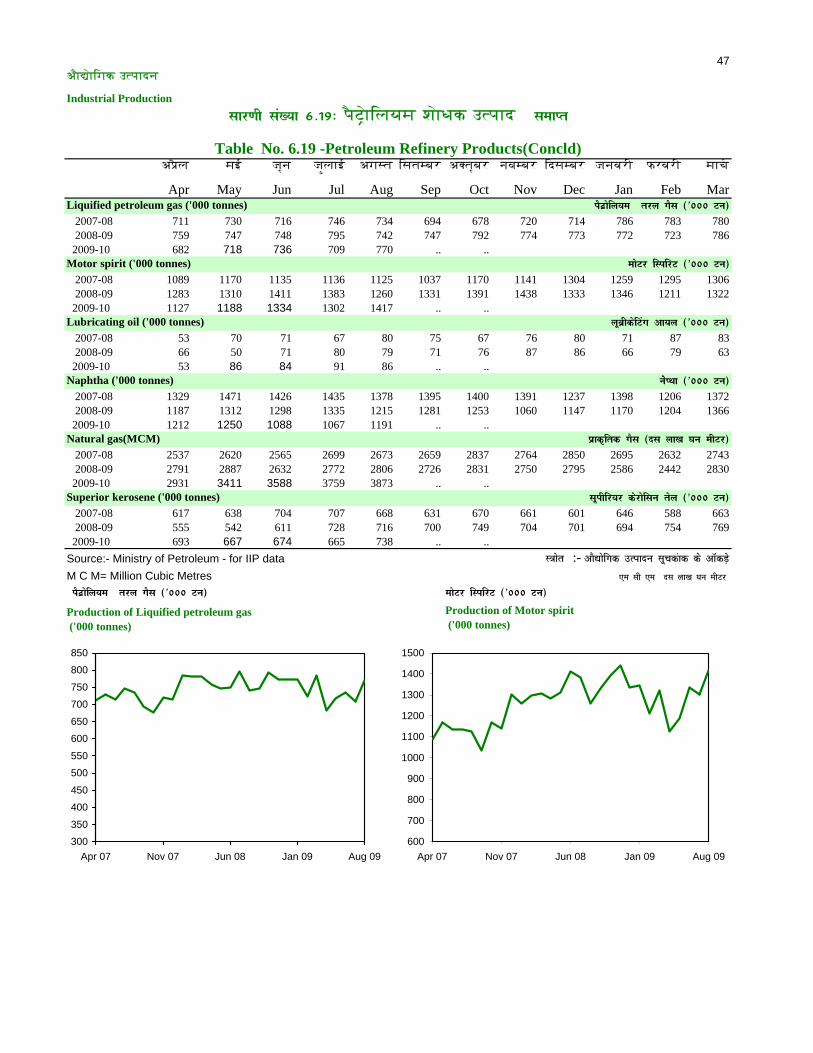
Table No. 6.19: Petroleum Refinery Products
de lYQj gSoh LVkWd (*000 Vu)
,fo;s'ku Vjckbu ¶;wy (*000 Vu)
fcVweSu (*000 Vu)
gYdk Mhty rsy (*000 Vu)
500
600
700
800
900
1000
1100
1200
1300
1400
1500
Apr 07 Nov 07 Jun 08 Jan 09 Aug 09
Production of Furnace oil ('000 tonnes)
2500
3000
3500
4000
4500
5000
5500
6000
Apr 07 Nov 07 Jun 08 Jan 09 Aug 09
Production of High speed diesel ('000 tonnes)
47Aaó½añegak utpaadna
Industrial Production
A)óla maI jaÜna jaÚlaaI Agasta esatambar AVtaÜbar navambar edsambar janavari Prvari maacaý
Apr May Jun Jul Aug Sep Oct Nov Dec Jan Feb MarLiquified petroleum gas ('000 tonnes) 2007-08 711 730 716 746 734 694 678 720 714 786 783 780 2008-09 759 747 748 795 742 747 792 774 773 772 723 786 2009-10 682 718 736 709 770 .. ..Motor spirit ('000 tonnes) 2007-08 1089 1170 1135 1136 1125 1037 1170 1141 1304 1259 1295 1306 2008-09 1283 1310 1411 1383 1260 1331 1391 1438 1333 1346 1211 1322 2009-10 1127 1188 1334 1302 1417 .. ..Lubricating oil ('000 tonnes) 2007-08 53 70 71 67 80 75 67 76 80 71 87 83 2008-09 66 50 71 80 79 71 76 87 86 66 79 63 2009-10 53 86 84 91 86 .. ..Naphtha ('000 tonnes) 2007-08 1329 1471 1426 1435 1378 1395 1400 1391 1237 1398 1206 1372 2008-09 1187 1312 1298 1335 1215 1281 1253 1060 1147 1170 1204 1366 2009-10 1212 1250 1088 1067 1191 .. ..Natural gas(MCM) 2007-08 2537 2620 2565 2699 2673 2659 2837 2764 2850 2695 2632 2743 2008-09 2791 2887 2632 2772 2806 2726 2831 2750 2795 2586 2442 2830 2009-10 2931 3411 3588 3759 3873 .. ..Superior kerosene ('000 tonnes) 2007-08 617 638 704 707 668 631 670 661 601 646 588 663 2008-09 555 542 611 728 716 700 749 704 701 694 754 769 2009-10 693 667 674 665 738 .. ..Source:- Ministry of Petroleum - for IIP data
iSVzksfy;e rjy xSl (*000 Vu) eksVj fLifjV (*000 Vu)
lkj.kh la[;k 6-19% paóXÔañelayama SaañDak utpaad lekIr
Table No. 6.19 -Petroleum Refinery Products(Concld)
lwihfj;j dsjksflu rsy (*000 Vu)
eksVj fLifjV (*000 Vu)
ywczhdsfVax vk;y (*000 Vu)
ussIFkk (*000 Vu)
izkd`frd xSl (nl yk[k ?ku ehVj)
,e lh ,e nl yk[k ?ku ehVj
iSVzksfy;e rjy xSl (*000 Vu)
M C M= Million Cubic MetresL=ksr :- vkS|ksfxd mRiknu lwpdakd ds vkWadM+s
600
700
800
900
1000
1100
1200
1300
1400
1500
Apr 07 Nov 07 Jun 08 Jan 09 Aug 09
Production of Motor spirit ('000 tonnes)
300
350
400
450
500
550
600
650
700
750
800
850
Apr 07 Nov 07 Jun 08 Jan 09 Aug 09
Production of Liquified petroleum gas ('000 tonnes)

48Aaó½añegak utpaadna
Industrial Production
A)óla maI jaÜna jaÚlaaI Agasta esatambar AVtaÜbar navambar edsambar janavari Prvari maacaý
Apr May Jun Jul Aug Sep Oct Nov Dec Jan Feb MarWashed coal ('000 tonnes) 2007-08 599 580 588 576 538 511 595 590 583 635 664 717 2008-09 571 625 585 559 595 606 592 610 608 626 620 710 2009-10 589 540 510 517 535 .. ..Glazed/ceramic tiles (tonnes) 2007-08 115581 115884 109717 114527 119706 123382 124636 107430 109032 108382 99584 116926 2008-09 108201 115517 106541 116264 120774 115767 117099 113595 123055 99944 111572 132428 2009-10 117451 116295 116332 124239 122958 .. ..Hard coke ('000 tonnes) 2007-08 872 899 876 873 837 854 912 886 919 918 828 846 2008-09 854 867 841 892 928 907 935 896 971 868 766 852 2009-10 828 844 818 844 880 .. ..Middling ('000 tonnes) 2007-08 498 541 477 482 473 478 573 520 529 518 528 574 2008-09 489 445 439 418 424 405 420 436 461 435 423 430 2009-10 365 428 412 396 415 .. ..Bottles/glass wares (tonnes) 2007-08 67224 73473 71910 76090 75489 74163 78038 76473 82761 82456 76992 81724 2008-09 79505 82136 79500 78914 74032 74955 78014 75642 75678 72146 62501 70090 2009-10 71346 72764 74188 77471 78989 .. ..HT insulators (tonnes) 2007-08 3595 4131 4221 4653 4761 4726 4958 4649 4710 4565 4228 6114 2008-09 3555 4208 4192 4515 4365 4805 4422 4224 4673 5531 5427 6034 2009-10 4222 4189 4478 4449 4583 .. ..Source:- Department of Industrial Policy & Promotion
Office of Coal Controller - for IIP data
ok'M dksy (*000 Vu)
XysT+M o fljkfed VkbZYl (Vu)
ok'M dksy (*000 Vu)
XysT+M o fljkfed VkbZYl (Vu)
lkj.kh la[;k 6-20% kañyalaa glaasa va esaraemak utpaad
Table No. 6.20: Coal, Glass & Ceramic Products
iRFkj dk dks;yk (*000 Vu)
feMfyax (*000 Vu)
cksry@Xykl os;j (Vu)
,p- Vh- bUlqysVj (Vu)
L=ksr :- vkS|ksfxd mRiknu lwpdakd ds vkWadM+s
500
550
600
650
700
750
800
850
900
Apr 07 Nov 07 Jun 08 Jan 09 Aug 09
Production of Washed coal ('000 tonnes)
50000
60000
70000
80000
90000
100000
110000
120000
130000
140000
Apr 07 Nov 07 Jun 08 Jan 09 Aug 09
Production of Glazed/ceramic tiles (tonnes)

49Aaó½añegak utpaadna
Industrial Production
A)óla maI jaÜna jaÚlaaI Agasta esatambar AVtaÜbar navambar edsambar janavari Prvari maacaý
Apr May Jun Jul Aug Sep Oct Nov Dec Jan Feb MarCement ('000 tonnes) 2007-08 13930 14260 13660 13360 12840 12760 13810 13050 14050 14800 14670 16390 2008-09 15020 14890 14650 14640 13160 13890 14760 14340 15820 16130 16000 18100 2009-10 16840 16701 16600 16230 15560 .. ..Asbestos cement sheets ('000 tonnes) 2007-08 173.1 189.5 195.8 200.0 192.9 185.0 185.8 183.0 203.6 201.1 189.9 199.1 2008-09 190.6 199.8 198.7 199.8 199.3 187.6 187.0 172.3 172.5 159.4 162.4 203.0 2009-10 191.8 215.7 215.3 226.6 183.4 .. ..Graphite electrodes & anodes (tonnes) 2007-08 7784 8832 9213 8987 9141 9703 9299 8834 10698 9945 9396 11022 2008-09 7659 9303 10300 10449 10238 9771 9278 8838 9491 7181 5745 6312 2009-10 4968 5353 6436 6132 6439 .. ..Asbestos cement pipes ('000 tonnes) 2007-08 12.5 12.5 12.5 12.5 12.5 12.5 12.5 12.5 12.5 12.5 12.5 12.5 2008-09 12.5 12.5 12.5 12.5 12.5 12.5 12.5 12.5 12.5 12.5 12.5 12.5 2009-10 12.5 12.5 12.5 12.5 12.5 .. ..Polished granite/stone chips (Rs.' 000) 2007-08 85352 81027 87793 94014 89082 82690 102471 74545 66911 70515 75992 85186 2008-09 75864 82338 84391 82980 71233 78618 71382 65695 87048 74266 72845 106386 2009-10 115775 112633 95795 114137 98578 .. ..Railway/concrete sleeper (Nos.) 2007-08 61309 66417 64002 74061 60240 63235 74366 70222 72911 79213 72361 66665 2008-09 56611 39860 35385 43065 45653 52923 51473 55510 70503 78789 68289 72475 2009-10 74769 85029 82441 76061 61433 .. ..Source:- Department of Industrial Policy & Promotion - for IIP data
lhesaV (*000 Vu)
,lcsLVl lhesaV pknjsa (*000 Vu)
L=ksr :- vkS|ksfxd mRiknu lwpdakd ds vkWadM+s
lkj.kh la[;k 6-21% ADaaetvak Kaenaja utpaad
Table No. 6.21 : Non-metallic Mineral Products
jsyos @dadjhV Lyhij (la[;k)
lhesaV (*000 Vu)
,lcsLVl lhesaV pknjsa (*000 Vu)
xzsQkbV bysDVªksMl ,oa ,uksM~l( Vu)
iksfy'M xzsukbV @ LVksu phIl ( *000 #i;s)
,lcsLVl flesaV ikbIl (*000 Vu)
700080009000
10000110001200013000140001500016000170001800019000
Apr 07 Nov 07 Jun 08 Jan 09 Aug 09
Production of Cement ('000 tonnes)
90100110120130140150160170180190200210220230240250
Apr 07 Nov 07 Jun 08 Jan 09 Aug 09
Production of Asbestos cement sheets ('000 tonnes)

50Aaó½añegak utpaadna
Industrial Production
A)óla maI jaÜna jaÚlaaI Agasta esatambar AVtaÜbar navambar edsambar janavari Prvari maacaý
Apr May Jun Jul Aug Sep Oct Nov Dec Jan Feb MarPig iron ('000 tonnes) 2007-08 422.8 380.0 362.4 437.0 410.8 428.3 428.2 437.7 452.4 487.1 396.1 445.5 2008-09 410.1 393.8 392.4 473.7 493.8 425.0 469.3 408.2 369.5 407.5 424.9 415.1 2009-10 455.0 432.0 467.0 451.0 469.0 .. ..Bars and rods ('000 tonnes) 2007-08 1218.7 1323.5 1270.9 1304.0 1266.1 1586.3 1735.5 1635.0 1689.1 1682.8 1662.6 1948.6 2008-09 1612.8 1722.2 1650.7 1767.7 1704.0 1714.0 1737 1722 1724.6 1678.8 1690.5 1800.4 2009-10 1662.0 1777.0 1763.0 1782.0 2039.0 .. ..Sponge iron ('000 tonnes) 2007-08 1350 1400 1450 1550 1550 1550 1550 1550 1600 1600 1550 1700 2008-09 1600 1650 1650 1650 1750 1700 1750 1750 1800 1800 1800 1800 2009-10 1700 1750 1700 1750 1715 .. ..Carbon steel ('000 tonnes) 2007-08 2049.7 2137.7 2194.8 1970.7 2061.6 1628.1 1739.4 1625.0 1652.2 1937.1 1837.4 1850.5 2008-09 1634.3 1555.1 1723.7 1807.8 1824.5 1821.7 1971 1780.9 1872.4 1753.5 1760.1 1861.9 2009-10 1816.0 1825.0 2121.0 1913.0 2011.0 .. ..Steel structurals ('000 tonnes) 2007-08 321.3 334.0 310.1 328.3 377.7 447.0 425.9 387.3 389.4 412.5 396.5 470.7 2008-09 386.2 411.3 426.8 426.2 441.5 438.4 443.5 436.2 465.3 438.0 406.6 441.0 2009-10 410.0 428.0 423.0 423.0 488.0 .. ..Railway materials ('000 tonnes) 2007-08 72.8 89.9 87.8 86.8 97.3 82.6 92.9 89.5 96.1 92.0 88.3 101.1 2008-09 83.4 93.0 85.1 98.5 97.6 91.7 103.3 101.6 101.8 100.7 99.9 109.0 2009-10 77.0 82.0 102.0 97.0 103.0 .. ..HR coils/ skelp ('000 tonnes) 2007-08 1041.2 986.8 927.5 1013.2 969.6 931.2 937.0 959.5 895.1 856.9 929.7 1068.7 2008-09 869.5 919.2 973.2 878.6 1003.4 973.2 842.6 912.3 916.5 1081.1 1082.8 1072.8 2009-10 921.0 913.0 914.0 915.0 1006.0 .. ..Source:- Joint Plant Committee (Iron & Steel) - for IIP data
fix vk;ju (*000 Vu)
cklZ ,aM jksM+l (*000 Vu)
L=ksr :- vkS|ksfxd mRiknu lwpdakd ds vkWadM+s
lkj.kh la[;k 6-22% laaóh Aaór Espaata
Table No. 6.22 : Iron & Steel
LVhy lajpuk,a (*000 Vu)
jsyos lkeku (*000 Vu)
,p- vkj- dskbYl@LdsYil (*000 Vu)
fix vk;ju (*000 Vu)
cklZ ,aM jksM+l (*000 Vu)
Liat vk;ju (*000 Vu)
dkcZu LVhy (*000 Vu)
200
250
300
350
400
450
500
550
Apr 07 Nov 07 Jun 08 Jan 09 Aug 09
Production of Pig iron ('000 tonnes)
600700800900
1000110012001300140015001600170018001900200021002200
Apr 07 Nov 07 Jun 08 Jan 09 Aug 09
Production of Bars and rods('000 tonnes)

51Aaó½añegak utpaadna
A)óla maI jaÜna jaÚlaaI Agasta esatambar AVtaÜbar navambar edsambar janavari Prvari maacaý
Apr May Jun Jul Aug Sep Oct Nov Dec Jan Feb Mar
2007-08 630.9 630.9 588.7 660.8 697.1 350.5 366.4 430.4 448.3 456.0 430.2 497.1 2008-09 370.3 390.4 418.5 414.2 433.1 440.5 484.9 340.2 259.4 297.3 281.1 389.6 2009-10 395.0 395.0 427.0 427.0 261.0 .. ..
2007-08 200 200 200 200 200 190 200 190 200 200 180 200 2008-09 180 190 190 190 230 230 240 230 250 250 250 250 2009-10 248 248 233 233 264 .. ..
2007-08 43.2 39.6 34.7 59.5 62.3 65.0 65.1 59.5 59.6 66.1 58.0 66.0 2008-09 55.0 57.0 53.2 49.9 59.7 64.1 62.5 59.4 69.9 71.1 64.1 72.0 2009-10 53.0 48.0 50.0 53.0 48.0 .. ..
2007-08 14.0 13.4 15.9 15.8 16.2 12.8 13.0 12.8 14.2 14.1 12.1 14.2 2008-09 13.2 15.5 14.2 14.8 14.0 9.5 12 14.3 13.6 14.4 14.7 15.8 2009-10 12.0 15.0 13.0 14.0 14.0 .. ..
2007-08 353.3 354.3 364.1 379.0 381.2 365.0 372.9 343.5 350.7 357.5 360.2 407.0 2008-09 348.4 365.4 366.0 374.8 382.5 388.1 379.1 303.6 345.3 369.5 353.1 383.3 2009-10 378.0 398.0 361.0 367.0 360.0 .. ..
2007-08 16.2 15.4 16.0 17.6 17.2 15.1 13.6 14.1 16.7 14.1 16.0 16.8 2008-09 15.0 16.5 16.1 16.5 16.5 15.0 16.5 17.5 16.5 16.5 17.5 18.5 2009-10 17.0 17.0 17.0 16.0 19.0 .. ..
2007-08 36 36 35 36 36 35 36 35 36 36 34 36 2008-09 34 35 36 36 45 45 50 50 50 50 50 50 2009-10 45 50 45 48 50 .. ..
2007-08 6742 7168 7340 7957 7620 7778 7886 7276 7626 6934 6396 6866 2008-09 7676 8333 8814 8579 9271 9590 10359 8170 7693 8135 6686 7764 2009-10 7339 7413 8521 7915 8595 .. ..Source:- Joint Plant Committee (Iron & Steel) - for IIP data
lh- vkj- 'khVl (*000 Vu) LVsuySl@vykSg LVhy (*000 Vu)
Wire ropes (Tonnes)
Electric sheets ('000 tonnes)
GP/GC sheets (colour coated) ('000 tonnes)
Tinplate (incl.WW) ('000 tonnes)
Steel wires drawing ('000 tonnes)
bysDVªhd 'khVl (*000 Vu)
lh- vkj- 'khVl (*000 Vu)
LVsuySl@vykSg LVhy (*000 Vu)
L=ksr :- vkS|ksfxd mRiknu lwpdakd ds vkWadM+s
bLikr ds rkjsa (*000 Vu)
rkj dh jLlh (Vu)
th-ih-@th-lh- 'khV~l (jaxhu) (*000 Vu)
fVu IysV (*000 Vu)
Industrial Production
CR sheets/ coils ('000 tonnes)
Stainless/alloy steel ('000 tonnes)
HR sheets ('000 tonnes)
lkj.kh la[;k 6-22% laaóh Aaór Espaata (lekIr)
Table No. 6.22 : Iron & Steel (Concld)
,p-vkj- 'khV~l (*000 Vu)
250300350400450500550600650700750800
April-07 Nov 07 Jun 08 Jan 09 Aug 09
Production of CR sheets/coils ('000 tonnes)
100
120
140
160
180
200
220
240
260
280
300
April-07 Nov 07 Jun 08 Jan 09 Aug 09
Production of Stainless/alloy steel ('000 tonnes)

52Aaó½añegak utpaadna
A)óla maI jaÜna jaÚlaaI Agasta esatambar AVtaÜbar navambar edsambar janavari Prvari maacaý
Apr May Jun Jul Aug Sep Oct Nov Dec Jan Feb Mar
2007-08 9554 10272 10082 8764 6857 8908 6943 8887 9387 7808 9276 86742008-09 6240 6293 6852 7183 5702 6337 8401 7229 6402 8538 8808 65762009-10 5979 5941 5616 6218 4890 .. ..
2007-08 98 97 100 103 104 96 101 96 104 108 105 1232008-09 97 101 100 109 111 106 112 108 107 108 105 1082009-10 109 111 179 135 141 .. ..
2007-08 24468 24474 24477 24511 24519 24552 24600 24617 24690 24754 24792 248262008-09 24869 24907 24907 24907 24907 25013 25133 25163 25184 25209 25218 252432009-10 25248 25261 25273 25350 25350 .. ..
2007-08 35031 37619 39303 37212 39371 40595 41150 40777 42253 35913 36649 461792008-09 32490 37457 40586 34432 37860 37852 28660 29263 27548 22233 25488 279632009-10 23589 25295 28914 27349 29317 .. ..
2007-08 46556 47742 43165 39130 39071 40277 40215 41984 45561 45506 40073 430792008-09 42536 42883 39996 37009 35540 33463 33229 31022 31948 27361 26534 296452009-10 26310 26371 29329 29112 27993 .. ..
Liu ikbi (Vu)
filkbZ vkSj x<kbZ (Vu)
ikbIl vkSj V~;wc (Mh-lh-vkbZ-,l- (*000 Vu)
LVhy <ykbZ (Vu)
Industrial Production
Spun pipes (Tonnes)
Pipes & tubes (JPC) ('000 tonnes)
Pipes & tubes (SSI) (Tonnes)
lkj.kh la[;k 6-23%ZlaaI Aaór gaZaI
Table No. 6.23 : Casting & Forging
Liu ikbi (Vu)
ikbIl vkSj V~;wc (Mh-lh-vkbZ-,l- (*000 Vu)
ikbZIl vkSj V~;wc (,l-,l-vkbZ) ( Vu)
filkbZ vkSj x<kbZ (Vu)Stamping & forgings (Tonnes)
Steel castings (Tonnes) LVhy <ykbZ (Vu)
L=ksr :- vkS|ksfxd mRiknu lwpdakd ds vkWadM+sSource:- Department of Industrial Policy & PromotionDevelopment Commissioner (Small-scale Industries) /Joint Plant Committee - for IIP data
400060008000
1000012000140001600018000200002200024000260002800030000
Apr 07 Nov 07 Jun 08 Jan 09 Aug 09
Production of Spun pipes (Tonnes)
26000280003000032000340003600038000400004200044000460004800050000520005400056000
Apr 07 Nov 07 Jun 08 Jan 09 Aug 09
Production of Steel castings (Tonnes)
21000
22000
23000
24000
25000
26000
27000
28000
29000
Apr 07 Nov 07 Jun 08 Jan 09 Aug 09
Production of Pipes & tubes (SSI) (Tonnes)
15000
20000
25000
30000
35000
40000
45000
50000
Apr 07 Nov 07 Jun 08 Jan 09 Aug 09
Production of Stamping & forgings(Tonnes)
53Aaó½añegak utpaadna
A)óla maI jaÜna jaÚlaaI Agasta esatambar AVtaÜbar navambar edsambar janavari Prvari maacaý
Apr May Jun Jul Aug Sep Oct Nov Dec Jan Feb Mar
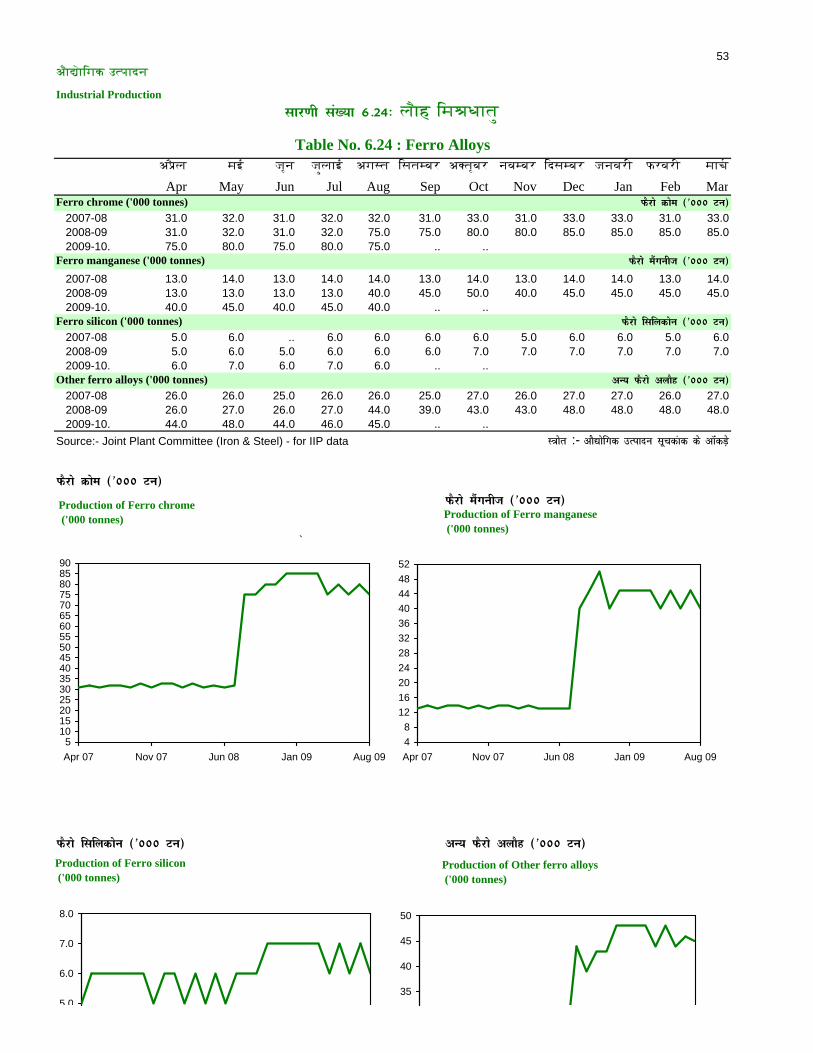
2007-08 31.0 32.0 31.0 32.0 32.0 31.0 33.0 31.0 33.0 33.0 31.0 33.0 2008-09 31.0 32.0 31.0 32.0 75.0 75.0 80.0 80.0 85.0 85.0 85.0 85.0 2009-10. 75.0 80.0 75.0 80.0 75.0 .. ..
2007-08 13.0 14.0 13.0 14.0 14.0 13.0 14.0 13.0 14.0 14.0 13.0 14.0 2008-09 13.0 13.0 13.0 13.0 40.0 45.0 50.0 40.0 45.0 45.0 45.0 45.0 2009-10. 40.0 45.0 40.0 45.0 40.0 .. ..
2007-08 5.0 6.0 .. 6.0 6.0 6.0 6.0 5.0 6.0 6.0 5.0 6.0 2008-09 5.0 6.0 5.0 6.0 6.0 6.0 7.0 7.0 7.0 7.0 7.0 7.0 2009-10. 6.0 7.0 6.0 7.0 6.0 .. ..
2007-08 26.0 26.0 25.0 26.0 26.0 25.0 27.0 26.0 27.0 27.0 26.0 27.0 2008-09 26.0 27.0 26.0 27.0 44.0 39.0 43.0 43.0 48.0 48.0 48.0 48.0 2009-10. 44.0 48.0 44.0 46.0 45.0 .. ..Source:- Joint Plant Committee (Iron & Steel) - for IIP data
QSjks Økse (*000 Vu)
QSjks eSaxuht (*000 Vu)
`
QSjks flfydksu (*000 Vu) vU; QSjks vykSg (*000 Vu)
vU; QSjks vykSg (*000 Vu)
QSjks Økse (*000 Vu)
QSjks eSaxuht (*000 Vu)
L=ksr :- vkS|ksfxd mRiknu lwpdakd ds vkWadM+s
Other ferro alloys ('000 tonnes)
Industrial Production
Ferro chrome ('000 tonnes)
Ferro manganese ('000 tonnes)
Ferro silicon ('000 tonnes)
lkj.kh la[;k 6-24% laaóh emaÂaDaataÚ
Table No. 6.24 : Ferro Alloys
QSjks flfydksu (*000 Vu)
51015202530354045505560657075808590
Apr 07 Nov 07 Jun 08 Jan 09 Aug 09
Production of Ferro chrome ('000 tonnes)
48
1216202428323640444852
Apr 07 Nov 07 Jun 08 Jan 09 Aug 09
Production of Ferro manganese ('000 tonnes)
5 0
6.0
7.0
8.0
35
40
45
50
Production of Ferro silicon ('000 tonnes)
Production of Other ferro alloys ('000 tonnes)

54Aaó½añegak utpaadna
A)óla maI jaÜna jaÚlaaI Agasta esatambar AVtaÜbar navambar edsambar janavari Prvari maacaý
Apr May Jun Jul Aug Sep Oct Nov Dec Jan Feb Mar
2007-08 3801 3901 2785 2690 2910 3976 4030 4259 4128 4022 4085 4155 2008-09 3206 2816 2202 2852 1801 2871 3262 2692 3690 1465 1473 1705 2009-10 1310 1298 1348 331 981 .. ..
2007-08 60.00 62.37 63.06 62.74 62.32 64.73 63.72 59.87 64.92 65.00 58.95 68.06 2008-09 58.53 63.25 64.12 63.44 63.08 64.41 68.68 69.12 71.26 67.45 61.86 69.56 2009-10 60.72 66.98 59.29 59.14 59.60 .. ..
2007-08 23410 25438 26232 26344 25261 23802 25792 26284 24769 27138 27072 25525 2008-09 25650 25415 24592 26876 24662 21896 23377 20725 18428 20825 21384 24384 2009-10 23711 24951 23666 24046 26475 .. ..
2007-08 10264 11183 11603 12134 12284 11839 12014 12025 12590 12688 12050 11909 2008-09 11628 12706 12173 12148 12065 11090 10279 9038 8570 9261 9307 10052 2009-10 9997 10411 10763 11380 10864 .. ..
2007-08 3690 3686 3913 3817 3890 3818 4133 3756 4090 3880 3570 3794 2008-09 3889 3929 3684 3822 3291 3259 2686 2585 2579 2067 1731 1814 2009-10 2222 2395 2457 2602 2853 .. ..
2007-08 18265 20001 19864 20485 21504 18845 20545 21134 22266 21193 19832 22981 2008-09 20734 23271 22660 24036 22829 22897 23485 22136 24930 24733 23109 26163 2009-10 24811 26644 26794 27833 28372 .. ..Source:- Department of Industrial Policy & Promotion - for IIP data rkack /kkrq dSFkksM (Vu)
,Y;wfefu;e buxksV~l (*000 Vu)
Industrial Production
Aluminium ingots ('000 tonnes)
Copper cathode (Tonnes)
,Y;wfefu;e jksYM mRikn (Vu)
lkj.kh la[;k 6-25% H Alaaóh DaataÚOö
Table No. 6.25: Non-ferrous Metals
rkack /kkrq dSFkksM (Vu)
,Y;wfefu;e buxksV~l (*000 Vu)
,Y;wfefu;e cfg"dj.k (Vu)
,Y;wfefu;e dh ifÙk;ka (Vu)
,Y;qfefu;e rkj NMsa+ (Vu)
L=ksr :- vkS|ksfxd mRiknu lwpdakd ds vkWadM+s
Aluminium wire rods (Tonnes)
Aluminium rolled products (Tonnes)
Aluminium extrusions (Tonnes)
Aluminium foils (Tonnes)
0
2000
4000
6000
Apr 07 Nov 07 Jun 08 Jan 09 Aug 09
Production of Copper cathode (Tonnes)
202530354045505560657075
Apr 07 Nov 07 Jun 08 Jan 09 Aug 09
Production of Aluminium ingots ('000 Tonnes)

56Aaó½añegak utpaadna
A)óla maI jaÜna jaÚlaaI Agasta esatambar AVtaÜbar navambar edsambar janavari Prvari maacaý
Apr May Jun Jul Aug Sep Oct Nov Dec Jan Feb MarRazor blades (Million.nos) 2007-08 639.9 628.1 673.2 695.6 687.1 611.2 622.3 623.6 669.1 647.6 648.2 662.8 2008-09 648.6 684.7 642.2 658.1 587.1 612.3 548.4 580.3 617.1 579.4 570.3 600.7 2009-10 615.4 576.6 610.5 672.1 608.5 .. ..Aluminium collapsible tubes (Million.nos) 2007-08 7.6 6.7 6.4 8.0 7.6 6.7 8.4 7.6 8.7 8.1 8.7 7.4 2008-09 7.5 7.1 6.6 7.3 9.1 7.2 6.7 7.8 6.4 5.3 6.9 7.1 2009-10 8.5 7.4 7.6 6.8 6.5 .. ..Welding electrodes/rods ('000 run. mtrs) 2007-08 28322 31011 30451 30879 30785 31433 29574 30970 32470 27299 27268 28326 2008-09 25542 26278 26479 25576 25446 26327 25531 25712 27213 26053 25362 26603 2009-10 25096 26039 26023 26503 25920 .. ..Welded link chains (Tonnes) 2007-08 2112 1988 2151 2238 2271 2172 2337 2226 2376 2358 2317 2246 2008-09 1992 1874 1909 1929 1905 1935 1884 1924 1951 1790 1807 1820 2009-10 1911 1711 1681 1826 1772 .. ..Utensils (excl.pressure cooker) (Rs.thousand) 2007-08 14773 24766 20631 17166 21793 24255 27472 24005 16487 17832 29419 36471 2008-09 19507 22812 25201 25651 18674 29569 25567 19996 32973 26424 22365 19338 2009-10 15186 21222 22109 26398 20741 .. ..Pressure cookers (Nos.) 2007-08 344884 350323 318964 346613 305971 323567 301152 307024 334205 320541 317437 343926 2008-09 274387 313632 341593 366370 315373 380957 329445 361474 388613 369712 373335 390955 2009-10 366539 427092 461581 481182 489941 .. ..Source:- Department of Industrial Policy & Promotion - for IIP data
jst+j CysM~l (nl yk[k dh la[;k) osfYMax bySDVªksM~l o jkWM~l (*000 ehVj)
Industrial Production
jst+j CysM~l (nl yk[k dh la[;k)
,Y;wfefu;e dySfIlcy V~;wc (nl yk[k dh la[;k)
lkj.kh la[;k 6-27% Daaetvak utpaad
Table No. 6.27 : Metal Products
L=ksr :- vkS|ksfxd mRiknu lwpdakd ds vkWadM+s
osfYMax bySDVªksM~l o jkWM~l (*000 ehVj)
osYMM dh gqbZ tathj (Vu)
/kkfRod crZu (izsÓkj dqdj NksM+dj) (gt+kj #i;s)
izs'kj dqdj (la[;k)
250300350400450500550600650700750800
Apr 07 Nov 07 Jun 08 Jan 09 Aug 09
Production of Razor blades(Million nos.)
18000
22000
26000
30000
34000
Apr 07 Nov 07 Jun 08 Jan 09 Aug 09
Production of Welding electrodes/rodes(000 running metres)
57Aaó½añegak utpaadna
Industrial Production
A)óla maI jaÜna jaÚlaaI Agasta esatambar AVtaÜbar navambar edsambar janavari Prvari maacaý
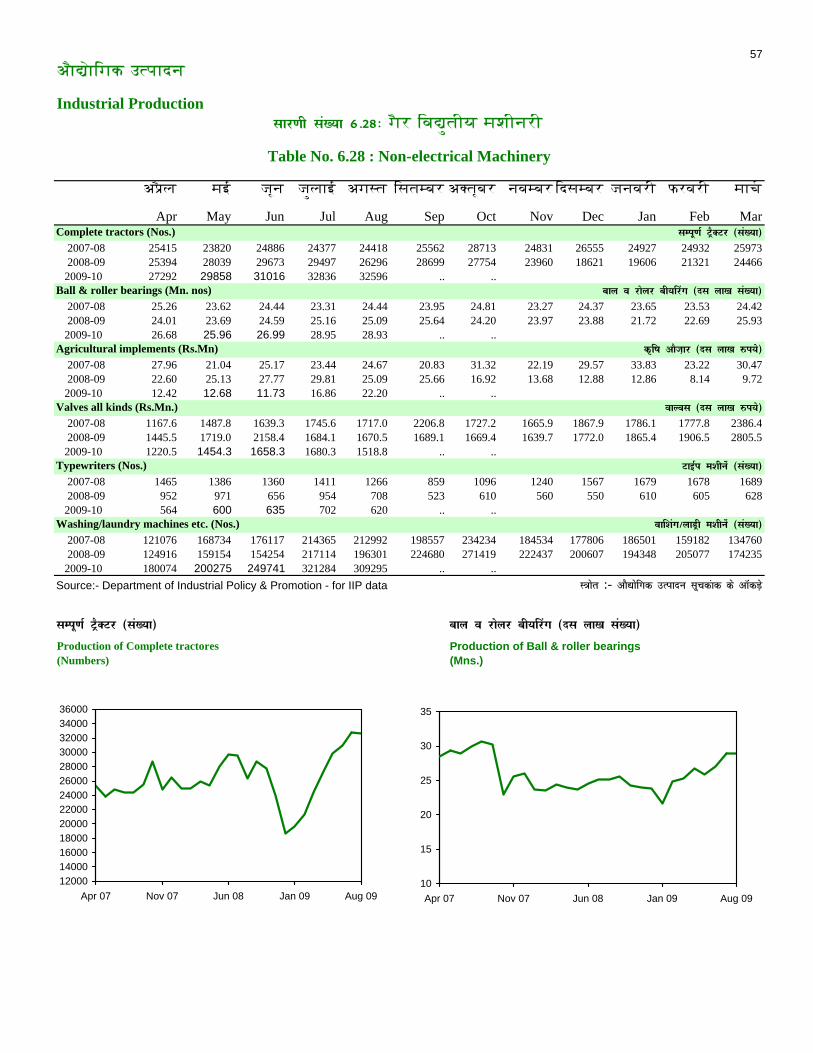
Apr May Jun Jul Aug Sep Oct Nov Dec Jan Feb MarComplete tractors (Nos.) 2007-08 25415 23820 24886 24377 24418 25562 28713 24831 26555 24927 24932 25973 2008-09 25394 28039 29673 29497 26296 28699 27754 23960 18621 19606 21321 24466 2009-10 27292 29858 31016 32836 32596 .. ..Ball & roller bearings (Mn. nos) 2007-08 25.26 23.62 24.44 23.31 24.44 23.95 24.81 23.27 24.37 23.65 23.53 24.42 2008-09 24.01 23.69 24.59 25.16 25.09 25.64 24.20 23.97 23.88 21.72 22.69 25.93 2009-10 26.68 25.96 26.99 28.95 28.93 .. ..Agricultural implements (Rs.Mn) 2007-08 27.96 21.04 25.17 23.44 24.67 20.83 31.32 22.19 29.57 33.83 23.22 30.47 2008-09 22.60 25.13 27.77 29.81 25.09 25.66 16.92 13.68 12.88 12.86 8.14 9.72 2009-10 12.42 12.68 11.73 16.86 22.20 .. ..Valves all kinds (Rs.Mn.) 2007-08 1167.6 1487.8 1639.3 1745.6 1717.0 2206.8 1727.2 1665.9 1867.9 1786.1 1777.8 2386.4 2008-09 1445.5 1719.0 2158.4 1684.1 1670.5 1689.1 1669.4 1639.7 1772.0 1865.4 1906.5 2805.5 2009-10 1220.5 1454.3 1658.3 1680.3 1518.8 .. ..Typewriters (Nos.) 2007-08 1465 1386 1360 1411 1266 859 1096 1240 1567 1679 1678 1689 2008-09 952 971 656 954 708 523 610 560 550 610 605 628 2009-10 564 600 635 702 620 .. ..Washing/laundry machines etc. (Nos.) 2007-08 121076 168734 176117 214365 212992 198557 234234 184534 177806 186501 159182 134760 2008-09 124916 159154 154254 217114 196301 224680 271419 222437 200607 194348 205077 174235 2009-10 180074 200275 249741 321284 309295 .. ..Source:- Department of Industrial Policy & Promotion - for IIP data
lEiw.kZ VªSDVj (la[;k) cky o jksyj ch;fjax (nl yk[k la[;k)
L=ksr :- vkS|ksfxd mRiknu lwpdakd ds vkWadM+s
lkj.kh la[;k 6-28% gaór eva½Útaiya maSainari
Table No. 6.28 : Non-electrical Machinery
okf'kax@ykMªh e'khusa (la[;k)
lEiw.kZ VªSDVj (la[;k)
cky o jksyj ch;fjax (nl yk[k la[;k)
d`f"k vkSt+kj (nl yk[k #i;s)
okYol (nl yk[k #i;s)
VkbZi e'khusa (la[;k)
12000140001600018000200002200024000260002800030000320003400036000
Apr 07 Nov 07 Jun 08 Jan 09 Aug 09
Production of Complete tractores(Numbers)
10
15
20
25
30
35
Apr 07 Nov 07 Jun 08 Jan 09 Aug 09
Production of Ball & roller bearings(Mns.)
A)óla maI jaÜna jaÚlaaI Agasta esatambar AVtaÜbar navambar edsambar janavari Prvari maacaý
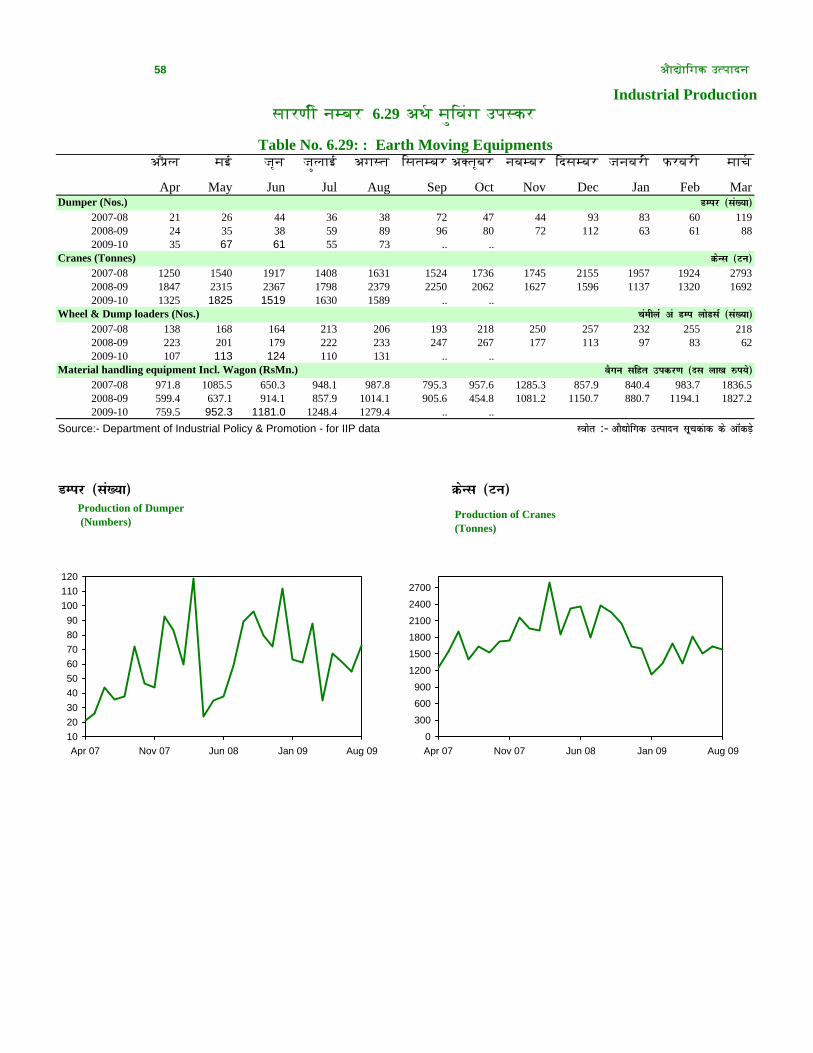
Apr May Jun Jul Aug Sep Oct Nov Dec Jan Feb MarDumper (Nos.)
2007-08 21 26 44 36 38 72 47 44 93 83 60 1192008-09 24 35 38 59 89 96 80 72 112 63 61 882009-10 35 67 61 55 73 .. ..
Cranes (Tonnes)2007-08 1250 1540 1917 1408 1631 1524 1736 1745 2155 1957 1924 27932008-09 1847 2315 2367 1798 2379 2250 2062 1627 1596 1137 1320 16922009-10 1325 1825 1519 1630 1589 .. ..
Wheel & Dump loaders (Nos.)2007-08 138 168 164 213 206 193 218 250 257 232 255 2182008-09 223 201 179 222 233 247 267 177 113 97 83 622009-10 107 113 124 110 131 .. ..
Material handling equipment Incl. Wagon (RsMn.)2007-08 971.8 1085.5 650.3 948.1 987.8 795.3 957.6 1285.3 857.9 840.4 983.7 1836.52008-09 599.4 637.1 914.1 857.9 1014.1 905.6 454.8 1081.2 1150.7 880.7 1194.1 1827.22009-10 759.5 952.3 1181.0 1248.4 1279.4 .. ..
Source:- Department of Industrial Policy & Promotion - for IIP data
MEij (la[;k) ØsUl (Vu)
L=ksr :- vkS|ksfxd mRiknu lwpdakd ds vkWadM+s
58 Aaó½añegak utpaadna
Industrial Production
oSxu lfgr midj.k (nl yk[k #i;s)
MEij (la[;k)
ØsUl (Vu)
saarNei nambar 6.29 ATaý maÚevaöga upaskr
Table No. 6.29: : Earth Moving Equipments
paehyaa va MEi yksMlZ (la[;k)
102030405060708090
100110120
Apr 07 Nov 07 Jun 08 Jan 09 Aug 09
Production of Dumper (Numbers)
0
300
600900
1200
1500
18002100
2400
2700
Apr 07 Nov 07 Jun 08 Jan 09 Aug 09
Production of Cranes(Tonnes)

A)óla maI jaÜna jaÚlaaI Agasta esatambar AVtaÜbar navambar edsambar janavari Prvari maacaý
Apr May Jun Jul Aug Sep Oct Nov Dec Jan Feb MarBoilers (Rs.Million.)
2007-08 3647.0 4731.2 5512.5 4849.2 5767.9 7615.6 7144.8 6900.5 6775.0 7557.4 8134.7 13677.72008-09 4193.7 5721.1 7568.9 6793.2 7453.5 9600.0 7061.5 5558.2 10460.9 7767.6 9432.8 19945.52009-10 4434.7 5733.2 8984.9 8106.4 8310.2 .. ..
Turbines (steam/hydro) (Rs.Million.)2007-08 540.2 1396.4 975.7 1868.7 1128.9 2320.3 2136.2 1144.8 5452.3 2871.3 4003.5 11343.32008-09 931.8 1537.9 3666.4 2985.9 2075.1 5006.6 2333.0 2669.1 3545.9 4040.3 4478.0 8660.12009-10 985.0 1205.6 7696.1 1987.8 1712.1 .. ..
Hydraulic machine/cylinders (Rs.thousand)2007-08 52323 46650 59665 59585 65944 109712 115775 92481 117739 101618 177924 1847872008-09 145484 152065 188027 196412 153273 169116 143610 172123 181340 113374 161859 1604532009-10 138285 166978 174048 140623 147606 .. ..
Diesel engines (Nos.)2007-08 264814 266818 267029 268677 267080 267134 269926 266483 274824 272603 272216 2748662008-09 267796 274438 276574 275594 277890 279650 278681 279171 279836 274951 283053 2900482009-10 273766 273020 271261 277809 277739 .. ..
Source:- Department of Industrial Policy & PromotionDevelopment Commissioner (Small-scale Industries) - for IIP data
ck;ylZ (nl yk[k #i;s) VckZbUl (Hkki o gkbMªks) (nl yk[k #i;s)
gkbZMªksfyd e'khusa@flfyaMlZ (gt+kj #i;s)
Mhty bsatu (la[;k)
L=ksr :- vkS|ksfxd mRiknu lwpdakd ds vkWadM+s
Mhty bsatu (la[;k)
ck;ylZ (nl yk[k #i;s)
VckZbUl (Hkki o gkbMªks) (nl yk[k #i;s)
Aaó½añegak utpaadna 59
saarNei nambr 6.30 )aEma maÜvaýsa
Table No. 6.30: Prime Movers
gkbZMªksfyd e'khusa@flfyaMlZ (gt+kj #i;s)
Industrial Production:
02000400060008000
100001200014000160001800020000
Apr 07 Nov 07 Jun 08 Jan 09 Aug 09
Production of Boilers(Rs.Million.)
0100020003000400050006000700080009000
100001100012000
Apr 07 Nov 07 Jun 08 Jan 09 Aug 09
Production of Turbines (steam/hydro)(Rs.Million.)
20000
80000
140000
200000
260000
320000
380000
440000
Apr 07 Nov 07 Jun 08 Jan 09 Aug 09
Production of Hydraulic machines/cylinders (Rs. thousand)
220000
240000
260000
280000
300000
Apr 07 Nov 07 Jun 08 Jan 09 Aug 09
Production of Diesel engines(Numbers)
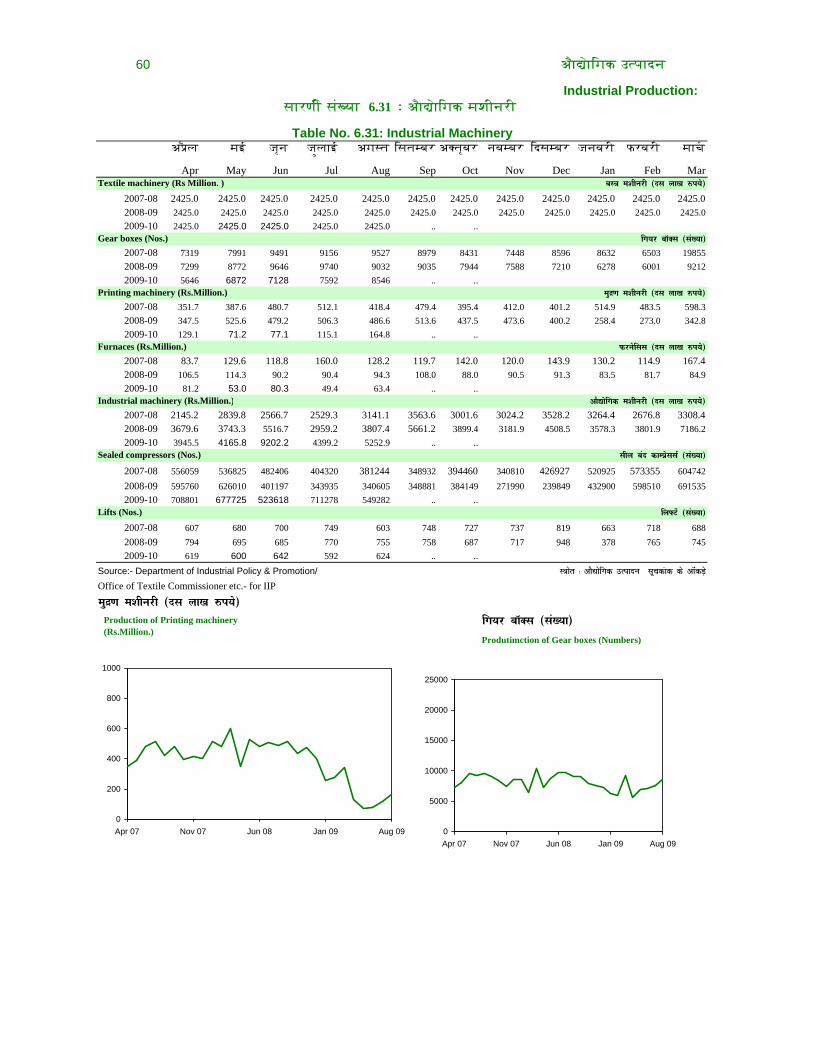
A)óla maI jaÜna jaÚlaaI Agasta esatambar AVtaÜbar navambar edsambar janavari Prvari maacaý
Apr May Jun Jul Aug Sep Oct Nov Dec Jan Feb MarTextile machinery (Rs Million. )
2007-08 2425.0 2425.0 2425.0 2425.0 2425.0 2425.0 2425.0 2425.0 2425.0 2425.0 2425.0 2425.02008-09 2425.0 2425.0 2425.0 2425.0 2425.0 2425.0 2425.0 2425.0 2425.0 2425.0 2425.0 2425.02009-10 2425.0 2425.0 2425.0 2425.0 2425.0 .. ..
Gear boxes (Nos.)2007-08 7319 7991 9491 9156 9527 8979 8431 7448 8596 8632 6503 198552008-09 7299 8772 9646 9740 9032 9035 7944 7588 7210 6278 6001 92122009-10 5646 6872 7128 7592 8546 .. ..
Printing machinery (Rs.Million.)2007-08 351.7 387.6 480.7 512.1 418.4 479.4 395.4 412.0 401.2 514.9 483.5 598.32008-09 347.5 525.6 479.2 506.3 486.6 513.6 437.5 473.6 400.2 258.4 273.0 342.82009-10 129.1 71.2 77.1 115.1 164.8 .. ..
Furnaces (Rs.Million.)2007-08 83.7 129.6 118.8 160.0 128.2 119.7 142.0 120.0 143.9 130.2 114.9 167.42008-09 106.5 114.3 90.2 90.4 94.3 108.0 88.0 90.5 91.3 83.5 81.7 84.92009-10 81.2 53.0 80.3 49.4 63.4 .. ..
Industrial machinery (Rs.Million.)2007-08 2145.2 2839.8 2566.7 2529.3 3141.1 3563.6 3001.6 3024.2 3528.2 3264.4 2676.8 3308.42008-09 3679.6 3743.3 5516.7 2959.2 3807.4 5661.2 3899.4 3181.9 4508.5 3578.3 3801.9 7186.22009-10 3945.5 4165.8 9202.2 4399.2 5252.9 .. ..
Sealed compressors (Nos.)
2007-08 556059 536825 482406 404320 381244 348932 394460 340810 426927 520925 573355 6047422008-09 595760 626010 401197 343935 340605 348881 384149 271990 239849 432900 598510 6915352009-10 708801 677725 523618 711278 549282 .. ..
Lifts (Nos.)
2007-08 607 680 700 749 603 748 727 737 819 663 718 6882008-09 794 695 685 770 755 758 687 717 948 378 765 7452009-10 619 600 642 592 624 .. ..
Source:- Department of Industrial Policy & Promotion/
eqæ.k e'khujh (nl yk[k #i;s)
fx;j ckWDl (la[;k)
oL= e'khujh (nl yk[k #i;s)
fx;j ckWDl (la[;k)
fy¶Vsa (la[;k)
eqæ.k e'khujh (nl yk[k #i;s)
Industrial Production:
60 Aaó½añegak utpaadna
saarNei saöKyaa 6.31 H Aaó½añegak maSainari
Table No. 6.31: Industrial Machinery
Qjusfll (nl yk[k #i;s)
vkS|ksfxd e'khujh (nl yk[k #i;s)
lhy can dkEizsllZ (la[;k)
Office of Textile Commissioner etc.- for IIPL=ksr % vkS|ksfxd mRiknu lwpdakd ds vkWadM+s
0
200
400
600
800
1000
Apr 07 Nov 07 Jun 08 Jan 09 Aug 09
Production of Printing machinery(Rs.Million.)
0
5000
10000
15000
20000
25000
Apr 07 Nov 07 Jun 08 Jan 09 Aug 09
Produtimction of Gear boxes (Numbers)

A)óla maI jaÜna jaÚlaaI Agasta esatambar AVtaÜbar navambar edsambar janavari Prvari maacaý
Apr May Jun Jul Aug Sep Oct Nov Dec Jan Feb MarRefrigerators & air-conditioning (Rs.Million.)
2007-08 57.25 55.68 62.91 70.97 70.04 71.96 67.76 80.55 100.41 108.41 105.72 115.162008-09 61.43 87.86 89.32 98.04 112.68 109.07 85.19 93.56 116.88 119.12 104.21 129.062009-10 80.44 109.85 78.57 71.28 79.71 .. ..
Refrigerators (domestic) ('000 nos)2007-08 767.2 808.3 593.1 442.8 508.3 603.2 652.6 528.1 516.9 561.7 640.6 770.22008-09 815.8 808.5 525.0 544.4 472.6 672.7 709.0 414.4 351.5 584.0 759.7 957.12009-10 924.9 888.0 670.9 694.8 751.9 .. ..
Cooling towers (Rs.Million.)
2007-08 264.1 304.9 365.4 326.8 360.9 295.0 245.6 235.2 485.9 254.3 248.0 369.02008-09 412.0 337.0 369.0 412.5 439.5 391.0 328.0 269.0 435.0 320.0 685.6 1067.52009-10 109.9 256.7 228.5 323.1 280.5 .. ..
Window type air conditioners (Nos.)
2007-08 103317 92582 55249 41352 30367 35128 42005 40096 43204 87700 89725 1123102008-09 132518 112797 48665 23987 17464 25776 35136 27502 16616 61532 114286 1856262009-10 205243 171834 58934 68897 52193 .. ..
rñe(jarñXr va vaataanaÚkÜlana saöyaöÀ (nl laaQa ,payi )
eKa_kinaÚmaa vaataanaÚkÜlak (la[;k)
Saitalak Xavar (nl laaQa ,payi )
Source:- Department of Industrial Policy & Promotion - for IIP data L=ksr % vkS|ksfxd mRiknu lwpdakd ds vkWadM+s
rñe(jarñXr va vaataanaÚkÜlana saöyaöÀ (nl laaQa ,payi )
Industrial Production
Aaó½<egak utpaadna 61
saarNei saöKyaa 6.32 H rñe(jarñXr Aaór vaataanaÚkÜlanaañö
Table No. 6.32: Refrigerators & Air-conditioners
eKa_kinaÚmaa vaataanaÚkÜlak (la[;k)
Saitalak Xavar (nl laaQa ,payi )
0
20
40
60
80
100
120
140
Apr 07 Nov 07 Jun 08 Jan 09 Aug 09
Production of Refrigerators & air conditioning ( Rs. Million.)
150200250300350400450500550600650700750800850900950
1000
Apr 07 Nov 07 Jun 08 Jan 09 Aug 09
Production of Refrigerators (domestic)('000 nos)
100
300
500
700
900
1100
Apr 07 Nov 07 Jun 08 Jan 09 Aug 09
Production of Cooling towers( Rs.Million.)
5000
25000
45000
65000
85000
105000
125000
145000
165000
185000
205000
Apr 07 Nov 07 Jun 08 Jan 09 Aug 09
Production of Window Type Air Conditioners(Numbers)

A)óla maI jaÜna jaÚlaaI Agasta esatambarAVtaÜbar navambar edsambar janavari Prvari maacaý
Apr May Jun Jul Aug Sep Oct Nov Dec Jan Feb Mar
Power driven pumps ('000 nos)2007-08 62.7 64.0 64.3 60.0 66.7 68.6 62.2 62.8 73.1 69.4 65.2 70.92008-09 69.4 73.1 72.2 68.2 103.6 104.9 99.8 98.3 94.8 90.7 118.0 136.72009-10 131.0 147.0 152.2 160.3 160.5 .. ..
Monoblock pumps (Nos.)
2007-08 17013 19774 21483 21820 20889 20239 12770 14267 23987 24511 22147 209542008-09 17373 22214 16454 16675 18268 21479 20823 20257 13930 16614 20805 247872009-10 20869 23918 23290 21443 23290 .. ..
Air and gas compressor (Nos.)
2007-08 10548 10240 11536 10730 10743 11577 10782 8802 10662 10711 10849 102082008-09 9417 11267 10350 10212 9749 10150 9032 8442 8741 7502 5896 50882009-10 6954 8787 8974 9043 8457 .. ..
Pumps & compressors parts and accessories (Rs.Million.)
2007-08 23.00 25.86 26.46 23.83 25.67 30.62 24.73 60.45 28.11 22.30 28.24 35.712008-09 22.34 41.78 48.70 30.47 30.38 38.70 26.05 30.95 39.65 32.10 27.68 34.482009-10 24.89 81.60 26.91 52.55 41.70 .. ..
Source:- Department of Industrial Policy & Promotion
SaeVta caaelata pampa (*000 la[;k) ma<na<blaaVsa pampa (la[;k)
pampa Ovaö dabak kð paÚzañýö (dsa laaQa ,payi )
vaayaÚ va gaósa dabak (la[;k)
Development Commissioner (Small-scale Industries) - for IIP dataL=ksr % vkS|ksfxd mRiknu lwpdakd ds vkWadM+s
pampa Ovaö dabak kð paÚzañýö (dsa laaQa ,payi )
62 Aaó½<egak utpaadna
Table No.6.33: Pumps & Compressors
saarNei saöKyaa 6.33 H pampsa Ovaö dabakIndustrial Production:
ma<na<blaaVsa pampa (la[;k)
vaayaÚ va gaósa dabak (la[;k)
SaeVta caaelata pampa (*000 la[;k)
40
60
80
100
120
140
160
180
200
Apr 07 Nov 07 Jun 08 Jan 09 Aug 09
Production of Power driven pumps(000 nos)
0
5000
10000
15000
20000
25000
30000
Apr 07 Nov 07 Jun 08 Jan 09 Aug 09
Production of Monoblock pumps(Numbers)
9500
11000
12500
14000
Production of Air and gas compressor (Numbers)
40 00
50.00
60.00
70.00
80.00
90.00
Production of Pumps & compressors parts (Rs. Million.)

A)óla maI jaÜna jaÚlaaI Agasta esatambarAVtaÜbar navambar edsambar janavari Prvari maacaý
Apr May Jun Jul Aug Sep Oct Nov Dec Jan Feb MarCutting tools (lathes etc.) ('000 nos)
2007-08 240 255 251 250 244 225 200 202 220 207 215 1662008-09 170 168 208 218 210 197 196 192 1055 993 763 5192009-10 879 878 1094 1085 1017 .. ..
Diamond tools (Nos.)
2007-08 291288 362221 384364 359741 271078 252742 322272 256000 294054 198911 172113 211362
2008-09 325453 351480 299320 270586 179792 291527 236495 267514 274627 132397 107032 246390
2009-10 191441 101985 165408 191217 181567 .. ..Machine tools (IPP) (Rs.Million.)
2007-08 2159.5 2229.2 2297.2 2183.9 2334.9 2306.9 2251.3 2083.6 2350.1 2072.3 2224.9 2420.82008-09 3254.5 3514.8 2068.5 2049.7 1983.4 2044.4 1957.81 2007.61 2142.6 1933.5 1943.2 2246.82009-10 1744.9 1699.5 2091.7 1811.95 1863.07 .. ..
Machine tools (SSI) (Rs.Million.)
2007-08 231.9 232.3 232.4 232.8 233.3 233.8 234.5 235.3 236.1 237.0 237.8 238.12008-09 238.8 239.4 240.0 240.5 241.2 242.2 242.8 243.5 244.5 244.9 245.204 245.92009-10 246.3 247.0 247.0 248.2 248.2 .. ..
kXiga XÜlsa (lañTasa Etyaaed ) ('000 saKyaa )RayamaNR A>zaar (saKyaa )
0
maSaina A>zaar (AaI}pai}pai} ) ( dsa laaKa ,pay< ) maSaina A>zaar (Osa}Osa}AaI ) (dsa laaKa ,pay< )
L=ksr % vkS|ksfxd mRiknu lwpdakd ds vkWadM+sSource:-Department of Industrial Policy & PromotionDevelopment Commissioner (Small-scale Industries) - for IIP data
maSaina A>zaar (Osa}Osa}AaI ) (dsa laaKa ,pay< )
Aaó½<egak utpaadna
saarNei saöKyaa 6.34 H maSainai Aaózaar
Table No. 6.34: Machine Tools
Industrial Production: 63
kXiöga XÜlsa (lañTasa Etyaaed ) ('000 saKyaa )
RayamaNR A>zaar (saKyaa )
maSaina A>zaar (AaI}pai}pai} ) ( dsa laaKa ,pay< )
0100200300400500600700800900
10001100
Apr 07 Nov 07 Jun 08 Jan 09 Aug 09
Production of cutting tools(lathes etc.) (000 nos)
100000150000200000250000300000350000400000450000500000550000600000650000
Apr 07 Nov 07 Jun 08 Jan 09 Aug 09
Production of Diamond tools(Numbers)
16001800200022002400260028003000320034003600
Apr 07 Nov 07 Jun 08 Jan 09 Aug 09
Producion of MachinesTools (IPP)(Rs. Million.)
200
220
240
260
Apr 07 Nov 07 Jun 08 Jan 09 Aug 09
Production of Machine tools (SSI)(Rs. Million.)
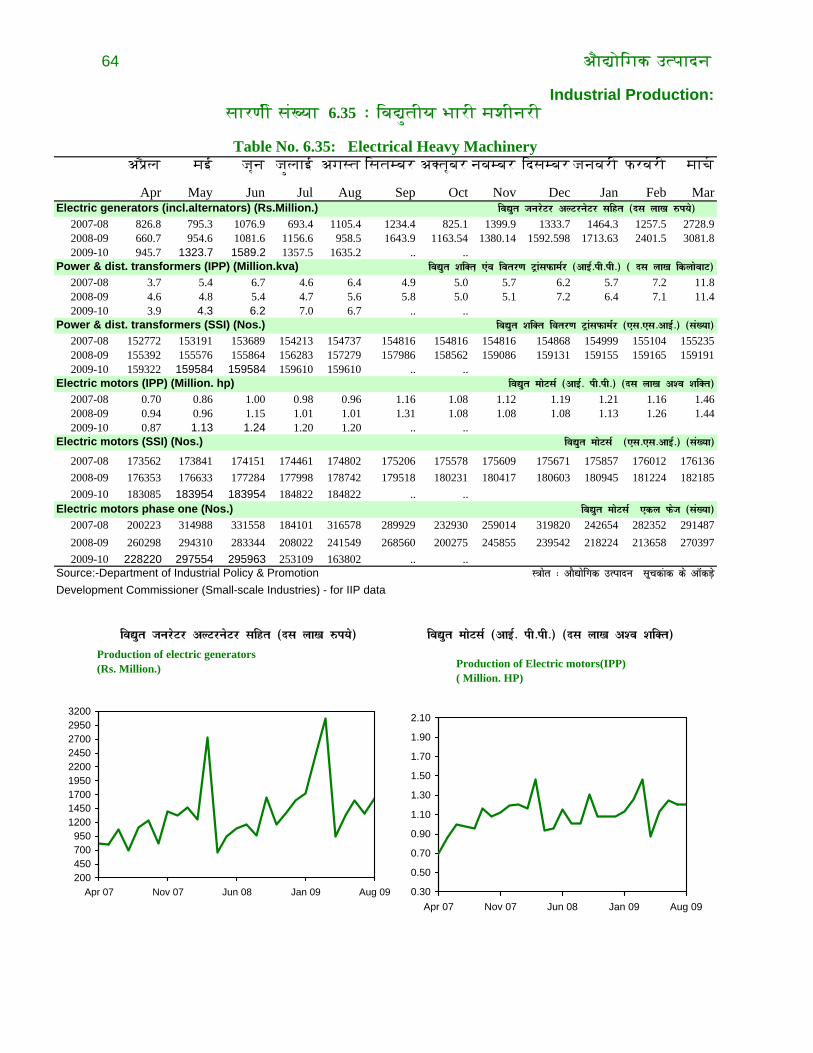
A)óla maI jaÜna jaÚlaaI Agasta esatambar AVtaÜbar navambar edsambar janavari Prvari maacaý
Apr May Jun Jul Aug Sep Oct Nov Dec Jan Feb MarElectric generators (incl.alternators) (Rs.Million.)
2007-08 826.8 795.3 1076.9 693.4 1105.4 1234.4 825.1 1399.9 1333.7 1464.3 1257.5 2728.9 2008-09 660.7 954.6 1081.6 1156.6 958.5 1643.9 1163.54 1380.14 1592.598 1713.63 2401.5 3081.82009-10 945.7 1323.7 1589.2 1357.5 1635.2 .. ..
Power & dist. transformers (IPP) (Million.kva) 2007-08 3.7 5.4 6.7 4.6 6.4 4.9 5.0 5.7 6.2 5.7 7.2 11.8 2008-09 4.6 4.8 5.4 4.7 5.6 5.8 5.0 5.1 7.2 6.4 7.1 11.42009-10 3.9 4.3 6.2 7.0 6.7 .. ..
Power & dist. transformers (SSI) (Nos.) 2007-08 152772 153191 153689 154213 154737 154816 154816 154816 154868 154999 155104 155235 2008-09 155392 155576 155864 156283 157279 157986 158562 159086 159131 159155 159165 1591912009-10 159322 159584 159584 159610 159610 .. ..
Electric motors (IPP) (Million. hp) 2007-08 0.70 0.86 1.00 0.98 0.96 1.16 1.08 1.12 1.19 1.21 1.16 1.46 2008-09 0.94 0.96 1.15 1.01 1.01 1.31 1.08 1.08 1.08 1.13 1.26 1.442009-10 0.87 1.13 1.24 1.20 1.20 .. ..
Electric motors (SSI) (Nos.) 2007-08 173562 173841 174151 174461 174802 175206 175578 175609 175671 175857 176012 176136 2008-09 176353 176633 177284 177998 178742 179518 180231 180417 180603 180945 181224 1821852009-10 183085 183954 183954 184822 184822 .. ..
Electric motors phase one (Nos.) 2007-08 200223 314988 331558 184101 316578 289929 232930 259014 319820 242654 282352 291487 2008-09 260298 294310 283344 208022 241549 268560 200275 245855 239542 218224 213658 2703972009-10 228220 297554 295963 253109 163802 .. ..
Development Commissioner (Small-scale Industries) - for IIP data
fo|qr tujsVj vYVjusVj lfgr (nl yk[k #i;s) fo|qr eksVlZ (vkbZ- ih-ih-) (nl yk[k v'o 'kfDr)
fo|qr eksVlZ (,l-,l-vkbZ-) (la[;k)
fo|qr eksVlZ ,dy Qst (la[;k)
fo|qr 'kfDr+ ,ao forj.k VªkalQkeZj (vkbZ-ih-ih-) ( nl yk[k fdyksokV)
L=ksr % vkS|ksfxd mRiknu lwpdakd ds vkWadM+s
fo|qr eksVlZ (vkbZ- ih-ih-) (nl yk[k v'o 'kfDr)
Source:-Department of Industrial Policy & Promotion
64 Aaó½<egak utpaadna
saarNei saöKyaa 6.35 H eva½Útaiya Baari maSainari
Table No. 6.35: Electrical Heavy Machinery
fo|qr 'kfDr forj.k VªkalQkeZj (,l-,l-vkbZ-) (la[;k)
Industrial Production:
fo|qr tujsVj vYVjusVj lfgr (nl yk[k #i;s)
200450700950
120014501700195022002450270029503200
Apr 07 Nov 07 Jun 08 Jan 09 Aug 09
Production of electric generators(Rs. Million.)
0.30
0.50
0.70
0.90
1.10
1.30
1.50
1.70
1.90
2.10
Apr 07 Nov 07 Jun 08 Jan 09 Aug 09
Production of Electric motors(IPP) ( Million. HP)

A)óla maI jaÜna jaÚlaaI Agasta esatambar AVtaÜbar navambar edsambar janavari Prvari maacaý
Apr May Jun Jul Aug Sep Oct Nov Dec Jan Feb MarSwitchgear (circuit breakers) (Nos.)
2007-08 1332381 1484097 1698277 1685018 1714215 1647822 1851413 1475936 1686574 1157059 1431018 17746982008-09 1473634 1845607 1827226 1607684 1841220 1809624 1395731 1199762 1113002 1077351 1165166 13728422009-10 1274521 1255053 1597749 1433819 1372946 .. ..
Motor starters and contactors ('000 nos)2007-08 615.82 714.95 718.35 721.60 756.07 675.05 718.44 685.15 591.72 611.58 603.86 1326.822008-09 760.24 1576.91 1251.24 859.12 814.99 832.90 637.59 714.68 668.18 590.69 587.69 588.712009-10 469.51 679.20 649.09 697.65 726.43 .. ..
Control panels/boards/disks (Rs.Mn.)
2007-08 500.42 581.62 945.93 681.72 900.34 953.93 606.67 760.17 842.23 813.38 742.56 1584.102008-09 639.27 640.73 809.29 696.39 831.25 1287.33 475.04 712.99 717.51 427.07 756.77 1147.542009-10 501.20 510.55 639.52 605.03 836.06 .. ..
Stamping (lamination) (Tonnes)
2007-08 4193 4807 4583 4309 4988 4346 4560 4354 5147 4875 4836 48142008-09 4495 4805 4378 5132 5258 6232 5865 5681 5726 6324 5164 53702009-10 4919 5723 5478 5688 5540 .. ..
Power capacitors (Kvar)2007-08 900327 733828 984889 783916 1056301 866768 1010450 1093694 937331 814812 870884 11942642008-09 868083 1652311 1047492 1015707 952914 1034106 1096682 741034 848657 991901 1134371 11165292009-10 908069 1076125 1694682 1332391 899216 .. ..
Protection system/switch board etc. (Rs.thousand)
2007-08 338057 411465 437915 404933 496031 490109 414507 393353 505726 535382 486235 7041962008-09 400069 473061 482101 496123 556799 529472 363964 505180 454014 449662 563674 7246882009-10 355986 404171 544254 488215 567801 .. ..
fLop fx;j (lfdZV cszdlZ) (la[;k) fo|qr 'kfDr la/kkfjr (d-o-v-j-)
fu;a=.k iSuy@cksM+Z@fMLd (nl yk[k #i;s)
Source:- Department of Industrial Policy & Promotion - for IIP data
LVsfEiax (ysfeus'ku) (Vu)
fo|qr 'kfDr la/kkfjr (d-o-v-j-)
lqj{kk iz.kkyh@ fLop cksMZ Etyaaed (gt+kj #i;s)
L=ksr % vkS|ksfxd mRiknu lwpdakd ds vkWadM+s
Aaó½<egak utpaadna 65
Industrial Production:
fLop fx;j (lfdZV cszdlZ) (la[;k)
eksVj LVkVZj vkSj dkUVsDVlZ (*000 la[;k)
saarNei saöKyaa 6.36 H esvaca eva½Úta SaeVta saöDaaer*a Aaór sXñempaöga
Table No. 6.36:Switches, Power Capacitors and Stampings
800000
1000000
1200000
1400000
1600000
1800000
2000000
Apr 07 Nov 07 Jun 08 Jan 09 Aug 09
Production of Switchgear(circuit breakers)(Numbers)
0200000400000600000800000
10000001200000140000016000001800000
Apr 07 Nov 07 Jun 08 Jan 09 Aug 09
Production of Power Capacitors (Kvar)

A)óla maI jaÜna jaÚlaaI Agasta esatambar AVtaÜbar navambar edsambar janavari Prvari maacaý
Apr May Jun Jul Aug Sep Oct Nov Dec Jan Feb MarACSR/AA conductors (Tonnes)
2007-08 1591 1291 1347 1302 1150 1209 1461 1392 1458 1344 1340 13022008-09 1189 1389 928 1110 947 1290 1208 1398 1636 2225 2054 20332009-10 2056 2086 2593 2639 2663 .. ..
PVC/PICL ('000 metres)2007-08 4097 5344 6397 5490 5482 6208 4004 4061 6097 4818 4900 57802008-09 3467 3636 10389 10395 9742 6241 3888 4283 3605 3782 4229 69652009-10 5488 5097 4699 5036 4345 .. ..
Winding wires (Tonnes)2007-08 2336 2445 2373 2515 2346 2316 2358 2211 2428 2416 2442 26632008-09 2548 2714 2530 2690 2400 2396 2468 2507 2272 2370 2416 27932009-10 2574 2587 2722 2783 2600 .. ..
Insulated cables/wires (Billion Kms)
2007-08 758.82 1900.76 2156.93 1683.06 2488.03 2488.19 3214.11 4571.34 1668.89 693.25 1035.40 3138.262008-09 3537.96 3634.24 4906.50 4621.63 3442.82 4089.52 3972.76 7047.25 592.27 8374.05 5249.75 2372.242009-10 2669.09 3907.84 3725.81 4352.56 5121.03 .. ..
Telecommunication cables (Mn.metres)2007-08 465.8 448.1 496.8 516.3 642.5 554.7 486.6 956.6 951.2 778.9 986.2 729.52008-09 635.3 585.3 448.3 509.5 943.8 759.9 661.7 550.7 592.3 437.6 450.9 497.92009-10 464.1 474.5 437.9 448.5 491.2 .. ..
Storage batteries (Mn. nos)2007-08 3.30 3.16 3.39 3.29 3.62 3.73 3.60 3.43 3.39 3.36 3.34 3.382008-09 3.28 3.69 3.47 3.68 3.72 3.86 3.63 3.75 3.70 3.18 3.17 3.932009-10 3.76 4.05 4.10 4.40 4.46 .. ..
Dry cells (Mill.nos)2007-08 212.3 212.1 222.7 224.8 214.9 212.8 212.4 209.1 223.0 208.2 183.1 183.02008-09 177.8 180.2 198.0 208.8 191.6 183.8 160.5 171.2 170.7 166.8 168.9 168.32009-10 151.0 165.5 186.4 178.0 175.0 .. ..
,-lh-,l-vkj-@,-,- dUM~DVlZ (Vu) MªkbZlSy cSVfj;ka (nl yk[k la[;k)
cSVjh Hk.Mkj (nl yk[k la[;k)
L=ksr % vkS|ksfxd mRiknu lwpdakd ds vkWadM+s
MªkbZlSy cSVfj;ka (nl yk[k la[;k)
Source:- Department of Industrial Policy & Promotion - for IIP data
cka/kus dk rkj ( Vu)
bUlqysVM dscYl @ rkj ( vjc ek.mai )
nwjlapkj rkj (nl yk[k ehVj)
66 Aaó½<egak utpaadna
Industrial Production:
ih-oh-lh- @ ih-vkbZ-lh-,y- (*000 ehVj)
saarNei saöKyaa 6.37 H dscYl taar Aaór baóXeryaaö
Table No.6.37: Cables, Wires and Batteries
,-lh-,l-vkj-@,-,- dUM~DVlZ (Vu)
500
1000
1500
2000
2500
3000
3500
4000
Apr 07 Nov 07 Jun 08 Jan 08 Aug 09
Production of ACSR/AA conductors(Tonnes)
140
160
180
200
220
240
260
280
Apr 07 Nov 07 Jun 08 Jan 08 Aug 09
Production of Dry cells (Million nos)

A)óla maI jaÜna jaÚlaaI Agasta esatambar AVtaÜbar navambar edsambar janavari Prvari maacaý
Apr May Jun Jul Aug Sep Oct Nov Dec Jan Feb Mar
2007-08 1.01 1.14 1.08 0.97 0.88 0.84 0.81 0.86 0.97 1.03 1.06 1.092008-09 1.04 1.16 1.07 0.95 0.88 0.89 0.84 0.76 0.82 0.96 1.04 1.132009-10 0.98 1.07 1.06 1.07 1.00 .. ..
2007-08 18.18 18.10 17.60 18.29 18.43 17.99 18.35 17.09 18.64 18.40 16.71 17.142008-09 15.92 16.23 16.87 18.86 17.51 17.78 16.55 15.79 14.92 15.43 15.88 15.772009-10 17.36 18.69 19.88 21.76 22.78 .. ..
2007-08 37.6 37.9 36.2 37.2 36.1 34.2 34.3 35.5 35.3 35.4 36.2 35.02008-09 33.9 35.0 33.7 34.1 34.7 35.6 34.6 34.4 35.4 38.2 37.3 40.62009-10 37.5 37.8 36.9 37.7 35.4 .. ..
2007-08 5696 5826 5483 5733 6064 6525 6582 5688 6159 6018 6746 66692008-09 6419 6217 6192 6213 6202 6218 6213 6194 6143 5944 5983 59812009-10 5224 5703 5926 5684 6366 .. ..
2007-08 38.3 38.3 38.3 38.3 38.3 38.3 38.3 38.3 38.3 38.3 38.3 38.32008-09 38.3 38.3 38.3 38.3 38.3 38.3 38.3 38.3 38.3 38.3 38.3 38.32009-10 38.3 38.3 38.3 38.3 38.3 .. ..
Source:- Department of Industrial Policy & Promotion
fo|qrh; ia[ks (nl yk[k la[;k) iz}hfIr'khy V~;wcsa (nl yk[k la[;k)
vkVks ySEil (*000 la[;k)
Development Commissioner (Small-scale Industries) - for IIP data
iz}hfIr'khy V~;wcsa (nl yk[k la[;k)
saarNei saöKyaa 6.38 H eva½Úteiya upakrNañö
Table No. 6.38: Electrical Appliances
jks'kuh] fQfVax ,oa tqM+ukj (nl yk[k #i;s)
fo|qrh; ia[ks (nl yk[k la[;k)
Aaó½<egak utpaadna 67
Industrial Production:
L=ksr % vkS|ksfxd mRiknu lwpdakd ds vkWadM+s
Lighting, fitting & fixtures (Rs.Million.)
Electric fans (Million. nos)
Fluorescent tubes (Million. nos)
GLS lamps (Million.nos)
Auto lamps ('000 nos)
th- ,y-,l- ySai (nl yk[k la[;k)
vkVks ySEil (*000 la[;k)
0.6
0.7
0.8
0.9
1
1.1
1.2
1.3
Apr 07 Nov 07 Jun 08 Jan 09 Aug 09
Production of Electric fans(Million. nos)
13
15
17
19
21
23
25
Apr 07 Nov 07 Jun 08 Jan 09 Aug 09
Production of Fluorescent tubes(Million nos)
5000
5500
6000
6500
7000
Apr 07 Nov 07 Jun 08 Jan 09 Aug 09
Production ofAuto lamps(Thousands nos.)

A)óla maI jaÜna jaÚlaaI Agasta esatambar AVtaÜbar navambar edsambar janavari Prvari maacaý
Apr May Jun Jul Aug Sep Oct Nov Dec Jan Feb MarTV receivers ('000 nos)
2007-08 421.2 445.9 456.9 448.8 537.5 550.0 633.8 526.9 413.0 459.2 480.1 394.62008-09 433.0 490.9 495.5 531.0 705.1 755.3 773.5 626.1 669.0 738.0 691.1 665.82009-10 673.5 717.6 759.0 878.6 980.1 ..
Tape recorders ('000 nos)2007-08 1.1 1.1 1.1 1.1 1.1 1.1 1.1 1.1 1.1 1.1 1.1 1.12008-09 1.1 1.1 1.1 1.1 1.1 1.1 1.1 1.1 1.1 1.1 1.1 1.12009-10 1.1 1.1 1.1 1.1 1.1 ..
TV picture tubes ('000 nos)2007-08 580.5 550.0 498.0 576.0 644.0 550.8 665.5 530.3 521.3 559.3 487.9 326.62008-09 430.3 554.3 535.4 522.5 560.2 589.4 621.2 507.3 565.0 542.1 653.1 702.32009-10 732.4 770.1 794.8 801.6 794.8 ..
Electrolytic capacitors (Mn.nos)2007-08 66.0 73.4 74.9 74.1 73.4 76.0 75.3 71.1 72.7 68.2 65.0 80.32008-09 65.2 61.7 63.9 68.3 66.2 69.8 74.6 67.5 72.3 63.7 64.3 87.42009-10 65.7 67.2 66.7 66.7 67.8 ..
2007-08 378 386 334 329 353 339 378 332 397 423 480 4782008-09 252 315 298 249 249 318 308 285 258 410 388 4822009-10 417 402 295 234 229 ..
Computer system & peripherals (Rs.Mn.)2007-08 5384.5 6038.0 3907.6 3074.6 3802.6 3549.9 2448.0 2502.4 3026.7 2144.7 1992.4 4139.62008-09 1649.3 2294.8 2618.8 2194.9 2434.4 3169.3 2528.9 2861.3 2459.8 1810.7 1889.5 3679.6592009-10 1828.3 2333.8 3119.9 2347.0 2757.0 ..
Source:- Department of Industrial Policy & Promotion - for IIP data
nwjHkk"k ;U= (*000 la[;k)
nwjn'kZu xzkgh;U= (*000 la[;k)
L=ksr % vkS|ksfxd mRiknu lwpdakd ds vkWadM+s
lax.kd flLVe vkSj iSjhQsjYl (nl yk[k #i;s)
Vsi fjdkMZlZ (*000 la[;k)
fo|qfr; la/kkfj= (nl yk[k la[;k)
nwjHkk"k ;U= (*000 la[;k)
nwjn'kZu fiDpj V~;wc (*000 la[;k)
Telephone instruments ('000 nos)
saarNei saöKyaa 6.39 H ElaóVVªkenak oLrq ,ao dÜrsaöcaar upaskr
Table N0.6.39 -Electronic Goods &Telecommunication Equipments
68 Aaó½<egak utpaadna
Industrial Production:
nwjn'kZu xzkgh;U= (*000 la[;k)
0100200300400500600700800900
1000
Apr 07 Nov 07 Jun 08 Jan 09 Aug 09
Production of TV receivers(`000 nos)
0
200
400
600
800
1000
Apr 07 Nov 07 Jun 08 Jan 09 Aug 09
Production of Telephoneinstruments (`000 nos)

A)óla maI jaÜna jaÚlaaI Agasta esatambar AVtaÜbar navambar edsambar janavari Prvari maacaý
Apr May Jun Jul Aug Sep Oct Nov Dec Jan Feb MarShip building and repair (Rs.Million.)
2007-08 1224.7 2010.0 2025.7 2354.4 2776.2 1736.7 1885.4 4457.5 2212.8 3432.4 3522.3 5193.62008-09 1530.0 3830.3 1922.9 2622.4 2460.8 3707.8 2782.2 2712.6 3610.9 3207.6 1909.8 7351.52009-10 3174.2 3122.4 3610.2 3569.8 4079.8 .. ..
Auto ancillary & parts (Rs.Million.)2007-08 12381 12627 12550 12433 12706 12652 13288 12818 13538 14365 14337 160422008-09 14808 15366 15363 15720 16770 17107 13929 12812 10775 10047 11172 133282009-10 12721 13189 13289 14233 14372 .. ..
Locomotives (Nos.)2007-08 24 29 36 33 37 38 37 35 35 40 37 412008-09 32 39 37 28 32 33 43 48 48 47 43 492009-10 20 27 40 44 46 .. ..Broad gauge covered wagons (Nos.)
2007-08 137 240 221 262 194 81 51 93 198 139 140 1262008-09 122 110 160 149 107 207 267 27 113 101 57 1502009-10 86 141 173 204 277 .. ..
Broad gauge passenger carriage (Nos.)2007-08 141 220 277 208 237 309 275 293 315 253 266 3072008-09 207 224 223 250 267 264 226 252 347 235 285 3842009-10 205 225 319 268 237 .. ..
Wheel and axles complete set (Nos.)2007-08 3133 3671 3162 1789 730 1755 1648 4700 4754 4532 5025 56102008-09 5182 5250 5612 7201 5150 6005 5078 5352 5001 5600 5575 36692009-10 895 4747 6209 6810 6205 .. ..
Auto springs (Tonnes)2007-08 1355 1513 1452 1550 1514 1432 1397 1408 1495 1467 1438 16162008-09 1330 1493 1517 1590 1456 1477 1339 1365 1305 1414 1425 16962009-10 1351 1382 1514 1532 1519 .. ..
Source:- Department of Industrial Policy & Promotion/Railway Board - for IIP data
leqæh tgkt fuekZ.k vkSj marmmata (nl yk[k #i;s) vkVks vuq"kaxh rFkk iqt+sZ (nl yk[k #i;s)
yksdkseksfVo (la[;k)
cM+h ykbZu osxu (la[;k)
Aaó½<egak utpaadna 69
Industrial Production
vkVks vuq"kaxh rFkk iqt+sZ (nl yk[k #i;s)
saraNei saöKyaa 6.40 H paervahna upaskr
Table No. 6.40: Transport Equipment
leqæh tgkt fuekZ.k vkSj marmmata (nl yk[k #i;s)
ifg;k o èkzqjh (la[;k)
cM+h ykbu ij ys tkbZ xbZ lokjh (la[;k)
L=ksr % vkS|ksfxd mRiknu lwpdakd ds vkWadM+s
vkVks fLizax (eh-Vu)
50010001500200025003000350040004500500055006000650070007500
Apr 07 Nov 07 Jun 08 Jan 09 Aug 09
Production of Ship building and repair (Rs. Million.)
80009000
10000110001200013000140001500016000170001800019000
Apr 07 Nov 07 Jun 08 Jan 09 Aug 09
Production of Auto ancillary & parts( Rs. Million.)
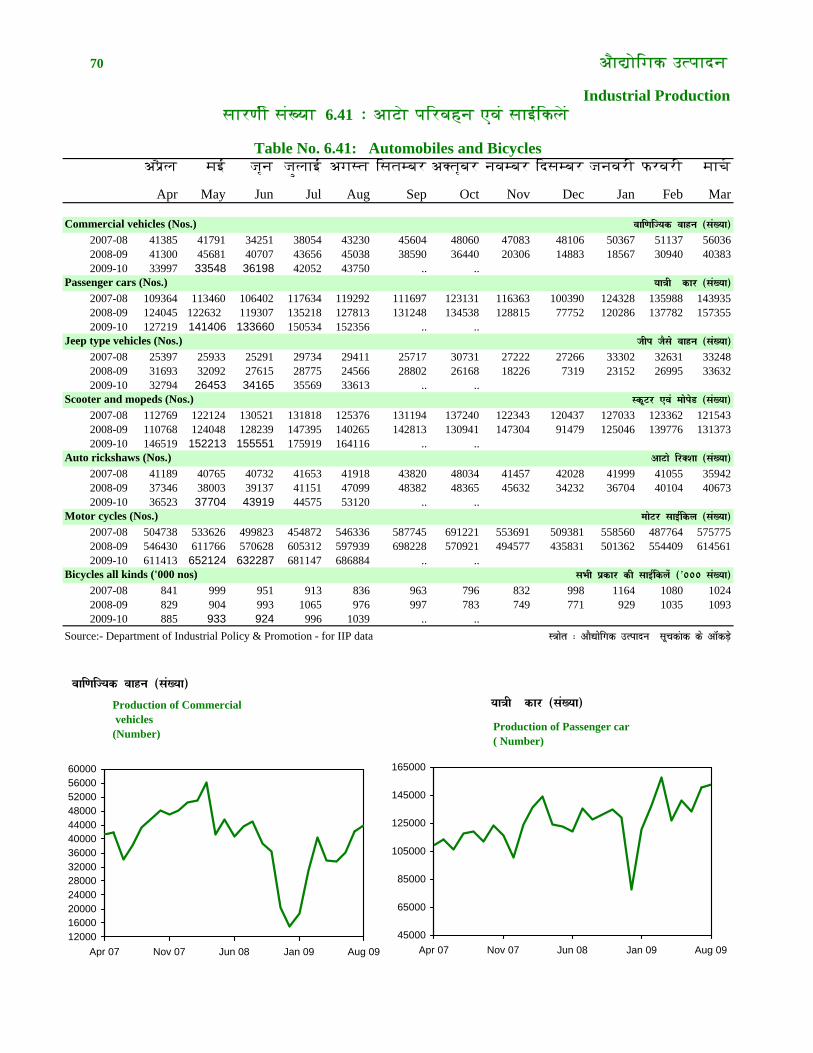
70
A)óla maI jaÜna jaÚlaaI Agasta esatambar AVtaÜbar navambar edsambar janavari Prvari maacaý
Apr May Jun Jul Aug Sep Oct Nov Dec Jan Feb Mar
Commercial vehicles (Nos.)2007-08 41385 41791 34251 38054 43230 45604 48060 47083 48106 50367 51137 560362008-09 41300 45681 40707 43656 45038 38590 36440 20306 14883 18567 30940 403832009-10 33997 33548 36198 42052 43750 .. ..
Passenger cars (Nos.)2007-08 109364 113460 106402 117634 119292 111697 123131 116363 100390 124328 135988 1439352008-09 124045 122632 119307 135218 127813 131248 134538 128815 77752 120286 137782 1573552009-10 127219 141406 133660 150534 152356 .. ..
Jeep type vehicles (Nos.)2007-08 25397 25933 25291 29734 29411 25717 30731 27222 27266 33302 32631 332482008-09 31693 32092 27615 28775 24566 28802 26168 18226 7319 23152 26995 336322009-10 32794 26453 34165 35569 33613 .. ..
Scooter and mopeds (Nos.)2007-08 112769 122124 130521 131818 125376 131194 137240 122343 120437 127033 123362 1215432008-09 110768 124048 128239 147395 140265 142813 130941 147304 91479 125046 139776 1313732009-10 146519 152213 155551 175919 164116 .. ..
Auto rickshaws (Nos.)2007-08 41189 40765 40732 41653 41918 43820 48034 41457 42028 41999 41055 359422008-09 37346 38003 39137 41151 47099 48382 48365 45632 34232 36704 40104 406732009-10 36523 37704 43919 44575 53120 .. ..
Motor cycles (Nos.)2007-08 504738 533626 499823 454872 546336 587745 691221 553691 509381 558560 487764 5757752008-09 546430 611766 570628 605312 597939 698228 570921 494577 435831 501362 554409 6145612009-10 611413 652124 632287 681147 686884 .. ..
Bicycles all kinds ('000 nos)2007-08 841 999 951 913 836 963 796 832 998 1164 1080 10242008-09 829 904 993 1065 976 997 783 749 771 929 1035 10932009-10 885 933 924 996 1039 .. ..
okf.kfT;d okgu (la[;k)
;k=h dkj (la[;k)
lHkh izdkj dh lkbZfdysa (*000 la[;k)
Industrial Production
L=ksr % vkS|ksfxd mRiknu lwpdakd ds vkWadM+sSource:- Department of Industrial Policy & Promotion - for IIP data
Aaó½<egak utpaadna
;k=h dkj (la[;k)
eksVj lkbZfdy (la[;k)
saarNei saöKyaa 6.41 H AaXañ paervahna Ovaö saaIeklañö
Table No. 6.41: Automobiles and Bicycles
okf.kfT;d okgu (la[;k)
thi tSls okgu (la[;k)
LdwVj ,oa eksisM (la[;k)
vkVks fjD'kk (la[;k)
12000160002000024000280003200036000400004400048000520005600060000
Apr 07 Nov 07 Jun 08 Jan 09 Aug 09
Production of Commercial vehicles(Number)
45000
65000
85000
105000
125000
145000
165000
Apr 07 Nov 07 Jun 08 Jan 09 Aug 09
Production of Passenger car( Number)

A)óla maI jaÜna jaÚlaaI Agasta esatambar AVtaÜbar navambar edsambar janavari Prvari maacaý
Apr May Jun Jul Aug Sep Oct Nov Dec Jan Feb MarMedical and surgical instruments (Rs.Mn.)
2007-08 187.2 254.9 297.2 216.1 304.1 258.2 313.9 318.7 305.6 250.1 246.8 345.02008-09 188.5 226.1 220.5 245.8 228.4 252.5 216.8 244.9 251.4 335.3 442.1 354.12009-10 176.4 162.3 192.5 203.2 347.1 .. ..
Laboratory and scientific inst. (Rs.Mn.)2007-08 28.6 26.0 51.6 34.6 36.4 60.3 30.4 80.0 82.7 22.0 22.1 70.82008-09 35.2 20.5 21.3 45.8 36.5 81.6 64.3 46.5 138.6 18.1 22.3 33.32009-10 20.2 43.3 65.9 39.1 27.7 .. ..
Syringes (All Kinds) (Rs.Mn.)2007-08 118.7 128.4 134.3 147.1 129.4 142.8 163.5 164.3 177.7 177.1 155.8 145.92008-09 146.4 142.8 153.9 173.2 157.8 184.6 171.2 200.7 211.1 205.6 192.5 195.32009-10 188.1 180.2 183.6 189.9 168.0 .. ..
Process control instruments (Rs.Mn.)2007-08 173.1 258.8 308.3 183.2 320.3 599.0 180.1 287.4 579.9 358.1 604.1 864.52008-09 200.5 290.5 402.1 232.0 314.7 484.0 269.9 270.8 662.2 143.5 173.2 260.22009-10 145.7 168.2 231.7 207.3 182.4 .. ..
2007-08 0.15 0.22 0.10 0.14 0.09 0.14 0.15 0.10 0.11 0.14 0.13 0.222008-09 0.09 0.11 0.12 0.10 0.12 0.12 0.07 0.11 0.09 0.12 0.10 0.082009-10 0.09 0.16 0.15 0.17 0.20 .. ..
Alarm time pieces ('000 nos)2007-08 34 34 34 34 34 34 34 34 34 34 34 342008-09 34 34 34 34 34 34 34 34 34 34 34 342009-10 34 34 34 34 34 .. ..
Wrist watches ('000 nos)2007-08 721 1184 1188 947 1119 1125 1152 957 1021 1078 1178 9662008-09 623 968 1118 1153 1164 1231 1254 1045 1112 890 721 6482009-10 537 792 862 1163 1043 .. ..
Writing instruments (Rs.thousand)2007-08 59781 59352 64289 58039 59494 70954 58324 50201 40214 34554 48263 553112008-09 49055 55875 53690 54897 43421 53677 46809 48343 39710 33818 40830 457602009-10 47303 65275 64576 64909 61724 .. ..
Pencils (SSI) (Rs.thousand)2007-08 10131 10138 10146 10154 10164 10174 10206 10206 10236 10270 10310 103242008-09 10340 10367 10391 10417 10437 10464 10470 10473 10478 10480 10502 105072009-10 10510 10513 10513 10517 10517 .. ..
saarNei saöKyaa 6.42 H Anya evaenamaaýNakari u½añga
Aaó½<egak utpaadna
Industrial Production: 71
iSaflysa (,l-,l-vkbZ-) (gt+kj #i;s)
fpfDRlk ,oa 'kY; ;a= (nl yk[k #i;s)
ys[ku lkexzh (gt+kj #i;s)
Table No. 6.42: Other Manufacturing Industries
,ykeZ ?kfM+;ka (*000 la[;k)
izfDr;k fu;a=d ;a= (nl yk[k #i;s)
iz;ksx'kkyk ,oa oSKkfud ;a= (nl yk[k #i;s)
dykbZ ?kfM+;ka (*000 la[;k)
lwbZ;ak (lHkh izdkj dh) (nl yk[k #i;s)
L=ksr % vkS|ksfxd mRiknu lwpdakd ds vkWadM+sSource:- Department of Industrial Policy & Promotion - for IIP data
,- lh- flxay -Qst ?kjsyw ehVj (nl yk[k dh la[;k)A.C Single phase domestic meters (Mn.nos)

A)óla maI jaÜna jaÚlaaI Agasta esatambar AVtaÜbar navambar edsambar janavari Prvari maacaý
Apr May Jun Jul Aug Sep Oct Nov Dec Jan Feb MarGeneral Index (100.000)
2007-08 250.7 263.1 255.3 255.0 260.3 260.5 262.6 261.0 284.7 281.9 276.2 304.92008-09 266.3 274.6 269.2 271.3 264.7 276.2 261.7 265.5 279.1 284.8 276.8 305.92009-10 269.5 280.3 290.2 290.9 292.3 .. ..
1.1 Manufacturing (79.358)2007-08 267.1 280.5 273.6 272.9 279.2 281.0 280.2 278.9 306.3 301.9 296.8 327.92008-09 285.0 293.1 290.4 291.6 284.0 298.4 277.1 283.8 298.6 304.8 297.4 326.92009-10 286.2 298.5 311.5 313.2 313.0 .. ..
1.2 Mining & quarrying (10.473)2007-08 161.2 168.1 158.6 157.0 156.0 154.0 169.6 174.2 184.1 186.7 183.6 205.82008-09 171.1 177.4 158.8 161.4 160.4 162.9 175.1 174.8 186.0 188.1 183.2 209.82009-10 177.7 183.4 183.3 175.9 181.1 .. ..
1.3 Electricity (10.169)2007-08 215.2 225.6 211.7 216.2 219.9 210.1 221.4 210.9 219.6 223.8 211.3 227.12008-09 218.2 230.1 217.1 225.9 221.6 219.3 231.2 216.4 223.1 227.9 212.7 241.32009-10 233.6 237.6 234.4 235.4 245.1 .. ..
Contd.
lkekU; lwpdkad (100-000) fofuekZ.k (79-358)
[kuu rFkk mR[kuu (10-473)Mining & quarrying(Base: 1993-94=100) fctyh (10-169)
Electricity(Base: 1993-94=100)
72 Aaó½<egak utpaadna
Industrial Production:
lkekU; lwpdkad (100-000)
saarNei saöKyaa 6.43 Aaó½<egak utpaadna kñ saÜcakaök
Table No. 6.43 : Index Numbers of Industrial Production: (Base: 1993-94=100/AaDaar:1993-94=100)
1.1 fofuekZ.k (79-358)
1.2 [kuu rFkk mR[kuu (10-473)
1.3 fctyh (10-169)
Source: Central Statistical Organisation L=ksr % dsUnzh; lkaf[;dh; laxBu
160170180190200210220230240250260270280290300310
Apr 07 Nov 07 Jun 08 Jan 09 Aug 09
General Index (Base: 1993-94=100)
170
190
210
230
250
270
290
310
330
Apr 07 Nov 07 Jun 08 Jan 09 Aug 09
Manufacturing (Base: 1993-94=100)
Jun 06100
150
200
250
Apr 07 Nov 07 Jun 08 Jan 09 Aug 09 160
180
200
220
240
260
Apr 07 Nov 07 Jun 08 Jan 09 Aug 09
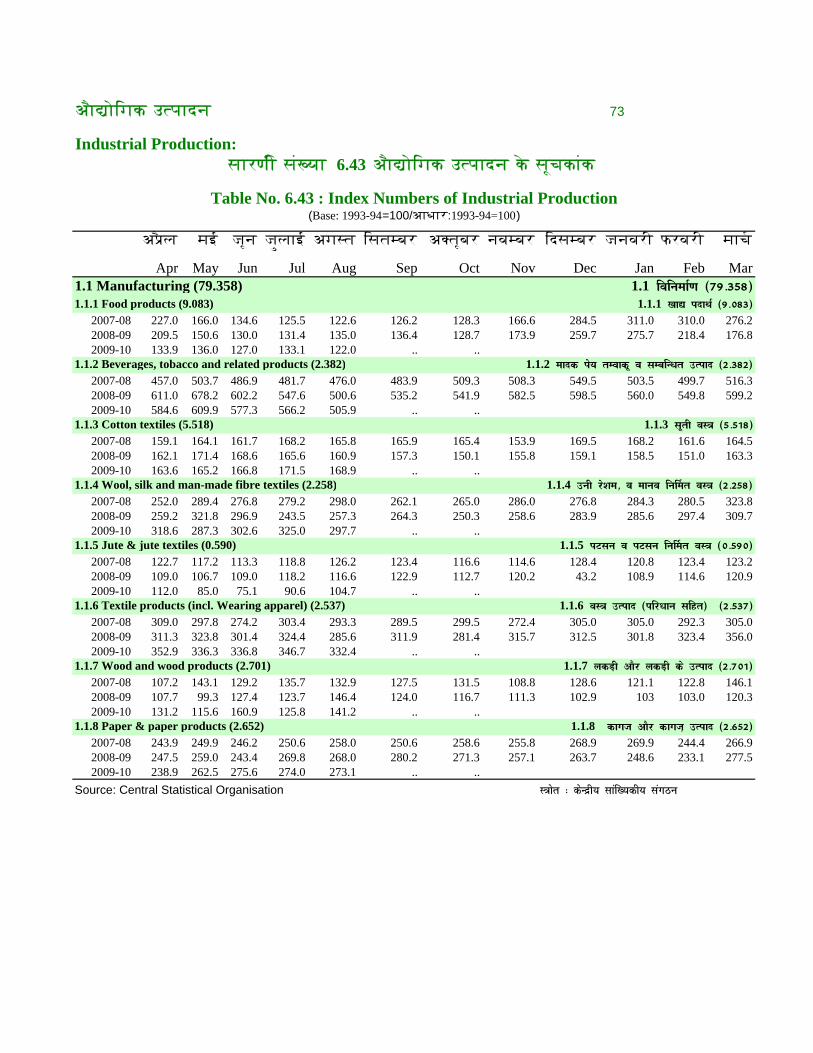
Aaó½<egak utpaadna 73
Industrial Production:saarNei saöKyaa 6.43 Aaó½<egak utpaadna kñ saÜcakaök
Table No. 6.43 : Index Numbers of Industrial Production(Base: 1993-94=100/AaDaar:1993-94=100)
A)óla maI jaÜna jaÚlaaI Agasta esatambar AVtaÜbar navambar edsambar janavari Prvari maacaý
Apr May Jun Jul Aug Sep Oct Nov Dec Jan Feb Mar1.1 Manufacturing (79.358) 1.1 fofuekZ.k (79-358)1.1.1 Food products (9.083) 1.1.1 [kk| inkFkZ (9-083)
2007-08 227.0 166.0 134.6 125.5 122.6 126.2 128.3 166.6 284.5 311.0 310.0 276.22008-09 209.5 150.6 130.0 131.4 135.0 136.4 128.7 173.9 259.7 275.7 218.4 176.82009-10 133.9 136.0 127.0 133.1 122.0 .. ..
1.1.2 Beverages, tobacco and related products (2.382) 1.1.2 eknd is; rEokdw o lEcfUèkr mRikn (2-382)2007-08 457.0 503.7 486.9 481.7 476.0 483.9 509.3 508.3 549.5 503.5 499.7 516.32008-09 611.0 678.2 602.2 547.6 500.6 535.2 541.9 582.5 598.5 560.0 549.8 599.22009-10 584.6 609.9 577.3 566.2 505.9 .. ..
1.1.3 Cotton textiles (5.518) 1.1.3 lwrh oL= (5-518)2007-08 159.1 164.1 161.7 168.2 165.8 165.9 165.4 153.9 169.5 168.2 161.6 164.52008-09 162.1 171.4 168.6 165.6 160.9 157.3 150.1 155.8 159.1 158.5 151.0 163.32009-10 163.6 165.2 166.8 171.5 168.9 .. ..
1.1.4 Wool, silk and man-made fibre textiles (2.258) 1.1.4 muh jsÓke] o ekuo fu£er oL= (2-258)2007-08 252.0 289.4 276.8 279.2 298.0 262.1 265.0 286.0 276.8 284.3 280.5 323.82008-09 259.2 321.8 296.9 243.5 257.3 264.3 250.3 258.6 283.9 285.6 297.4 309.72009-10 318.6 287.3 302.6 325.0 297.7 .. ..
1.1.5 Jute & jute textiles (0.590) 1.1.5 iVlu o iVlu fu£er oL= (0-590)2007-08 122.7 117.2 113.3 118.8 126.2 123.4 116.6 114.6 128.4 120.8 123.4 123.22008-09 109.0 106.7 109.0 118.2 116.6 122.9 112.7 120.2 43.2 108.9 114.6 120.92009-10 112.0 85.0 75.1 90.6 104.7 .. ..
1.1.6 Textile products (incl. Wearing apparel) (2.537) 1.1.6 oL= mRikn (ifj/kku lfgr) (2-537)2007-08 309.0 297.8 274.2 303.4 293.3 289.5 299.5 272.4 305.0 305.0 292.3 305.02008-09 311.3 323.8 301.4 324.4 285.6 311.9 281.4 315.7 312.5 301.8 323.4 356.02009-10 352.9 336.3 336.8 346.7 332.4 .. ..
1.1.7 Wood and wood products (2.701) 1.1.7 ydM+h vkSj ydM+h ds mRikn (2-701)2007-08 107.2 143.1 129.2 135.7 132.9 127.5 131.5 108.8 128.6 121.1 122.8 146.12008-09 107.7 99.3 127.4 123.7 146.4 124.0 116.7 111.3 102.9 103 103.0 120.32009-10 131.2 115.6 160.9 125.8 141.2 .. ..
1.1.8 Paper & paper products (2.652) 1.1.8 dkxt vkSj dkxt+ mRikn (2-652)2007-08 243.9 249.9 246.2 250.6 258.0 250.6 258.6 255.8 268.9 269.9 244.4 266.92008-09 247.5 259.0 243.4 269.8 268.0 280.2 271.3 257.1 263.7 248.6 233.1 277.52009-10 238.9 262.5 275.6 274.0 273.1 .. ..
Source: Central Statistical Organisation L=ksr % dsUnzh; lkaf[;dh; laxBu
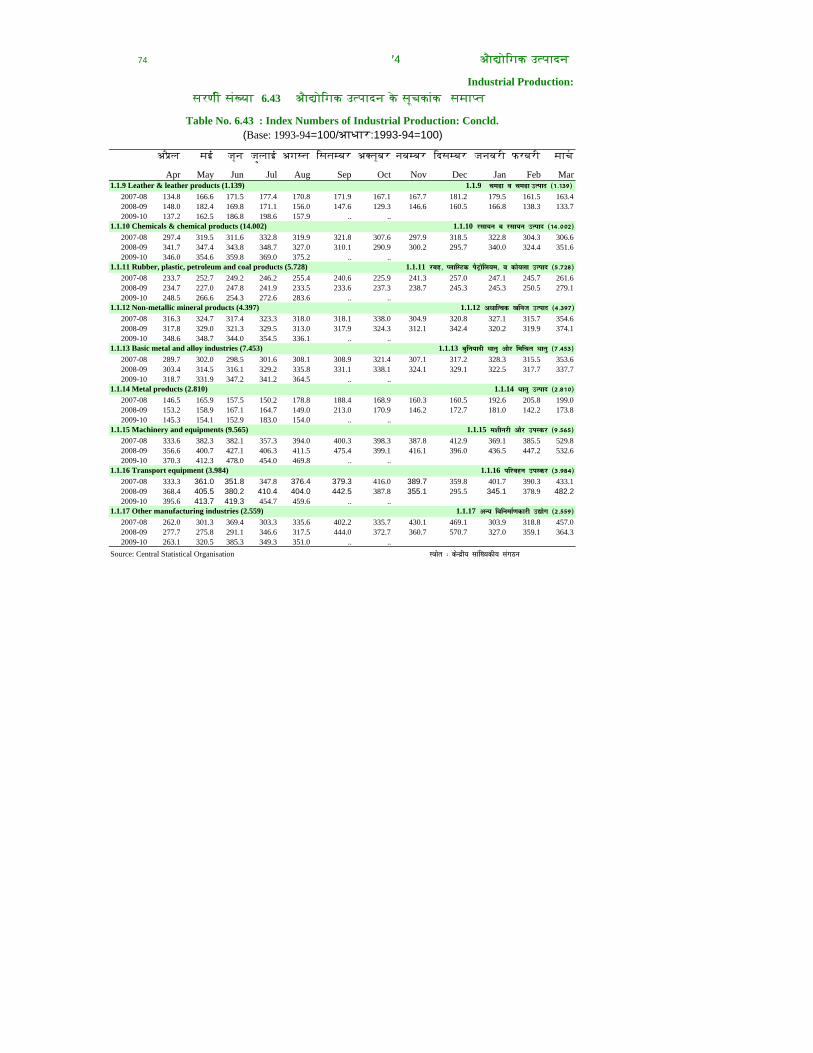
774 4 Aaó½<egak utpaadna
Industrial Production:sarNei saöKyaa 6.43 Aaó½<egak utpaadna kñ saÜcakaök samaapta
Table No. 6.43 : Index Numbers of Industrial Production: Concld.(Base: 1993-94=100/AaDaar:1993-94=100)
A)óla maI jaÜna jaÚlaaI Agasta esatambar AVtaÜbar navambar edsambar janavari Prvari maacaý
Apr May Jun Jul Aug Sep Oct Nov Dec Jan Feb Mar1.1.9 Leather & leather products (1.139) 1.1.9 peMkÛ o peMkÛ mRikn (1-139)
2007-08 134.8 166.6 171.5 177.4 170.8 171.9 167.1 167.7 181.2 179.5 161.5 163.42008-09 148.0 182.4 169.8 171.1 156.0 147.6 129.3 146.6 160.5 166.8 138.3 133.72009-10 137.2 162.5 186.8 198.6 157.9 .. ..
1.1.10 Chemicals & chemical products (14.002) 1.1.10 jlk;u o jlk;u mRikn (14-002)2007-08 297.4 319.5 311.6 332.8 319.9 321.8 307.6 297.9 318.5 322.8 304.3 306.62008-09 341.7 347.4 343.8 348.7 327.0 310.1 290.9 300.2 295.7 340.0 324.4 351.62009-10 346.0 354.6 359.8 369.0 375.2 .. ..
1.1.11 Rubber, plastic, petroleum and coal products (5.728) 1.1.11 jcM+] IykfLVd iSVªksfy;e] o dks;yk mRikn (5-728)2007-08 233.7 252.7 249.2 246.2 255.4 240.6 225.9 241.3 257.0 247.1 245.7 261.62008-09 234.7 227.0 247.8 241.9 233.5 233.6 237.3 238.7 245.3 245.3 250.5 279.12009-10 248.5 266.6 254.3 272.6 283.6 .. ..
1.1.12 Non-metallic mineral products (4.397) 1.1.12 v/kkfRod [kfut mRikn (4-397)2007-08 316.3 324.7 317.4 323.3 318.0 318.1 338.0 304.9 320.8 327.1 315.7 354.62008-09 317.8 329.0 321.3 329.5 313.0 317.9 324.3 312.1 342.4 320.2 319.9 374.12009-10 348.6 348.7 344.0 354.5 336.1 .. ..
1.1.13 Basic metal and alloy industries (7.453) 1.1.13 cqfu;knh /kkrq vkSj fefJr /kkrq (7-453)2007-08 289.7 302.0 298.5 301.6 308.1 308.9 321.4 307.1 317.2 328.3 315.5 353.62008-09 303.4 314.5 316.1 329.2 335.8 331.1 338.1 324.1 329.1 322.5 317.7 337.72009-10 318.7 331.9 347.2 341.2 364.5 .. ..
1.1.14 Metal products (2.810) 1.1.14 /kkrq mRikn (2-810)2007-08 146.5 165.9 157.5 150.2 178.8 188.4 168.9 160.3 160.5 192.6 205.8 199.02008-09 153.2 158.9 167.1 164.7 149.0 213.0 170.9 146.2 172.7 181.0 142.2 173.82009-10 145.3 154.1 152.9 183.0 154.0 .. ..
1.1.15 Machinery and equipments (9.565) 1.1.15 e'khujh vkSj miLdj (9-565)2007-08 333.6 382.3 382.1 357.3 394.0 400.3 398.3 387.8 412.9 369.1 385.5 529.82008-09 356.6 400.7 427.1 406.3 411.5 475.4 399.1 416.1 396.0 436.5 447.2 532.62009-10 370.3 412.3 478.0 454.0 469.8 .. ..
1.1.16 Transport equipment (3.984) 1.1.16 ifjogu miLdj (3-984)2007-08 333.3 361.0 351.8 347.8 376.4 379.3 416.0 389.7 359.8 401.7 390.3 433.12008-09 368.4 405.5 380.2 410.4 404.0 442.5 387.8 355.1 295.5 345.1 378.9 482.22009-10 395.6 413.7 419.3 454.7 459.6 .. ..
1.1.17 Other manufacturing industries (2.559) 1.1.17 vU; fofuekZ.kdkjh m|ksx (2-559)2007-08 262.0 301.3 369.4 303.3 335.6 402.2 335.7 430.1 469.1 303.9 318.8 457.02008-09 277.7 275.8 291.1 346.6 317.5 444.0 372.7 360.7 570.7 327.0 359.1 364.32009-10 263.1 320.5 385.3 349.3 351.0 .. ..
Source: Central Statistical Organisation L=ksr % dsUnzh; lkaf[;dh; laxBu
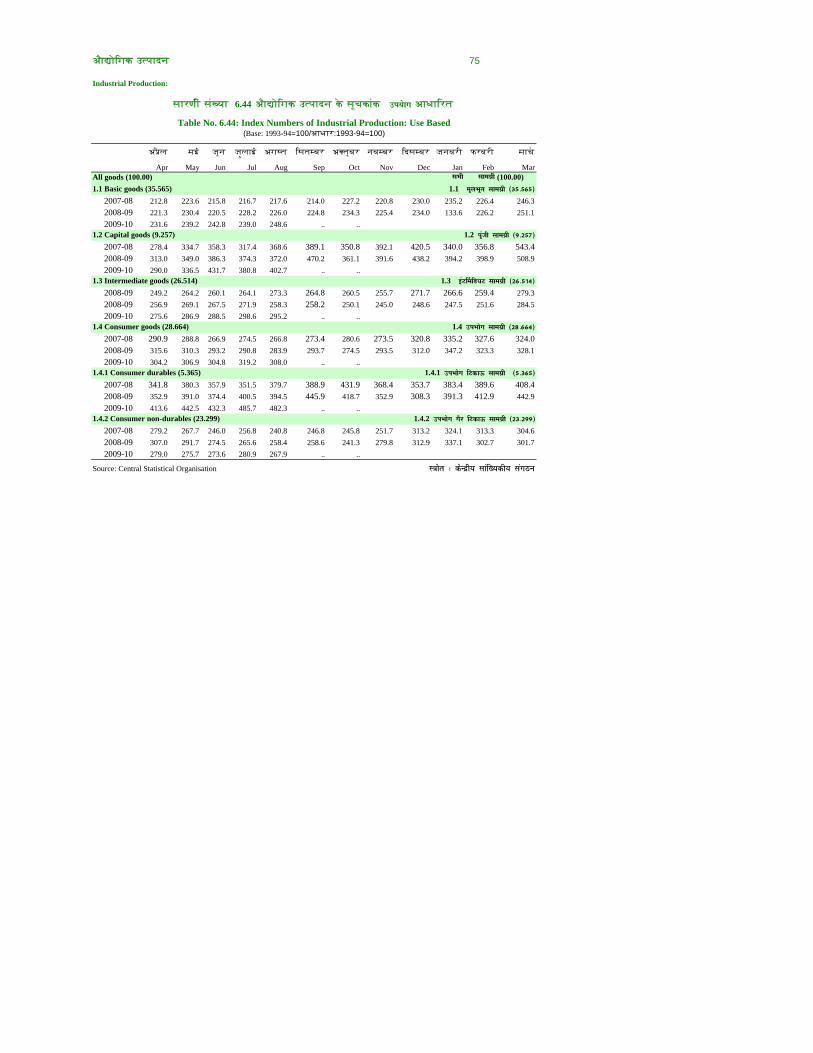
A)óla maI jaÜna jaÚlaaI Agasta esatambar AVtaÜbar navambar edsambar janavari Prvari maacaý
Apr May Jun Jul Aug Sep Oct Nov Dec Jan Feb MarlHkh lkexzh (100.00)
1.1 Basic goods (35.565)2007-08 212.8 223.6 215.8 216.7 217.6 214.0 227.2 220.8 230.0 235.2 226.4 246.32008-09 221.3 230.4 220.5 228.2 226.0 224.8 234.3 225.4 234.0 133.6 226.2 251.12009-10 231.6 239.2 242.8 239.0 248.6 .. ..
1.2 Capital goods (9.257)2007-08 278.4 334.7 358.3 317.4 368.6 389.1 350.8 392.1 420.5 340.0 356.8 543.42008-09 313.0 349.0 386.3 374.3 372.0 470.2 361.1 391.6 438.2 394.2 398.9 508.92009-10 290.0 336.5 431.7 380.8 402.7 .. ..
1.3 Intermediate goods (26.514)2008-09 249.2 264.2 260.1 264.1 273.3 264.8 260.5 255.7 271.7 266.6 259.4 279.32008-09 256.9 269.1 267.5 271.9 258.3 258.2 250.1 245.0 248.6 247.5 251.6 284.52009-10 275.6 286.9 288.5 298.6 295.2 .. ..
1.4 Consumer goods (28.664)2007-08 290.9 288.8 266.9 274.5 266.8 273.4 280.6 273.5 320.8 335.2 327.6 324.02008-09 315.6 310.3 293.2 290.8 283.9 293.7 274.5 293.5 312.0 347.2 323.3 328.12009-10 304.2 306.9 304.8 319.2 308.0 .. ..
1.4.1 Consumer durables (5.365)2007-08 341.8 380.3 357.9 351.5 379.7 388.9 431.9 368.4 353.7 383.4 389.6 408.42008-09 352.9 391.0 374.4 400.5 394.5 445.9 418.7 352.9 308.3 391.3 412.9 442.92009-10 413.6 442.5 432.3 485.7 482.3 .. ..
1.4.2 Consumer non-durables (23.299)2007-08 279.2 267.7 246.0 256.8 240.8 246.8 245.8 251.7 313.2 324.1 313.3 304.62008-09 307.0 291.7 274.5 265.6 258.4 258.6 241.3 279.8 312.9 337.1 302.7 301.72009-10 279.0 275.7 273.6 280.9 267.9 .. ..
Source: Central Statistical Organisation L=ksr % dsUnzh; lkaf[;dh; laxBu
1.4.2 miHkksx xSj fVdkÅ lkexzh (23-299)
1.4.1 miHkksx fVdkÅ lkexzh (5-365)
Industrial Production:
Table No. 6.44: Index Numbers of Industrial Production: Use Based(Base: 1993-94=100/AaDaar:1993-94=100)
1.3 baV£efM¸kV lkexzh (26-514)
1.4 miHkksx lkexzh (28-664)
Aaó½<egak utpaadna 75
1.1 ewyHkwr lkexzh (35-565)
saarNei saöKyaa 6.44 Aaó½<egak utpaadna kñ saÜcakaök mi;skx AaDaaerta
1.2 iwath lkexzh (9-257)
All goods (100.00)