saarela unemployment
TRANSCRIPT

8/3/2019 Saarela Unemployment
http://slidepdf.com/reader/full/saarela-unemployment 1/22
Journal of Socio-Economics 32 (2003) 59–80
Unemployment and native language:the Finnish case
Jan Saarela∗, Fjalar Finnäs
Department of Social Sciences, Åbo Akademi University, Vörågatan 9, FIN-65100 Vaasa, Finland
Accepted 20 December 2002
Abstract
This paper explores the reasons behind the lower unemployment rate of the Swedish-speaking mi-nority, in comparison with that of the Finnish-speaking majority, in Finland. Cross section statisticson labour market status and outflows from unemployment are analysed. No significant between-group
differences in labour force participation are found. Differences in unemployment cannot either be ex-plained by human capital factors or local labour market conditions.Being a Swedish-speaker decreasesthe odds of being unemployed by 30%, while it increases the transition rate from unemployment by15%. Language proficiency and social integration are the likely reasons behind these differences.© 2003 Elsevier Science Inc. All rights reserved.
JEL classification: J15; J64
Keywords: Unemployment; Native language; Minority groups
1. Introduction
The roots of the Swedish-speaking community in Finland go far back in history. Duringseveral centuries Finland was an integrated and equal part of the realm of Sweden. Swedishwas then the dominant language of government, business and culture. In 1809, when Finlandbecame a part of the Russian Empire, the Swedish-speaking population was about 15% of the total population.
It was, however, not until the end of the 19th century that the Finnish language achievedequal status with Swedish. According to the Constitution Act of 1919 Finnish and Swedish
∗ Corresponding author. Tel.: +358-6-3247-476; fax:+358-6-3247-457.E-mail address: [email protected] (J. Saarela).
1053-5357/03/$ – see front matter © 2003 Elsevier Science Inc. All rights reserved.doi:10.1016/S1053-5357(03)00007-6

8/3/2019 Saarela Unemployment
http://slidepdf.com/reader/full/saarela-unemployment 2/22
60 J. Saarela, F. Finnäs / Journal of Socio-Economics 32 (2003) 59–80
have equal status as official languages. In 1917 Finland declared its independence, fol-lowing which in the 1920s and 1930s attitudes towards the Swedish-language issue sharp-ened. The wars against the Soviet Union in 1939–1940 and 1941–1944, however, united
Swedish-speakers and Finnish-speakers.Nowadays, the Swedish-speaking ethnic minority in Finland constitutes barely 6% of
the total population. It is guaranteed constitutional rights and is covered by a consider-able organisational and institutional network. Besides the school system, there is also adiocese for all Swedish-language parishes in the Evangelical-Lutheran church. Further-more, one brigade of the Finnish army is Swedish-speaking. There are also a number of Swedish-speaking societies for politics, culture, sports, agriculture, etc. These institutionsthus constitute important elements of the Swedish-speaking community in Finland.1
The Swedish-speakers mainly live along the southern and western coastline of the coun-try, about half of them in municipalities (kommuner) where they form the local majority.They have better health, they live longer and they have higher marital stability than theirFinnish-speaking counterparts (see e.g. Finnäs, 1997; Hyyppä and Mäki, 2001a,b).
The unemployment rate of Swedish-speakers is, also, substantially lower than that of Finnish-speakers (Finnäs, 1993; Statistics Finland, 1996). In the end of 1993, for example,the unemployment rate for Swedish-speakers was about 14%, while for Finnish-speakerslivinginthesameareaitwasabout19%.Thetrendissimilarforlateryearsandforpracticallyevery bilingual municipality.2
The successful performance of other ethnic minority groups, such as American-bornChinese, Japanese and Jews in the US labour market (Brenner and Kiefer, 1981; Chiswick,
1983a,b; Sowell, 1981), have challenged the traditional view on labour market discrim-ination (Becker, 1957). The reasons behind these contradictory findings have in generalnot been fully understood. Mainly, it has been argued that differences in age, education,geographical location and fertility could be important (Sowell, 1981; Chiswick, 1983a).Drinkwater and O’Leary (1997), on the other hand, find that characteristic differences can-not explain why unemployment of Welsh-speakers is lower than of English-speakers inthe Welsh labour market. Although ethnic differences need not be hereditary in a biolog-ical sense, it is thus plausible that cultural differences may affect economically relevantvariables, such as unemployment. This could also be the case for the Swedish-speakingpopulation in Finland.
There have, however, been no previous micro-level studies undertaken to analyse thereasons behind the unemployment difference between the language groups in Finland.Present understanding of this gap is thus very limited. This study is the first one that seekstoprovidebetterinsightintotheissue.Itshouldalthoughbepointedout,thatwedonotfocuson testing a number of theoretical hypotheses. Instead, the approach is to use available data,in order to determine to what extent the gap may be due to observable, structural, factorssuch as age, gender, education and municipality of residence.
The paper is organised as follows: we begin with providing some theoretical viewpointson the relationship between native language and unemployment, which could be relevant
1 Finland is not unique in this respect; see O’Leary and Finnäs (2002) for a discussion about similarities betweenProtestants in the Republic of Ireland and the Swedish-speaking minority in Finland.
2 A bilingual municipality has at least 8.0%, or 3000 inhabitants, who are Swedish-speaking.

8/3/2019 Saarela Unemployment
http://slidepdf.com/reader/full/saarela-unemployment 3/22
J. Saarela, F. Finnäs / Journal of Socio-Economics 32 (2003) 59–80 61
in our case. The next section briefly describes the used data, which consist of one set of cross section data and the other consisting of unemployment duration data. Thereafter theresults based on the analysis of the cross section data are discussed, followed by a section
with the results based on the unemployment duration data. We end with some conclusions.
2. Theoretical considerations
Swedish-speakers are different from Finnish-speakers with regard to a number of charac-teristics,suchasage,education,andindustryofwork(Finnäs, 2001). Duetotheirimpacton,for example fertility, such inherent differences could affect both labour force participationas well as the unemployment rate of each language group (cf. Atkinson and Micklewright,1991; Ehrenberg and Smith, 1994). It is consequently plausible that the unemploymentgap may be explained by (1) differences in labour force participation. Naturally, the labourmarket performance of those already in the labour force could be due to (2) standard hu-man capital factors, such as age and education (cf. Becker, 1964, 1967; Ben-Porath, 1967).Differences in human capital factors between the language groups could consequently be acause to the unemployment gap. Furthermore, local labour market conditions, such as thelocal unemployment rate, may also affect employment prospects of individuals (cf. Hoynes,2000). (3) The municipality of residence could therefore also be an important determinantof the job finding probability.
Besides the above explanations there are three other factors that could be important. We
are unfortunately not able to explicitly measure them. We will although discuss them indetail, since they must be assumed highly relevant in this context.Firstly, language proficiency is in general considered to be an important determinant of
individual labour market outcomes. A number of studies (see e.g. McManus et al., 1983;Rivera-Batiz, 1990; Chiswick and Miller, 1995) have shown that language proficiency hasa positive effect on earnings. Equally important in this context are the findings of Leslieand Lindley (2001), which suggest that language proficiency affects both unemploymentand earnings. It has been commonly argued that Swedish-speakers, to a higher extent thanFinnish-speakers, are bilingual, i.e. that they speak both Swedish and Finnish fluently. Thishigher language proficiency may consequently be an important reason to why they have
lower unemployment rates.There is, however, very little known about individual bilingualism in Finland. In fact, no
recent data exists that would provide information about language proficiency of individuals,linked to their labour market performance. In addition to the 1950 census, which includeda question about knowledge of Finnish and Swedish, there is only a smaller survey directedto the Finnish population in 1987 (see Sandlund and Björklund, 1980; Sandlund, 1991).
The 1950 census clearly indicated that bilingualism was much more frequent amongthe Swedish-speakers. Whereas about half the Swedish-speaking population consideredthemselves to be bilingual, less than one-third of the Finnish-speakers, in the bilingualarea,3 did. In bilingual municipalities with a Finnish-speaking majority, more than 80% of
the Swedish-speakers considered themselves to be bilingual.
3 The bilingual area consists of all bilingual municipalities.

8/3/2019 Saarela Unemployment
http://slidepdf.com/reader/full/saarela-unemployment 4/22
62 J. Saarela, F. Finnäs / Journal of Socio-Economics 32 (2003) 59–80
The smaller survey from 1987 found that knowledge of Swedish among Finnish-speakersin general has increased. However, less than half of the Finnish-speakers living in thebilingual area considered themselves to be reading and speaking Swedish “well” or “rather
well”.Due to the migration of Finnish-speaking individuals into the bilingual area, Swedish-
speakers have more and more become a local minority. There are thus no reasons to believethat knowledge of Finnish among Swedish-speakers has decreased. On the contrary, mostyoung Swedish-speakers today are able to speak Finnish at least “rather well”.
A notable issue in this respect is the existence of bilingual families. More than 30% of the younger Swedish-speakers have a bilingual family background, whereas only 5% of theFinnish-speakers, in the bilingual area, come from bilingual families (Finnäs, 2000).Weareconfident that most Swedish-speakers with a bilingual background speak Finnish fluently,and we consequently believe that individual bilingualism favours the Swedish-speakingpopulation in the job search process: take the service sector as an example. 4
Secondly, social networks or social integration (see Coleman, 1988; Montgomery, 1992)may be important for individual labour market performance. A number of empirical studieshave in fact pointed out the importance of personal contacts on the job finding probability(Blau and Robins, 1990; Wadsworth, 1991; Hannan, 2000). Hyyppä and Mäki (2001a,b)have found that Swedish-speakers have more extent social networks than Finnish-speakers.They also argue that this might explain why they have a longer active life and better health.We believe that the higher degree of social integration among Swedish-speakers, at least tosome extent, could explain the difference in unemployment between the language groups.
Also two other aspects suggest there being a higher degree of social integration in theSwedish-speaking population than in the Finnish-speaking one. Within the bilingual area,geographical mobility has been much higher among Finnish-speakers. In 1995, about 80%of the Finnish-speakers aged 20–34 lived in the same area as they did in 1990, while thecorresponding figure among the Swedish-speakers was as much as 95%. If the length of anindividual’s stay in a region is positively correlated with the degree of social integration,this may also induce a more favourable position for Swedish-speakers.5
Furthermore, the divorce rate among Finnish-speakers is about twice that of Swedish-speakers (Finnäs, 1997). As is the case with geographical mobility, this could be interpretedas an indication of differences in the level of social integration between the language groups.
Thirdly,onecouldarguethatpresentlabourmarketperformanceineachlanguagegroupistheresultofasortingprocess(cf. Weiss, 1995)inducedbyemigration.Itisawell-knownfactthat emigration, foremost to Sweden, was very strong in the 1960s and 1970s, and that it wasmuch more frequent among Swedish-speakers than among Finnish-speakers (Finnäs, 1986,1994).Thesimilarrelationshipbetweennativelanguageandemigrationstillexists,althoughthe emigration flows are much smaller. This could be interpreted as a sorting process, wherea higher proportion of Swedish-speakers than Finnish-speakers emigrate, instead of being
4 In this context, one could relate to the concepts screening (Arrow, 1973) and signalling (Spence, 1973). If there exists a dual labour market, with jobs for those who speak only Finnish on the one hand, and with jobs for
those who speak both Finnish and Swedish on the other hand, this would clearly favour the Swedish-speakers.5 This assumption is in contrast with the more common view, which says that mobility prevents people frombecoming unemployed. Moreover, there could be a question of reversed causality: insufficient social networksmay induce migration.
8/3/2019 Saarela Unemployment
http://slidepdf.com/reader/full/saarela-unemployment 5/22
J. Saarela, F. Finnäs / Journal of Socio-Economics 32 (2003) 59–80 63
or becoming unemployed. The implication might then be a higher average productivity,and thus better labour market performance, among non-emigrating Swedish-speakers thanamong non-emigrating Finnish-speakers. We do, however, believe that migration flows
have a very small impact on the unemployment gap between the language groups. Thisis because Finnish-speakers are much more mobile than Swedish-speakers with regardto long-distance migration within the country (Finnäs, 1994). Also migration out of thebilingual area is much more frequent among Finnish-speakers, which consequently alsocontradicts the sorting hypothesis.
We thus think there are good reasons for Swedish-speakers to have lower unemploymentrates than Finnish-speakers. The contribution of this paper is to analyse to what extent theunemployment gap will diminish when one takes into account the effects of observable,structural,factors.Asstatedearlier,thereisnoobviouswayforustodifferentiateempiricallybetween potential effects induced by language proficiency, social integration and sorting.We do not therefore claim that our empirical results will be specifically in favour of anyof these explanations. Instead, we focus on analysing whether the unemployment gap canbe attributed to labour force participation, standard human capital factors, and local labourmarket conditions.6
3. Data
We will utilise two different register data sets. The first, from Statistics Finland, consti-
tutes three cross sections of the total Swedish-speaking and Finnish-speaking populationof Finland aged 20–64.7 It includes information about individuals’ native language,8 age,gender, education, municipality of residence, and labour market status, at the end of theyears 1990, 1995 and 1998. By choosing these years we have the possibility to observe if there are differences between the language groups, conditional on the above factors, overa business cycle: from the end of an economic boom in 1990, at the end of a recession in1995, until a new economic recovery in 1998.
The second data set consists of all persons who have been registered as unemployedat the Employment Service (Arbetskraftsbyrån) in the city of Vaasa9 some time between1 January and 18 September 1996. The data set includes information about starting and
(possible) ending times of unemployment, the reason to why unemployment (possibly)ended, native language, age, gender, education, previous industry of work, and the labourmarket status before registering at the Employment Service. About 25% of the populationof Vaasa is Swedish-speaking.
A main advantage with utilising both data sets is that we are not only able to study deter-minants of labour market status, but also the dynamic aspects of unemployment in the form
6 One could, of course, argue that the utilised variables serve as proxies for some of the omitted variables.7 Note that the data set is not a sample of individuals, but a complete set of all individuals at each cross section
point. We are, however, not able to follow each individual over time in a longitudinal manner.8
In the central population register, all Finnish citizens have one unique native language. In this paper theconcepts Swedish-speaking and Finnish-speaking refer to this taxonomy. Only about 1.7% of the population hasa native language other than Finnish or Swedish.
9 The city of Vaasa is a municipality found in the western part of Finland. It has about 55,000 citizens.

8/3/2019 Saarela Unemployment
http://slidepdf.com/reader/full/saarela-unemployment 6/22
64 J. Saarela, F. Finnäs / Journal of Socio-Economics 32 (2003) 59–80
Table 1Unemployment rate (labour force participation rate in parenthesis) in Finland, of people aged 20–64, at the endof 1990, 1995 and 1998
1990 1995 1998
Counties with bilingual municipalitiesa,b 2.9 (81.3) 15.3 (78.5) 10.2 (80.1)Uusimaa/Nyland 2.0 (82.5) 15.0 (78.9) 9.3 (80.7)Itä-Uusimaa/Östra Nyland 3.1 (81.3) 14.9 (79.4) 10.3 (81.0)Varsinais-Suomi/Egentliga Finland 4.5 (79.2) 16.3 (77.5) 12.5 (78.8)Pohjanmaa/Österbotten 4.6 (79.8) 14.8 (77.9) 10.8 (79.6)Keski-Pohjanmaa/Mellersta Österbottenc 6.5 (76.9) 19.6 (75.3) 15.1 (76.6)Ahvenanmaa/Ålandd 1.7 (83.3) 6.6 (81.3) 3.1 (81.5)
Counties without bilingual municipalitiesb 7.3 (76.2) 21.5 (74.9) 17.7 (76.4)
a A bilingual municipality has at least 8.0%, or 3000 inhabitants, who are Swedish-speaking. There are 46municipalities, plus the county Ahvenanmaa (which in this study is analysed as a single municipality). Therewas a total number of 452 municipalities in Finland in 1995. The proportion of Swedish-speakers aged 20–64in each bilingual county in 1995 were: Uusimaa 7.9; Itä-Uusimaa 35.3; Varsinais-Suomi 5.7; Pohjanmaa 50.3;Keski-Pohjanmaa 9.5; Ahvenanmaa 94.0.
b The total population aged 20–64 in 1995 was: 759,700 in Uusimaa; 50,871 in Itä-Uusimaa; 257,882 inVarsinais-Suomi; 98,085 in Pohjanmaa; 41,051 in Keski-Pohjanmaa; 14,739 in Ahvenanmaa; and 1,816,860 inthe 14 counties without bilingual municipalities.
c Keski-Pohjanmaa includes only one bilingual municipality.d Ahvenanmaa is in fact unilingual Swedish.
of the length of unemployment spells. We can consequently compare Finnish-speakers
and Swedish-speakers with regard to labour force participation, employment, and exitsfrom unemployment. It is, however, not possible to explicitly measure the inflow intounemployment.
4. Native language and labour market status
An important aspect to bear in mind is the fact that there are substantial regional differ-ences in unemployment rates in Finland. In Table 1 we have outlined the unemploymentrate of people aged 20–64, at the end of 1990, 1995 and 1998, in counties (landskap) with,and counties without, bilingual municipalities.10 As can be seen, counties including one ormorebilingualmunicipalityarealsothosewhichhavealowerunemploymentratethancom-pletely Finnish-speaking counties, despite the labour force participation rate being some-what higher.11 This suggests that the seemingly better performance of Swedish-speakersin the labour market, from a national viewpoint, may be partly explained by the fact thatthey live in regions with relatively low unemployment rates. The most appropriate way
10 Note that these figures are for all municipalities in a county (whereas those in Tables 2 and 3 refer to only thebilingual municipalities within each county).11
The county Ahvenanmaa is clearly an outlier in this respect. This is due to a number of reasons: it isself-governed, unilingual, has specific legislative practices and an economic structure that differs from otherparts of the country. Excluding Ahvenanmaa from the statistical estimations to be performed would, however,affect the results only marginally (cf. Saarela and Finnäs, 2003).

8/3/2019 Saarela Unemployment
http://slidepdf.com/reader/full/saarela-unemployment 7/22
J. Saarela, F. Finnäs / Journal of Socio-Economics 32 (2003) 59–80 65
Table 2Labourforceparticipationrateaccordingtonativelanguageofpeopleaged20–64inthebilingualarea,county-wise,at the end of 1990, 1995 and 1998a
1990 1995 1998
Swedish-speakers
Finnish-speakers
Swedish-speakers
Finnish-speakers
Swedish-speakers
Finnish-speakers
Uusimaa/Nyland 80.4 82.7 77.4 77.6 78.9 80.7Itä-Uusimaa/Östra Nyland 80.0 82.2 79.0 79.5 81.1 80.8Varsinais-Suomi/Egentliga
Finland76.3 77.7 74.9 75.1 75.4 76.4
Pohjanmaa/Österbotten 79.8 80.1 78.6 77.1 80.0 78.3Keski-Pohjanmaa/Mellersta
Österbotten76.2 76.8 76.3 74.3 78.2 75.9
Ahvenanmaa/Åland 83.5 80.0 81.3 80.5 81.5 81.5
Totally 80.0 81.7 78.1 78.2 79.7 79.9n 886361 910749 939732
a The bilingual area consists of municipalities with at least 8.0%, or 3000 inhabitants, who areSwedish-speaking. This is the part of the cross section data that is utilised in the logit estimations for labourforce participation (Table 5). Municipalities that are unilingual Finnish have consequently been excluded, unlikethe case in Table 1.
to compare Swedish-speakers and Finnish-speakers is therefore to study only individualsliving in bilingual municipalities. This is what we will do in the paper.
To start with, we are interested in whether there are differences in labour force partic-ipation between the language groups. Table 2 provides a description of the labour forceparticipation rate of Swedish-speakers and Finnish-speakers, respectively for the part of thecross section data that we will utilise (the bilingual area). In order to point out that thereare regional differences in labour force participation rates also within the bilingual area,we have outlined them county-wise. There are, naturally, also differences in participationbetween age groups, which cannot be seen in the table. The difference between languagegroups for different age groups is, however, quite similar within each county. As can beseen in the table, the labour force participation of Finnish-speakers is, on average, onlyslightly higher than that of Swedish-speakers. There does not consequently seem to be any
substantial differences in labour force participation between the language groups.If we, on the other hand, in a similar way as above, study the unemployment rate (Table 3),
i.e. unemployed of the labour force, we can see that there are substantial differences betweenSwedish-speakers andFinnish-speakers. Specifically in 1995 and1998, when theunemploy-ment figures were much higher than in 1990, the unemployment rate of Finnish-speakerswas substantially higher than that of Swedish-speakers in practically the whole bilingualarea. There are some differences between age groups, which are not shown. The differ-ence between language groups for different age groups is, however, quite similar withineach county.12 We have, also, studied the proportion of unemployed in relation to the total
12 We have not been able to depict any systematic geographical pattern. The results of Saarela and Finnäs (2003),however, indicate that language-group differences may depend on the language structure (i.e. the proportion of Swedish-speakers) of municipalities.

8/3/2019 Saarela Unemployment
http://slidepdf.com/reader/full/saarela-unemployment 8/22
66 J. Saarela, F. Finnäs / Journal of Socio-Economics 32 (2003) 59–80
Table 3Unemployment rate according to native language of people aged 20–64 in the bilingual area, county-wise, at theend of 1990, 1995 and 1998a
1990 1995 1998
Swedish-speakers
Finnish-speakers
Swedish-speakers
Finnish-speakers
Swedish-speakers
Finnish-speakers
Uusimaa/Nyland 1.4 1.9 11.3 15.3 8.0 9.5Itä-Uusimaa/Östra Nyland 2.1 3.7 12.1 16.5 8.2 11.6Varsinais-Suomi/Egentliga
Finland3.2 5.9 11.7 19.2 9.0 15.8
Pohjanmaa/Österbotten 4.0 5.5 11.8 18.0 8.1 14.1Keski-Pohjanmaa/Mellersta
Österbotten4.0 8.2 15.5 23.9 11.1 18.9
Ahvenanmaa/Åland 1.5 5.3 6.3 11.6 2.9 7.0
Totally 2.5 2.8 11.2 16.2 7.7 10.8n 721416 712338 750445
a This is the part of the cross section data that is utilised in the logit estimations for employment (Table 6).
population. Since there were no earlier indications of significant differences in labour forceparticipation between the language groups (see Table 2), it comes as no surprise that the pat-tern was similar to that outlined here. The higher unemployment rate of Finnish-speakers,in comparison with that of Swedish-speakers, therefore seems to be caused by differing
employment prospects, potentially induced by differences in human capital factors.It is consequently possible that the effect of native language will decrease when onetakes into account the effect of education, age, gender, and the municipality of residence.Table 4 provides a brief description of the explanatory variables that will be used (except
Table 4Some descriptives (%) of the explanatory variables for Swedish-speakers and Finnish-speakers, labour forceparticipants in the bilingual area in 1995a
Males Undergraduate or
graduate education
45–64 years old
Swedish-speakers
Finnish-speakers
Swedish-speakers
Finnish-speakers
Swedish-speakers
Finnish-speakers
Uusimaa/Nyland 52.0 48.7 21.7 17.4 45.5 35.8Itä-Uusimaa/Östra Nyland 53.5 52.8 9.6 8.3 44.0 37.6Varsinais-Suomi/Egentliga
Finland53.7 49.7 19.7 12.8 43.4 37.6
Pohjanmaa/Österbotten 54.5 50.9 9.5 10.0 41.6 38.2Keski-Pohjanmaa/Mellersta
Österbotten58.9 51.2 9.2 7.8 41.5 38.8
Ahvenanmaa/Åland 53.2 33.5 7.9 11.3 39.4 41.3
Totally 53.4 49.2 14.7 15.9 43.2 36.3an = 712,338. The distribution is very similar for 1990 and 1998. Descriptives of the municipality variable
are not shown here.

8/3/2019 Saarela Unemployment
http://slidepdf.com/reader/full/saarela-unemployment 9/22
J. Saarela, F. Finnäs / Journal of Socio-Economics 32 (2003) 59–80 67
for the municipality of residence). As can be seen, the bilingual area is very heterogeneous,both in terms of the demographic composition of the pool of labour force participants aswell as with regard to the educational distribution. There are also differences between the
language groups within regions. Swedish-speakers are in many cases more educated andolder.Perhapsthemostimportantaspecttobearinmind,however,isthatweinourstatisticalestimations will be able to account for regional differences by the help of the variable thatspecifies each individual’s municipality of residence.
In order to control for differences between municipalities, language-group differences inage, education and gender, and the fact that these differences may affect the labour marketstatus of individuals, we will use binary logit models. Such a model estimates the ratioof the probability of being in a labour market state to the probability of not being in thatstate, i.e. the odds. For each variable there is one reference category. The effect of a certainpersonal characteristic (say: age 45–49) is then the relative level of the odds when havingthis characteristic, in relation to that of the reference category (in our case: age 40–44).
In order to be convinced that the effects of observable variables do not affect language-group differences in labour force participation rates, we have estimated a logit model forlabour force participation. The individual is considered to participate in the labour forceif he or she is employed or unemployed when the cross section has been performed, andis outside the labour force otherwise (students, conscripts, pensioners, others). As can beseen, the estimation results (Table 5) confirm the earlier finding (in Table 2): the effect of native language on the probability of labour force participation is close to zero (one minusthe exponentiated coefficient is equal to the percentage change in the odds for participation
when being Swedish-speaking, in comparison with being Finnish-speaking).13
Note alsothat the estimates are very stable over different estimation procedures.The estimates for the control variables correspond well with expectations and earlier
findings (cf. Gonzalo and Saarela, 2000). The relationship between age and participationis inversely U-shaped. The odds of participation are increasing in education level. Men aremore likely to participate than women. The odds of participation are lower in 1995, whenthere was a high unemployment rate, than in 1990 and 1998. There are also differencesin labour force participation between municipalities (not shown), which may be explainedby local labour market conditions, such as local unemployment rates and the underlyingindustrial structure.
Based on the above results, we find it reasonably safe to argue that labour force participa-tion of Swedish-speakers is not very much different from that of Finnish-speakers. Despitethat the effect of native language is statistically significant in 1990, it must be considered asrelatively small. Furthermore, the effect of native language is not systematic over the crosssection years. We consequently argue that there are no indications of an underlying selectionprocess, into the labour force, that would depend on native language. We will therefore,in the following, study how native language affects the odds of being unemployed among
13 It may be pointed out that we also tried estimating a logit model for employment among all individuals in the
total population, i.e. the employment rate. The results confirmed those in Table 5: there are no major systematicdifferences between the language groups in labour force participation. The effect (exponentiated coefficient) of being Swedish-speaking, in comparison withbeingFinnish-speaking, in similar models as in Table5, was0.902∗∗∗,1.070∗∗∗, 1.022∗∗, and 1.002, for 1990, 1995, 1998, and pooled years, respectively.

8/3/2019 Saarela Unemployment
http://slidepdf.com/reader/full/saarela-unemployment 10/22
68 J. Saarela, F. Finnäs / Journal of Socio-Economics 32 (2003) 59–80
Table 5Binary logit estimates (exponentiated coefficients) for labour force participation in the bilingual area
Variable 1990 1995 1998 Pooled years
Native languagea
Finnishb 1 1 1 1Swedish 0.965∗∗∗ 1.004 0.985 0.983∗∗
EducationBasic 0.772∗∗∗ 0.888∗∗∗ 0.836∗∗∗ 0.825∗∗∗
Lower vocationalb 1 1 1 1Upper vocational 1.723∗∗∗ 1.655∗∗∗ 1.674∗∗∗ 1.658∗∗∗
Undergraduate 1.370∗∗∗ 1.485∗∗∗ 1.746∗∗∗ 1.567∗∗∗
Graduate 2.023∗∗∗ 1.933∗∗∗ 2.016∗∗∗ 1.978∗∗∗
Age (years)
20–24 0.192∗∗∗ 0.140∗∗∗ 0.187∗∗∗ 0.171∗∗∗25–29 0.463∗∗∗ 0.382∗∗∗ 0.448∗∗∗ 0.428∗∗∗
30–34 0.649∗∗∗ 0.640∗∗∗ 0.676∗∗∗ 0.654∗∗∗
35–39 0.813∗∗∗ 0.839∗∗∗ 0.857∗∗∗ 0.835∗∗∗
40–44b 1 1 1 145–49 0.909∗∗∗ 0.932∗∗∗ 0.984 0.947∗∗∗
50–54 0.606∗∗∗ 0.677∗∗∗ 0.738∗∗∗ 0.678∗∗∗
55–59 0.209∗∗∗ 0.285∗∗∗ 0.404∗∗∗ 0.292∗∗∗
60–64 0.048∗∗∗ 0.037∗∗∗ 0.049∗∗∗ 0.045∗∗∗
GenderFemale 1 1 1 1
Male 1.254∗∗∗
1.288∗∗∗
1.210∗∗∗
1.250∗∗∗
Year1990 n/a n/a n/a 1.244∗∗∗
1995 n/a n/a n/a 0.921∗∗∗
1998b n/a n/a n/a 1
Municipality (Helsinkib)c Yes∗∗∗ Yes∗∗∗ Yes∗∗∗ Yes∗∗∗
Constant 10.643∗∗∗ 7.392∗∗∗ 7.205∗∗∗ 7.912∗∗
Cox & Snell R2 0.137 0.160 0.142 0.146Nagelkerke R2 0.221 0.247 0.225 0.230n 886361 910749 939732 2736842
a When estimating corresponding models for the municipality Vaasa, the estimates for beingSwedish-speakingwere 0.960, 1.037, 1.023, and 1.006 for 1990, 1995, 1998 and pooled years, respectively.
b The reference category.c Forty-six municipalities, plus the county Ahvenanmaa.∗∗ Significant on 1% level.∗∗∗ Significant on 0.1% level.
labourforceparticipants.Abinarylogitmodelisagainused,sinceweneednotbeconcernedwith a three-state (employed/unemployed/outside-the-labour-force) model.
The logit model estimates for unemployment are outlined in Table 6. As can be seen, the
results suggest that being Swedish-speaking decreases the odds of being unemployed withat least 30%, when having controlled for factors such as education, age, gender and munici-pality of residence. In fact, when successively including covariates into the estimations, the

8/3/2019 Saarela Unemployment
http://slidepdf.com/reader/full/saarela-unemployment 11/22
8/3/2019 Saarela Unemployment
http://slidepdf.com/reader/full/saarela-unemployment 12/22
70 J. Saarela, F. Finnäs / Journal of Socio-Economics 32 (2003) 59–80
effect is 0.663, 0.659, 0.650, and 0.682. All these estimates are significant at 0.1% level.Hence, despite language-group differences in age and education, the lower unemploymentrate of Swedish-speakers cannot be attributed to these factors, or to local labour market
conditions.Our findings consequently point out that Swedish-speakers are substantially less likely
to be unemployed than Finnish-speakers also when differences in observable personal char-acteristics are taken into account, and that this pattern has practically nothing to do withlabour force participation aspects.
The effects of the other variables are the expected ones (cf. Gonzalo and Saarela, 2000).The relationship between age and unemployment is U-shaped. Education decreases theodds of being unemployed. Men are in general more likely to be unemployed than women.This may, at least partly, be explained by the fact that male-specific jobs are harder to obtainbecause labour force participation among men is higher than among women. The odds of being unemployed are lower in 1990 than in 1995 and 1998. There are also large differencesin the odds of being unemployed between municipalities (not shown), caused by differencesin local unemployment rates and the underlying industrial structure.
5. Native language and unemployment duration
We have seen that there are no differences in labour force participation between Swedish-speakers andFinnish-speakers, but that theodds of being unemployed for those participating
in the labour force differ substantially between the two groups. Next, we will study in whatway the behaviour of unemployed Swedish-speakers and Finnish-speakers are different byutilising the unemployment duration data.
Table 7 provides some descriptive statistics of the municipality representing the durationdata (the city of Vaasa), in comparison with the whole bilingual area. As can be seen, theproportion of Swedish-speakers, the proportion of those not being middle-aged, and theunemployment rate, are somewhat higher in Vaasa than in the bilingual area on average.However, as far as a single municipality can be considered as representative for such aheterogeneousareaasthebilingualone,webelievethatthedurationdataisfairlyappropriatein terms of providing useful information about the outflow from unemployment of each
language group.14As pointed out earlier, the duration data consists of all persons who have been registered
as unemployed at the Employment Service of Vaasa some time between 1 January and 18September 1996. This implies that it is a combination of a stock sample and an intervalsample in single-episode form. Hence, it includes a cross section of all unemployed individ-uals in Vaasa on 1 January 1996. The starting time of their unemployment is known. Theseindividuals are observed until 18 September 1996. During this time they may exit fromunemployment, otherwise they are treated as right-censored observations at the latter date.During the same observation period, individuals also enter the unemployment register, andmay thereafter exit or be unemployed until 18 September, at which date they are treated as
14 The estimates displayed in the first footnote in Tables 5 and 6 also suggest that Vaasa is fairly representativefor the whole bilingual area.

8/3/2019 Saarela Unemployment
http://slidepdf.com/reader/full/saarela-unemployment 13/22
J. Saarela, F. Finnäs / Journal of Socio-Economics 32 (2003) 59–80 71
Table 7The unemployment duration data in comparison with the cross section data (%)
Duration dataa
(Vaasa)
Cross section datab
(Vaasa)
Cross section datab
(bilingual area)Swedish-speakers 18.9 19.7 12.6Males 51.7 53.1 55.5Basic education 37.9 40.1 43.0Upper vocational education 4.4 4.5 4.7Undergraduate education 1.9 2.2 2.1Graduate education 2.9 1.9 3.820–34 years 41.9 42.3 39.550–64 years 28.8 26.1 24.4Primary industry 3.4 n/a n/aSecondary industry 29.1 n/a n/a
Undefined industry 5.7 n/a n/aOutside-the-labour-force 40.3 n/a n/a
Unemployment rate in 1990 n/a 4.3 2.7Unemployment rate in 1995 n/a 16.9 15.3Unemployment rate in 1998 n/a 12.7 10.3
Participation rate in 1990 n/a 79.3 81.4Participation rate in 1995 n/a 76.6 78.2Participation rate in 1998 n/a 77.6 79.9
a The descriptives for the unemployment duration data refer to the proportion of total unemployment duration(in days), of all unemployed aged 20–64, during the period 1 January to 18 September 1996 (n = 6634).
b
The descriptives for the cross section data (except for unemployment rate and labour force participationrate) refer to unemployed aged 20–64 at the end of 1995, for Vaasa (n = 4310) and for the whole bilingual area(n = 109,013), respectively.
right-censored. The nature of the data implies a length bias, which means that long unem-ployment spells are overrepresented (Lancaster, 1990). This problem is circumvented bynot analysing the potential part of any unemployment spell that occurs before 1 January.That part is, however, taken into account by allowing the starting time of the unemploymentspell to take a value that is larger than zero.15 The unemployment spells are measured indays.
A consequence of the above sampling schemes is that the risk set to analyse is smaller forlong unemployment durations than for shorter ones. We have therefore chosen to observeindividuals during their first 1.5 year of unemployment (n = 6634). In a practical sense thisapproach implies that individuals who have been unemployed at least 540 days on 1 January1996 are excluded from analysis, and that unemployment spells that are longer than 540days(conditional on being included) are treated as right-censored. Some of our preliminaryresults also pointed out that differences between Swedish-speakers and Finnish-speakersare relatively small for long unemployment durations.
The conditional probability (i.e. the risk) of ending unemployment will be analysed byusing a so called piece-wise constant exponential hazard model. Such a model enables
a flexible non-parametric analysis of the duration dependence of the underlying process.
15 For example, the starting time of an unemployment spell that begins at 29 December 1995 takes the value 3.
8/3/2019 Saarela Unemployment
http://slidepdf.com/reader/full/saarela-unemployment 14/22
72 J. Saarela, F. Finnäs / Journal of Socio-Economics 32 (2003) 59–80
This means that transitions from unemployment need not be monotonic with regard tounemployment duration. This consequently makes the estimates concerning the impact of native language on unemployment duration more reliable than with a parametric model.
Both the explanatory variables that are used, as well as their effects, are assumed to betime-invariant. The time-varying effect is captured by the baseline hazard in the model. Thishazard is restricted to be constant within a defined time interval and may consequently varyonly between intervals. It is referred to as the risk of ending unemployment subject to thatthe individual has been unemployed until that moment (interval).
The two types of transition from unemployment that are studied, becoming employedand moving out of the labour force, are treated as competing risks. This implies that,when analysing transitions to one state, transitions to the other state are treated as beingright-censored. The two types of transitions are also assumed to be independent.
Blossfeld and Rohwer (1995) provide a more detailed description of the statistical prop-erties of the model. The statistical software being used is TDA 6.3a.
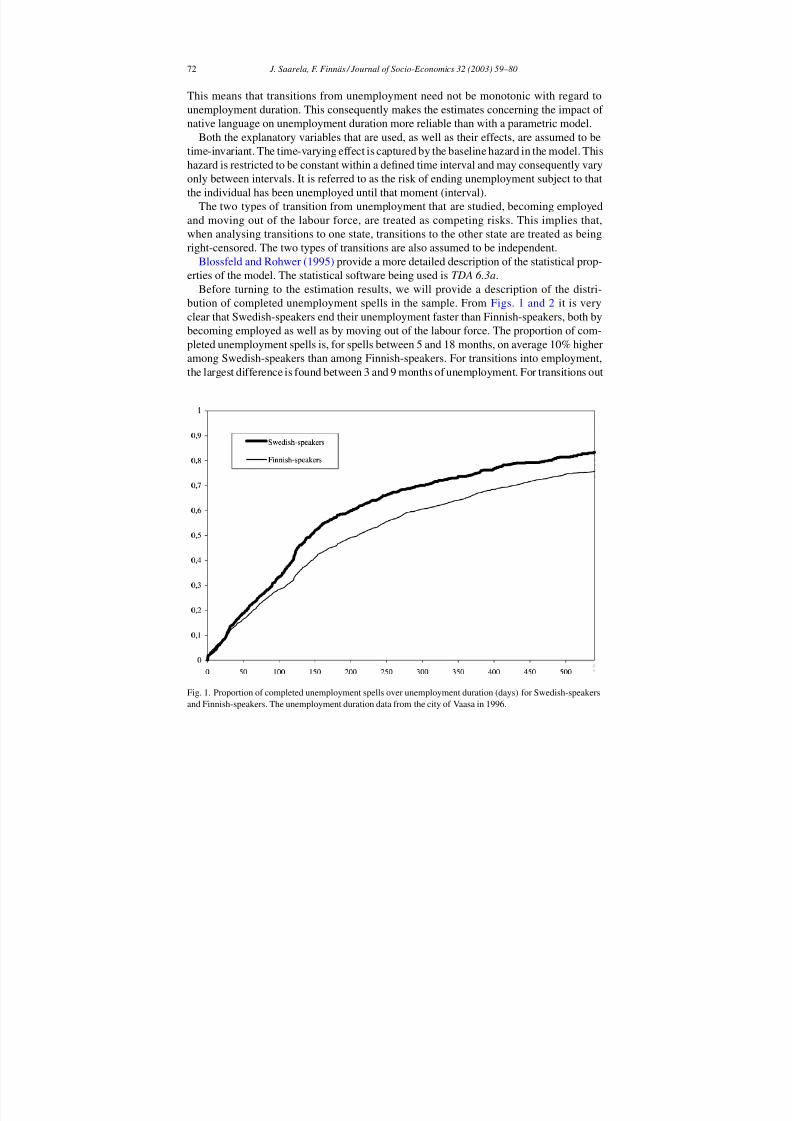
Before turning to the estimation results, we will provide a description of the distri-bution of completed unemployment spells in the sample. From Figs. 1 and 2 it is veryclear that Swedish-speakers end their unemployment faster than Finnish-speakers, both bybecoming employed as well as by moving out of the labour force. The proportion of com-pleted unemployment spells is, for spells between 5 and 18 months, on average 10% higheramong Swedish-speakers than among Finnish-speakers. For transitions into employment,the largest difference is found between 3 and 9 months of unemployment. For transitions out
Fig. 1. Proportion of completed unemployment spells over unemployment duration (days) for Swedish-speakersand Finnish-speakers. The unemployment duration data from the city of Vaasa in 1996.

8/3/2019 Saarela Unemployment
http://slidepdf.com/reader/full/saarela-unemployment 15/22

8/3/2019 Saarela Unemployment
http://slidepdf.com/reader/full/saarela-unemployment 16/22
74 J. Saarela, F. Finnäs / Journal of Socio-Economics 32 (2003) 59–80
the impact of different personal characteristics. Since education clearly must be assumed tobe highly relevant, in terms of its effect on the risk of ending unemployment, it is includedin the first step, i.e. in Model (2). The exogenous personal characteristics age and gender
are included thereafter, whereas previous (most recent) experience in the form of industryand labour market state are added in Model (4) and Model (5), respectively.
As can be seen in Table 8, when including education into the model, the effect of na-tive language decreases fairly drastically. However, even when having controlled also forage, gender, previous industry and previous labour market state, there remains a positiveeffect of being Swedish-speaking (although it is not statistically significant in all cases),both on the transition rate into employment as well as on that out of the labour force.Education consequently explains some, whereas the other personal characteristics (afterhaving controlled for the effect of education) explain fairly little, of the language-groupdifference.
According to Model (5), that includes all control variables, being Swedish-speaking in-creases the transition rate into employment with about 13%, and the transition rate out of the labour force with about 16%, in comparison with being Finnish-speaking.16 Accord-ing to the similar model (with the variables set to their reference levels), 40.7% of theFinnish-speakers are employed after 18 months of unemployment. The corresponding fig-ure for Swedish-speakers is 42.4%. Similarly, 39.9% of the Finnish-speakers have movedout of the labour force after 18 months, while the corresponding figure for Swedish-speakersis 42.4%.
Secondly, we try to depict differences between the baseline hazard for Swedish-speakers
and that for Finnish-speakers, when successively including covariates. The successive tech-nique is chosen, since we would like to study the extent to which the language-groupdifference in the baseline pattern is affected by personal characteristics of the individuals.The choice of, and motivation for, the sequence of variables included is similar to thatdescribed above.
The model that has been specified implies that the effect of a specific characteristic willhave a time-constant effect on the transition rate (i.e. the same effect over the completeduration). The (basic) level of the baseline rate is consequently dependent on the chosenreference category of each covariate. A convenient way to circumvent this problem (subjectto that the model is correctly specified), if one wants to study how the baseline hazard
changes over unemployment duration, is to set the estimate for one of the time intervals of the baseline hazard to zero, and let each of the others measure the absolute difference fromthis level.
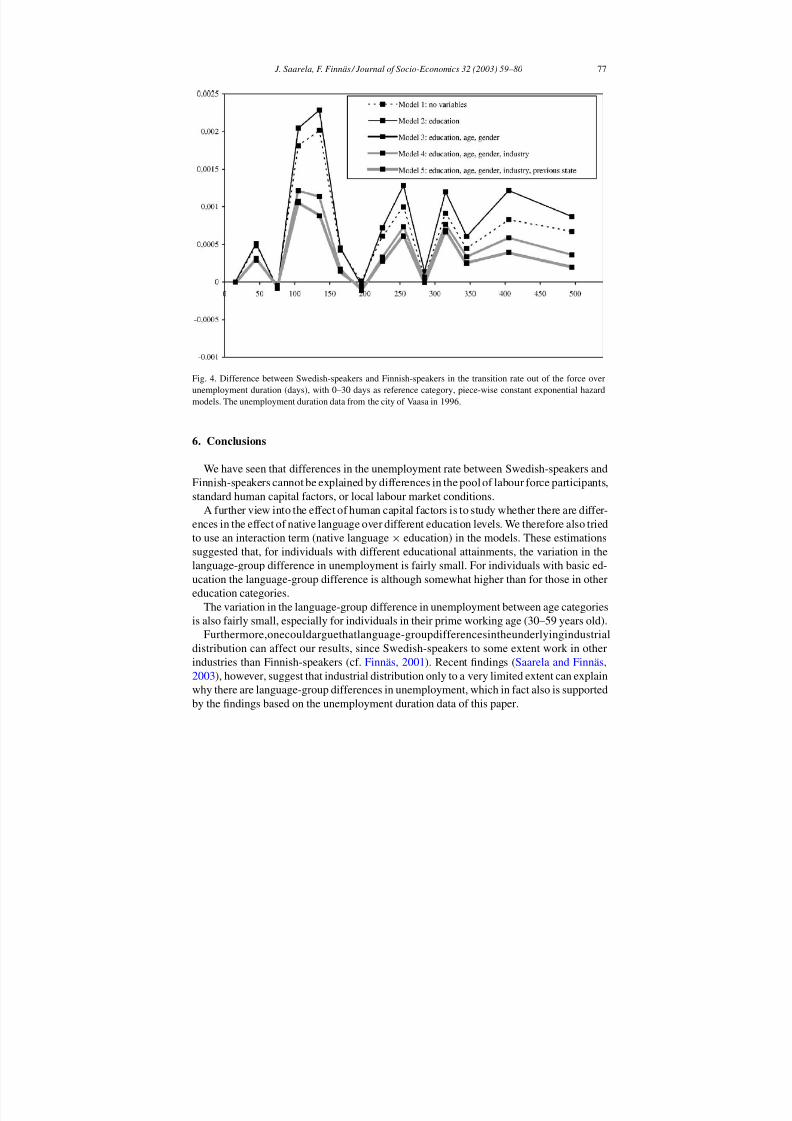
In Fig. 3 (employment) and Fig. 4 (out of the labour force), we let the first time interval(0–30 days) be the reference level, and then measure the difference in the transition rate be-tween language groups, for models that successively include covariates. Hence, an estimatein one of the figures, for each type of model, is interpreted as the difference in the transitionrate between Swedish-speakers and Finnish-speakers, in comparison with the situation at0–30 days of unemployment. The utilised time intervals are 30 days long for the first 12months. Thereafter they are set to 90 days. The difference-in-difference estimates in the
figures are outlined at the midpoint of each time interval.
16 Likelihood ratio tests indicated that Model (5) is the one to prefer.

8/3/2019 Saarela Unemployment
http://slidepdf.com/reader/full/saarela-unemployment 17/22
Table 8Estimates from piece-wise constant exponential hazard models for the unemployment duration data (the city of Vaasa)a
Model (1) Model (2) Model (3) Mode
Employment Out of labourforceemployment
Employment Out of labourforceemployment
Employment Out of labourforceemployment
Emplo
LanguageFinnishb 1 1 1 1 1 1 1Swedish 1.286∗∗ (3.099)c 1.274∗∗∗ (3.899) 1.122 (1.399) 1.187∗∗ (2.726) 1.122 (1.396) 1.165∗ (2.425) 1.144
EducationBasic 0.474∗∗∗ 0.382∗∗∗ 0.543∗∗∗ 0.497∗∗∗ 0.546Lower vocationalb 1 1 1 1 1Upper vocational 1.605∗∗∗ 1.420∗∗∗ 1.580∗∗∗ 1.344∗∗ 1.589Undergraduate 2.329∗∗∗ 1.426∗ 2.379∗∗∗ 1.499∗∗ 2.431Graduate 2.181∗∗∗ 1.183 2.140∗∗∗ 1.137 2.250
Age (years)20–34 1.057 2.068∗∗∗ 1.030
35–49b
1 1 150–64 0.447∗∗∗ 0.519∗∗∗ 0.452
GenderFemale 1 1 1Male 1.092 0.945 0.971
IndustryPrimary 0.412Secondaryb 1Tertiary 0.692Undefined 1.393
Previous labour market stateIn the labour forceb
Outside-the-labour-force
Log likelihood −16796.9 −16596.7 −16424.2 −16334.1 −16304.1
a Exponentiated coefficients are outlined. Estimates for the baseline rate are not shown. All models are estimated with 30 days time intervals. The number of observatiob The reference category.c t -statistic for the language variable is in parenthesis.∗ Significant on 5% level.∗∗ Significant on 1% level.∗∗∗ Significant on 0.1% level.

8/3/2019 Saarela Unemployment
http://slidepdf.com/reader/full/saarela-unemployment 18/22
76 J. Saarela, F. Finnäs / Journal of Socio-Economics 32 (2003) 59–80
Fig. 3. Difference between Swedish-speakers and Finnish-speakers in the transition rate to employment overunemployment duration (days), with 0–30 days as reference category, piece-wise constant exponential hazardmodels. The unemployment duration data from the city of Vaasa in 1996.
The results indicate that, for both types of transition, successively including covariatesinto the model will, for longer unemployment durations, decrease the difference in thetransition rates between the language groups. Specifically for spells longer than 7 months,the difference-in-difference estimates of Model (5) are much closer to zero than those of Model (1). Consequently, differences in the transition rate from unemployment betweenSwedish-speakers and Finnish-speakers may to some extent, for longer unemploymentspells, be explained by differences in personal characteristics.
For shorter ones, however, the story is different. Despite that the effects of educa-tion, age, gender, industry and previous labour market status have been taken into ac-count, there remain substantial differences between the language groups. The resultssuggest that the difference between Swedish-speakers and Finnish-speakers in the tran-sition rate into employment is largest between the fourth and the seventh unemploy-ment month. This may be due to the fact that Swedish-speakers to a greater extent thanthe Finnish-speakers are bilingual, and are consequently needed in seasonal jobs thatrequire good language skills. For transitions out of the labour force the largest differ-ences are found in the fourth and the fifth unemployment month. This could be the re-sult of a higher propensity of Swedish-speakers to begin (higher) education (cf. Table 4).
In any case, the better performance of Swedish-speakers in the labour market is, atleast partly, due to their shorter unemployment spells, specifically in early stages of unemployment.
8/3/2019 Saarela Unemployment
http://slidepdf.com/reader/full/saarela-unemployment 19/22
J. Saarela, F. Finnäs / Journal of Socio-Economics 32 (2003) 59–80 77
Fig. 4. Difference between Swedish-speakers and Finnish-speakers in the transition rate out of the force overunemployment duration (days), with 0–30 days as reference category, piece-wise constant exponential hazard
models. The unemployment duration data from the city of Vaasa in 1996.
6. Conclusions
We have seen that differences in the unemployment rate between Swedish-speakers andFinnish-speakers cannot be explained by differences in the pool of labour force participants,standard human capital factors, or local labour market conditions.
A further view into the effect of human capital factors is to study whether there are differ-ences in the effect of native language over different education levels. We therefore also tried
to use an interaction term (native language × education) in the models. These estimationssuggested that, for individuals with different educational attainments, the variation in thelanguage-group difference in unemployment is fairly small. For individuals with basic ed-ucation the language-group difference is although somewhat higher than for those in othereducation categories.
The variation in the language-group difference in unemployment between age categoriesis also fairly small, especially for individuals in their prime working age (30–59 years old).
Furthermore,onecouldarguethatlanguage-groupdifferencesintheunderlyingindustrialdistribution can affect our results, since Swedish-speakers to some extent work in otherindustries than Finnish-speakers (cf. Finnäs, 2001). Recent findings (Saarela and Finnäs,
2003), however, suggest that industrial distribution only to a very limited extent can explainwhy there are language-group differences in unemployment, which in fact also is supportedby the findings based on the unemployment duration data of this paper.

8/3/2019 Saarela Unemployment
http://slidepdf.com/reader/full/saarela-unemployment 20/22
78 J. Saarela, F. Finnäs / Journal of Socio-Economics 32 (2003) 59–80
We have seen that the lower unemployment rate of Swedish-speakers partly may beattributed to shorter unemployment spells, both with regard to transitions into employmentas well as to transitions out of the labour force. Moving out of the labour force often
implies that the individual begins studies and returns to the labour force later on. The highertransition rate out of the labour force for Swedish-speakers therefore corresponds with theother findings regarding the more favourable position of the ethnic minority in the Finnishlabour market.
In a comparison between the results based on the two utilised data sets, it is, however,quite clear that the lower probability of being unemployed among Swedish-speakers can-not be fully explained by their higher outflow intensity, i.e. by their shorter unemploymentspells. The remaining part is consequently due to differences in the transition rate withregard to the inflow into the unemployment registers. As pointed out earlier, we are not ableto explicitly measure this aspect. A very crude approximation can, although, be obtained if one studies the labour market status of young individuals, who (consequently) have had arecent possibly to enter the labour market. When we tried such an approach with the crosssection data, for individuals aged 20–29, we could see that there were some differencesbetween the language groups. In 1990, when the unemployment rate was low, the propor-tion of employed youngsters was higher among Finnish-speakers, while the proportion of students was substantially higher among Swedish-speakers. In 1995 and 1998, when theunemployment rate was higher, the employment rate and the proportion of students werequite similar between the language groups. The unemployment rate of Finnish-speakerswas, however, somewhat higher. These findings gives an indication that also differences
in inflow into the unemployment register are important determinants of the labour mar-ket performance of each language group. Young Swedish-speakers seem to have a higherprobability of moving directly from being outside-the-labour-force to employment, withoutpassing through the unemployment register, than their Finnish-speaking counterparts.
As pointed out in the theory section, there is no obvious way to differentiate empiri-cally between effects induced by social integration and language proficiency. We cannotconsequently claim that our empirical results are specifically in favour of any of those expla-nations. The underlying reasons behind the lower unemployment rate of Swedish-speakersare therefore still somewhat of a puzzle.
Since the unemployment gap between the language groups remains after we have con-
trolled for the effects of education, age, gender, and municipality of residence, there reallyseems to exist some relevant latent factor(s) that is characteristic for Swedish-speakers inFinland, which improves their labour market performance in comparison with the Finnish-speakers. The questions raised by this study therefore clearly warrant further investigation.Approaches for future analysis could be to utilise longitudinal register data on labour mar-ket status, or to construct survey or census data that include information about individuals’language proficiency, degree of social integration, and job search methods.
Acknowledgements
Financial support from Rektor för Åbo Akademi is gratefully acknowledged (Saarela).Comments from Eskil Wadensjö, Maria Melkersson, seminar participants at the Swedish

8/3/2019 Saarela Unemployment
http://slidepdf.com/reader/full/saarela-unemployment 21/22
J. Saarela, F. Finnäs / Journal of Socio-Economics 32 (2003) 59–80 79
Institute for Social Research (Stockholm University), and anonymous referees have beenvery helpful. The usual disclaimer applies.
References
Arrow, K., 1973. Higher education as a filter. Journal of Public Economics 2, 193–216.Atkinson, A.B., Micklewright, J., 1991. Unemployment compensation and labor market transitions: a critical
review. Journal of Economic Literature 29, 1679–1727.Becker, G., 1957. The Economics of Discrimination. University of Chicago Press, Chicago.Becker, G.S., 1964. Human Capital: A Theoretical Analysis with Special Reference to Education. Columbia
University Press, New York.Becker, G.S., 1967. Human Capital and the Personal Distribution of Income: An Analytical Approach. University
of Michigan Press, Ann Arbor.
Ben-Porath, Y., 1967. The production of human capital and life cycle earnings. Journal of Political Economy 75,352–365.
Blau, D.M., Robins, P.K., 1990. Job search outcomes for the employed and unemployed. Journal of PoliticalEconomy 98, 637–655.
Blossfeld, H.-P., Rohwer, G., 1995. Techniques of Event History Modeling. Erlbaum, Mahwah, NJ.Brenner, R., Kiefer, N.M., 1981. The economics of the diaspora: discrimination and occupational structure. Eco-
nomic Development and Cultural Change 29, 517–533.Chiswick, B.R., 1983a. An analysis of the earnings and employment of Asian-American men. Journal of Labor
Economics 1, 197–214.Chiswick, B.R., 1983b. Earnings and human capital of American Jews. The Journal of Human Resources 18,
313–336.Chiswick, B.R., Miller, P.W., 1995. The endogeneity between language and earnings: international analyses.
Journal of Labor Economics 13, 246–288.Coleman, J., 1988. Social capital in the creation of human capital. American Journal of Sociology 94, 95–120.Drinkwater, S.J., O’Leary, N.C., 1997. Unemployment in Wales: does language matter? Regional Studies 31,
581–591.Ehrenberg, R.G., Smith, R.S., 1994. Modern labor economics—theory and public policy. Harper Collins College
Publishers, New York.Finnäs, F., 1986. Den Finlandssvenska Befolkningsutvecklingen 1950–1980—En Analys av en Språkgrupps De-
mografiska Utveckling och Effekten av Blandäktenskap. Skrifter Utgivna av Svenska Litteratursällskapet iFinland, No. 533. Svenska Litteratursällskapet i Finland, Helsinki.
Finnäs, F., 1993. Finlandssvenskarna 1993—En Statistisk Översikt. Finlandssvensk Rapport, No. 29. SvenskaFinlands Folkting, Helsinki.
Finnäs, F., 1994. Language Shifts and Migration—The Finnish Longitudinal Census Data File as an Aid to SocialResearch. Studies, No. 209. Statistics Finland, Helsinki.
Finnäs, F., 1997. Social integration, heterogeneity, and divorce: the case of the Swedish-speaking population inFinland. Acta Sociologica 40, 263–277.
Finnäs, F., 2000. Tvåspråkiga Familjer i Statistikens Ljus. Forskningsrapport, No. 37. Institutet för FinlandssvenskSamhällsforskning, Vaasa.
Finnäs, F., 2001. Finlandssvenskarna inför 2000-talet—En Statistisk Översikt. Finlandssvensk Rapport, No. 40.Svenska Finlands Folkting, Helsinki.
Gonzalo, M.T., Saarela, J., 2000. Gender differences in exit rates from unemployment: evidence from a localFinnish labour market. Finnish Economic Papers 13, 129–139.
Hannan, C., 2000. Beyond Networks: “Social Cohesion” and Unemployment Exit Rates. Mimeo (April 2000).Institute for Labour Research, University of Essex.
Hoynes, H.,2000. Local labor markets andwelfare spells: do demandconditions matter? TheReview of Economicsand Statistics 82, 351–368.Hyyppä, M.T., Mäki, J., 2001a. Why do Swedish-speaking Finns have longer active life? An area for social capital
research. Health Promotion International 16, 55–64.
8/3/2019 Saarela Unemployment
http://slidepdf.com/reader/full/saarela-unemployment 22/22
80 J. Saarela, F. Finnäs / Journal of Socio-Economics 32 (2003) 59–80
Hyyppä, M.T., Mäki, J., 2001b. Individual-level relationships between social capital and self-rated health in abilingual community. Preventive Medicine 32, 148–155.
Lancaster, T., 1990. The Econometric Analysis of Transition Data. Econometric Society Monographs, No. 17.Cambridge University Press, New York.
Leslie, D., Lindley, J., 2001. The impact of language ability on employment and earnings of Britain’s ethniccommunities. Economica 68, 587–606.
McManus, W., Gould, W., Welch, F., 1983. Earnings of Hispanic men: the role of English language proficiency.Journal of Labor Economics 1, 101–130.
Montgomery, J.D., 1992. Job search and network composition: implications of the strength-of-weak-ties hypoth-esis. American Sociological Review 57, 586–596.
O’Leary, R., Finnäs, F., 2002. Education. social integration and minority-majority group intermarriage. Sociology36, 235–254.
Rivera-Batiz, F., 1990. English language proficiency and the economic progress of immigrants. Economics Letters50, 295–300.
Saarela, J., Finnäs, F., 2003. Can the low unemployment rate of Swedish speakers in Finland be attributed to
language group and industrial structure? In: Saarela, J. (Ed.), Essays on Labour Market Outcomes in theBilingual Area of Finland. Doctoral Dissertation, Department of Economics and Statistics, Åbo AkademiUniversity.
Sandlund, T., 1991. Bilingualism in Finland—Ethnicity and Mobility. Papers, No. 17. SLS Nämnd för Samhälls-forskning, Helsinki.
Sandlund, T., Björklund, K.,1980. Bilinguals in Finland 1950—Ethnicity andMobility. Papers, No.5. SLS Nämndför Samhällsforskning, Turku.
Sowell, T., 1981. Markets and Minorities. Blackwell, Oxford.Spence, M., 1973. Job market signaling. Quarterly Journal of Economics 87, 355–374.Statistics Finland, 1996. Sysselsättningsstatistik 1993–1994. Befolkning, No. 5. Statistics Finland, Helsinki.Wadsworth, J., 1991. Unemployment benefits and search effort in the UK labour market. Economica 58, 17–34.Weiss, A., 1995. Human capital versus signalling explanations of wages. Journal of Economic Perspectives 9,
133–154.