saarc journal of tuberculosis, lung diseases...
TRANSCRIPT

SAARC Journal of Tuberculosis, Lung Diseases and HIV/AIDS
Vol. V No. 1 Year 2008
Editorial Board Chief Editor: Editors
V. S. Salhotra K. K. Jha L. Shrestha
Co-editors:
A. Weerakoon D. K. Khadka
Editorial Board Members from Member States:
SAARC Journal of Tuberculosis, Lung Diseases and HIV/AIDS is published and distributed by:
SAARC Tuberculosis and HIV/AIDS Centre (STAC) Thimi, Bhaktapur
G.P.O. Box 9517, Kathmandu, Nepal Tel.: 00977-01-6632601, 6632477, 6631048
Fax: 00977-1-6634379 E-mail: [email protected]
Website: www.saarctb.com.np
Khaled Seddiq, Afghanistan Md. Abdul Awal Miah, Bangladesh
Gado Tshering, Bhutan L. S. Chauhan India
Ibrahim Shaheem, Maldives Pushpa Malla, Nepal
Noor Ahmed Baloch, Pakistan Chandra Sarukkali, Sri Lanka

i
Instructions to Authors
SAARC Journal of Tuberculosis, Lung Diseases and HIV/AIDS is the official journal of SAARC TB and HIV/AIDS Center (STAC) which is published every six-month. It publishes original articles, review articles, short reports and other communications related to TB, Lung diseases and HIV/AIDS. The journal welcomes articles submitted in all aspects of Tuberculosis, lung health and HIV/AIDS including public health related issues such as cost benefit analysis, health systems research, epidemiological and interventions studies.
Submission of article is a representation that the manuscript has not been published previously in any other journals and is not currently under consideration for publication.
Article should be sent through E-mail ([email protected]) to STAC.
Use double spacing throughout, including title, abstract, text, acknowledge, reference, table and legends for illustrations. Begin each of the following sections on a separate paper. Number the pages consecutively.
Title page should contain (a) concise title, (b) a short summary, (c) first name, middle name and last name of each author, (d) name of department(s) and institution(s) to which the work is done (e) name, e-mail and postal address of author responsible for correspondence about the article.
Abstract:
Should not be of more than 200 words and should state the purpose of the study or investigations, basic procedure, main findings (give specific data and statistical significance if possible) and the conclusion (emphasize new or important aspects of the study).
Key words:
Below the abstract- identify 3-10 key words to assist indexers in cross-indexing the article. Non-standard abbreviations should be avoided. Generic name of the drugs should preferably be used; proprietary name may be used along with the generic name.
Text:
It should be divided into sections with headings as Introduction, Methods, Results, Discussion, Conclusion and References.
Introduction:
It should state the purpose of the study and summarize the rationale for the study. It should have pertinent references but not extensive review of the subject.
Methods:
Describe the criteria for selection of cases; identify the methods, apparatus (manufacturer’s name) and procedures in detail.

ii
Results:
Present the results in sequence in the text, tables and figures. Do not repeat all the data in the tables and/or figures in the text. Summarize the important points only. Mention the methods used for statistical analysis.
Tables:
Type each table on a separate sheet. Use double space. Give a brief title for each table. Cite each table in the text in consecutive order.
Figures:
Should be professionally drawn, free hand lettering is unacceptable. Illustrations can be photographed (Black and White glossy prints) and numbered. If photographs of persons are to be used, either take permission from the person or make the picture unidentifiable. Each figure should have a label pasted on its back indicating name of the author at the top of the figure.
Discussion:
Comment on the observations of the study and the conclusions derived from it. Do not repeat the data in detail that already given in the results. Give implications of the findings, their limitations and observations to other relevant studies. Avoid unqualified statements and conclusions, which are not completely supported by the data. Avoid claiming priority. New hypothesis may be labeled as recommendations.
Reference:
Number references consecutively, as they appear in the text; tables and figures. List all authors. Avoid using abstracts, unpublished data, and personal communications as references. Include references, which have been accepted for publication but not published by denoting “in press”.
Send all manuscripts to: Chief Editor SAARC Journal of Tuberculosis, Lung Diseases and HIV/AIDS SAARC Tuberculosis and HIV/AIDS Centre, Thimi, Bhaktapur G. P. O. Box 9517, Kathmandu, Nepal. Tel: 00977-1-6631048, 6632601, 6632477 Fax: 00977-1-6634379 E-mail: [email protected] Website: www.saarctb.com.np All rights reserved, any part of this publication may be reproduced, stored in a retrieval system or transmitted in any form. However, it should be acknowledged. The publisher and the members of editorial board cannot be held responsible for errors or for any consequences arising from the use of the information contained in this journal.
Editorial Multi Drug Resistant Tuberculosis (MDR-TB) and Drug Susceptibility Test (DST)
The spread of multiple drug resistant strains of Mycobacterium tuberculosis has become a major public health concern in both developed and developing countries. Factors contributing to outbreak and continued spread of multi-drug resistant tuberculosis (MDR-TB) include non efficient implementation of DOTS strategy, insurgence of HIV/AIDS, poor adherence to DOTS treatment and laboratory delays in identification and susceptibility testing of Mycobacterium tuberculosis isolates. Commitment to TB Control seen in recent years, including new legislation updating the TB strategy, and the nationwide implementation of TB control activities, including management of MDR-TB cases and upgrading of diagnostic services indicates positive momentum, but efforts need to be accelerated to impact what appears to be a growing epidemic of drug resistant TB. The accurate drug susceptibility test method is very important to determine the exact susceptibility of M. tuberculosis. Many methods of drug susceptibility testing of Mycobacterium tuberculosis such as proportion method, absolute concentration method and the resistance ratio method are used globally but the main disadvantage of these methods are dependent on culture and henceforth time consuming. In this issue of the journal, Acharya S et al provide evidence that both proportion and resistance ratio method which is equally good for determining drug susceptibility of Mycobacterium Tuberculosis. DST for first line anti-TB drugs has been thoroughly studied and consensus reached on appropriate methodologies. However, it is widely acknowledged that newer, rapid phonotypic and genotypic DST methods hold considerable promise for the rapid diagnosis of MDR-TB as well as opportunities for scaling up surveillance of resistance. Optimal management of drug resistant TB requires both mycobacterial and clinical laboratory services. Inadequate laboratory capacity now presents one of the greatest obstacles to achieving the targets set out in the STOP TB Global Plan. All SAARC countries also identify laboratory capacity as their primary bottle neck. A country or region can control and prevent drug resistant TB only, if infectious patients are detected and cured without delay. Ready access to microscopy for Acid Fast Bacilli, culture and DST free of charge to the patient are essential elements of political commitment to control drug resistance TB. The Supranational Reference Laboratory Network (SRLN) plays a critical role in capacity strengthening of laboratories world wide and provides the backbone for surveillance activities. STAC has initiated its efforts to upgrade its reference laboratory to serve as Supranational Reference laboratory for the region for supporting member countries. Good laboratory infrastructure for Mycobacterium tuberculosis culture and drug sensitivity testing is a pre-requisite for initiation of DOTS PLUS Projects.

SAARC Journal of Tuberculosis Lung Diseases & HIV/AIDS 1
BASELINE CHARACTERISTICS OF PATIENTS AND THE EFFECT OF FIXED-DOSE COMBINATION CHEMOTHERAPY ON SPUTUM CONVERSION
TIME IN ACTIVE PULMONARY TUBERCULOSIS: A Preliminary Study in Kandy District, Sri Lanka
Jayawardena K. A. S., Samarathunga M. District Chest Clinic Kandy, Sri Lanka Abstract Main Objective: To evaluate the effect of Fixed-Dose Combination (FDC) drugs on sputum conversion time in active tuberculosis. Method: A prospective study of 58 active pulmonary tuberculosis patients in Kandy District Sri Lanka. Results: The mean sputum conversion time was 3.836 weeks (SD 2.599) and the median was 4.00 weeks. The sputum conversion rate at the end of 8 weeks was 96.36%. Initial bacillary load indicated by sputum smear grading was highly correlated with sputum conversion time (r = 0.531 P = 0.000). Gender was associated with sputum conversion time. Women had significantly shorter sputum conversion time. (T value =2.23, P = 0.03, Df = 48). Heavy smoking was associated with delayed sputum conversion in male patients (p = 0.01). Conclusion: Use of FDC in active pulmonary tuberculosis yields high sputum conversion rate with a mean sputum conversion time of 3.4 weeks. Faster sputum conversion among women may be attributed to their stronger genetic constitution and healthy lifestyles. Heavy smoking is associated with delayed sputum conversion. Key words: FDC Drugs; sputum conversion time; pulmonary tuberculosis; Sri Lanka;
Introduction
Tuberculosis (TB) remains as a significant public health problem in Sri Lanka. Every year there are 8000 – 10,000 new cases and about 300 deaths of tuberculosis are reported by the national TB control programme in the country.1 Sri Lanka implemented Directly Observed Treatment Short course (DOTS) in the national TB control programme in 1997. One key element of DOTS strategy is the use of short course chemotherapy regime under direct observation. This ensures patients taking right drugs in correct doses at correct intervals for correct period of time.
FDC drugs are said to be a quality combination of Anti-TB drugs in a single tablet. FDC simplifies the administration of drugs in many ways. Patients have fewer tablets to swallow, which in turn improve their compliance. Having fewer tablets to handle, supervision of drug intake becomes quicker. FDC also reduces potential prescription and counting errors of health care workers administering DOTS. If treatment is not observed, patients cannot be selective in the choice of drugs to ingest. With FDC ordering of drugs, storage, and stock control is simple and time saving. From the programme point of view, calculating drug needs, procurement, distributing and stoking throughout the programme will become simpler and probably be cost effective. WHO

SAARC Journal of Tuberculosis Lung Diseases & HIV/AIDS 2
strongly recommends the use of FDC drugs for treatment of tuberculosis.2 In the year 2005, FDC drugs were introduced to Sri Lanka. A study conducted in Taiwan Su and Perng have found that FDC was equally effective as separate drugs in the management of active pulmonary tuberculosis.3 It is stated that patients soon become non-infectious when they are started on anti TB treatment. How soon a patient becomes non-infectious is a frequently ask question by health care workers and family members of the patients when they are asked to take care of patients. Sputum conversion time is a rough measure of the period of infectiousness. It is generally accepted that a patient with a long sputum conversion time transmits the disease for a longer period. Use of FDC drugs in DOTS is a new experience to Sri Lanka. Since its introduction, these drugs have been extensively used by the doctors in TB control. To our knowledge, no information is available about the effect of FDC chemotherapy on sputum conversion time in Sri Lankan patients. The main objective of this study was to evaluate the effect of FDC chemotherapy on sputum conversion time in active pulmonary tuberculosis. In addition this study attempted to find out the association between sputum conversion time with some selected patients’ characteristics. We believe that the results of this preliminary study will help to disseminate the knowledge among doctors with regard to the pattern of sputum conversion time with FDC drugs and other factors associated with it. It is also hoped that the experience and information obtained from this study will serve as a basis for a large scale study in future. Method Design and set up This is a prospective study of smear positive PTB patient who were started on anti TB treatment at the District chest clinic Kandy. This clinic is the second largest TB control unit in Sri Lanka and serves as a training centre in respiratory medicine as well.
Sample size and method of sampling All PTB smear positive patients who started treatment and registered for follow up in the chest clinic Kandy from 1.10.2006 to 31.12.2006 were selected. Following categories of patients were excluded from the study.
• Patients who started treatment out side and transferred to the chest clinic Kandy.
• Patients who interrupted treatment due to adverse effects of drugs and other reasons.
• Patient who started treatment at the chest clinic Kandy and transferred out to other districts.
Data collection An interviewer administered structured questionnaire was used to collect patient’s information. With informed voluntary consent, each patient’s demographic profile, potential risk factors, weight, height, results of pre treatment and follow up investigations were all collected and recorded. Patients were diagnosed as PTB smear positive when they were found positive for acid fast bacilli after examining three sputum samples. Spot, early morning and spot sputum samples were collected for direct sputum smear microcopy from each TB suspect for the diagnosis. Follow up sputum examinations were done weekly intervals after starting anti TB treatment. Two sputum samples (early morning and spot) were examined at each visit. Once a patient was found negative for AFB, at least one set of sputum sample was examined again at the following week to confirm the results. In addition, sputum samples of all patients in the study group were again tested routinely at the end of intensive phase of the treatment. All sputum examinations were done at the chest clinic sputum microscopy lab by qualified staff adhering to WHO recommended procedures. Positive sputum smears were graded using standard counting techniques.4 The AFB grading was recorded as scanty, 1+, 2+, and 3+ according to the bacterial count observed in the oil immersion

SAARC Journal of Tuberculosis Lung Diseases & HIV/AIDS 3
field. Body Mass Index (BMI) categorization was done using standard reference values for different age groups.5 Patients were reviewed at weekly intervals at the District chest clinic while they were on directly observed treatment daily at respective DOTS centres.
Data analysis Data were entered and analyzed using Minitab computer software package. Statistical analysis was performed using correlation analysis, t tests, and χ2 test whenever appropriate. P value of < 0.05 was considered statistically significant. Results A total of 58 PTB smear positive patients were selected and regularly followed up for the study. Three patients died during the period of follow up. Six patients belonged to the category II treatment regimen. Table 1 Demographic Characteristics of patients (n=58) Table 2 Distribution of patients by level of Body Mass Index (BMI) n=55
BMI Frequency % Normal 8 14.6 Low 18 32.7 Very low 29 52.7
Table 3 Smoking and alcohol consumption pattern among males (n=38)
Factor Alcohol addict
Occasional or non-drinker
Total
Heavy smoker Mild or non-smoker Total
13 7 20
9 9 18
22 16 38
X2 = 0.87, P = 0.35
Table 4 Distribution of patients by the AFB grading of pre-treatment sputum smear results (n=58) Table 5 Results of weekly sputum smear examination (Cat I & II combined)
Mean = 3.83 weeks ± 2.55 Median = 4 weeks Table 6 Results of weekly sputum smear examination (Cat II)
Variable Frequency
% Age Group
0-15 01 1.72 16-30 15 25.8631-45 14 24.1446-60 17 29.3161-75 10 17.72>75 01 1.72 Sex Male 38 65.52Female 20 34.48Ethnic Group Sinhala 41 70.69Tamil 09 15.52Moor 08 13.79Level of education Not gone to school 08 14 Primary (Gr1-5) 14 24 Secondary (Gr6-12) 35 60 Higher 01 02
Week Number converted
Cumulative frequency
Cumulative %
01 15 15 27.27 02 4 19 34.55 03 7 26 47.27 04 11 37 67.27 05 7 44 80.00 06 1 45 81.82 07 2 47 85.45 08 6 53 96.36 09 0 53 96.36 10 2 55 100.00
AFB Grading Frequency Percentage Scanty 6 10.3 One + 27 46.6 Two + 11 19.0 Three + 14 24.1
SAARC Journal of Tuberculosis Lung Diseases & HIV/AIDS 4
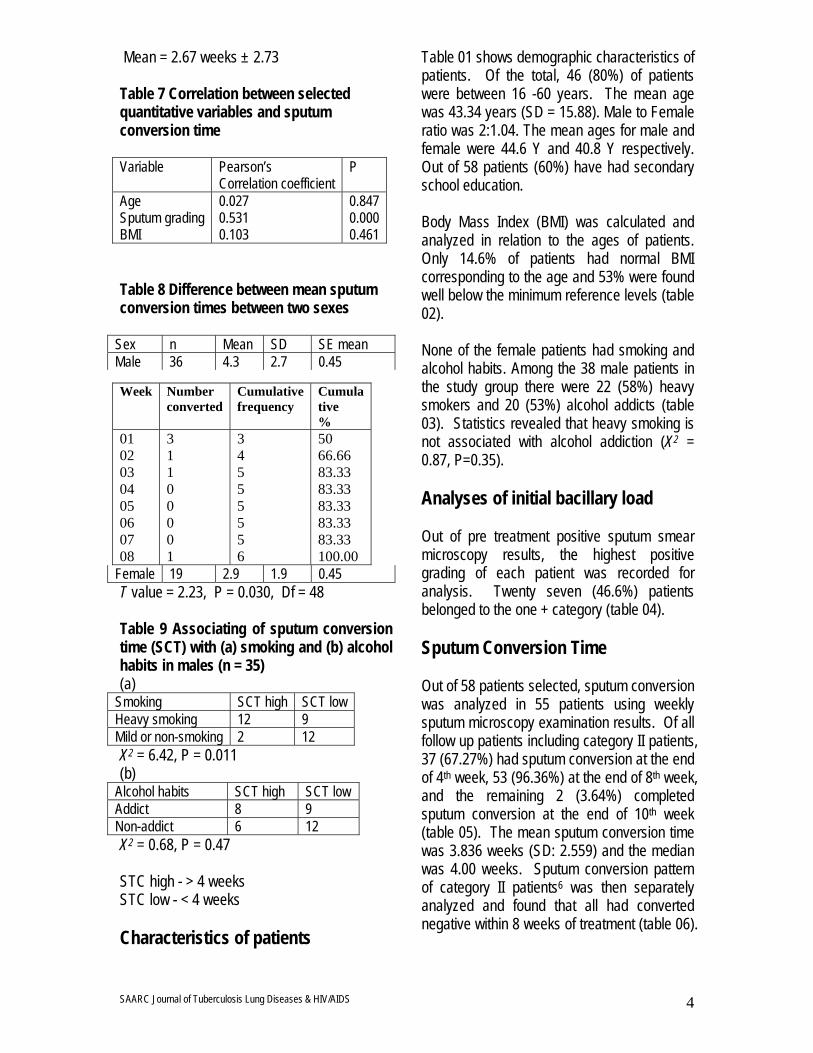
Mean = 2.67 weeks ± 2.73 Table 7 Correlation between selected quantitative variables and sputum conversion time Variable Pearson’s
Correlation coefficient P
Age 0.027 0.847 Sputum grading 0.531 0.000 BMI 0.103 0.461 Table 8 Difference between mean sputum conversion times between two sexes
Sex n Mean SD SE mean Male 36 4.3 2.7 0.45
Female 19 2.9 1.9 0.45 T value = 2.23, P = 0.030, Df = 48 Table 9 Associating of sputum conversion time (SCT) with (a) smoking and (b) alcohol habits in males (n = 35) (a)
Smoking SCT high SCT low Heavy smoking 12 9 Mild or non-smoking 2 12 X2 = 6.42, P = 0.011 (b)
Alcohol habits SCT high SCT low Addict 8 9 Non-addict 6 12 X2 = 0.68, P = 0.47 STC high - > 4 weeks STC low - < 4 weeks Characteristics of patients
Table 01 shows demographic characteristics of patients. Of the total, 46 (80%) of patients were between 16 -60 years. The mean age was 43.34 years (SD = 15.88). Male to Female ratio was 2:1.04. The mean ages for male and female were 44.6 Y and 40.8 Y respectively. Out of 58 patients (60%) have had secondary school education. Body Mass Index (BMI) was calculated and analyzed in relation to the ages of patients. Only 14.6% of patients had normal BMI corresponding to the age and 53% were found well below the minimum reference levels (table 02). None of the female patients had smoking and alcohol habits. Among the 38 male patients in the study group there were 22 (58%) heavy smokers and 20 (53%) alcohol addicts (table 03). Statistics revealed that heavy smoking is not associated with alcohol addiction (X2 = 0.87, P=0.35). Analyses of initial bacillary load Out of pre treatment positive sputum smear microscopy results, the highest positive grading of each patient was recorded for analysis. Twenty seven (46.6%) patients belonged to the one + category (table 04). Sputum Conversion Time Out of 58 patients selected, sputum conversion was analyzed in 55 patients using weekly sputum microscopy examination results. Of all follow up patients including category II patients, 37 (67.27%) had sputum conversion at the end of 4th week, 53 (96.36%) at the end of 8th week, and the remaining 2 (3.64%) completed sputum conversion at the end of 10th week (table 05). The mean sputum conversion time was 3.836 weeks (SD: 2.559) and the median was 4.00 weeks. Sputum conversion pattern of category II patients6 was then separately analyzed and found that all had converted negative within 8 weeks of treatment (table 06).
Week Number converted
Cumulative frequency
Cumulative %
01 02 03 04 05 06 07 08
3 1 1 0 0 0 0 1
3 4 5 5 5 5 5 6
50 66.66 83.33 83.33 83.33 83.33 83.33 100.00
SAARC Journal of Tuberculosis Lung Diseases & HIV/AIDS 5
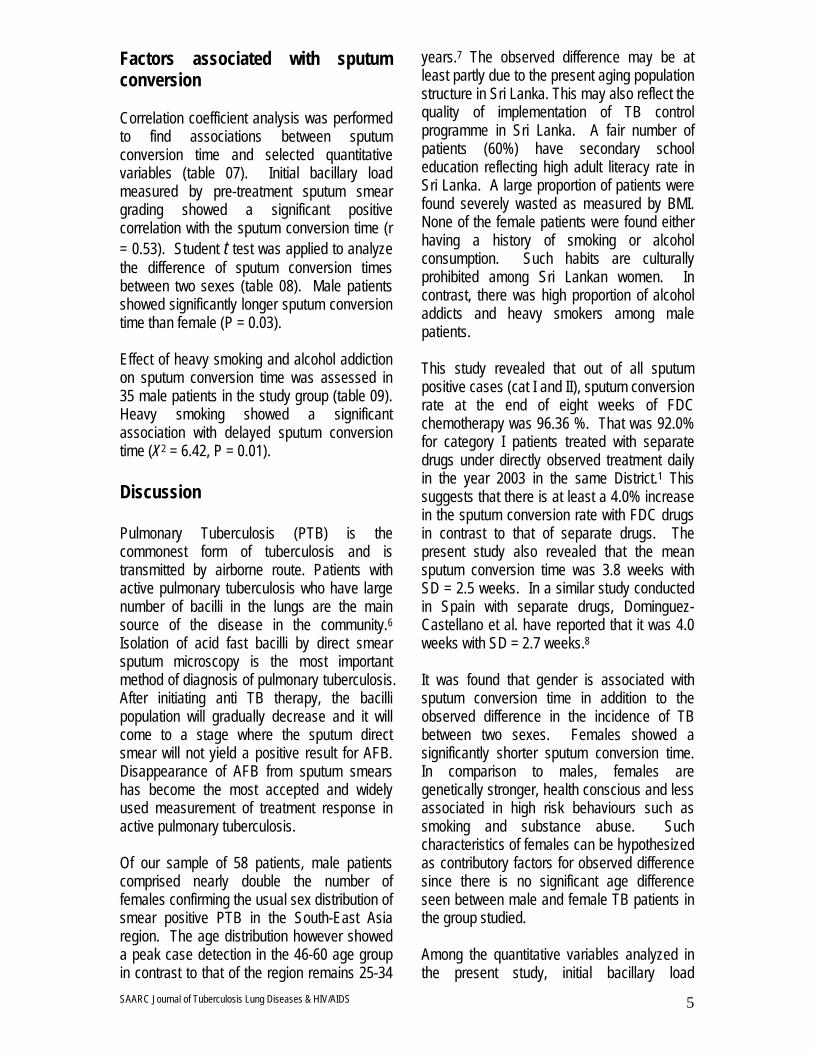
Factors associated with sputum conversion Correlation coefficient analysis was performed to find associations between sputum conversion time and selected quantitative variables (table 07). Initial bacillary load measured by pre-treatment sputum smear grading showed a significant positive correlation with the sputum conversion time (r = 0.53). Student t test was applied to analyze the difference of sputum conversion times between two sexes (table 08). Male patients showed significantly longer sputum conversion time than female (P = 0.03). Effect of heavy smoking and alcohol addiction on sputum conversion time was assessed in 35 male patients in the study group (table 09). Heavy smoking showed a significant association with delayed sputum conversion time (X2 = 6.42, P = 0.01). Discussion Pulmonary Tuberculosis (PTB) is the commonest form of tuberculosis and is transmitted by airborne route. Patients with active pulmonary tuberculosis who have large number of bacilli in the lungs are the main source of the disease in the community.6 Isolation of acid fast bacilli by direct smear sputum microscopy is the most important method of diagnosis of pulmonary tuberculosis. After initiating anti TB therapy, the bacilli population will gradually decrease and it will come to a stage where the sputum direct smear will not yield a positive result for AFB. Disappearance of AFB from sputum smears has become the most accepted and widely used measurement of treatment response in active pulmonary tuberculosis. Of our sample of 58 patients, male patients comprised nearly double the number of females confirming the usual sex distribution of smear positive PTB in the South-East Asia region. The age distribution however showed a peak case detection in the 46-60 age group in contrast to that of the region remains 25-34
years.7 The observed difference may be at least partly due to the present aging population structure in Sri Lanka. This may also reflect the quality of implementation of TB control programme in Sri Lanka. A fair number of patients (60%) have secondary school education reflecting high adult literacy rate in Sri Lanka. A large proportion of patients were found severely wasted as measured by BMI. None of the female patients were found either having a history of smoking or alcohol consumption. Such habits are culturally prohibited among Sri Lankan women. In contrast, there was high proportion of alcohol addicts and heavy smokers among male patients. This study revealed that out of all sputum positive cases (cat I and II), sputum conversion rate at the end of eight weeks of FDC chemotherapy was 96.36 %. That was 92.0% for category I patients treated with separate drugs under directly observed treatment daily in the year 2003 in the same District.1 This suggests that there is at least a 4.0% increase in the sputum conversion rate with FDC drugs in contrast to that of separate drugs. The present study also revealed that the mean sputum conversion time was 3.8 weeks with SD = 2.5 weeks. In a similar study conducted in Spain with separate drugs, Dominguez-Castellano et al. have reported that it was 4.0 weeks with SD = 2.7 weeks.8 It was found that gender is associated with sputum conversion time in addition to the observed difference in the incidence of TB between two sexes. Females showed a significantly shorter sputum conversion time. In comparison to males, females are genetically stronger, health conscious and less associated in high risk behaviours such as smoking and substance abuse. Such characteristics of females can be hypothesized as contributory factors for observed difference since there is no significant age difference seen between male and female TB patients in the group studied. Among the quantitative variables analyzed in the present study, initial bacillary load
SAARC Journal of Tuberculosis Lung Diseases & HIV/AIDS 6
measured by sputum smear grading showed a significant positive correlation with sputum conversion time. Similar observation has been reported in other studies.9,10 It has also been reported in another studies that age is significantly correlated with sputum conversion time.8,11 The present study did not show any such association. It was observed that interruptions of treatment due to adverse effects were significantly low with FDC drugs during the study period though it was not objectively evaluated in this analysis. Three deaths that had occurred during the early part of the treatment were associated with late diagnosis and presence of complications such as severe bronchiactasis and diabetes mellitus. Better patient compliance and evidence of easy administration of drugs were also experienced with FDC during this study.
Conclusions With FDC drugs under directly observed treatment, patients with active PTB become smear negative in 4 weeks on average. Heavy smoking significantly delays sputum conversion. The experience and findings obtained from this study would help to formulate a large scale evaluation of FDC chemotherapy on TB control in Sri Lanka. Acknowledgements We are grateful to the patients who participated in this study for their co-operation. We sincerely thank Dr. Anoma Siribaddana and Dr. Dushantha Medagedara, Consultant Chest Physicians, Kandy and Dr Chantha Jayawardena of University of Peradeniya for their encouragements and valuable advice. The assistance rendered by C. B. Amaranayaka (MRO), laboratory staff and
Medical Officers in the Chest Clinic Kandy are highly appreciated.
References 1 National Programme for Tuberculosis Control and Chest Disease. Administration Report 2004. Colombo: Ministry of Health Sri Lanka, 2004. 2 World Health Organization. Treatment of Tuberculosis: Guidelines for National Programmes. 3rd ed. Genewa: WHO, 2003: 29. 3 Su WJ, Perng RP. Fixed-dose combination chemotherapy (Rifater®/Rifinah®) for active pulmonary tuberculosis in Taiwan: a two-year follow-up. Int J Tuberc Lung Dis 2002; 11: 1029- 1032. 4 Nair N. Diagnosis and Management. In Narayan JP; eds. Tuberculosis: Epidemiology and Control. 1st ed. New Delhi: WHO Regional Office for South-East Asia; 2002: 47-50. 5 Gordon MW, Paul MI. Perspectives in Nutrition. 5th ed. USA: WCB/McGrsw-Hill; 1996: 275. 6 Kumareson J. Epidemiology. In In Narayan JP; eds. Tuberculosis: Epidemiology and Control, 1st ed. New Delhi: WHO Regional Office for South-East Asia; 2002: 16-17. 7 World Health Organization. Tuberculosis Control in the South-East Asia: The Regional Report 2005. New Delhi: WHO Regional Office for South-East Asia, 2005: 11-13. 8 Dominguez-Castellano A, Munian M.A, Rodriguez-Bano J, Garcia M, Rios MJ, Galvez J, Perez-Cano. Factors associated with time to sputum smear conversion in active pulmonary tuberculosis. Int J Tuberc Lung Dis 2003; 7: 432-438. 9 Rieder HL. Sputum smear conversion during directly observed treatment for tuberculosis. Tuber Lung Dis 1996; 77: 124 -9. 10 Lienhardt C, Manneh K, Bouchier V et al. Factors determining the outcome of treatment of adult smear positive tuberculosis cases in the Gambia. Int J Tuberc Lung Dis 1998; 2: 712-8. 11 Guler M, Unsal E, Dursun B, Aydin O, Capan N. Factors influencing sputum smear and culture conversion time among patients with new case pulmonary tuberculosis Int J clin Pract 2007; 61: 231-235.

SAARC Journal of Tuberculosis Lung Diseases & HIV/AIDS
1
Correspondence: Govinda Prasad Dhungana Dept. of Microbiology, Siddhanath Science Campus, Mahendranagar, Kanchanpur E-mail: [email protected] Contact No: 9841351697 (personal), 099521304 (Campus)
BACTERIOLOGICAL STATUS OF TUBERCULOSIS CASES AND TUBERCULOSIS SYMPTOMS IN HIV INFECTED PERSONS IN
KATHMANDU Dhungana G. P.1, Ghimire P.2, Sharma S.3, Rijal B. P.3 1Dept. of Microbiology, Siddhanath Science Campus, Mahendranagar, Kanchanpur 2Central Department of Microbiology, Tribhuvan University, Kathmandu, Nepal 3Tribhuvan University, Teaching Hospital, Kathmandu, Nepal Abstract Background: Clinical presentations of Tuberculosis (TB) vary with in HIV positive and HIV negative individuals. Smear negative tuberculosis is the leading cause of death of HIV patients. Objective: To examine the relationship between bacteriological status of TB cases and TB symptoms in HIV patients. Methods: A cross-sectional analytical study was conducted during January 2004 and August 2005 in a representative sample of 100 HIV infected persons visiting different Voluntary Counseling and Testing Centers (VCT) and HIV/AIDS care centers located in Kathmandu. Laboratory investigation of Tuberculosis was done by AFB staining and culture in ogawa medium. Data obtained through pre structured questionnaire and laboratory investigation were entered into SPSS 11.5 and analyzed. Results: Twenty three percent prevalence of TB is observed in HIV patients. Eighty one percent of the total TB cases were smear negative cases. Significant relationship was observed between the TB symptoms and Smear positive TB cases (χ2 =4.01, p<0.05, at 1 degree of freedom) but no significant relationship could be established between TB symptoms and smear negative cases (χ2 =0.82, p>0.05, at 1 degree of freedom). Mycobacterium avium complex (40.9%) was predominant followed by M. tuberculosis (27.3%) Conclusion: In HIV patients, the utility of direct microscopy of AFB stained smear is limited because most of these patients were smear negative and are asymptomatic. So, direct microscopy in combination with Culture is recommended for higher case finding of TB in HIV patients. Key words: Asymptomatic, smear negative TB, HIV/AIDS, Kathmandu Introduction Among different HIV related opportunistic infections, tuberculosis is the most common one as suggested by the fact that more than a quarter of the 42 million people infected with HIV world wide are also co-infected with TB.1
HIV associated TB has a marked increased mortality rate: up to 25% of patients with Sputum smear positive results and 40-50 % of those with AFB smear negative results die of TB.2 As the types of TB in HIV positive patients differs from those occurring in HIV negative individual, particular features must be taken into account in the case detection, diagnosis and treatment of TB in HIV positive patients. Of importance, the bacteriological status is the key issue concerned with the management of HIV related TB. “Smear negative” and “Smear positive” are the most important bacteriological classification of pulmonary TB cases. Smear
SAARC J. TUBER. LUNG DIS. HIV/AIDS 2008 V (1).........

SAARC Journal of Tuberculosis Lung Diseases & HIV/AIDS
2
positive TB cases means those TB patients with at least two sputum specimen positive for AFB by microscopy or at least one sputum specimen positive for AFB by microscopy, and abnormal chest radiography/Culture positive for Mycobacterium tuberculosis. Smear negative TB cases means those TB patients with at least 2 sputum specimen negative for AFB by microscopy and culture positive for M. tuberculosis.3 Directly observed treatment Short-course (DOTS) is the worldwide accepted TB control strategy which still relies on passive case finding methods. This basic approach in TB control is supposed to be insufficient to control TB in high HIV prevalence region.4 Cough is the most common symptom of TB and present in 95% of the smear positive cases. However, it is not a specific sign of TB since it is present in many conditions affecting the lower respiratory tract i.e. most patients with cough do not suffer from TB. Similarly, Cough and smear positive TB is less common in HIV patients. Often a PTB suspected patients ( i.e. PTB suspects ) has one or more of the following symptoms as well as cough: Respiratory symptoms: Short ness of breath, chest pain, haemoptysis. Constitutional symptoms: Weight loss, loss of appetite, fever, night sweat and tiredness.3 Although microscopic examination of appropriately stained sputum specimen for tubercle bacilli is the quick and easier method it is less reliable in certain cases because it requires between 5,000–10, 000 tubercle bacilli per milliliter sputum for detection of AFB. So, examination by bacteriological culture provides the definitive diagnosis of tuberculosis because as few as ten viable bacilli per milliliter sputum can be detected. Culture increases the number of TB cases often by 30-50 times and it is essential to distinguish different mycobacterial species.5 Atypical mycobacterial lung disease, mainly due to Mycobacterium avium complex, is most prevalent in HIV patients.6
Until now in developing countries diagnosis of smear negative Tuberculosis is rarely done due to concerns regarding the feasibility and cost. However several studies have revealed that smear negative tuberculosis constituted the significant proportion in HIV patients.3 So far in Nepal, the guidelines and policies concerning the case detection of TB in HIV patients are same as that of normal population. The NTP program primarily relied on DOTS and quality assured microscopy. Culture facility is available only on the basis of the first phase treatment result. So, this study is conducted to fill this existing gap concerning the TB culture to these needy individuals. Methodology
This research was approved by Nepal Health Research Council ethics committees and carried out by the central department of microbiology, Tribhuvan University, Kirtipur in collaboration with Tribhuvan University teaching hospital (TUTH), Maharajgunj during January 2004 to August 2005. The cross- sectional study was conducted in a representative sample of 100 HIV infected persons attending different HIV/STI clinics, Voluntary Counseling and Testing Centers and HIV/AIDS care homes located in Kathmandu valley were enrolled in the study. The estimation of sample size was based on the number of People Living with HIV/AIDS (PLWHA) available in different HIV care centres located with in the valley. Major sampling sites included the following: Indoor and out patient department of TUTH (The major sampling site), Nava Kiran Plus HIV/AIDS Care Home, Sparsha Nepal HIV/AIDS Care Home, Karuna Bhavan HIV/AIDS Care Home, Sneha Samaj HIV/AIDS Care Home, Maiti Nepal, Nepal Plus HIV/AIDS Care Home, Vision Plus VCT, SACTS-VCT, Nepal Youth HIV/AIDS Care Home and Blue Diamond Society. Sampling was done by random sampling method. In this process, the name of all the HIV patients residing in the HIV care home / STI clinics were written in separate papers and 50 % of them were selected by simple random technique with out replacement.
SAARC Journal of Tuberculosis Lung Diseases & HIV/AIDS
3
After taking informed consent, pre structured questionnaires were filled on the basis of which the patients were identified as symptomatic or asymptomatic. Those patients who self reported cough for about 2 weeks along with chest pain and other constitutional/respiratory symptoms are considered as symptomatic; otherwise asymptomatic. Every attempt was made to reduce bias during filling up of questionnaire. Three sputum specimens were collected as per WHO guidelines. As asymptomatic patients could not produce the sputum readily, they were instructed to inhale 3-5% saline mist for 15 minutes to obtain induced sputum. Diagnosis of tuberculosis by conventional methods such as direct microscopy of AFB stained smear, AFB culture and identification tests in Mycobacteriology Lab. of TUTH which has been providing quality assured microscopy (and culture) for decades. In direct microscopy three sputum specimens i.e. 1st spot specimen, early morning specimen and 2nd spot specimen were collected, stained by ziehl-Nelsen staining technique and then reporting was done according to WHO/IUATLD positively grading system.7 In culture technique, early morning specimen was subjected to modified petroff's method for decontamination and then inoculated into 3% Ogawa medium followed by incubation at 370c for 8 weeks. In identification tests, the observation of growth rate and pigmentation, Niacin Test, Nitrate Reductase Test and Catalase Test were performed according to WHO manual, 1998.5
The data obtained from questionnaire and laboratory results were entered into SPSS 11.5 and χ2 tests and other relevant statistical tools were applied. RESULTS Of the 100 HIV infected persons, 66 (66%) were males and 34 (34%) were females. Majority of them were in the age group 21-30 (60%) followed by 31-40 (31%). The overall prevalence of tuberculosis (including atypical mycobacterial lung disease) was 23%. More
males were co-infected than females ( male:female = 17:6), and the age group of 21-30 were predominantly co-infected as shown in table 1. Among 5 smear positive cases, 4 cases ( 80%) presented TB symptoms (Both respiratory and constitutional) showing significant relationship between TB symptoms and smear positive tuberculosis (χ2 =4.01 , p<0.05 at 1 degree of freedom ) as shown in table 2. In contrast to this, only 38.8% ( 7 out of 18 ) smear negative TB cases presented both types of TB symptoms and no significant relationship could be established between TB symptoms and smear negative TB (χ 2 =0.82 , p>0.05 at 1 degree of freedom ) as shown in table 3. Analysis of individual symptoms presented by Smear positive, smear negative and Non TB cases reveals that as high as 80% of Smear positive TB cases presented all symptoms of TB where as 38.8% to 55.5% smear negative TB cases presented different TB symptoms. Cough, the major symptom presented by both the TB cases, is less common (only 28.5%) in Non TB cases (Table 4). Although culture detected higher number of TB cases in comparison to direct microscopy of AFB stained smear, one case was detected only by direct microscopy (Table 5). Although one case was culture negative, there was no doubt in smear positive result because the morphology (shape and size) of the mycobacteria is exactly same as that of positive control AFB slide; and positivity grading result of the case was 2+. Furthermore it was known that the patients were under DOTS treatment and hence dead bacilli might have been seen in direct microscopy but not in culture (which require live bacilli to produce colony). Among 22 culture positive isolates, the predominant species was M. avium complex (40.9%) followed by M. tuberculosis (27.3 %) as shown in table 6. At the time of study, only very few cases have done CD4 count and hence staging was done on the basis of sign and symptoms rather than CD4 status (Table 7).

SAARC Journal of Tuberculosis Lung Diseases & HIV/AIDS
4
Table 1 Distribution of HIV patients by TB status, age group and gender
Age group
TB positive
TB negative
Total
Male Female Male Female Male Female No. % No. % No. % No. % No. % No. % 11-20 0 0.0 0 0.0 1 2.0 1 3.6 1 1.5 1 3.0 21-30 12 70.6 3 50.0 25 51.1 20 71.4 37 56.1 23 67.7 31-40 3 17.6 3 50.0 20 40.8 5 17.8 23 34.8 8 23.5 41-50 1 5.9 0 0.0 2 4.1 2 7.2 3 4.5 2 5.8 51-60 1 5.9 0 0.0 1 2.0 0 0.0 2 3.1 0 0.0 Total 17 100 6 100 49 100 28 100 66 100 34 100
Table 2 Relationship between TB symptoms and Smear Positive TB in HIV cases
Smear positive TB TB symptoms χ 2, 1 degree of freedom Yes No Total
Yes 4 1 5 4.01 (p<0.05) No 26 69 95
Total 30 70 100 Table 3 Relationship between TB symptoms and Smear negative TB in HIV cases
Smear negative TB TB symptoms χ 2, 1 degree of freedom Yes No Total
Yes 7 11 18 0.82 (p>0.05) No 23 59 82
Total 30 70 100 Note: Although 10 smear negative TB cases reported cough, only 7 of them reported chest pain along with cough. So, smear negative TB cases with TB symptoms (including chest pain) would be 7. Table 4 Relationship between clinical symptoms of TB and bacteriological status of TB in HIV Positive patients
Symptoms
Smear +ve TB cases n=5
Smear -ve TB cases
n=18
TB negative cases n=77
Total n=100
No. % No. % No. % No. % Fever 4 80.0 7 38.8 29 37.6 40 40.0 Cough 4 80.0 10 55.5 22 28.5 36 36.0 Chest pain/shortness of breath 4 80 8 44.4 31 40.2 43 43 Night sweat 4 80.0 7 38.8 22 28.5 33 33.0 Weight loss 4 80.0 10 55.5 39 50.6 53 53.0
Note- Actually 7 cases are chest pain and one case is shortness of breath (but not chest pain). So if consider only those persons exhibiting cough for 2 weeks along with chest pain also, as the TB symptomatic, we should consider only seven cases as TB symptomatic. This is because we are considering those patients complaining merely shortness of breath (but not chest pain) as TB asymtomatic, whether or not they complain cough. Table 5 Comparative evaluation of direct microscopy with cultural technique for TB diagnosis in HIV Positive patients
AFB culture
AFB staining Inference AFB found AFB not found Total Direct microscopy in
combination with culture is appropriate technique for TB case finding in HIV patients.
Culture positive 4 18 22 Culture negative 1 77 78 Total 5 95 100

SAARC Journal of Tuberculosis Lung Diseases & HIV/AIDS
5
Table 6 Distribution of Mycobacterium species in HIV Positive patients Mycobacterial Species Number of isolates % M. avium complex (MAC) 9 40.9 M. tuberculosis 6 27.3 M. kansasii 4 18.2 M. fortuitum 2 9.1 M. chelonae 1 4.5 Total 22* 100
*One species could not be identified because it was culture negative
Table 7 Periodic prevalence of TB in HIV Positive patients Period Sampling site Sample size WHO staging of HIV TB prevalence
Jan –May 2004 TUTH bed/OPD 25 II-IV 8/25 (32%) June –Aug 2004 Nava Kiran Plus 25 II- IV 5/25 ( 20%) Sept- Nov 2004 Sparsha Nepal 20 I-III 4/20 (20%) Dec 04- Feb 05 SS+MN+KV* 14 I-II 2/14 (14.3%) Mar – May 2005 NP+VP+SVCT* 10 I-II 3/10 ( 30%) June- Aug 2005 NY+BDS 6 I-II 1/6 ( 16.6%)
*SS= Sneha Samaj, MN = Maiti Nepal, KV= Karuna Bhavan, NP = Nepal Plus, VP= Vision Plus, SVCT= SAACT VCT, NY = Nepal Youth, BDS= Blue Diamond Society
Discussion In this study the prevalence of tuberculosis (including atypical mycobacterial lung infection) is found to be 23 % in HIV positive patients of Kathmandu which is in concordance with WHO/UNAIDS report stating one third of HIV/AIDS patients co-infected with tuberculosis.8 In context to Nepal, it was observed that during 1991-2000, 66% of AIDS cases were co-infected with TB.9 Comparatively Lesser prevalence in our study may be due to inclusion of both HIV as well as AIDS cases. Studies done in United Mission Hospital, Tansen showed that TB prevalence in HIV cases increased from 10.8% in 2002 to 39.5% in 2004.10,11 These studies shows that high variation of TB prevalence in HIV patients depending on the nature of surveillance. If sampling is done in patients visiting HIV/STI clinics/ hospital bed, the prevalence will be obviously high. As our study is also primarily hospital based, this may be one of the reasons for observing high TB rate.
One of the important findings of this study is that HIV patients mostly suffers from smear negative tuberculosis (as high as 81.8 % of the total TB cases) and are usually asymptomatic. Other studies have also shown that the usual symptoms of TB are less common in this group
of immunocompromised persons.3 So, they require bacteriological investigation of through culture which is found to be more than 4 times effective than direct microscopy. It has been observed that in general, culture increases the case finding rate by 30 – 40%.5 Furthermore, several comparative evaluation of different diagnostic technique for tuberculosis have concluded that case detection rate of direct microscopy is very low although it is simplest and cost effective.13 This study suggests that unlike the case finding strategy for general population, the TB case finding strategy for HIV patients needs to adopt different approach / policies because higher number of asymptomatic cases were found to be positive for tuberculosis. Another important finding of this study is the documentation of alarmingly higher rate of atypical mycobacterial lung disease (mainly due to Mycobacterium avium complex). It was documented that as high as 50 % of HIV/AIDS patients of western countries were co-infected with Mycobacterium avium complex.12 This can be justified that the HIV patients being highly immunocompromised, even these less virulent mycobacteria (which are abundantly found in envirionment) can cause serious lung disease.
Diagnosis of smear negative tuberculosis is a difficult task. In developing countries, the majority
SAARC Journal of Tuberculosis Lung Diseases & HIV/AIDS
6
of these cases has been treated only on the basis of clinical and chest radiographic findings. Without a standardized clinical work up, the misdiagnosis rates have been estimated as high as 35% to 52%.14 So, it is recommended that the NTP should adopt policies concerning the sputum culture, wherever possible.
Conclusion This study has demonstrated that significantly higher number of asymptomatic HIV patients suffer from smear negative TB. The disease is mainly due to atypical mycobacteria which are rarely detected in direct microscopy. Hence culture is recommended to detect higher number of TB cases in HIV patients.
Limitation of the study As the sampling was done in hospitals, HIV/STI clinics and HIV/AIDS care home located in Kathmandu, the species prevalence of mycobacteria and bacteriological status of TB obtained in our study can not be generalized as national scenario. Acknowledgements The authors would like to acknowledge Tribhuvan University Teaching Hospital for giving permission to use laboratory facilities and Nepal Health Research Council for providing Research Grants. Sincere thanks goes to different HIV/ STI clinics, VCT centers and HIV care homes run by different NGOs and INGOs for their help during specimen collection.
References
1. Corbett E L, Watt C, Walker N, et al. The growing burden of tuberculosis: global trends and interaction with the HIV epidemic. Arch Intern Med 2003; 163: 1009- 1021.
2. Stop TB partnership. Working group on TB-HIV. Scientific panel. Guidelines for implementing collaborative TB and HIV program activities, Geneva, Switzerland: World health Organization, 2003.
3. World Health Organization. Tuberculosis Handbook, 1998; WHO/TB.98.253
4. World Health Organization. First meeting of the Global working group on TB/HIV. 2001. WHO, Geneva.
5. World Health Organization Laboratory Services in Tuberculosis Control, Tuberculosis culture, 1998; WHO/TB.98.258
6. Grange J M. Tuberculosis. Smith G and Easman CF (editors). Topley and Wilson’s principle of Bacteriology, Virology and Immunity, Volume III, 8th
edition. BC Decker Philadelphia Hamilton, 1990; 94 –117.
7. Cheesbrough M. District Laboratory Practice in tropical countries. Part II Cambridge University Press, 2002, 71- 211
8. Sharma SK, Mohan A, Kadhiravum T HIV/TB Co-infection: Epidemiology, diagnosis and management, Indian Journal of Medical Research 2005; 121:550-567
9. Subedi BK HIV-TB co-infection in Nepal. Journal of Institute of medicine 2003; 25 (19-21)
10. Ghimire P, Dhungana JR, Bam DS and Rijal BP Tuberculosis and Human Immunodeficiency Virus Co-infection in United Mission Hospital-Tansen. SAARC Journal of Tuberculosis and Lung disease 2004;1(1):32-38
11. Luitel BR, Lamgade A, Busal L and Napit I. Trends of HIV infection in united Mission Hospital, Tansen: A retrospective Glimpse. Journal of Nepal Medical association, 2005, 44:16 ( 63)
12. Brroks GF, Butel JS, Morse SA. Medical Microbiology. 22nd edition LANGE publication. 2002; 275 – 284.
13. Abdurahman A, Beyene G, Wadajo N. Comparative study of direct sputum microscopy with different sample pre-treatment procedures for examination of acid fast bacilli. Jimma Institute of Health Sciences, Ethiopia(In press)
14. Gordin FM, Slutkin G, Schecter G, Goodman PC, Hopewell PC. Presumptive diagnosis in treatment of pulmonary tuberculosis based on radiographic findings. Am Rev Respir Dis 1989, 139: 1090- 1093

SAARC Journal of Tuberculosis Lung Diseases & HIV/AIDS
1
Correspondence to: Sushma Acharya C/O: Dr. Prakash Ghimire Central Department of Microbiology, Tribhuvan University, Kirtipur, Kathmandu, Nepal. E-mail: [email protected] [email protected]
COMPARISION OF PROPORTION AND RESISTANCE RATIO METHODS FOR DRUG SUSCEPTIBILITY TESTING OF Mycobacterium tuberculosis ISOLATED FROM PATIENTS ATTENDING NATIONAL TUBERCULOSIS
CENTRE, NEPAL
Acharya S1, Ghimire P1, Khadka D. K.2, Nepali S.1
1 Central Department of Microbiology, Tribhuvan University, Kirtipur, Kathmandu, Nepal 2 SAARC Tuberculosis and HIV/AIDS Centre, Thimi, Bhaktapur, Nepal Abstract
Background: Tuberculosis (TB) is among the most serious infectious cause of global morbidity and mortality. Emergence of Multi-drug resistant tuberculosis (MDR-TB) is posing an increased threat to TB control programs. Drug susceptibility testing (DST) of Mycobacterium tuberculosis (M. tuberculosis) isolates is important for tackling such problems. Setting: National Tuberculosis Centre (NTC), Thimi, Bhaktapur, Nepal. Objectives: Comparative evaluation of two in vitro DST methods in determining susceptibility of M. tuberculosis isolates from patients attending NTC, to front-line anti-TB drugs: (Isoniazid-INH, Rifampicin-RFP, Streptomycin-SM, and Ethambutol-EMB). Methodology: This study was conducted from Sep 2006-Jun 2007. A total of 862 sputum samples (diagnosis or follow up cases) collected from patients (type of patients or their categories was not differentiated in this study) attending NTC bacteriology lab for sputum direct smear microscopy were analyzed using fluorescence microscopy. All smear positive samples, smear negative samples requested for culture were cultured. All culture positive samples confirmed as M. tuberculosis by biochemical tests were processed for DST by both proportion (PR) and resistance ratio (RR) methods. Results: Out of 862 sputum samples analyzed, 226 (26.2%) samples were positive for Acid Fast Bacilli (AFB) by fluorescence microscopy. Among 323 samples 226 smear positive samples and 97 smear negative samples requested for culture), 221 (68.4%) were culture positive, 92 (28.5%) were culture negative and 10 (3.1%) were contaminated. Out of 221 isolates of M. tuberculosis, 57.5% were resistant to one or more drugs by the PR method and 56.6% by the RR method. Similarly, MDR isolates were 29.9% and 29% by PR and RR methods respectively. On correlation analysis using Mc Nemar Chi-square test, no significant difference between the two tests were observed (p>0.05). The results showed high agreement between both methods and agreement rates to INH, RFP, SM and EMB were 93.2%, 93.7%, 93.2% and 94.1% respectively. Similarly, the agreement rates between both methods using kappa analysis showed kappa (k) value of 0.86, 0.85, 0.86 and 0.84 for INH, RFP, SM and EMB respectively, which is believed to be good agreement between both methods (k=0.80 to 1.00: Very good agreement). Conclusion: In conclusion, this study showed that both the Proportion and Resistance ratio methods are equally good for determining drug susceptibility of M. tuberculosis. Keywords: Mycobacterium tuberculosis, Drug Susceptibility Testing, Proportion Method, Resistance Ratio Method.
SAARC J. TUBER. LUNG DIS. HIV/AIDS 2008 V (1).........

SAARC Journal of Tuberculosis Lung Diseases & HIV/AIDS
2
Introduction
Tuberculosis (TB) constitutes a major public health problem in most developing countries of the world accounting for the largest burden of mortality due to any infectious agent worldwide. It is estimated that up to one-third of the world’s population is infected with the tubercle bacilli along with the emergence of 450,000 new multi-drug resistant TB (MDR-TB) cases every year.1 In Nepal, about 45% of the total population is infected with TB, of which 60% are adult. Every year, 40,000 people develop active TB, of whom 20,000 have infectious pulmonary disease and 5,000 to 7,000 people die from TB.2 Co-infection with the human immunodeficiency virus (HIV) significantly increases the risk of developing TB.3 According to WHO, more people will die of TB this year than in any other year in history. Of equal concern, however is the emergence and transmission of MDR strains of M. tuberculosis. In light of this frightening scenario, laboratory strategies for reliable drug susceptibility testing (DST) of M. tuberculosis is of prime importance. There are different conventional methods (proportion, resistance ratio, absolute concentration methods), radiometric method and other newer methods used for determining antimicrobial susceptibility pattern. The most extensively used being the proportion (PR) and the resistance ratio (RR) methods. The PR method compares the degree of growth of test organism in drug containing media and drug free media; whereas in the RR method, the resistance of unknown strain of tubercle bacilli (test organism) is compared with that of a standard laboratory strain of M. tuberculosis (H37Rv).4 The accurate DST method is very important to determine the exact susceptibility pattern of M. tuberculosis and hence this study is undertaken to compare the two methods (the PR and the RR methods) for susceptibility testing of M. tuberculosis and to find out the agreement rate between them. Methodology The study was based at National Tuberculosis Centre (NTC), Thimi, Bhaktapur, Nepal.
This study was carried out from Sep 2006-Jun 2007. A total of 862 sputum samples, collected from patients attending NTC, were analyzed further.
Laboratory methodology
a) Specimen collection, microscopic examination and culture: The sputum samples were collected from patients at NTC as per the standard protocol.5 All the sputum specimens were processed for direct smear examination by fluorescence microscopy.5 Positive slides were further confirmed by Ziehl-Neelsen staining. Smear positive samples and culture requested smear negative samples were cultured on 2% Modified Ogawa medium. Mycobacterial cultures were incubated at 37°C for 8 weeks with weekly observation for growth. Bacterial colonies were identified as M. tuberculosis by colony characteristics and biochemical tests.5, 6 b) Drug susceptibility test: All biochemically confirmed M. tuberculosis were subjected for susceptibility studies. The susceptibilities of these strains to each four primary anti-tubercular drugs were tested by both PR and RR methods. i. Proportion Method: Tests were performed using a standard variant of the proportion method7. Drug containing LJ slopes made with the critical drug concentrations for INH, RFP, SM and EMB were 0.25, 40, 4 and 2µg/ml, respectively. The drug free control media were prepared at the same time. The standardized 1 mg/ml bacillary suspension6 (McFarland No. 1) was diluted in sterile distilled water to give 10-1, 10-2 and 10-3 dilutions. From 10-1 dilution, all drug containing media were inoculated with one loop-full of bacillary suspension. Similarly, from each dilution, three controls of plain LJ media were inoculated with the respective diluted bacillary suspension. The slopes were incubated at 37°C, and the results were read on the 28th day. Any colonies growing on drug containing medium inoculated with the 10-1 dilution that equal or more the number of colonies growing on the control medium inoculated with the 10-3 dilution represents 1% or more of the test population. If the calculation was 1% or more then interpreted resistance.

SAARC Journal of Tuberculosis Lung Diseases & HIV/AIDS
3
ii. Resistance Ratio method: Parallel sets of media containing two-fold dilutions of the primary anti-TB drugs were prepared as follows: INH, 0.5 and 1.0 µg/ml; RFP, 32.0 and 64.0 µg/ml; SM, 16.0 and 32.0 µg/ml; and EMB, 4.0 and 8.0 µg/ml.8 One drop (100µl) of 1 mg/ml bacillary suspension (McFarland No. 1) from a Pasteur pipette was spread on the surface of each eight drug containing slopes of media of different concentrations. Similar procedure was applied for H37Rv strain. All these tubes were incubated at 37°C for 4 weeks and observed weekly. For all tests, growth was defined as the presence of 20 or more colonies in the drug containing media. The isolate was considered resistant when the growth appeared on the media containing a given drug in a given concentration in which control strain is susceptible.
Data analysis: All the collected data was processed and analyzed using MS-Excel 2003 and SPSS version 11.5. Results AFB smear microscopy and culture: Out of 862 samples, 588 (68.2%) were from male and 274 (31.8%) were from female. Out of 862 sputum samples, 226 (26.2%) showed AFB on fluorescence staining; of which 173 (76.5%) were from male and 53 (23.5%) were from female (Table 1 and 2). Out of 323 samples (226 smear positive samples and 97 smear negative samples requested for culture), 221 (68.4%) samples were culture positive, 92 (28.5%) samples were culture negative and 10 (3.1%) samples were contaminated (Table 3). Drug susceptibility studies: All 221 biochemically confirmed M. tuberculosis were subjected for susceptibility studies. The susceptibilities of these strains to each drug tested by the PR and RR methods are listed in Table 4. The results of both methods were compared for the rates of susceptible and resistance of strains to all 4 drugs (Table 5). For the PR method; 94 of 221 strains (42.5%) were susceptible to all four drugs, and 127 of 221 (57.5%) were resistant to at least one drug. For the RR method; 96 of 221 strains (43.4%) were
susceptible to all four drugs, and 125 of 221 (56.6%) were resistant to at least one drug. The results of susceptible and resistant rates of M. tuberculosis to these drugs determined by both methods were in very good agreement (k=0.852).9 As shown in Table 6, the PR method identified 57.5% of the isolates as resistant to at least one of the four drugs. Resistance to INH and SM was the highest as both of them at 5.4%, while resistance to RFP was 0.5% and there was no EMB only resistant strain. Resistance to one, two, three and four drugs was observed in 11.3, 14.9, 14.0, and 17.1 % of the isolates respectively. MDR was found in 29.9% of the isolates. Resistance to SM and others, INH and others, RFP and others, and EMB and others was found in 44.8, 50.2, 31.2, and 25.8% respectively.
The RR method identified 56.6% of the isolates as resistant strains. Resistance to INH was the highest at 5.9%, while resistance to RFP and SM were 1.8 and 4.5% respectively. There were no EMB only resistant strains. Resistance to one, two, three and four drugs was observed in 12.2, 17.7, 13.6, and 13.1% respectively. MDR was found in 29% of the isolates. Resistance to SM and others, INH and others, RFP and others, and EMB and others was found in 39.82, 47.06, 32.13, and 21.72%respectively.
Agreement between Proportion and Resistance ratio methods: The percentages of agreement between the PR and the RR methods for antimicrobial susceptibility of 221 M. tuberculosis to INH, RFP, SM and EMB were 93.2, 93.7, 93.2 and 94.1%, respectively (Table 7). Correlation between both methods for determining susceptibilities of these strains to four drugs tested is shown in Table 8. There was high agreement between both methods when tested against INH, RFP, SM and EMB with kappa, k=0.86, 0.85, 0.86 and 0.84 respectively. Statistical comparison using Mc Nemar χ2 test showed the value 0.118, 0.791, 0.007 and 0.022 for INH, RFP, SM and EMB respectively. The tabulated value of chi square at 5% level of

SAARC Journal of Tuberculosis Lung Diseases & HIV/AIDS
4
significance for 1 degree of freedom is 3.84.18 Thus calculated chi square value was less than tabulated value which revealed that there was no
statistically significant difference between both methods for determining susceptibilities to all the four drugs tested (p>0.05).
Table 1 Age and gender-wise distribution of patients attending NTC
S. No. Age group (years)
Gender of the patients Male Female Total
Count % of total Count % of total Count % of total 1 5-10 yrs 2 0.2% 1 0.1% 3 0.3% 2 11-15 yrs 12 1.4% 14 1.6% 26 3.0% 3 16-20 yrs 54 6.3% 29 3.4% 83 9.6% 4 21-25 yrs 77 8.9% 57 6.6% 134 15.5% 5 26-30 yrs 80 9.3% 36 4.2% 116 13.5% 6 31-35 yrs 74 8.6% 17 2.0% 91 10.6% 7 36-40 yrs 43 5.0% 28 3.2% 71 8.2% 8 41-45 yrs 57 6.6% 21 2.4% 78 9.0% 9 46-50 yrs 55 6.4% 26 3.0% 81 9.4% 10 51-55 yrs 30 3.5% 14 1.6% 44 5.1% 11 56-60 yrs 34 3.9% 14 1.6% 48 5.6% 12 Above 60 yrs 70 8.1% 17 2.0% 87 10.1% Total 588 68.2% 274 31.8% 862 100%
Table 2 Gender-wise distribution of fluorochrome stain of the samples
S. No. Fluorescence staining
Gender of the patients Male Female Total
Count % of total Count % of total Count % of total 1 Negative 415 48.1% 221 25.6% 636 73.8% 2 1+ 84 9.7% 25 2.9% 109 12.6% 3 2+ 53 6.1% 14 1.6% 67 7.8% 4 3+ 36 4.2% 14 1.6% 50 5.8%
Total 588 68.2% 274 31.8% 862 100% Table 3 Gender-wise distribution of culture results
S. No. Culture results Gender of the patients
Male Female Total Count Count Count
1 1+ 39 15 54 2 2+ 43 13 56 3 3+ 85 16 101 4 4+ 6 4 10 5 Contamination 8 2 10 6 Negative 64 28 92
Total 245 78 323 Table 4 Pattern of susceptibilities to four anti-tuberculosis drugs determined by Proportion and Resistance ratio methods S. No. Drugs Proportion method Resistance ratio method
Susceptible Resistant Susceptible Resistant 1 INH 110 111 117 104 2 RFP 152 69 150 71 3 SM 122 99 133 88 4 EMB 164 57 173 48

SAARC Journal of Tuberculosis Lung Diseases & HIV/AIDS
5
Table 5 Comparison between the Proportion and the Resistance ratio methods for susceptible and resistance of isolates of M. tuberculosis to all four primary anti-tubercular drugs
RR method PR method Total Susceptible Resistant Susceptible 87 9 96 Resistant 7 118 125 Total 94 127 221 K=0.852 Table 6 Patterns of resistance of M. tuberculosis to primary anti-tuberculosis drugs determined by the Proportion and the Resistance Ratio methods Pattern No. of strains
PR method % RR method % Resistance 127 57.5 125 56.56 Mono-resistance to
INH RFP SM EMB
25 11.3 27 12.2 12 5.4 13 5.9 1 0.5 4 1.8
12 5.4 10 4.5 0 -- 0 --
Resistance to 2 drugs SM+INH SM+RFP SM+EMB INH+RFP INH+ EMB RFP+EMB
33 14.9 39 17.7 25 11.3 21 9.5 0 -- 1 0.5 1 0.5 4 1.8 3 1.4 10 4.5 3 1.4 2 0.9 1 0.5 1 0.5
Resistance to 3 drugs SM+INH+RFP SM+INH+EMB SM+RFP+EMB INH+RFP+EMB
31 14.0 30 13.6 17 7.7 18 8.1 5 2.3 4 1.8 1 0.5 1 0.5 8 3.6 7 3.2
Resistance to 4 drugs SM+INH+RFP+EMB 38 17.2 29 13.1
MDR-TB INH+RFP SM+INH+RFP INH+RFP+EMB SM+INH+RFP+EMB
66 29.9 64 29.0 3 1.4 10 4.5
17 7.7 18 8.1 8 3.6 7 3.2
38 17.2 29 13.1 Resistance to SM and others 99 44.8 88 39.8 Resistance to INH and others 111 50.2 104 47.1 Resistance to RFP and others 69 31.2 71 32.1 Resistance to EMB and others 57 25.8 48 21.7 Table 7 Percentage agreements between the Proportion and the Resistance Ratio methods for susceptibility testing of M. tuberculosis to each drug tested
S. No Drugs No. of isolates with the following results Percent agreement PR method-Susceptible RR method-Susceptible
PR method-Resistant RR method-Resistant
1 INH 106 100 93.2 2 RFP 144 63 93.7 3 SM 120 86 93.2 4 EMB 162 46 94.1

SAARC Journal of Tuberculosis Lung Diseases & HIV/AIDS
6
Table 8 Comparison between the Proportion and the Resistance Ratio methods for determining susceptibility of M. tuberculosis to four primary anti-tubercular drugs
S. No. Drugs RR method PR method Total K Susceptible Resistant
1 INH Susceptible 106 11 117
0.86 Resistant 4 100 104 Total 110 111 221
2 RFP Susceptible 144 6 150
0.85 Resistant 8 63 71 Total 152 69 221
3 SM Susceptible 120 13 133
0.86 Resistant 2 86 88 Total 122 99 221
4 EMB Susceptible 162 11 173
0.84 Resistant 2 46 48 Total 164 57 221
Discussion During this study, a total of 862 sputum samples were collected from the patients attending NTC. The numbers of male patients were 588 (68.2%) and females were 274 (31.8%). Out of 862 samples, 226 (26.2%) samples were smear-positive for AFB. The highest numbers of AFB positive cases were seen in male patients than in female. This might be due to more exposure to external environment than females for their job and other activities, and also infected women may progress more frequently to disease and die more rapidly, leaving a cohort with a low prevalence of infection. All 226 smear positive samples and 97 smear negative samples were processed for culture. Out of these total, 221 (68.4%) showed significant growth, 92 (28.5%) samples were culture negative and 10 (3.1%) were contaminated.
In the treatment and control of infectious disease caused by pathogen, susceptibility test is used to select effective antimicrobial drugs. Susceptibility test is also performed to determine the changing pattern of susceptibility among pathogens to antimicrobial drugs. Since drug-resistant TB has increased in incidence and interfered with TB control programs, monitoring of drug resistance patterns is very much important to prevent MBR-TB outbreaks. So, all isolates of M. tuberculosis should be
tested for their susceptibilities to the primary anti-tubercular drugs.
Of the conventional culture-based techniques for antimicrobial susceptibility testing, the Resistance Ratio (RR) and the Proportion (PR) methods are commonly used. The resistance ratio method is still in use in many countries especially the United Kingdom10. However, WHO has recommended the use of the proportion method to be used for determining drug susceptibility of M. tuberculosis. To determine the correlation of the RR and the PR methods for susceptibility testing of M. tuberculosis to the four primary anti-tubercular drugs, all 221 biochemically confirmed isolates were enrolled in this study. In general, the percentages of agreement determined by both methods were high with regard to all drugs tested. This finding was concordant with similar studies done by Laszlo11 which gave overall agreement of both methods higher than 95% to all drugs tested. Similarly Snider12 in a large scale comparative study of drug susceptibility testing of M. tuberculosis stated that a level of agreement of 90 to 95% between two tests must be considered good. This criterion reveals the good agreement rate between both methods in this study.
Both methods vary greatly in drug concentrations and interpretation of the drug resistance results. Since this study was
SAARC Journal of Tuberculosis Lung Diseases & HIV/AIDS
7
performed by using the same inoculum size of each isolate adjusted to McFarland No. 1 for testing by both methods at the same time, no variation in inoculum size occurred. The rate of at least one or more primary drug resistance by the RR method, 125 (56.6%) was slightly less than that of the PR method, 127 (57.5%). For the single drug resistance determined by both methods, distribution rate of resistance to all drugs had no difference. The rate of two and three drugs resistance were also almost similar by both methods. But the rate of four drugs resistance in this study was slightly different between these methods. Siddiqi13 showed the variations of the results have always been a problem for in vitro susceptibility testing especially at lower concentrations. Two concentrations of all drugs were used by both methods, and the high concentration had the percentage of resistance less than low concentration (result not shown). The rate of MDR-TB in this study was similar between these methods. It was 64 (29%) by RR method and 66 (29.9%) by PR method. The resistance rate was higher because most of the isolates were from relapse, after defaulted, treatment failure and chronic cases (case type not shown in the result section).
There may be several important factors of different susceptibility results: variation in drug stability, and preparation of inoculum size. Susceptibility test results not only depend on the presence or absence of growth on the control and drug-containing media, the inoculum for each culture must also be carefully controlled.15 Furthermore, antimicrobial susceptibility test should be performed preferably with an inexpensive and relatively simple technique.
The RR method compares the resistance of the unknown strain with that of the control strain on the same batch of medium. In this study, H37Rv strain was used as control. Smooth suspensions must be used. Large clumps of bacilli give irregular results and make reading difficult. Resistance can be expressed as the ratio of the MIC (Minimum Inhibitory Concentration) of the test strain to the MIC of the control strain in the same test. The resistant strains give the ratio of 4 or more.16 To determine the ratio, too many sets
of media containing two fold dilutions of the drug should be prepared which is very tedious and expensive. So, in this study for each drug tested, only two concentrations were used for both test and control strain. The RR method was convenient for inoculum preparation and required a shorter time. Interpretation of the result was rather simple.
For PR method, several dilutions of the inoculum were made and both drug-free and drug-containing media were inoculated. This method was technically very difficult. There was much risks attached to standardizing the inocula than with the RR method. However, there are several new methods e.g. E-test, Alamar blue assay, DNA probes and molecular finger-printing, but these methods are more expensive, require specialized equipment and highly skilled personnel. Thus, they are difficult for use in general laboratories although they provide results within 1-5 days.
While comparing the RR and the PR methods, Mc Nemar χ2 test showed no significant difference between both methods and there were very good agreement rates of the both methods when compared using kappa analysis with kappa value 0.864, 0.854, 0.861, and 0.838 for INH, RFP, SM and EMB respectively. Similar results were shown by the study done by Tansuphasiri8 with kappa value 0.929, 0.621, 0.893 and 0.620 for INH, RFP, SM and EMB respectively. The closer kappa is to 1.0, the higher the accuracy of the data.
Among the tested antimicrobial agents, this in vitro testing showed EMB was the most effective drug followed by RFP. EMB is effective against drug resistant strains of M. tuberculosis, with bacteriostatic effect. Similarly, RFP is active against both drug sensitive and resistant strains of M. tuberculosis. Literature reviews and the present study clearly showed that both RFP and EMB are most effective drugs. Higher rates of resistance to INH and SM might be due to the fact that because of their low cost and wide spread use in the treatment of TB.17
Conclusion In this study, the highest agreement has been observed between the resistance ratio and
SAARC Journal of Tuberculosis Lung Diseases & HIV/AIDS
8
proportion methods (with agreement rate to INH, RFP, SM and EMB of 93.21, 93.67, 93.21, and 94.12% respectively) and the correlation between both methods to the four primary anti-tubercular drugs tested was not statistically significantly different by Mc Nemar χ2 test (p>0.05). Similarly, the kappa (k) value for INH, RFP, SM and EMB were 0.864, 0.854, 0.861 and 0.838 respectively which showed good agreement between both methods. The proportion method has been recommended by WHO for determining drug susceptibility of M. tuberculosis however, the resistance ratio method is also equally compatible and hence can be used for drug susceptibility testing. The proper determination of drug resistance by the proper method is helpful to minimize the spread of drug-resistant TB. Acknowledgements The authors would like to thank all the staffs of National Tuberculosis Centre and SAARC Tuberculosis and HIV/AIDS Centre, Thimi, Bhaktapur, Nepal for their constant help during this study. References 1) World Health Organization. Tuberculosis facts.
WHO, Geneva 2007; WHO / HTM / STB / fact sheet / 2007.1
2) Annual Report, National Tuberculosis Control Programme, 2005/2006. Thimi, Bhaktapur, Nepal: National Tuberculosis Centre, 2007
3) World Health Organization. Treatment of Tuberculosis, 3rd edition, WHO, Geneva 2003; WHO/CDS/TB/2003.313:11
4) Rieder HL, Chonde TM, Myking H, et al - A. The public health service national tuberculosis reference laboratory and the national laboratory network: Minimum requirements, role and operation in a low-income country. IUATLD, France, 1998
5) World Health Organization. Laboratory services in tuberculosis control Part II and III. WHO, Geneva 1998; WHO/TB/98.258
6) Fujiki A. TB Bacteriology examination to Stop TB. The Research Institute of Tuberculosis, JICA, Japan, 2001
7) Tuberculosis Program World Health Organization/International Union Against Tuberculosis and Lung Disease. Guidelines for surveillance of drug resistance tuberculosis. Document WHO/TB/94
8) Tansuphasiri U, Subpaiboon S and Rienthong S. Comparison of the resistance ratio and proportion methods for antimicrobial susceptibility testing of Mycobacterium tuberculosis. J Med Assoc Thai. 2001;84:1467-1476
9) Thompson WD and Walter SD. Kappa and the concept of independent errors. J Clin Epidem. 1988;41:969-970
10) Kent PT and Kubica GP. Public health Mycobacteriology: A guide for the level III laboratory. US Department of Health and Human services, Public health service, CDC, Georgia, 1985
11) Laszlo A, Gill P, Handzel V, et al - Conventional and radiometric drug susceptibility testing of Mycobacterium tuberculosis complex. J Clin Microbiol. 1983;18(6):1335-1339
12) Snider DEJ, Good RG, Kilburn JO, Laskowski LFJ, Lusk RH, Marr JJ, Reggiardo Z and Middlebrook G. Rapid susceptibility testing of Mycobacterium tuberculosis. Am Rev Respir Dis. 1981;123:402-406
13) Siddiqi SH, Hawkins JE and Laszlo A. Interlaboratory drug susceptibility testing of Mycobacterium tuberculosis by a radiometric procedure and two conventional methods. J Clin Microbiol. 1985;22:919-923
14) Rist N. Nature and development of resistance of tubercle bacilli to chemotherapeutic agents In: Barry CV (ed.) Chemotherapy of tuberculosis. London, Butterworths: 1964:192-227
15) Canetti G, Fox W, Khomenko A, et al - Advances in techniques of testing mycobacterial drug sensitivity, and the use of sensitivity tests in tuberculosis control programmes. Bull World Health Organ. 1969;41:21-43
16) Grange JM. Mycobacterium In: Greenwood D, Slack RCB and Peuthere JF (eds.) Medical microbiology A guide to microbial infections: pathogenesis, immunity, laboratory diagnosis and control. 16th edition, Churchill Livingstone, India, 2006;200-209
17) Rijal B, Rahman MM and Bam DS. Multidrug resistant tuberculosis: an overview of the SAARC region. STC newsletter 2002;12(1):13-14
18) Sharma P K and Chaudhary A K. Statistical methods. 1st edition, Khanal Books Prakashan, Kathmandu, 2002; 229-404
SAARC Journal of Tuberculosis Lung Diseases & HIV/AIDS 1
Correspondence to:
Dr. Monika Gupta Department of Microbiology UCMS & GTB Hospital, Delhi. E-mail: [email protected]
OPPORTUNISTIC INTESTINAL PROTOZOAN PARASITIC INFECTION IN HIV POSITIVE PATIENT IN JAMNAGAR, GUJARAT
Gupta M.1, Sinha M.2, Raizada N.3 1Department of Microbiology, UCMS & GTB Hospital, Delhi. 2Department of Microbiology, M.P. Shah Medical College, Jamnagar, Gujarat. 3Department of Community Medicine, M.P. Shah Medical College, Jamnagar, Gujarat. Abstract The case definition of AIDS encompasses a spectrum of infections and malignancies, labelled as opportunistic infections. In recent years, numerous studies have outlined the emergence of opportunistic gastrointestinal protozoa that have caused diarrhoeal illness among HIV – AIDS patients. Purpose of present study was to determine the prevalence of opportunistic intestinal protozoal parasites in HIV positive patients with or without diarrhoea. A total of 100 stool samples of HIV positive patients were examined for protozoal parasites by microscopy. Protozoal parasites were detected in 25 HIV positive patients; in 41.37 % of patients with diarrhoea and in 2.38% of patients without diarrhoea. Isospora belli appeared to be a predominant parasite associated with diarrhoea among HIV patients. Cryptosporidium revealed of its asymptomatic carriage along with its association with acute and chronic diarrhoea. Prevalence of Microsporidia and Cyclospora cayetenensis was found to be very low. Key words: HIV, diarrhoea, opportunistic protozoa. Introduction The progressive destruction of immune system by chronic HIV infection leading to progressive fall in level of CD 4 cells ( <200 to<50) is known to be responsible for the occurrence of infections by all types of opportunistic micro – organisms in HIV infected individuals. Protozoal parasites that cause mild to self limited disease in immunocompetant host can cause prolonged, intractable, recurrent and severe diarrhoea in HIV patients inducing weight loss and cachexia. Numerous studies have
outlined the emergence of important gastrointestinal protozoa like Microsporidia sp, Cryptosporidium sp, Isospora belli and Cyclospora cayetenensis.1,2 Besides these, HIV infected individuals also develop infection with Giardia lamblia3 and Entamoeba histolytica.4 Studies have highlighted Cryptosporidium as the predominant pathogen with significant association to diarrhoeal cases5 along with high prevalence of asymptomatic carrier status among HIV positive individuals. Latent infections can be reactivated and may lead to active diseases later when the immunity of patient diminishes further. Isospora belli usually results in protracted and some times profuse diarrhoeal disease (in the absence of appropriate antibiotic therapy) in AIDS patient.6 Studies on intestinal microsporidiosis from developed countries have revealed 6 – 60% prevalence
SAARC J. TUBER. LUNG DIS. HIV/AIDS 2008 V (1).........

SAARC Journal of Tuberculosis Lung Diseases & HIV/AIDS 2
among AIDS patient.2 Cyclosporiasis has been reported with increasing frequency in United States, Latin America, Nepal, Peru & New Guinea. The disease usually presents with watery diarrhoea of 19 – 43 days 7, 8, 9, if diarrhoea in AIDS patients.7 Since the diarrhoea due to parasitic aetiology among HIV patient is on rise during recent times as the reports are being available increasingly with time, the present study was undertaken to examine the prevalence of opportunistic enteric parasites among HIV patients attending G.G.S. Hospital, Jamnagar, Gujarat. Methods A cross-sectional study was carried out in 100 known HIV infected cases attending Guru Gobind Singh Hospital, Jamnagar during 2002 (January – December) in the Department of Microbiology. All known HIV positive patients consenting to give two consecutive stool samples were included in the study. The HIV infected clients included in the study were divided into two groups on the basis of absence or presence of diarrhoea. The clients with diarrhoea were further sub-divided on the basis presence of acute or chronic diarrhoea (Table 1). All the patients enrolled in the study were interviewed using a standard questionnaire to collect the relevant clinical information. Eligibility criteria: All patients with a HIV sero-reactive test (result as per national guidelines) and consenting to participate in
the study by providing two consecutive faecal specimens were included in the study, till the sample-size was achieved. Two consecutive faecal specimens were collected from all the clients and subjected to examination for protozoal parasites by wet mount after concentration10. Direct smear and smears made from deposits of sedimentation were stained with Modified Acid Fast stain and examined for coccidian parasites10. Results The 100 HIV infected clients included in the study were between 20-50 years of age and belonged to HIV Clinical Stage 3 or 4. Of 100 patients, the protozoal parasites were detected in 25 patients. Of these 25 patients, 24 had diarrhoea, while one patient was asymptomatic. Isospora belli was identified in 10 % of HIV infected patient (Table 1). Isospora was detected in 17.24 % patients with diarrhoea (in 10% of cases with acute diarrhoea, and in 21% of cases with chronic diarrhoea). Cryptosporidium was detected in 13.79 % of patients with diarrhoea (in 10% of cases with acute diarrhoea, and in 15.8% of cases with chronic diarrhoea) and in 2.38 % cases without diarrhoea. Cyclospora, Microsporidia and Entamoeba histolytica were detected in 1 %, 2% and 3% of HIV infected patients respectively.
Table 1 Protozoal Parasites detected from HIV Patients Parasitic Spp. Total No. of Cases
Cases with Acute
Diarrhoea Cases with Chronic
Diarrhoea Cases Without
Diarrhoea (n=100) (n=20) (n=38) (n=42) Isospora belli 10 (10%) 2 (10%) 8 (21%) 0 Cryptosporidium parvum 9 (9%) 2 (10%) 6 (15.8%) 1 (2.4%) Microsporidium sp. 2 (2%) 0 2 (5.3%) 0 Cyclospora cayetenensis 1 (1%) 0 1 (2.6%) 0 Entamoeba histolytica 3 (3%) 1 (5%) 2 (5.3%) 0

SAARC Journal of Tuberculosis Lung Diseases & HIV/AIDS 3
Discussion The study demonstrated a very high prevalence (25%) of protozoal parasitic infection in HIV infected individuals. The prevalence of parasitic infection was higher in patients having diarrhoea as compared to patients without diarrhoea (41.37% vs. 2.38%,). Isospora belli was found to be predominant cause of morbidity in symptomatic clients (Table 1). These findings are analogous to those documented in similar studies conducted in different part of the world in HIV infected individuals 11, 13, 14.The prevalence of Isospora was 17.24 % in patients with diarrhoea which was slightly higher as compared to the similar study from South India11. Isospora belli infections are common in patients with AIDS and chronic diarrhoea from developing countries and found to be 12-19 % of patients of diarrhoea in the countries of Zambia, Haiti and Uganda.5 Cryptosporidium parvum appeared to be a second predominant parasite. Isolation of Cryptosporidium was relatively rare in our study (9.0%) compared to other studies (30.0%) in HIV patients13. Association of Cryptosporidium 13.79 % in diarrhoeal patients in our study correlates with the study done in Chennai.11 Detection rate of Cryptosporidium oocyst found to be 2.38 % in asymptomatic HIV patients. Other studies have reported Cryptosporidium as the predominant pathogen with significant association to diarrhoeal illness as well as its association with asymptomatic case.11
Occurrence of Cryptosporidium in both symptomatic and asymptomatic cases indicates high risk of infection of this parasite. Detection rate of Cyclospora in this study found to be 1.0% in HIV patients which correlates with the study in Chennai (0.6 %)11
and lower compared to other similar study (11.0%).13 Microsporidia was detected in 2 cases with chronic diarrhoea. It causes proliferate disease in immunocompromised and is usually associated with chronic diarrhoea.15
Entamoeba histolytica was detected in 3% of cases with diarrhoea. Test to prove pathogenecity of the detected 3 species of Entamoeba histolytica could not be done, but the presence of this parasite in the AIDS patient could not be neglected otherwise.4 Difference in the incidence of intestinal protozoal parasitic infection reported by different workers11,13,14 can be attributed to the difference in geographical distribution of parasites, sanitary practices and different selection of cases. Though mixed infection is seen in AIDS patient but in our study we did not observed any such finding. Though the reasons for the same were not ascertained, this could be attributed to the limited study sample. The present study to the best of our knowledge is the first report of the detection of opportunistic protozoal parasite in HIV patients in Saurashtra region. The rate of infection with a particular enteric parasite in HIV/ AIDS patient will depend upon the endemicity of that particular parasite in the region. Laboratory support is essential to determine the carrier, latent and clinical infection. Simple stool examination with modified acid fast staining technique on a concentrated stool samples may reveal the existence of parasitic infections. The technique is economical, rapid and good for differentiating infective agents of intestinal protozoal parasites.

SAARC Journal of Tuberculosis Lung Diseases & HIV/AIDS 4
Conclusion The study enhances awareness of the prevalent opportunistic protozoal parasite in the region of Saurashtra and limits extensive evaluation or nonspecific treatment of diarrhoeal illness in HIV patients. An early and accurate diagnosis of infection will not only help in institution of specific treatment and prophylaxis (Chemoprophylaxis where ever necessary) to prevent relapse/ reoccurrence of infections in HIV patients but also in institution of various preventive measures. This will not only prolong the life of HIV infected individuals but also improve the quality of life. References 1. Mukhopadya A, Ramakrishna B.S.,
Gagandeep Kang. Enteric pathogens in southern Indian HIV infected patients with and without diarrhoea. Indian J. Med. Res (1999) 109: 80 – 89.
2. Cegieslki J.P., Ortegay R., M C Kees. Cryptosporidium, Enterocytozoon and cyclospora infection to pediatric and adult patients with diarrhoea in Tanzania. Clin. Infect Dis (1994) 24: 214- 21.
3. Janoff E N, Smith PD, and Blaser M J. Acute antibody responses to Giardia lamblia are depressed in patient with AIDS. J. Infect. DIS (1988) 157: 789 – 804.
4. Hung C C, Chen P J, H Sieh S M, Wong J M, Fang C T, Chang S C and chen M. Invasive amoebiasis ; an emerging parasitic disease in patient with HIV in an area endemic for amoebic infection. AIDS (1999) 3: 2421 – 8
5. Fayer R, Ungar LP. Cryptosporidium spp and cryptosporidiosis; Microbial (Rev) (1986) 50:458 – 83
6. Whiteside M.E. Barkunjs, Hay. Enteric coccodiosis among patients with the acquired immuno deficiency syndrome. Am.J. Trop Med Hyg (1984) 33: 1065 -72
7. Ortega Y R, sterling C R Gilman R.H, (mava) Diaze. Cyclospora a species- a new protozoan pathogen of humans N. Eng J. Med 9(1933) 320: 1308 – 1312.
8. Wurtz RM, Kokcka FE, Peterss cs. Clinical characteristics of seven cases of diarrhoea associated with a novel acid fast organism in stool J.Infec Dis (1933) 16:136 - 8
9. Shilm DR/ Cohen MT/ Eaton M An algae like organism associated with an Outbreak of prolonged diarrhoea among foreigners in Nepal. A.M.J. Trop. Med. Hyg. (1999) 45: 383- 9.
10. Monica Cheesbrough; District laboratory practice in Tropical and Wilson. Ninth Edition. (1998) Vol. 5, 208
11. Kumar SS, S ananthan, P.Laxmi.Intestinal Parasitic infection in HIV Patients with diarrhoea in Chennai., Indian J med. Microbial (2002) 20 (2); 88 -91
12. Pappe J.W, Verdier R1, Boney M Cyclospora infection in adults infected with HIV, Clinical manifestation, Treatment & prophylaxis. Ann Inter.Med.
(1994)121:654 – 57 13. Nunez F A, Escoledo A A prevalence of
Intestinal parasites in human. AIDS patients Acto Tropica (1999) 72:125 – 30.
14. MolinaJ.M., sarcastic C. Intestinal Microsporidiosis in human immunodeficiency virus infected patient with chronic unexplained diarrhoea prevalence and biologic features. J. infects. Dis. (1993) 167: 217-21
SAARC Journal of Tuberculosis Lung Diseases & HIV/AIDS 1
Correspondence to: Sujay Nepali C/O: Dr. Prakash Ghimire Central Department of Microbiology, Tribhuvan University, Kirtipur, Kathmandu, Nepal. E-mail: [email protected] [email protected]
SELECTIVE INHIBITION OF MYCOBACTERIUM TUBERCULOSIS BY PARA-NITROBENZOIC ACID (PNB) USED IN LOWENSTEIN –
JENSEN MEDIUM Nepali S.1, Ghimire P.1, Khadka D. K.2, Acharya S.1 1 Central Department of Microbiology, Tribhuvan University, Kirtipur, Kathmandu, Nepal 2 SAARC Tuberculosis and HIV/AIDS Centre, Thimi, Bhaktapur, Nepal Abstract Background: Mycobacterial growth in media to which inhibitory substances are added has been used in species identification. Mycobacterium tuberculosis does not grow in Lowenstein-Jensen (LJ) medium containing para-nitrobenzoic acid (PNB); which can be a basis for its identification from other mycobacteria. Setting: National Tuberculosis Centre (NTC), Thimi, Bhaktapur, Nepal. Objectives: To evaluate usefulness of PNB containing LJ medium in identifying mycobacterial isolates. Methodology: This diagnostic evaluation study based at NTC was conducted from Sep 2006-Jun 2007. During the study period, a total of 857 sputum samples collected from patients attending NTC were analyzed using fluorescence microscopy. The smear positive samples were confirmed by Ziehl-Neelsen (ZN) staining. Smear positive samples were cultured on LJ media with and without PNB; followed by biochemical tests. Results: Out of total 857 sputum samples analyzed, 246 (28.7%) were positive for AFB on fluorescence staining and 214 (87%) of smear positive samples were also positive in culture. All the isolates which grow on LJ media without PNB did not grow on LJ media containing PNB. Conclusion: Mycobacterium tuberculosis can be identified and differentiated from non-tuberculous mycobacteria using PNB containing media, easily in labs where culture is being done. Keywords: PNB, AFB, LJ medium, Mycobacterium tuberculosis Introduction Globally, two billion people, equal to one-third of the world’s population, are infected with tubercle bacilli.1 In Nepal, about 45% of the total population is infected with tuberculosis
(TB), of which 60% are adult. Every year, 40,000 people develop active TB with 20,000 infectious pulmonary diseases and 5,000 to 7,000 deaths.2
Tuberculosis is a specific infectious disease primarily affecting the apex of the lungs causing pulmonary tuberculosis (PTB). TB of man and animal is caused by a group of very closely related species forming the Mycobacterium tuberculosis Complex (MTC), among which M. tuberculosis is predominant in human.3 PTB
SAARC J. TUBER. LUNG DIS. HIV/AIDS 2008 V (1).........
SAARC Journal of Tuberculosis Lung Diseases & HIV/AIDS 2
can be diagnosed by sputum examination (smear and culture), chest X-ray etc. The infections caused by non-tuberculous mycobacteria(NTM) are termed mycobacterioses which are becoming more prevalent with the increasing prevalence of immunocompromised hosts, particularly in relation to the AIDS pandemic.4 So, it is necessary to differentiate NTM from M. tuberculosis. Mycobacterial growth in media to which inhibitory substances are added has been used in species identification. Growth of M. tuberculosis is inhibited by PNB, whereas NTM are resistant and can grow in the culture media containing PNB.5
Hence this study was conducted with the objective to develop a test using PNB, and to evaluate its usefulness in the identification of M. tuberculosis. Methodology This is a diagnostic study based at NTC, Thimi, Bhaktapur, Nepal. The rationale of using NTC as study area was because it being the only National Tuberculosis Reference Laboratory in Nepal. This study was carried out from Sep 2006-Jun 2007. In this study, a total of 857 sputum samples were collected from patients visiting NTC. The patients were attended by the Medical Officer(s) and referred for microscopy if suspected for TB. The samples were collected with patients consent on first come first basis. Sputum samples were collected and evaluated as per the standards given by World Health Organization (WHO).6 One spot sputum specimen (when the patient first present to the health service) followed by next day early morning sputum specimen and spot specimen (of that day) were collected. About 3–5 ml, mucopurulent or blood stained sputum was collected. When the sputum specimen was
mostly saliva, then it was reported as “unsuitable” for microbiological investigation and requested another specimen. Sputum smears were stained with fluorescence staining technique and examined by fluorescence microscope.6 Since fluorescence microscopy uses low magnification objective to scan smears, allowing a much larger area of the smear to be seen and resulting in more rapid examination, it was used as primary staining procedure. All the positive slides were confirmed by Ziehl-Neelsen (ZN) staining. Only smear positive samples were cultured on LJ media. All the tubes were incubated at 37°C until growth was observed or discarded as negative after eight weeks. The colony characteristics of the isolates were recorded and they were biochemically tested. One loopful of 4 mg/ml suspension of bacterial growth was inoculated in 0.5 mg/ml PNB containing LJ medium. The positive control was set up by inoculating the suspension in PNB free LJ medium. All the slants were incubated at 37°C upto 4 weeks and observed for any growth on the medium. 7
Data analysis: Data were analyzed using SPSS version 11.5 systems. Results Of 857 specimens, 585 (68.3%) were from male and 272 (31.7%) were from female patients. Out of total 857 samples, 246 (28.7%) sputum samples showed AFB on fluorescence staining; of which 193 (78.5%) were from male and 53 (21.5%) were from female. Among 246 sputum smear positive samples, 214 (87.0%) samples were culture positive, 20 (8.1%) were culture negative and 12 (4.9%) were contaminated. In 214 culture positive samples, 168 (78.5%) were from male and 46 (21.5%) were from female. All the culture positive patients were registered in the laboratory register to report them to the Medical Officer(s) for treatment. The eugonic (rough, tough and buff) colonies were confirmed as M. tuberculosis by

SAARC Journal of Tuberculosis Lung Diseases & HIV/AIDS 3
biochemical tests. All the isolates in LJ media without PNB which were further cultured on LJ with PNB showed no growth. The pattern of culture result with respect to fluorescence
staining is given in table 1 and the result of culture positive samples on LJ medium containing PNB is given in table 2.
Table 1 Pattern of culture results with respect to fluorescence staining Fluorescence staining Total
1+ 2+ 3+
Cultu
re
Resu
lts 1+ 37 7 7 51
2+ 30 10 12 52 3+ 37 43 21 101 4+ 4 0 6 10
Total 108 60 46 214 Table 2 Result of culture positive samples on LJ medium containing PNB
Gender of the patients
Culture on LJ medium without PNB Culture on LJ medium with PNB Positive Negative Contaminated Positive Negative
Male 168 15 10 0 168 Female 46 5 2 0 46 Total 214 20 12 0 214
Discussion Out of 857 sputum samples, 246 (28.7%) samples were positive for AFB by fluorescence microscopy. As per the recommendation of WHO6, all the smear positive slides were confirmed by ZN staining. Of 246 sputum samples, 214 (87.0%) samples were positive for culture. Among 214 culture positive samples 168 (78.5%) were from male and 46 (21.5%) were from female. All the culture positive samples which gave growth on LJ media without PNB gave no growth on inoculation and incubation in LJ media containing PNB. As per the recommendation, few colonies observed in some tubes were regarded as negative.7 Lowenstein Jensen (LJ) medium containing PNB has been successfully used by many researchers. In a similar study done by Giampaglia et al 5 showed that PNB can be used successfully in the identification of mycobacteria isolates. Mahadev et al 8 had also used LJ media containing PNB for the identification of isolates as M. tuberculosis. PNB can also be used with other agar medium to identify M. tuberculosis 9 and can also be
incorporated in rapid techniques like in the rapid Mycobacterium Growth Indicator Tube (MGIT)/PNB method. WHO has also recommended the use of PNB along with other simple biochemical tests for the identification of M. tuberculosis.6 This study would be helpful in our setting to identify M. tuberculosis where culture is regularly done. Finally, this work has also shown that LJ medium containing PNB can be effectively used to identify M. tuberculosis-the method is easy, cheaper and reliable. Conclusion In conclusion, this study revealed that PNB added to culture media could be used for the identification of M. tuberculosis. All the isolates failed to grow when inoculated and incubated in LJ media containing PNB. So, a simple and low-cost test using growth inhibitor may be incorporated in the culture media enabling identification and differentiation of M. tuberculosis from non - tuberculous mycobacteria.

SAARC Journal of Tuberculosis Lung Diseases & HIV/AIDS 4
Acknowledgements The authors would like to thank all the staffs of National Tuberculosis Centre and SAARC Tuberculosis and HIV/AIDS Centre, Thimi, Bhaktapur, Nepal for their constant help during this study. References
1. Annual Report, National Tuberculosis Control Programme, 2005/2006. Thimi, Bhaktapur, Nepal: National Tuberculosis Centre, 2007
2. World Health Organization. Tuberculosis facts. WHO, Geneva 2007; WHO/HTM/STB/factsheet/2007.1
3. Grange JM. Tuberculosis In: Topley & Wilson’s Microbiology and Microbial Infections, Bacterial Infections Ninth edition. Edited by Collier L, Balows A and Sussman M. Arnold, a member of the Hodder Headline Group London, 1998:391-413
4. Hornick DB and Schlesinger LS. Mycobacterioses other than tuberculosis In: Topley & Wilson’s Microbiology and Microbial Infections, Bacterial Infections Ninth edition. Edited by Collier L, Balows A and Sussman M. Arnold, a member of the
Hodder Headline Group London, 1998:419-436
5. Giampaglia CM, Martins MC, Inumaru VT, Butuem IV and Telles MA. Evaluation of a rapid differentiation test for the Mycobacterium tuberculosis complex by selective inhibition with rho-nitrobenzoic acid and thiophene-2-carboxylic acid hydrazide. Int. J. Tuberc. Lung. Dis. 2005;9(2):206-209
6. World Health Organization. Laboratory services in tuberculosis control Part II and III. WHO, Geneva 1998; WHO/TB/98.258
7. Fujiki A. TB Bacteriology examination to Stop TB. The Research Institute of Tuberculosis, JICA, Japan, 2001
8. Mahadev B, Srikantaramu N, James P, Mathew PG and Bhagirathi R. Comparrision between rapid colorimetric mycobacterial isolation and susceptibility testing method and conventional method using LJ medium. Indian J. of Tuberc. 2001;48(3):129
9. Rastogi N, Goh KS and David HL. Selective inhibition of the Mycobacterium tuberculosis complex by p-nitro-alpha-acetylamino-beta-hydroxypropiophenone (NAP) and p-nitrobenzoic acid (PNB) used in 7H11 agar medium. Res Micrbiol. 1989;140(6):419-423

SAARC Journal of Tuberculosis Lung Diseases & HIV/AIDS 1
Correspondence to:
Dr Lochana Shrestha Epidemiologist SAARC TB and HIV/AIDS Center Thimi Bhaktapur E-mail: [email protected]
REVIEW OF MANAGEMENT OF ART SERVICE DELIVERY FOR PEOPLE LIVING WITH HIV/AIDS IN NEPAL
Shrestha L1, Subedi BK2, Subedi A3
1Epidemiologist, SAARC TB and HIV/AIDS Center, 2Director, FHD, Department of Health Services, MoH&P, 3Master Student Health Care Management, National Open College.
Abstract HIV/AIDS epidemic has been gradually spreading in Nepal. It is one of the major public health problems of the nation. Treatment, Care and Support are the critical and essential components of the response to HIV infection and AIDS related morbidity in Nepal. The cross sectional study was carried out at four public and three private Anti Retroviral Therapy (ART) sites during last 6 months of 2006 by selecting public ART sites based on the developmental regions of the country. From institutional set-up, human resources supply and availability of ART medicine’s perspectives, the management practices of ART in Nepal is satisfactory. However, services need to be improved to make it more effective and efficient and client friendly, considering the standardization and sustainability of services. Government has targeted to increase the number of certified service delivery points for provision of comprehensive treatment and care services in relation to HIV/AIDS. Hence, in order to achieve the targets with increasing the coverage there is a need to review the management process in established ART service delivery sites. Key Words: HIV/AIDS, Nepal, ART
Introduction Nepal is a country with immense cultural and geographical richness and diversity. And also home of some 23 million people. In Nepal HIV/AIDS was first diagnosed in 1988 in 4 patients1. Since then till now according to National Centre for AIDS and STD Control (NCASC) statistics, (16, November, 2007) there are 10369 people having HIV infection, out of this 1578 have developed AIDS and 449 people have died and estimated people with HIV are 70256 (2006). HIV/AIDS epidemic has been gradually spreading in each and every corner of the
country. It is one of the major public health problems of the nation. With consistently exceeding the prevalence of more than five percent in certain groups Injective Drug Users (IDUs) Migrants, the country has remained at a critical juncture of “Concentrated Epidemic” stage with looming threats of epidemic spreading to the general population.2
Treatment, Care and Support are more critical and essential components of the response to HIV infection and AIDS related morbidity in Nepal. This component will be more effective when the programme and activities are integrated into existing infrastructure both in public and private sectors. In Nepal access to Treatment, Care and Support services is still extremely low owing to the inadequate health delivery system, inaccessible private heath care and inadequate capacity for service delivery.
SAARC J. TUBER. LUNG DIS. HIV/AIDS 2008 V (1).........

SAARC Journal of Tuberculosis Lung Diseases & HIV/AIDS 2
Antiretroviral therapy has changed a fatal condition into a chronic and manageable disease and annual mortality rates of patients with AIDS are now well below 5 % among those treated.3 ART also helps to mainstream the preventive activities and increase the utilization of preventive services. In Nepal, from June 2003, Nava Kiran Plus being the leading organization, had started to provide ART to PLWHAs but Tribhuvan University, Teaching Hospital (TUTH), Kathmandu had been providing ART services to PLWHAs informally since 1998. Government developed guideline on ART and started providing ART services from 2004. Till end of 2006 there are seven ART sites at government hospitals and three community ART sites in private sector. By end of 2006 there are 560 HIV infected patients under ART treatment at public sector.4
In recent years, in Nepal on one side HIV positives who need ART treatment are increasing and on the other hand Government is putting efforts to increase the sites to provide ART in easily accessible manner. Government has targeted to increase the number of certified service delivery points for provision of comprehensive treatment and care services with achievement of 80% of eligible PLWHA to be receiving ART by 2010.2
Hence in order to proceed to achieve the targets with increasing the coverage there is a need to review the management process in established ART service delivery sites. This will provide the background for upgrading the established sites and also for new establishment of service point to the level that would be effective for target people. This fact has led to under take this study to review the management
process at different ART service delivery sites in Nepal.
Materials and Methods This cross sectional study was carried out at 4 public ART sites - B.P. Koirala Institute of Health Sciences (BPKIHS) Dharan, in Eastern Region; Tribhuvan University, Teaching Hospital in Central Region; Western Regional Hospital in Western Region and Bheri Zonal Hospital, in Mid-western Development Region of Nepal and three private ART sites - Nava Kiran Plus (NK Plus), Maiti Nepal and SPARSHA Nepal during last 6 months of 2006. Nepal has 5 development regions and public ART sites are selected based on the region of the country. During the study period, ART sites at Far-western Region was at preparatory phase, so not selected for study. Among the private sites all the 3 sites which were documented were selected. A semi-structured pre-tested questionnaire was used to collect the information in relation to coordination procedure, human resources and infrastructure of the sites, supply and availability of Anti Retroviral Drugs.
Results In total 4 public ART sites, there were 346 HIV positive under treatment, among which highest (46.5%) were at WRH and lowest (10.6%) at Bheri Zonal Hospital. These four sites covered 61.1% of total HIV positives under treatment. Three private ART sites provided treatment for 194 HIV positives which constitute 34.6% of total HIV positives
Table 1 Number of PLWHA under Government ART sites
SN
Name of Institutions
No. of PLWHA receiving
ART
%
PLWHA Per- Day visit to Institution
%
1 BPKIHS, Dharan 48 13.87 8 27.58 2 TUTH, Maharajgunj 100 28.90 6 20.68 3 Western Regional
Hospital, Pokhara 161 46.53 10 34.50
4 Bheri Zonal Hospital, Nepalgunj
37 10.69 5 17.24
Total 346 100.00 29 100.00

SAARC Journal of Tuberculosis Lung Diseases & HIV/AIDS 3
under treatment. Nava Kiran (NK) Plus provided treatment to maximum number of HIV positives compared to other private sites under study. (Table 1 & 2) Table 2 Number of PLWHA under Private ART Sites
S N
Name of
Institutions
No. of PLWHA receiving ART
%
PLWHA Per-Day visit to Institution
%
1
Nava Kiran Plus
150
77.31
12
50.00
2
Maiti Nepal
22
11.34
5
20.83
3
SPARSHA Nepal
22
11.34
7
29.16
Total
194
100.00
24
100.00
There is found to be good coordination between private and public service sites with National AIDS control programme of country. For the utilization of the service and awareness regarding availability of service, private sites are under taking personal contacts with community where as public sites depend on National programmes awareness activities. In relation to institutional set up, all public and private sites have doctors, consultation rooms and voluntary counseling rooms. Separate medical record room is present at all public service delivery sites, while at private sites only one institution has separate medical record room. All private sites have separate general and isolated beds for ART but pubic sites do not have separate beds for ART. All public sites have laboratory facility where-as among private sites only one has simple lab facility. Two public sites (BPKIHS, WRH) have CD4 count facility. Central public sties (TUTH) utilized central level CD4 count facility at National Public Health Laboratory.(Table 3)
Table 3 The general and isolated beds in Government ART sites
Name of Institution
General Beds
Isolated Beds for
ART
Lab. Services
Lab. with CD4
facility
Radiol-ogy
Services
BPKIHS Yes No Yes Yes Yes TUTH Yes No Yes No Yes WRH Yes No Yes Yes Yes Bheri Z. H.
Yes No Yes No Yes
Nava Kiran Plus
Yes Yes No No No
Maiti Nepal
Yes Yes Yes No No
SPARSHA Nepal
Yes Yes No No No
In relation to human resources, around 3-4 doctors allocated for ART at each public site are post graduate level and have clinical management training on ART, while practically only one or two of them are actively providing ART service. At these sites, 5-10 nursing staffs have clinical management training on ART, but it is found that only one or two of them are providing services effectively and others are active in other departments. At private sites almost all nursing staffs have clinical management training on ART and they are providing services actively. At private sites, one or two doctors who worked there have MBBS or post graduate level degree and have clinical management training on ART except at one site (Maiti Nepal). For all public sites sources of getting ARV drugs is government mechanism through NCASC and all keep the drugs stocks for two months and also maintain recording and reporting. Maiti Nepal depend on private donors for ARV drugs, while NK Plus depend on both private donor and NCASC for ARV drugs, SPARSHA Nepal get ARV drugs from NCASC only. Nava Kiran Plus mentioned that they will be able to provide ART medicines for 2 more years and Maiti Nepal can supply up to year 2010 A.D. Nava Kian

SAARC Journal of Tuberculosis Lung Diseases & HIV/AIDS 4
Plus and SPARSHA are reporting monthly, while Maiti Nepal reports annually about the medicine. Both at public and private sites the process of getting ARV drugs is demand base. Regular supply of ARV drugs based on procurement mechanism adopted by Government for public sites and private donors for private sites. Regarding ART committee, all public and private ART sites have separate ART committee to manage the ART services.
Discussion and Conclusion All public and private ART sites have efficient institutional set-up. In case of the laboratory services, we found that only two public ART sites have CD4 count facility. There is essential to increase CD4 count facility. Human resources are the people through which effective ART services are delivered. Staff are quite qualified and have clinical management training on ART, in all the public ART sites, and in some private ART none of doctors have clinical management training on ART. It is essential to make sure that service providers have clinical management training on ART. Supply and availability of ARV drugs is very important aspect of ART service management. In all institutions supply and availability of medicine is good. However to
maintain quality of drugs it would be better to make supply chain from one source for both private and public sites. This source should manage different fund generation for procurement and supply of ARV drugs for both private and public sites. From institutional set-up, human resources supply and availability of ART medicine’s perspectives, the management practices of ART in Nepal is satisfactory. However services need to be improved to make it more effective and efficient and client friendly. In addition standardization and sustainability of services need to be seriously considered, including expansion of ARV services. References 1. Management of HIV/AIDS, Naveen Pess,
Kathmandu, 1995, PP 1 – 10 2. National HIV/AIDS Strategy (2006-2011),
Nepal, National Center for AIDS and STD Control, Ministry of Health and Population, October 2007
3. CASCADE Collaboration. Survival after introduction of HAART in people with known duration of HIV-1 infection. Lancet 355, 1158-59(2000)
4. NCASC monthly reports on Cumulative HIV and AIDS Situation, December 2006.
SAARC Journal of Tuberculosis Lung Diseases & HIV/AIDS
1
Review Article
LUNG CANCER AND SMOKING IN ASIA Jha R1, Weerakoon A. P.2, Karki K. B.3, Shrestha S.4, Gamage P. W. K.5 1MD (Resident), Int. Medicine, Wuhan University, PR China 2Research Officer, SAARC TB and HIV/AIDS, Centre,Thimi, Bhaktapur, Nepal 3Training Officer, SAARC TB and HIV/AIDS Centre, Thimi, Bhaktapur, Nepal 4Medical Officer, Bir Hospital, Kathmandu, Nepal 5Resident, Teaching Hospital, Institute of Medicine, Tribhuban University, Kathmandu, Nepal
Abstract The incidence of lung cancer is rising dramatically in Asia. Cancer is currently placed 6th to 9th in the common causes of mortality in the SAARC region. The most common cancers in Asia are the cancers of head, neck and thorax, which can be directly attributed to the smoking and tobacco chewing habits in the region especially SAARC region. The pattern of cigarette smoking changed globally during last three decade. It is slowly decreasing in developed countries, at a rate of 1% annually and rising in developing countries, at a rate of 2%. Recent studies have shown in addition to the direct tobacco smoking, environmental tobacco smoke has a proven lung carcinogenic effect. As the single most important cause for lung cancer is tobacco smoke, every effort should be taken to control this menace. Key Words: Lung cancer, Asia, Tobacco Smoking Epidemiology
Lung cancer is the most frequent malignant disease and most common cause of cancer death in the world with 1.18 million deaths.1 Almost half (49.9%) of the cases occur in the developing countries, a big change since 1980, when it was estimated that 69% were in developed countries.2 Worldwide, it is the most common cancer in men, with the highest rates observed in North America and Europe (especially Eastern Europe). In women, incidence rates are lower with a global rate of 12.1 per 100,000 compared to 35.5 per 100,000 in men.2 Mortality from lung cancer remains very high in the world. The average survival at five years in the United States is 15%, in Europe is 10% and in developing countries is 8.9%.2 The situation is similar in SAARC countries. In India one year survival has been reported as 9.8 percent.3
Burden of Lung Cancer in Asia In 2000, there were 1.2 million deaths from cancer of trachea, bronchus and lung globally.
The rate in males was 28.8/100000, and in females 10.8/100000, with considerable regional variation. In Asia, age standardised mortality rates from lung cancer was the highest in China and the lowest in the South Pacific Islands with rates of 29.1 and 13.8/100000 in males and 14.5 and 7.7/100000 in females respectively.4
Trends in lung cancer mortality and incidence in Asia
In many developed countries, lung cancer mortality has declined since 1980s.5 In developing countries, lung cancer is primarily a problem of males whereas the rates in females are low in all populations, except for those of Chinese origin. Chinese women have relatively high incidence of lung cancers compared with other ethnic groups in the region. 6 A recent report from China shows a gradual increase in lung cancer rates in the past decade, mostly in men.7
In South Korea, the age adjusted mortality rate from lung cancer increased from 3.7 in 1980 to 17.8/100000 in 1994 in males and from 1.4 to 7/100000 in females.8
SAARC J. TUBER. LUNG DIS. HIV/AIDS 2008 V (1).........

SAARC Journal of Tuberculosis Lung Diseases & HIV/AIDS
2
In India lung cancer is the leading cancer of both sexes in three of the Urban Cancer Registries (Bhopal, Delhi and Mumbai).9
A study done in Kashmir, India, using 321 lung cancer patients revealed that there was a preponderance of males (91.9%) as compared to females (8.1%) with male to female ratio of
11.3:1.10 In India other studies show that male to female ratio varies from 5.76:1 to 6.7:1.11
Cancer pattern among males in South Asian Region
The Age Standardized Rate (ASR) per 100,000 of top ten cancers among males in different countries in South Asia is given in Table 1
Table 1 Top Ten Cancer in South Asian Countries, Males, Year 2000
India Pakistan Bangladesh Sri Lanka Site ASR Site ASR Site ASR Site ASR Oral cavity 12.8 Lung 20.1 Lung 22.4 Oral cavity 36.1 Other Pharynx 9.6 Oral cavity 14.7 Larynx 15.4 Oesophagus 8.2 Lung 9.0 Bladder 8.8 Oral cavity 13.4 Other Pharynx 6.1 Oesophagus 7.6 Larynx 8.5 Other Pharynx 12.5 Leukaemia 5.5 Larynx 6.2 Other Pharynx 6.7 Oesophagus 6.9 Larynx 4.5 Stomach 5.7 Oesophagus 6.3 NHL 2.8 Lung 1.9 Colon/Rectum 4.7 Liver 5.6 Stomach 1.6 Bladder 1.9 Prostate 4.6 NHL 5.1 Liver 1.3 Colon/Rectum 1.8 Leukaemia 3.1 Colon/Rectum 5.0 Testis 0.9 Thyroid 1.3 NHL 3.2 Leukaemia 3.4 Leukaemia 0.9 Stomach 1.2 Source: Cancer Awareness, Prevention and Control; Strategies for South Asia-A UCII Hand book. According to table 1, lung cancer is the commonest in Bangladesh and Pakistan with not much of a difference in the incidence rates between themselves but double the times higher than India and ten times more than Sri Lanka. Smoking and lung cancer in Asia Tobacco use, especially cigarette smoking , accounts for up to 90% of all lung cancer deaths worldwide.12, 13 Fewer than 20% of cigarette smokers, however, develop lung cancer, suggesting that other factors play a role in the disease.14 Other causes of lung cancer include environmental factors such as tobacco smoke, radon and various occupational exposures. Diet and pre-existent non malignant lung disease also have been associated with the risk for developing lung cancer.15
Before the 20th century, tobacco usually was chewed or inhaled in the form of snuff. Therefore lung cancer was rare before the 20th century. Majority of lung cancer cases have been convincingly proved to be associated with smoking habits. The first epidemiological study on the relationship between tobacco and lung cancer was published in 1939 by several German physicians.16 After that several prospective studies worldwide have shown significantly higher cancer mortality rates among smokers than non smokers, table 2.
Table 2 Relative Risk for death from lung cancer for Men: Major Prospective studies in the World Study Smoking Status Relative Risk Cancer Prevention Study II (1982 – 1988)
Never smoked Former smokers Current smokers
1.0 9.4 20.3
Kaiser Permanent Medical Care Programme Study (1979 – 1987)
Never smoked Current smokers
1.0 8.1
Japanese study of 29 health districts (1966 – 1982)
Non smokers Current smokers
1.0 3.8
Swedish study (1963 – 1979)
Non smokers Current smokers
1.0 7.0
British doctor’s study (1951 -1973)
Non smokers Current smokers
1.0 14.0

SAARC Journal of Tuberculosis Lung Diseases & HIV/AIDS
3
Source: US Department of Health and Human Services. A Report of the Surgeon General,. Centre for Disease Control and Prevention, Office on Smoking and Health, 2001. Table 2 shows in current male smokers, relative risk for death from lung cancer compared with non smokers varies from about 3.8 times to more than 20 times.17 Tobacco smoke is a complex mixture of over 4000 different chemicals, of which over 40 compounds have been evaluated by the International Agency for Research on Cancer (IARC) in animals as carcinogens. Polycyclic aromatic hydrocarbon in tobacco smoke have been shown carcinogenic to animals.18 The pattern of cigarette smoking changed globally during last three decade. It is slowly decreasing in developed countries, at a rate of
1% annually and rising in developing countries , at a rate of 2%.19 With this trend, tobacco companies are directing aggressive marketing campaigns in developing countries in both Asia and Africa, targeting not only men but also women and young people.20 Figure 1 shows prevalence of smoking in adults and adolescents by sex in selected Asian and in the US and UK in the 1990s. In adults the prevalence of smoking in many Asian countries now exceeds those of the US and UK.21
Source: Centre for Disease Control and Prevention. National Tobacco Information Online System (NATIONS), Atlanta, GA, CDC
Epidemiology of Smoking in Asia
Annual per capita cigarette consumption and prevalence of smoking in adult male and
female in SAARC countries -2001 are listed in the Table 3.
Table 3 Annual per capita cigarette consumption and prevalence of smoking in adult male and females in SAARC countries -2001 Country Prevalence of adult smoking Cigarette consumption(Annual per person)
Total (%) Male (%) Female (%) Afghanistan No Data No Data No Data 98 Bangladesh 38.7%
53.6% 23.8% 245 India No Data 2.50%
29.4% 2.5% 129 Maldives 26% 37% 15% 1441 Nepal 38.5% 48% 29% 619 Pakistan 22.5% 36% 9% 564 Sri Lanka 13.7% 25.7% 1.7% 374 Source: Machael J, Eriksen M. (2001) The Tobacco Atlas, World Health Organization

SAARC Journal of Tuberculosis Lung Diseases & HIV/AIDS
4
According to the table 3, the highest per capita cigarette consumption in the region is seen in Maldives, Nepal and Pakistan. The smoking habits of Indians are different from that observed in the Western society. In India tobacco is used in various forms such as the cigarette, bidi, hooka, chutta,.chillum and pan masala.22 Bidi smoking, which is extremely common in rural India, carries a higher risk of lung cancer compared to cigarette smoking.23 (In India seven bidis are sold for every one cigarette). In China, the estimated consumption of cigarettes per adult increased by 260% between 1970 and 1990. The rates of smoking are very high in both urban and rural areas in men, with rates of 60% and 64% and 15% and 9% in women respectively.24
Smoking cessation has been associated with a declining risk for lung cancer. The relative risk for lung cancer among former smokers begins to drop 5 years after they quit smoking and continues to drop thereafter; however, the relative risk in former smokers never reaches the risk of life –long non smokers.25
Passive smoking (Environmental Tobacco Smoke (ETS) ETS consists of side stream smoke and the exhaled smoke of the smoker. Some known carcinogens such as benzo(a)pyrene, nitrosamine and 210 PO are present in higher concentration in side stream smoke.26 ETS is now classified as a class A carcinogen, responsible for 20% of lung cancers in non-smokers.27
The association between passive smoking and lung cancer risk is biologically plausible because of the similar chemical composition of smoke inhaled directly from a cigarette and smoke from a burning cigarette and the demonstration of absorption of a tobacco
specific carcinogen in the urine of non-smokers exposed to cigarette smoke.28
Hirayama29 from Japan in 1981 reported that age – adjusted lung cancer mortality rates were lowest for wives of non-smokers, intermediate for wives of light or ex-smokers and highest for wives of heavy smokers. A meta analysis of 35 case- control and 5 cohort studies showed that the relative risk among lung cancer among non-smoking women ever exposed to ETS by their husbands was 1.2 (1.05-1.28)30 Rapiti et al from Chandigarh India recently reported high risk of lung cancer among those who exposed to ETS in childhood.31 Because of the low prevalence of smoking in Asian women , any misclassification bias should be small, and the Asian evidence for causal relationship between passive smoking and lung cancer is particularly strong.32
As in active cigarette smoking, the risk for lung cancer from exposure to ETS also may be influenced by genetic factors. Using archival tumour tissue from 106 women with lung cancer who were lifelong non smokers, Bennett et al revealed that those patients with significant exposure to ETS were statistically more likely to be deficient in glutathione S-transferase MI (GSTMI), an enzyme believed to be important in the detoxification of tobacco smoke carcinogen, when compared with patient without such exposure (OR-2).33
Histological types of lung cancer Based on the biology, therapy and prognosis, lung cancer is broadly divided in to two categories. 1. Non small cell lung cancer (NSCLC) 2. Small cell lung cancer (SCLC)
Squamous cell carcinoma, adeno carcinoma and large cell carcinoma are classified as NSCLC and account for 75% to 80% of all lung cancer cases.34

SAARC Journal of Tuberculosis Lung Diseases & HIV/AIDS
5
Before 1980, the predominant cell type in lung cancer worldwide was Squamous cell carcinoma. Since then there has been gradual increase incidence of adeno carcinoma, with a corresponding decline in squamous cell cancers in many developed countries .The same changing pattern is observed in some Asian countries. In Taiwan, a study of over 10000 lung cancer cases over the period1970-1993 showed that the incidence of squamous cell carcinoma decreased from 46.4% to 36.2% in men, whereas adenocarcinoma increased from 30% to 36% in men.35 A similar pattern was found in Singapore, Japan, Korea and Hong Kong.36-39 However, clinical profile and histological type of lung cancer in India is different from the developed countries, in that Indian patients present almost 15-20 years earlier, in the 5th and 6th decade of life40 and squamous cell carcinoma continues be the commonest histological type.41
References 1. Parkin DM, Bray FI, Devesa SS. Cancer
burden in the year 2000:The global picture. Eur J Cancer 2001; 37 (Suppl.8): S4-66.
2. Parkin DM, Bray FI,Ferlay J, Pisani P. Global cancer statistics,2002. CA Cancer J Clin 2005;55:74-108.
3. Behera D. Managing Lung Cancer in Developing Countries: Difficulties and Solution –Editorial: Indian J Chest Dis Allied Sci 2006;48: 243-244
4. Lam WK,White NW, Chan-Yeung MM. Lung cancer epidemiology and risk factors in Asia and Africa, International Journal of Tuberculosis and Lung Disease 8(9):1045-1057).
5. International Agency for Research on Cancer. Lung cancer Mortality Database,Mortality data by Counties, extracted from World Health Organization Data Bank.Lyons, France.
6. Parkins DM.Cancer in developing countries. Trends in Cancer Incidence and Mortality. Cancer Surveys.1994;19/20:519-561.
7. Yang L, Parkin DM, Li L, Chen Y. Time trends in cancer mortality in China 1987-1999.International J Cancer 2003;106:771-783
8. Jee SH,Kim IS, Suh I,Shi D, Appel LJ. Projected mortality from lung cancer in South Korea, 1980-2004. Int J Epidemiol 1998; 27:365-369.
9. Nanda Kumar A. Consolidated report of the population based cancer registries, incidence and distribution of cancer, 1990-1996. National Cancer Registry Programme. New Delhi:Indian Council of Medical Research.2001.
10. Khan NA, Afroz F, LoneMM, Teli MA, Muzaffer M , Jan N. Profile of lung cancer in Kashmir India: A five year study. The Indian Journal of Chest Disease and Allied Sciences.48,187-190.
11. Behera D, Balamugesh T. Lung cancer in India. Indian J Chest Dis Allied Science 2004;46:269-81
12. hopland D.R: Tobacco use and its contribution to early cancer mortality with a special emphasis on cigarette smoking. Environ Health Perspect103:131-142,1995
13. Wingo P.A,Ries L.A.G, GiovinoGA, et al: Annual report to the nation on the status of the cancer, 1973-1996, with special section on lung cancer and tobacco smoking. J Natl Cancer Inst 91:675-690,1999
14. Wright GS, Gruidl ME: Early detection and prevention of lung cancer. Curr Opin Oncol 12: 143-148, 2000.
15. Richard A, Matthay MD: Clinics in Chest Medicine – Lung Cancer 23: 1 March 2002.
16. Smith D, Strobele S A,Egger M. Smoking and health promotion in Nazi Germany. J Epidemiol Comm Health 1994;48:220-223
17. US Department of Health and Human Services. A report of the Surgeon General.Reducing Health Consequences of Smoking: Twenty – five years’ progress report. Department of Health and Human Services 89 -8411,1989.
18. Stanton MF,Miller E,Wrench C,Blackwell R. Experimental induction of epidermoid carcinoma in the lung of rats by cigarette smoke condensate. J National Cancer Institute1972;49:867-877.
19. Lam WK,White NW, Chan-Yeung MM. Lung cancer epidemiology and risk factors in Asia and Africa, International Journal of Tuberculosis and Lung Disease 8(9):1045-1057).
20. MacKay J, Crofton J. Tobacco and the developing world. Brit Med Bulletin 1996;52:206-221.

SAARC Journal of Tuberculosis Lung Diseases & HIV/AIDS
6
21. Centre for Disease Control and Prevention. National Tobacco Information online system (NATIONS).Atlanta, GA:CDC.
22. Pathak AK, Bhutani M, Mohan A, Guleria R, Bal S, Kochupillai V.(2004) Non Small Cell Lung Cancer Current Status and Future Prospects: The Indian Journal of Chest Diseases and Allied Science :46; 192-203
23. Prasad R, Singh D, Mukerji PK, Pant MC, Srivastava AN, Kumar S. Bidi smoking and lung cancer: A case control study. Proceedings of the International Conference on Environmental and Occupational Respiratory Disease at Lucknow, 29th October to 2nd November 9Abstract).
24. Wong XZ. Comments on ‘smoking cessation in China and primary health care’ Br Med j(Chinese edition) 2000;3:101.
25. Halpern MT, Gillespie BW, Warner KE: Pattern of absolute risk of lung cancer mortality in former smorkers (Comments).J Nat Cancer Inst 85:457-464,1993.
26. Lam WK,Du TX. Environmental inhaled agent and their relation to lung cancer. In :Loke J, ed. Patho physiology and treatment of inhalation injuries. Lung Biology in Human and Disease. Vol 34 , Chapter 10. New York, NY:Marcel Dekker,1988: pp423-451.
27. National Research Council. Environment tobacco smoke: measuring exposure and assessing health effect. Washington, DC: National Academy Press,1986:pp 209-211
28. Hecht JM, Caramella SG, Murphy SE, et al : tobacco specific lung carcinogen in the urine of men exposed to cigarette smoke. N Eng J Med 329:1543-1546,1993.
29. Hirayama T. Non-smoking wives of heavy smokers have a higher risk of lung cancer: a study from Japan .Br Med J 1981;282:183-185
30. Zhong L,Goldberg MS, Parent ME,Hanley JA. Exposure to environmental tobacco smoke and the risk of lung cancer: a meta analysis. Lung Cancer2000; 27: 3-18.
31. Rapiti E , Jindal SK,Gupta D, Boffeta P. Passive smoking and lung cancer in Chandigarh, India . Lung Cancer 1999;23:183-189.
32. Lam TH, Hedley AJ. Environment tobacco smoke in Asia: slow progress against great barriers.JAMA SEA 1999;15:7-9.
33. Bennett WP et al. Environmental tobacco smoke, genetic sucessptibility, and risk of lung cancer in never smoking women. J National Cancer Institute 91:2009-2014,1999.
34. Pathak AK, Bhutani M, Mohan A, Guleria R, Bal S, Kochupillai V.(2004) Non Small Cell Lung Cancer Current Status and Future Prospects: The Indian Journal of Chest Diseases and Allied Science :46; 192-203
35. Perng DW,Perng RP, Kuo BI, Chiang SC. The variation of cell type distribution of lung cancer: a study of 10,910 cases at a medical centre in Taiwan between 1970 and 1993. Japa J Clin Oncol 1996;26:229-233
36. Seow A, Duffy SW,Ng TP,McGee MA,Lee HP. Lung cancer among Chinese female in Singapore 1968-1992: time trends, dialect group differences and implications for aetiology. In J Epidemiol 1998;27:167-172.
37. Choi J H, Chung H C, Yoo N C, et al. Changing trends in hidtologic types of lung cancer during the last decade ( 1981) -1990) in Korea: a hospital-based study. Lung Cancer 1994; 10: 287-296.
38. Lam K Y, Fu K H, Wong M P, Wang E. P. Significant changes in the distribution of histologic types of lung cancer in Hong Kong. Pathology 1993; 25: 103-105.
39. Morita T. Statistical study of lung cancer cases in the Annual of pathological autopsy cases in Japan (1958-1997). Lung Cancer 2000; 29 9 Suppl 1): 232.
40. Jindal SK,Behera D. Clinical spectrum of primary lung cancer. Review of Chandigarh experience of 10 years. Lung India 1990;8:94-98.
41. Thippanna , Venu K,Gopalakrishnaiah V,Reddy PN, Charan BG. A profile of lung cancer patients in Hyderabad. J Indian Med Assoc 1999;97:357-59.

SAARC Journal of Tuberculosis Lung Diseases & HIV/AIDS 1
Correspondence to: Dr. Sunil Shrestha, Assistant Professor Department of Surgery, Nepal Medical College Teaching Hospital Email: [email protected]
Case Series ABDOMINAL TUBERCULOSIS IN NEPAL MEDICAL COLLEGE
TEACHING HOSPITAL, KATHMANDU
Shrestha S.1, Pradhan G. B.2, Bhoomi K.3, Shrestha B. L.4, Bhattachan C. L.4 1Assistant Prof., 2Lecturer, 3Assistant Prof, Department of Medicine, 4Pro., Head of Department, Department of Surgery, Nepal Medical College Teaching Hospital, Attarkhel, Jorpati, Kathmandu Abstract
Abdominal Tuberculosis is a common extra pulmonary manifestation of tuberculosis. The wide spectrum of presentation makes abdominal tuberculosis difficult to diagnose and treat. Retrospective review of cases with abdominal tuberculosis presenting to the Surgery Department of Nepal Medical College Teaching Hospital from January 2002- June 2007 was done to describe our experience of abdominal tuberculosis over a 5 year period.
We found total 32 patients with abdominal tuberculosis, among which 13 had concurrent pulmonary tuberculosis. The most common clinical presentation, i. e. a triad of abdominal pain, fever and weight loss was present in 13 who had symptoms of pulmonary tuberculosis presented to physicians and the remaining 19 presented acutely to surgeons with symptoms of pain and obstruction. Chest X ray, abdominal ultrasound and barium meal follow through done to find associated abnormalities. Diagnostic Laparoscopy was performed in 10 and 3 patients with peritonitis underwent emergency laparotomy which revealed multiple ileal perforations in 2 cases and one had multiple strictures with small bowel perforation. Diagnosis of tuberculosis, attended at surgeons was confirmed by demonstrating caseating granulomas in histology and Acid Fast Bacilli Positive, culture for M. tuberculosis from peritoneal fluid. All patients were started anti tuberculosis treatment.
Abdominal tuberculosis is a relatively common finding and should always be considered in the differential diagnosis of abdominal pain, fever and weight loss. Key Words: Tuberculosis; abdominal tuberculosis; Acid Fast Bacilli; ileocaecal disease Introduction Between 1980-2005, 90 million TB patients were registered in national surveillance systems and reported to WHO globally. The global TB incidence rate peaked sometime between 2000-2005, although the total number
of new cases is still raising each year.1 One-half of the world population is infected with M. tuberculosis, and it is the leading cause of infectious death, with approximately 1.6 million deaths annually.2 Abdominal tuberculosis is one of the most prevalent forms of extra-pulmonary tuberculosis disease. The Gastro Intestine (GI) tract, peritoneum, lymphatic system, and solid viscera are subject to differing degrees of tuberculosis involvement, which can occur
SAARC J. TUBER. LUNG DIS. HIV/AIDS 2008 V (1).........

SAARC Journal of Tuberculosis Lung Diseases & HIV/AIDS 2
alone or in combination. Tuberculosis has a wide spectrum of illness and can affect any system in the body. Tuberculosis of GI tract accounts for 50% of all gastro intestinal cases. The commonest site is distal ileum and caecum.3 Abdominal tuberculosis is an important but probably underestimated clinical problem.
The diagnosis of abdominal tuberculosis is often delayed, increasing the morbidity associated with this treatable condition. In this case series, the clinical presentations and outcomes of 32 patients with abdominal tuberculosis were reviewed retrospectively. Our aim was to elucidate the presenting signs and symptoms of abdominal tuberculosis to make the diagnosis and treatment in early.
Methodology
This is hospital record based case series study, which is carried out retrospectively, for 5 year period from January 2002 to June 2007 in Nepal Medical College Teaching Hospital, Jorpati which is one of the tertiary care hospitals of Katmandu, Nepal. During study period 32 cases of abdominal tuberculosis were notified.
Diagnoses of abdominal tuberculosis were based on one of these criteria: 1) characteristic caseating granulomas in histologic specimens; 2) GI symptoms combined with abdominal ultrasound showing abnormalities of the peritoneum and bowel that improved with anti-tuberculous treatment; and 3) Patients with symptoms of clinical triad of abdominal pain, fever, and weight loss associated with past history of pulmonary tuberculosis. Results
Thirty-two cases of abdominal tuberculosis were identified in the period January 2002 to June 2007. Median age of the patients was 38
years (range, 14–81 years), 22 (68.7%) were females and 10 (31.3%) were males.
Thirteen patients (40.6%) who had symptoms of pulmonary tuberculosis with associated abdominal tuberculosis were presented to physicians and the remaining nineteen patients presented acutely to surgeons with symptoms of pain and obstruction. The most common clinical presentation was a triad of abdominal pain (85.0%), fever (78.6%) and weight loss (66.5%).The abdominal pain was of varying quality, most frequently cramping in nature. In most cases fever was low grade and was associated with general weakness and malaise. Nausea, vomiting and diarrhea were also present in more than half of the patients. (Table1) Duration of symptoms ranged from 15 days to almost 18 months (mean 3.5 months). Of the 32 patients tested by Mantoux test, 17 (53.1%) were positive.
Table 1 Clinical Presentation in 32 Cases of Abdominal Tuberculosis
Clinical feature Numbers (%) Abdominal pain 27 (85.0%) Fever 24 (78.6%) Weight Loss 21 (66.5%) Cough 13 (40.6%) Diarrhea 15 (46.0%) Ascites 11 (34.3%)
Laboratory investigations revealed low hemoglobin level in 60% cases and more than 90% had elevated C-reactive protein and Erythrocyte Sedimentation Rate.
Chest X-ray was abnormal with calcified granulomas in 13 (40.6%) cases, who had completed the course of anti tuberculosis treatment due to previous history of pulmonary tuberculosis and in 3 (9.3%) cases there were free gas under the diaphragm suggestive of hollow viscus perforative peritonitis that was confirmed clinically. Abdominal ultrasound was done in all patients and it showed free fluid in

SAARC Journal of Tuberculosis Lung Diseases & HIV/AIDS 3
the peritoneal cavity in 11(34.3%) cases, thickened small bowel wall in 8(25.0%) cases and mesenteric lymphadenopathy in 6(18.7%) cases. Twenty two patients underwent barium meal follow through of whom 15(71.4%) had small bowel strictures and the rest were normal.(Table 2)
Table 2 Radiological Findings in 32 Cases of Abdominal Tuberculosis Imaging Number of Modality cases (%) Findings Chest 13 (40.6%) Calcified granulomas X-ray 3 (9.3%) Free gas under diaphragm Ultrasound abdomen 11 (34.3%) Free Fluid in peritoneal cavity
Barium meal follow 15 (71.4%) Small bowel Stricture through
Diagnostic Laparoscopy was performed in Ten (31.2%) cases out of which Six (60.0%) had mesenteric lymphadenitis and in 4 patients there was serosal infiltration of tubercles in the entire small bowel which confirmed granulomatous lesions in histology. In all eleven patients with ascites, fluid analysis revealed elevated white blood cell counts. The ascitic fluid protein was >5 gm/dl in all patients. Acid-Fast Bacilli were not seen in any of the ascitic fluid smears but the culture was positive in 6 (54.5%) cases. Three patients with peritonitis underwent emergency laparotomy which revealed multiple ileal perforations in 2 cases and one patient had multiple strictures with small bowel perforation. In one patient long segment ileal resection with proximal ileostomy was performed. The other patient had mid ileal resection with end to end anastomosis and the last one undergone segmental ileal resection, stricturoplasty with enterocolic bypass. The later two patients died post operatively due to severe acute respiratory distress syndrome.
All 13 patients who were diagnosed by tissue biopsy from peritoneum, mesenteric nodes,
omental tissue and serosal tissue, the another 13 patients diagnosed presumptively by the presence of previous history of pulmonary TB in combination with signs, symptoms, and radiographic evidence for abdominal tuberculosis and the six patients diagnosed with AFB culture from ascetic fluid received anti tuberculous treatment for 6-12 months. All the patients were treated with initial 2 month phase with rifampicin, isoniazid, pyrazinamide and ethambutol and then maintenance phase with rifampicin and isoniazid.
Overall, four (13.3%) patients relapsed with recurrent episode of sub acute bowel obstruction 2 years after successful completion of therapy for abdominal tuberculosis. Twenty eight patients were followed up for an average period of 12 months. (Range, 3–24 months) Discussion Up to 5% of patients with M. tuberculosis have GI involvement, and the GI tract is reported to be the sixth most common extra pulmonary site.4 Of those with GI Tract Tuberculosis, up to 60% may have active pulmonary TB.5
In keeping with the published data6,7,8 fever was the commonest presenting feature in our study with weight loss, abdominal pain and malaise present in greater than 80% cases. Past history of treatment for pulmonary TB was present in 40% of our cases and it is likely that decreased immunity caused reactivation of TB foci.
Our results suggest that abdominal tuberculosis is often difficult to diagnose. The signs and symptoms are nonspecific, and in our sample, clinicians often failed to consider TB in the initial differential diagnosis.
Laparoscopy with biopsy remains the gold standard in diagnosis of peritoneal TB, with a reported sensitivity of 100% and a low

SAARC Journal of Tuberculosis Lung Diseases & HIV/AIDS 4
complication rate.8 Other studies have suggested that smear of the peritoneal fluid for AFB is rarely positive.4 Culture positivity varies from 20-83%.4 In our study 11 patients with ascites, all had negative AFB smears and 6(54.5%) had positive cultures for M. tuberculosis.
Similar laboratory findings in relation to level of haemoglobin, C-reactive protein and ESR were found in other studies like Marshall JB4 and Probert CJ.5
Four of the seven patients with enteric TB had involvement of the terminal ileum and/or cecum. This is consistent with other studies that show enteric TB most frequently involving the ileocecal area. This tropism is thought to be due to the relative physiologic stasis in this area and to the increased density of lymphatic tissue, for which the bacilli have an affinity.9,10,11
TB can affect any region of the gut from esophagus to rectum but the ileo-caecal region is the most commonly involved.12 This was true in our series as well with ileocaecal region in 57.2% cases followed by peritoneal involvement in 41.4% cases being the commonest sites to be affected. Laparoscopic biopsies, being larger in size and visually directed, can provide histological evidence in 70–85% cases.13 In this series it was performed in 10 (31.2%) cases and not only provided the diagnosis in elusive cases but also helped to ascertain the extent of intra-abdominal spread of TB.
In summary, abdominal tuberculosis is a disease that is frequently overlooked, with consequent delay in treatment. As a treatable disorder, abdominal TB should be considered early in the differential diagnosis of abdominal symptoms. Failure to recognize this disease early may lead to increased morbidity and mortality.
References
1. Global tuberculosis Control, WHO Report 2007, WHO
2. Chan ED, Iseman MD. Current medical treatment for tuberculosis. Br Med J 2002; 325:1282–1286
3. National Tuberculosis Programme Of Nepal, a Clinical Manual, 2005
4. Marshall JB. Tuberculosis of gastrointestinal tract and peritoneum. Am J Gastroenterol 1993;88:989-99
5. Probert CJ, Jayanthi V, Wicks AC et el. Epidemiological study of abdominal tuberculosis among Indian migrants and the indigenous population of Leicester. Gut 1992; 33:1085–1088.
6. Singhal, Amit, Gulati et el . Abdominal tuberculosis in Bradford, UK: 1992–2002, Europian journal of gastroenterology and hepatology Volume 17(9), September 2005, pp 967-971
7. Sherman S, Rohwedder JJ, Ravikrishnan KP, Weg JG. Tuberculous enteritis and peritonitis: report of 36 general hospital. Arch Intern Med 1980;140:506-8.
8. Bernhard JS, Bhatia G, Knauer CM. Gastrointestinal tuberculosis: an eighteen patient experience and review. J Clin Gastroenterol 2000; 30:397–402.
9. Jabukowski, A, Elwool RK, Enaison DA. Clinical features of abdominal tuberculosis. J Infect Dis 1988;158:687-92.
10. Sherman S, Rohwedder JJ, Ravikrishnan KP, Weg JG. Tuberculous enteritis and peritonitis: report of 36 general hospital. Arch Intern Med 1980;140:506-8.
11. Bernhard JS, Bhatia G, Knauer CM. Gastrointestinal tuberculosis: an eighteen patient experience and review. J Clin Gastroenterol 2000; 30:397–402
12. Marshall JB. Tuberculosis of the gastrointestinal tract and peritoneum. Am J Gastroenterol 1993; 88:989–999
13. Lisehora GB, Peters CC, Lee YTM, Barcia PJ. Tuberculous peritonitis-do not miss it. Dis Colon Rectum 1996;39:394-9.