s south african petroleum industry association · sapia south african petroleum industry...
TRANSCRIPT

s
South African
Petroleum
Industry
Association
The petroleum
industry’s
contribution
to South Africa
September 2016
Glossary
boe/d Barrels of oil equivalents per day
CHEVREF Chevron Refinery South Africa
CORO Company-owned retailer operated
CSI Corporate Social Investment
CTL Coal-to-liquid fuels
DME Department of Minerals and Energy
DoE Department of Energy
EIA Economic Impact Assessment
ENREF Engen Refinery South Africa
FRA Fuel Retailer Association
GDP Gross Domestic Product
GHG Greenhouse Gas
GTL Gas-to-liquid fuels
HDSA Historically Disadvantaged South African
IMF International Monetary Fund
LOE Leadership in Oil and Energy
LPG Liquefied Petroleum Gas
NATREF National Petroleum Refiners of South Africa
NDP National Development Plan
NERSA National Energy Regulator of South Africa
OPEC Organisation of the Petroleum Exporting Countries
RAS Regulatory Accounting System
RORO Retailer-owned retailer-operated
SAM Social Accounting Matrix

SAPIA South African Petroleum Industry Association
SAPRA South Africa Petroleum Retailers Association
SAPREF South Africa Petroleum Refineries
SARB South African Reserve Bank
SBM Single Buoy Mooring
SDA Supplier Development Agency

Contents
1 Introduction 5
1.1 SAPIA in South Africa 5
1.2 Purpose of this study 6
1.3 Acknowledgements 6
1.4 Disclaimer 6
1.5 Limitations 7
1.6 Assumptions 7
1.7 Layout of the report 8
2 Approach to estimating SAPIA’s economic contribution 10
3 South Africa: economic and petroleum industry performance 14
3.1 Macroeconomic performance 14
3.2 Petroleum industry performance 15
3.3 The petroleum industry value chain in South Africa 16
4 Petroleum industry’s economic footprint in South Africa 27
4.1 The petroleum industry’s contribution towards capital investment in the economy 27
4.2 The petroleum industry’s operation and its contribution to the economy 31
4.3 Petroleum industry’s value chain and its contribution to the economy 36
5 SAPIA’s CSI contribution to the economy 5
6 Conclusion 8
6.1 Security of supply 8
6.2 Industry transformation and skills development 8
6.3 Regulatory framework associated with the petroleum industry 8
6.4 The petroleum industry’s economic and social contributions to the South African economy 9

5
1 Introduction
1.1 SAPIA in South Africa Since July 1994, the South Africa Petroleum Industry Association (SAPIA) has represented the collective interests of the South African petroleum industry; celebrating its 20th anniversary in July 20141. SAPIA comprises integrated and non-integrated members, where the latter refers to fuel wholesales and LPG wholesalers. In this report, when referring to SAPIA’s contribution or investment we refer to the contribution or investment of SAPIA’s integrated members.
Since inception, SAPIA has been working with government to transform and diversify the country’s liquid fuels sector. The association is committed to working together with different institutions in order to promote inclusive social and economic growth.
According to its 2014 annual report, SAPIA plays a strategic role in addressing a range of issues relating to the refining, distribution, and marketing of petroleum products, as well as promoting the sector’s environmental and socio-economic progress. It achieves this by contributing to the development of regulation in certain areas of South African policy; proactively engaging with key stakeholders; sharing research information; providing expert advice and communicating the sector’s views to government, members of the public and media2.
There are currently six operating refineries in the country, four on the coast, and two inland. Oil companies sell mainly petrol, diesel, jet fuel, illuminating paraffin, fuel oil, bitumen, and liquefied petroleum gas (LPG). However, petrol and diesel are the most frequently used liquid fuels in the
1 SAPIA, Annual Report, 2014 2 SAPIA, Annual Report, 2014

6
country accounting for approximately 40.3% and 46.8% respectively of the total petroleum products consumption in 20143.
The sector is currently experiencing a shortage of critical skills, which employers only gain with a number of years of work experience. SAPIA displays a healthy working relationship with all stakeholders to mitigate not only sector challenges but also finding solutions towards secure, affordable, and environmentally sensitive energy. With the positive contribution to the economy, it is crucial that investment into the petroleum industry continues and even increases in the future. Any reduction in capital investment due to cost cutting may prove expensive in the medium to long term as infrastructure wears out faster, outpaced by newer technology. The petroleum industry’s contribution to the economy is more important in the country’s current low growth cycle.
1.2 Purpose of this study SAPIA is an organisation committed to representing petroleum and liquefied petroleum gas companies in South Africa. As a result, the petroleum industry, as represented by SAPIA members, have an impact on the South African economy, specifically in terms of the forward and backward linkages with other sectors and the impact its operations have within the petroleum industry and the economy as a whole. In particular, this is the flow of funds and services between SAPIA members and its suppliers situated in different sectors of the economy. For example, in order to operate their refineries petroleum companies require chemical products, which stimulates demand for these products, which in turn results in increased revenue for the chemicals sector. This generates employment in the chemical sector and subsequently, the income spent by chemical employees stimulates demand in other sectors, depending on their consumption patterns. This is not only true of the refinery component of the value chain but each component, namely crude oil, head office, refinery, storage, distribution, wholesale and retail activities.
SAPIA commissioned KPMG (Pty) Ltd to assess the broader economic and social impact that the petroleum industry’s operations make across the petroleum value chain – including the impact on South Africa’s economy, job creation, poverty alleviation and societal benefits for 2014. At the start of the project, the 2015 financial information was not yet available from the SAPIA members; therefore the study was conducted using the 2014 financial information.
In this document, we report on the economic impact of investment and operations by the petroleum industry, both over the entire value chain and each individual component of the value chain, for 2014. In addition, we will also assess the social contribution the petroleum industry makes to the economy in terms of corporate social investment (CSI).
1.3 Acknowledgements We would like to express our appreciation for the time and cooperation provided to the project team by the management, staff and members of SAPIA.
1.4 Disclaimer This report has been compiled by KPMG for the sole and exclusive use of SAPIA. Any party other than SAPIA and its members, without our prior written consent, should not quote it in whole or in part. KPMG’s findings in connection with this report are intended solely and exclusively for the benefit, information and use by SAPIA. No party, other than SAPIA, may rely on the findings, either in whole or in part. KPMG (including its directors or employees or anybody or entity controlled, owned or associated with KPMG) accepts no liability or responsibility whatsoever, resulting directly or indirectly from the disclosure of our findings to any third party and/or reliance of any third part on the
3 SAPIA, Annual Report, 2014. Own calculations

7
findings, either in whole or in part. KPMG’s findings are related to prevailing conditions and information available at the time of issuing our report.
1.5 Limitations We have relied upon the sources of information referred to in this report. Except where specifically stated, we have not sought to establish the reliability of those sources. We have however reviewed the information and have sought explanations for key trends and salient features identified by us. We have also satisfied ourselves, as far as possible, that the information presented is consistent with other information obtained by us in the course of the work undertaken to prepare this report.
Our engagement does not comprise a due diligence review or constitute an audit or review, other assurance engagement or an agreed-upon procedures engagement, performed in accordance with International Standards on Auditing (ISAs), International Standards on Review Engagements (ISAEs) or International Standards on Related Services (ISRS). Consequently, an audit opinion or assurance conclusion will not be expressed nor will there be a report on factual findings.
As such, this report may not necessarily disclose all matters about the project or reveal errors or irregularities, if any, in the information and representations made to us and upon which we have relied.
Estimations made embody assumptions on the behaviour of factors in the macro and micro economy, and the project itself. These assumptions were based on evidence available as at the time of this report. Users of the forecasts may consider other assumptions to be more appropriate, which may materially change the outcome of the forecasts.
Please note that any advice, opinion, statement of expectation, forecast, or recommendation supplied by us as part of the service shall not amount to any form of guarantee that we have determined or predicted future events or circumstances.
1.6 Assumptions The report presents an economic analysis based on data submitted by various SAPIA members. However, only the main players in the market were approached as they are the integrated members of SAPIA who make up the majority of the industry and own all the major refineries. These members include Sasol, Total SA, Chevron, BPSA, Engen, Shell, PetroSA and SAPREF. The analysis only covers the petroleum sector and its value chain, excluding the gas sector and non-refinery wholesalers.
The economic impact of the petroleum industry could be an underestimation, as the analysis does not include all the SAPIA members. However, it is important to note that since the major players in the industry were included, the analysis gives a true reflection of the economic contribution the industry makes to South Africa.

8
1.7 Layout of the report The layout for the rest of the report consists of the following sections:
o In Section 2 we introduce the theoretical framework of the economic impact assessment (EIA) used in modelling the economic impact of the petroleum industry’s investment and operations in the South African economy.
o In Section 3 we provide the context in which SAPIA operates in terms of economic performance and the expected outlook for the economy. We also provide an overview of the value chain and performance of the petroleum industry.
o In Section 4 we estimate the economic impact of the petroleum industry‘s contribution in the South African economy. In this section, we illustrate the positive economic spin-offs from the capital and operational expenditure by the petroleum industry. This is done in two ways – firstly for the value chain as a whole and secondly for each individual component of the value chain.
o In Section 5 we look at the social contributions that the petroleum industry have made to the South African economy and communities through CSI.
o In Section 6 we provide a conclusion summarising the main contributions of the petroleum industry, both across the petroleum industry value chain and each of the individual value chain components, to the South African economy.
9
•
Approach

10
2 Approach to estimating SAPIA’s economic contribution
The economic impact assessment (EIA) we employ for this project, uses the theory of input-output analysis developed by Wassilly Leontief, as a basis, which shows the interdependencies between different sectors of the economy in a matrix format. The structure of this input-output model has been incorporated into national accounting systems of various countries, including South Africa, and therefore forms an important part of measures such as Gross Domestic Product (GDP).
In addition to studying the structure of national economies, we use input-output analysis as a tool for economic planning. In addition, we also use it to identify economically related sector clusters and so-called “key” or “target” sectors. These sectors are most likely to increase the internal coherence of a specified economy. This is done by analysing the linkages between the different sectors in the economy.
Linkages refer to forward and backward linkages that occur between consecutive steps of a production value chain. A forward linkage exists where the products produced by the petroleum industry is used by a particular firm or sector as an input or raw material. Conversely, a backward linkage occurs where the petroleum industry uses the product of another firm or sector as raw materials or inputs during the production process. The benefits of having an increased number of such backward linkages within an economy is that it centres local demand for raw materials and reduces the sector’s dependence on imports, as we rely on local suppliers for the supply of raw materials.
When estimating the impacts of the petroleum industry, direct, indirect and induced impacts are taken into consideration.
The direct impact includes the first round effects where increased demand for particular goods/services leads to increased business activity and thus a direct change in sectoral production. This is the impact associated with the operational expenditure and infrastructure investment undertaken by the petroleum industry and the various value chain components.
The indirect impact includes the second round effects that change the demand for factors of production and household income, which can be explained by the inter-linkages of sectors in the economy. With reference to this project, these impacts emanate from the increased demand for goods and services acquired by the petroleum industry from external service providers, as well as increased employment opportunities created on the back of this economic activity.
The induced impact includes the multiplier effect that arises through the second round of spending. This is the increase in household income and the additional spending that arises from the change in income levels from the new employment opportunities created due to expenditure by the petroleum industry.
The sum of the direct, indirect and induced impacts represents the total impact.
According to Keynesian economic theory, any injection into the economy via investment capital, government spending or the like will result in a proportional increase in overall income (measured through GDP) at a national, provincial and local level. The basic principle of this theory is that increased spending will have carry-through or multiplier effects or impacts, which result in even greater aggregate spending over time. The multiplier itself is an attempt to measure the size of those

11
carry-through effects or impacts. The multiplier takes all direct and indirect benefits from that investment or from the change in demand into account. The size of the impact or the effect on the economy depends on the size of the multiplier in the economy.
We use this theory as the basis for estimating the economic impact of the petroleum industry’s investment spending and operations expenditure in South Africa. We apply an extension to the input-output matrix, the Social Accounting Matrix (SAM), in our analysis. A SAM is a presentation of the national accounts of a country that places the focus on issues that are of special interest in a country, e.g. an analysis of interrelationships between structural features of an economy and the distribution of income and expenditure among household groups. We collect the required data from a number of different sources including, inter alia, national accounts, income and expenditure surveys, integrated economic accounts.
A SAM shows, amongst other things
o The structure of the costs of production and the value added, which is generated in the production process
o The inter-dependencies of sectors
o The flows of goods and services produced within the national economy
o The flows of goods and services with the rest of the world
o The expenditure by different household groups
The analysis that follows uses a 2014 SAM for South Africa, built by KPMG. We utilised the following data from a number of different sources: value chain cost items from the various SAPIA members; National Accounts from the South African Reserve Bank (SARB) for 2014; income and expenditure surveys; labour force surveys; and the Gross Domestic Product statistical release (P0441).
We used this SAM to estimate how the activities of the petroleum industry in one or more parts of the economy, could affect other sectors of the economy, and how the sector investment and operational impact is distributed in the economy. It thereby highlights the economic linkages within the economy and has the ability to show the direct, indirect and induced effects of a given expenditure on the following economic factors:
Gross Domestic Product (GDP) is a good indicator of economic growth and welfare, as it represents, amongst other, the remuneration of employees and gross operating surplus (GOS) (profits) as components of value added to the economy.
Labour and entrepreneurship form an important part of the primary production factors needed for the petroleum industry‘s operations. The additional number of people employed as a result of the petroleum industry’s investment spending and operations is determined by the EIA.
The petroleum industry’s impact on public finances is its direct tax contributions. In addition, the petroleum industry’s indirect contribution to public finance is included in this analysis.

12
South Africa has high levels of poverty, with 45% of the population (est. 2.4 million) living in poverty on an average income of less than R3 000 per annum. One of the components of the EIA is to determine whether the petroleum industry’s investment and operations have a positive impact on poverty alleviation: we show how the petroleum industry’s operations benefit low-income households, which is reflected through the additional income that low income households received4.
The basis of this analysis is therefore an assessment of how direct economic activity could potentially lead to other forms of economic activity. The size of the additional economic activity is measured by means of the multiplier effect. The different rounds of the multiplier effect, from the initial spending in a sector due to petroleum industry’s investment, through to economically active individuals spending their salaries on buying goods and services (and its resultant effects), is then estimated as the direct, indirect and induced impacts of the petroleum industry’s investment and operations.
4 The definition of low, medium and high-income household categories follows from the definition in the Income and Expenditure Survey (IES) 2010/11 by StatsSA. Low-income households include households with a monthly income of up to R9 886; medium income households include households with a monthly income of between R9 887 and R21 002; high-income households include households with a monthly income of R21 003 and above.
13
Economic & sector
performance

14
3 South Africa: economic and petroleum industry performance
3.1 Macroeconomic performance South Africa is a middle-income, emerging market with an abundant supply of natural resources and well-developed financial, legal, communications, energy and transport sectors. Over the past decade, South Africa’s population has increased on average by 1.5% per annum5.
South Africa’s macroeconomic environment is under pressure, characterised by a lower than expected growth rate, high unemployment, high inflation, electricity shortages and a steep depreciation of the currency. GDP growth has been sluggish at 1.5% in 2014 and 1.3% 2015, falling short of the 5 - 6% economic growth required to make a meaningful dent in unemployment, poverty and inequality.
The negative trend in business confidence, rising consumer price inflation, a rapidly depreciating rand, decades-low rainfall levels, and slowing GDP growth in China all contributed to slower 2015 domestic economic growth.
In light of the sluggish economy, various forecasting agencies have revised down their growth rates for South Africa. The International Monetary Fund (IMF) has reduced the growth prospects for 2016 from 1.3% to 0.7%. This is due to weak foreign demand, lower commodity prices and higher borrowing costs. Global growth has also stagnated due to low growth rates in China, higher US interest rates and emerging market volatility. There is also rising concerns of the risk of recession for South Africa as other commodity producers like Brazil and Russia are already in recession.
The mining, manufacturing and construction sectors are under pressure, especially with wage negotiations, lower commodity prices and suppressed global demand. On a positive note, the finance and wholesale sectors are performing satisfactorily and supporting the economy.
5 Statistics South Africa, Mid-year population estimate 2015
15
The subdued outlook for economic growth over the medium term could negatively affect the petroleum industry because of rising production cost and expensive imports. At the same time, it is reasonable to expect that consumer price inflation and interest rates could rise, while the rand could remain weak. Local companies face a challenging period over the short term in dealing with these factors.
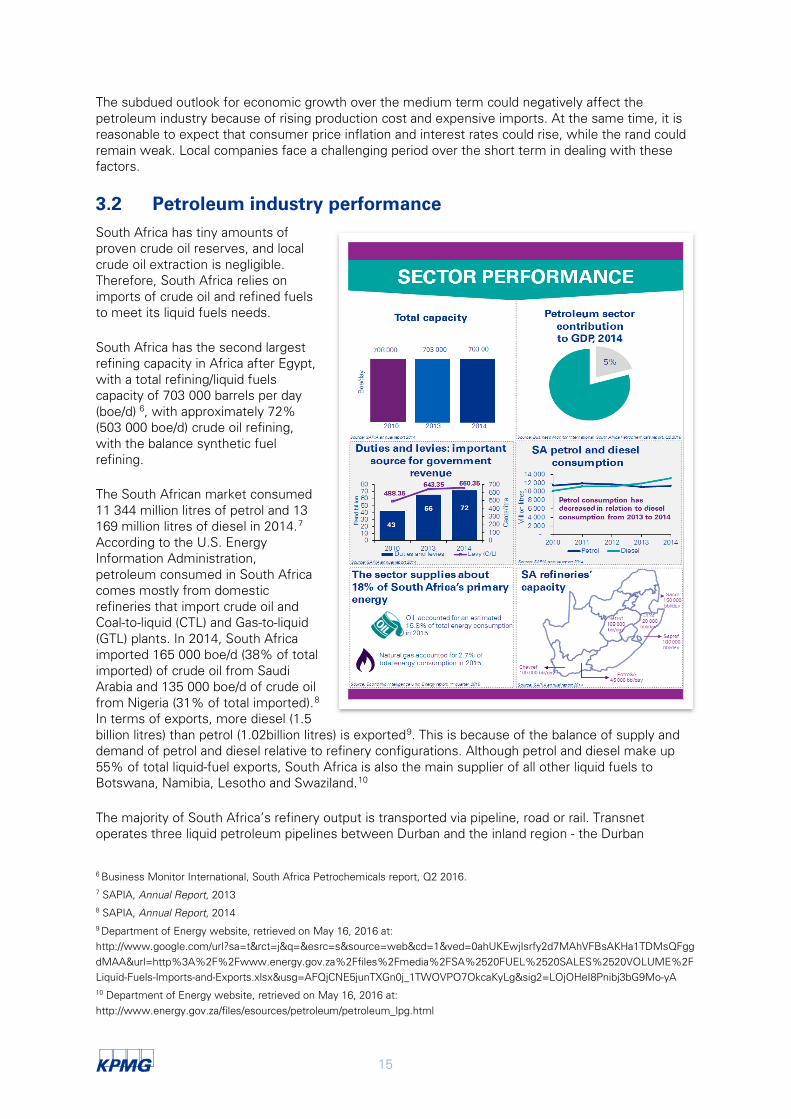
3.2 Petroleum industry performance South Africa has tiny amounts of proven crude oil reserves, and local crude oil extraction is negligible. Therefore, South Africa relies on imports of crude oil and refined fuels to meet its liquid fuels needs.
South Africa has the second largest refining capacity in Africa after Egypt, with a total refining/liquid fuels capacity of 703 000 barrels per day (boe/d) 6, with approximately 72% (503 000 boe/d) crude oil refining, with the balance synthetic fuel refining.
The South African market consumed 11 344 million litres of petrol and 13 169 million litres of diesel in 2014.7 According to the U.S. Energy Information Administration, petroleum consumed in South Africa comes mostly from domestic refineries that import crude oil and Coal-to-liquid (CTL) and Gas-to-liquid (GTL) plants. In 2014, South Africa imported 165 000 boe/d (38% of total imported) of crude oil from Saudi Arabia and 135 000 boe/d of crude oil from Nigeria (31% of total imported).8 In terms of exports, more diesel (1.5 billion litres) than petrol (1.02billion litres) is exported9. This is because of the balance of supply and demand of petrol and diesel relative to refinery configurations. Although petrol and diesel make up 55% of total liquid-fuel exports, South Africa is also the main supplier of all other liquid fuels to Botswana, Namibia, Lesotho and Swaziland.10
The majority of South Africa’s refinery output is transported via pipeline, road or rail. Transnet operates three liquid petroleum pipelines between Durban and the inland region - the Durban
6 Business Monitor International, South Africa Petrochemicals report, Q2 2016. 7 SAPIA, Annual Report, 2013 8 SAPIA, Annual Report, 2014 9 Department of Energy website, retrieved on May 16, 2016 at: http://www.google.com/url?sa=t&rct=j&q=&esrc=s&source=web&cd=1&ved=0ahUKEwjIsrfy2d7MAhVFBsAKHa1TDMsQFggdMAA&url=http%3A%2F%2Fwww.energy.gov.za%2Ffiles%2Fmedia%2FSA%2520FUEL%2520SALES%2520VOLUME%2FLiquid-Fuels-Imports-and-Exports.xlsx&usg=AFQjCNE5junTXGn0j_1TWOVPO7OkcaKyLg&sig2=LOjOHeI8Pnibj3bG9Mo-yA 10 Department of Energy website, retrieved on May 16, 2016 at: http://www.energy.gov.za/files/esources/petroleum/petroleum_lpg.html

16
Johannesburg Pipeline (DJP), in petrol service, the Multi Products Pipeline (primarily in diesel service) and the crude oil pipeline to Sasolburg servicing the NATREF refinery.
In an effort to alleviate the supply burden resulting from demand growth, there are plans to build a 300 000 boe/d refinery located in the Eastern Cape Province called Project Mthombo. Current refinery operators are reluctant to expand present capacity due to the high cost involved and because of the surfeit of liquid petroleum products available in the international market. Nonetheless, South Africa’s refineries are well placed on a cash operating basis within its regional peer group (European and African countries that have more than one refinery) indicating their current competitive situation relative to these other manufacturers.11
3.3 The petroleum industry value chain in South Africa The petroleum industry is divided into three major components: upstream, midstream and downstream activities.
o Upstream activities refer to the exploration and production of crude oil. South Africa has tiny commercially exploitable crude oil, with the Oil and Gas journal estimating the country has proven reserves amounting to about 15 million barrels.
o Midstream activities refer to the refining, transportation (by pipeline, rail, oil tanker or truck), storage and wholesale marketing of crude or refined petroleum products.
o Lastly, downstream activities refer to the transportation and marketing of end-user products. The figure below represents of the general value chain.
Source: Alerian Energy Infrastructure Portfolio, Energy Infrastructure Overview12
For the purposes of this report, the value chain for petroleum in South Africa is important. The petroleum industry is different to many others in that one input (crude oil) results in a range of products. 13 This requires an extended and complex value chain, each part of which has linkages to several sectors of the economy, increasing the potential for adding economic value. For instance, the transportation and storage of a hazardous substance makes an otherwise straightforward value chain
11 Wood Mackenzie, South Africa’s role in global refining market 12 Available at: http://www.alpsfunds.com/overview/alps-alerian-energy-infrastructure-portfolio 13 Rusinga, N., Value Chain Analysis along the Petroleum Supply Chain, Thesis as part of Masters programme in Commerce, University of Cape Town, 2010.

17
more specialised and expensive.14 This implies additional linkages in the economy that, in other industries, would not be found.
The South African value chain begins with crude imports or finished product imports. Crude is shipped to the refinery where it is transformed into a variety of value-added products, which are distributed to depots (secondary storage facilities) or to major customers. At the refinery, the products are supplemented by internationally and locally sourced finished products and blended, where necessary. From the depots, final products are distributed to major customers and the retail network. At retailers, convenience stores are added to many of the oil companies’ service offerings. Distribution of these products takes place via ship, pipeline, rail or road15. Shipping crude oil or petroleum products incurs costs for freight, insurance, wharfage, inspection, demurrage (charge for detaining a ship over and above the time normally given to unload), and marine transit losses Congested ports, slow customs clearance, and any other factor delaying discharging of the fuel could incur additional costs.16
3.3.1.1 Crude oil activities
Because there are little crude oil reserves in South Africa, the country imports nearly all of its crude oil requirements from the Middle East and other parts of Africa17. This makes refineries, as a source of synthetic fuels all the more important to avoid a complete dependence on international markets and, in turn, volatile commodity prices and exchange rates. Domestic demand of liquid fuels is, in this way, mainly met through these local refineries.
According to data in the SAPIA 2014 annual report, South Africa imported 21.2 million tonnes of crude oil in 2014 (2013: 18.7 million tonnes). The majority of the country’s crude oil comes from the Organisation of Petroleum Exporting Countries (OPEC) countries in the Middle East and West Africa. Major suppliers included Saudi Arabia (38%), Nigeria (31%) and Angola (12%). The diagram below shows the source of South Africa’s crude oil by country of origin.
14 Rusinga, N., Value Chain Analysis along the Petroleum Supply Chain, Thesis as part of Masters programme in Commerce, University of Cape Town, 2010. 15 Engen Limited, Integrated Annual Report, 2014 16 Masami Kojima, William Matthews and Fred Sexsmith, Petroleum Markets in Sub-Saharan Africa, the Analysis and Assessment of 12 Countries, Washington, D.C. 17 SAPIA, The first 20 years, 2014
Wholesale activities
Distribution activities
Storage activities
Refinery activities
Head office activities
Crude oil activities
Retail activities

18
In terms of local crude oil activities, the Single Buoy Mooring (SBM), which is located 2.5km off the Durban south coast, makes it possible for tankers to offload about 80%18 of South Africa’s crude oil imports. Although local crude oil activities remains underdeveloped in the South African economy, the use of local labour is important. In particular, skilled labour such as engineers, mechanical operators and divers are required implying high quality provision of jobs in these activities. Furthermore, this allows for higher wages and salaries to be spent in the economy, creating more impact through demand in other sectors.
3.3.1.2 Head office activities
This part of the value chain relates to the head office of the various petroleum companies. It deals with important overarching tasks such as strategic planning, corporate communications, taxes, law, marketing, finance, human resources and information technology.
While the head office activities of SAPIA members do not directly link to a product or tangible outcome, they set efficiencies, ensure corporate governance and guarantee the overall success of the company. For example, efficient operations by the head office improve the ability of a petroleum company to contribute to economic growth through strategic infrastructure development and ensuring security of supply. Increased innovation and strategy can also contribute indirectly to the efficiency of the sector as a whole.
3.3.1.3 Refinery activities
18 http://www.jobvine.co.za/insight/company/shell-and-b-p-south-african-petroleum-refineries-sapref/543/
Angola12% Equatorial Guinea
2%Ghana
4%
Iraq3%
Nigeria31%
Saudi Arabia38%
United Arab Emirates
4%
Colombia ; Ecuador ; Gabon ; Panama ; Qatar ; United Kingdom
6%
Head office activities
Crude oil activities
Retail activities
Refinery activities
Wholesale activities
Distribution activities
Storage activities
Wholesale activities
Head office activities
Crude oil activities
Retail activities
Refinery activities
Distribution activities
Storage activities

19
The chemical engineering processes and other facilities are used to transform crude oil into useful products such as liquefied petroleum gas (LPG), gasoline or petrol, kerosene, jet fuel, diesel oil and fuel oils. In this way, crude oil is the starting point for many products including19:
o LPG - used for heating and cooking
o Petrol - motor fuel
o Kerosene - fuel for jet engines, lighting and heating; input material for other products
o Diesel - used for diesel fuel and heating oil; input material for other products
o Base oil - used for motor oil, grease, use in many other lubricating oils
o Fuel oil - used for industrial fuel; input material for other products
o Residuals - coke, asphalt, tar, waxes; input material for other products
In South Africa, these petroleum products are produced through six refineries:
o Crude oil refiners, CHEVREF, ENREF, NATREF and SAPREF
o CTL and GTL fuels (by Sasol)
o Natural gas to liquid fuels (by PetroSA)
Petrol and diesel make up 55% of total liquid-fuel exports; South Africa is also the main supplier of all other liquid fuels to Botswana, Namibia, Lesotho and Swaziland20.
Upgrading of refineries requires capital outlay, usually with low returns on investment. In addition, the South African Government is enforcing stricter emissions standards, which will require significant investment for compliance.. Legislation related to the compulsory reporting of Greenhouse Gas (GHG) emissions is in the process of development together with other regulatory actions, carbon taxes and carbon budgets, in which seek to curtail GHG emissions.. Furthermore the government is seeking to impose new, more onerous fuel specifications that will require significant investment to manufacture these. Without the same economies of scale, operating costs of refineries in South Africa are about 100% more than those of competitors in South East Asia 21.
The products and by-products from these refineries are important contributors to the economy not only as a source of fuel. The base oils and lubricants also service a variety of machinery and equipment in the construction, manufacturing and agro processing sectors. With limited infrastructure to import LPG, an important by-product, these local sources are key for security of supply. LPG also contributes to the diversification of South Africa’s energy mix. Refineries also hire skilled employees like architects, surveyors, engineers and managers. This not only provides a high quality of labour in the economy but the skills shortage experienced in the industry suggests that more such labour is required. These occupations receive higher wages and salaries that are able to create greater demand for products and services in other parts of the economy.
3.3.1.4 Distribution activities
19 Freudenrich, C., How Oil Refining Works, Accessed on 2Jun2016 from http://science.howstuffworks.com/environmental/energy/oil-refining2.htm 20 Department of Energy website, retrieved on May 16, 2016 at: http://www.energy.gov.za/files/esources/petroleum/petroleum_lpg.html 21 Business Monitor International, South African Petrochemicals report, Q2 2016
Wholesale activities
Refinery activities
Head office activities
Crude oil activities
Retail activities
Distribution activities
Storage activities

20
Distribution activities involve the movement of petroleum from refineries to wholesalers and retail locations. In South Africa liquid fuels are distributed from refineries by pipeline, road and rail to approximately 200 depots, 4 600 service stations and 100 000 direct consumers22. Distribution is considered the strength and source of a country’s growth. Distribution networks should therefore be designed in an optimal way to foster economic growth. According to the NDP, refined fuel products contribute to key economic sectors where the major demand remains in the inland Gauteng region.
The Petroleum Pipelines Act of 2003 promotes competition in the operations of petroleum pipelines, ensuring safe, secure and environmentally responsible transportation and storage of petroleum. The act emphasises the effective use and development of pipeline infrastructure and the enablement of fair access to petroleum pipelines.
Transnet pipelines' network transports most of South Africa's bulk petroleum products and the NATREF inland refinery receives all of its crude oil requirements from Transnet pipelines' network. Although pipelines are capital intensive, the long-term operating costs incurred are relatively lower than road and rail. Already increased pipelines capacity to Gauteng, from 4.5 to 26 billion litres per annum, has eased distribution and security of supply concerns23.
For areas with no pipeline infrastructure, road and rail are alternative means of distribution. According to Transnet, excluding pipelines, road and rail distribute 60% and 40% respectively of the transportable volume in the country. Transnet’s fuel rail tank car fleet consists of the ‘XP series’ used interchangably for jet fuel, petrol and paraffin, the ‘XJ series’ for diesel and the ‘XV series’ for liquid petroleum gas. Transnet freight provides an average carrying capacity of 36 000 litres for the XPs, 30 000 litres for the XJs and 25 tons for the XVs24. In comparison, Transnet pipelines distribute an estimated 18 billion litres per annum of petroleum products, which equates to 850 road tanks and an 8.5km long convoy of tankers per day25.
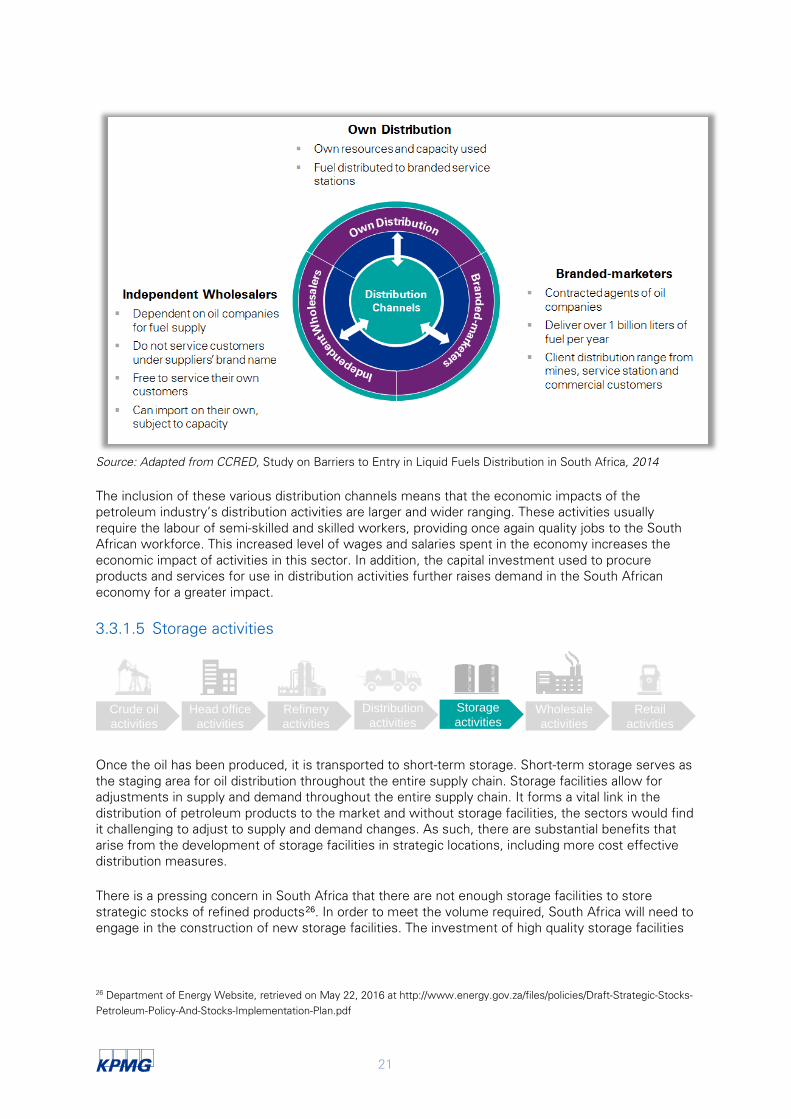
Once the distribution channel transports the petroleum to storage facilities across the country, the petroleum products are distributed to retail by road, through three channels: “own distribution by oil companies”, “branded-marketers” and/or “independent wholesalers”.
22 Department of Energy, retrieved on 27 May, 2016 at http://www.energy.gov.za/files/IEP/Mmabatho/Overview-of-the-Liquid-Fuels-Sector.pdf 23 Transnet, Chapter 5 of Pipeline Development Plan, 2014. Available at: http://www.transnet.net/BusinessWithUs/LTPF%202012/1.LTPF%202014_Chapter%2005__Pipelines_Final%20Proof_Sept%202014.pdf 24 Transnet website, retrieved on 27 May, 2016, at http://www.spoornet.co.za/Website/fuel.html 25 Naidoo, L. Future fuel distribution strategies for Southern Africa: How road, rail together with pipelines can work together to guarantee security of supply to Gauteng, presented on 2 and 3 November 2011. Available at: http://www.slideshare.net/classicevents/leslie-naidoo-commercial-manager-operations-transnet-pipelines
21
Source: Adapted from CCRED, Study on Barriers to Entry in Liquid Fuels Distribution in South Africa, 2014
The inclusion of these various distribution channels means that the economic impacts of the petroleum industry’s distribution activities are larger and wider ranging. These activities usually require the labour of semi-skilled and skilled workers, providing once again quality jobs to the South African workforce. This increased level of wages and salaries spent in the economy increases the economic impact of activities in this sector. In addition, the capital investment used to procure products and services for use in distribution activities further raises demand in the South African economy for a greater impact.
3.3.1.5 Storage activities
Once the oil has been produced, it is transported to short-term storage. Short-term storage serves as the staging area for oil distribution throughout the entire supply chain. Storage facilities allow for adjustments in supply and demand throughout the entire supply chain. It forms a vital link in the distribution of petroleum products to the market and without storage facilities, the sectors would find it challenging to adjust to supply and demand changes. As such, there are substantial benefits that arise from the development of storage facilities in strategic locations, including more cost effective distribution measures.
There is a pressing concern in South Africa that there are not enough storage facilities to store strategic stocks of refined products26. In order to meet the volume required, South Africa will need to engage in the construction of new storage facilities. The investment of high quality storage facilities
26 Department of Energy Website, retrieved on May 22, 2016 at http://www.energy.gov.za/files/policies/Draft-Strategic-Stocks-Petroleum-Policy-And-Stocks-Implementation-Plan.pdf
Wholesale activities
Refinery activities
Head office activities
Crude oil activities
Retail activities
Distribution activities
Storage activities

22
and services is very important to support current requirements and to anticipate any possible future needs from the country and consumers.
This highlights the important economic contribution of SAPIA members’ existing infrastructure and any future investment. BP Southern Africa, Chevron South Africa, Engen Petroleum, PetroSA, Sasol Oil, Shell South Africa and Total South Africa are the main players in the South African oil sector. They operate storage terminals and distribution facilities throughout the country, which provide ease of distribution to retail wholesalers and consumers. Among the SAPIA member owned storage facilities, the larger facilities are predominately in coastal areas, allowing ease of access to refined products
Data from NERSA shows that the largest petroleum storage facilities are located around the coastal areas of South Africa. The largest inland petroleum storage facility complex is located in Alberton, Gauteng. This storage facility is also half the capacity of the top three coastal facilities even though 68% of petroleum distributed inland is consumed in Gauteng27. This highlights the importance of investment in storage and distribution facilities for the supply of petroleum products to key areas as a means of ensuring security of supply. Increasing storage capacity in inland areas may also reduce the cost of distribution. Transnet pipelines play a vital role by transporting refined oil. By facilitating distribution to storage facilities in South Africa, Transnet also plays an essential role in ensuring that distribution of petroleum products occurs28.
According to NERSA, there are more than 201 licenced petroleum storage facilities across the country, which are dedicated to different petroleum products such as petrol, diesel, paraffin and jet fuel.29 Kwa-Zulu Natal has the largest storage capacity compared to the other provinces, representing 41% of the total country storage capacity. This is followed by Gauteng and the Western Cape with 18% and 17% storage capacity respectively. These three provinces also achieved the highest sales volumes as well as contributed the most to the country’s GDP in 2014.
Efforts to improve storage facilities could strengthen the security of supply in South Africa. Security of supply of liquid fuels is explicitly mentioned in South Africa’s NDP as essential to ensuring that there are limited disruptions to economic activity, transport and welfare. In this way, the petroleum industry’s storage infrastructure is key. Larger storage facilities of petroleum products and crude oil are limited, in turn limiting the increase of supply of imports from independent sources. The DoE estimated that a shortage of fuel will cost the country around R1 billion per day, but security of supply, through strategic stocks, will cost an estimated R1.62 billion per year based on the estimated volume of 27 billion litres of consumption per annum30.
27 Department Government Communication and Information System website, retrieved on 26 May, 2016 at http://www.gcis.gov.za/sites/www.gcis.gov.za/files/docs/resourcecentre/yearbook/2013-4Energy.pdf 28 Pienaar, W.J., Logistics Aspects of petroleum pipeline operations Journal of Transport and Supply Chain Management, Stellenbosch, 2010 29 NERSA, Petroleum Storage Facility Database, 2016. Available at: http://www.nersa.org.za/Admin/Document/Editor/file/PetroleumPipelines/Storage%20Facilities%20DB/Petroleum%20Storage%20Facility%20Database_31July2016_Public.pdf 30 Department of Energy Website, retrieved on May 22, 2016 at http://www.energy.gov.za/files/policies/Draft-Strategic-Stocks-Petroleum-Policy-And-Stocks-Implementation-Plan.pdf
23
3.3.1.6 Wholesale activities
From the depots and storage facilities, liquid fuels are delivered to commercial customers through either oil companies’ own direct distribution, branded-marketers / integrated wholesalers or independent wholesalers31. Oil companies distribute roughly half of their petrol, diesel and fuel oils to commercial and retail customers32. Petroleum fuels are supplied directly to about 100 000 consumers, many of whom are farmers33. Oil companies also sell petrol, diesel and fuel oils to commercial segments, which include customers such as parastatals, commercial/passenger transport, agriculture, manufacturing, construction, mining, local communities and resellers34.
Until recently, there were very few non-refining wholesalers supplying petrol and diesel in South Africa. Today, there are a number that are registered with the DOE. This enables the petroleum industry’s contribution to the economy through increased employment, transformation and security of supply. In addition, according to the NDP, new infrastructure such as Project Mthombo may translate into additional capacity for South Africa to export liquid fuels.
The Petroleum Product Amendment Act of 2003 requires that all wholesalers acquire a wholesale license from the DoE. These are issued to a person or business that purchases and sells prescribed petroleum products in bulk (1500 litres or more, per transaction) from or to a licensed manufacturer or wholesaler, as well as to a retailer or end consumer35.
The supply of petroleum products to wholesalers such as farmers and large producers is not the only economic contribution made by activities in this sector. The labour required to do so ranges from unskilled to skilled. This provides a range of employment opportunities, and hence, wage and salary income to the South African labour market. This in turn creates additional demand as employers increase or gain disposable income and spend it in the economy.
3.3.1.7 Retail activities
Oil companies sell about 50% of petrol, diesel and other liquid fuels to the retail segment through petrol stations36. The South Africa Petroleum Retailers Association (SAPRA) reported that retail stations sell about 950 million litres of petrol and 830 million litres of diesel a month37. As an
31 Paelo, A., Robb, G. and Vilakazi, T., Study on Barriers to Entry in Liquid Fuels Distribution in South Africa, Centre for Competition, Regulation and Economic Development, Working Paper 13/2014 32 From data submitted by SAPIA members for 2014 33 SAPIA, Annual Report, 2014 34 South African Competition Tribunal, Case no. 57/LM/Oct03, 2004 35 Department of Energy, Guidelines to the Wholesale License Regulations, available at: http://www.energy.gov.za/files/households/guidelines_petroleumproducts_wholesalelicense.pdf 36 South African Competition Tribunal, Case no. 57/LM/Oct03, 2004 37 Esterhuizen, I., Retail fuel sector changing dramatically, Engineering News, 6 May 2011. Available at: http://www.engineeringnews.co.za/article/dramatic-change-in-retail-sector-2011-04-18
Wholesale activities
Refinery activities
Head office activities
Crude oil activities
Retail activities
Distribution activities
Storage activities
Wholesale activities
Refinery activities
Head office activities
Crude oil activities
Retail activities
Distribution activities
Storage activities

24
indication, there are approximately 4 600 service stations38 with over 6 000 licenses issued in South Africa39. Retail sites are typically of two types40:
o Company-owned retail operated (CORO): the oil company usually owns the site licence, but the dealer owns the retail licence
o Retailer-owned retailer-operated (RORO): the retailer usually owns the site licence (i.e. provides confirmation that the site/land is certified and fit to be used as a site for a service station including compliance with environmental impact assessment requirements, health and safety standards), as well as the retail licence for the service station
A Nielsen report claims that there are over 3 000 forecourt convenience stores with R14.8 billion worth of sales coming from them. In fact, the Nielsen report estimate that the forecourt market is worth about 4% of the country’s entire retail market41.
Citing the Fuel Retailer’s Association (FRA), media reports claim that petrol stations employ around 70 000 people across the country. Previous reports on petrol attendants stated that most of these employees are young men, with an average age of 27. More than half had worked in the same position for in excess of five years, while individual salaries can reach R9 000 per month, depending on which company they work for. According to the wage schedule for the motor sector, petrol attendants’ minimum wage is set at R22.75 per hour or R1 024 per week (roughly R4 100 a month)42. This highlights the importance of the retail sector not only in terms of delivery to consumers but also in terms of its contribution to the creation of decent jobs in the country.
The majority of petrol, diesel and other liquid fuels is sold to the retail market by oil companies’ own direct distribution, branded-marketers/integrated wholesalers or independent wholesalers.
In conclusion, the petroleum industry is a complex one as each of its many components are linked to several sectors in the economy. This not only implies that each component itself comprise activities that contribute to the economy, but the further linkages of these activities to other sectors in the
38 Esterhuizen, I., Retail fuel sector changing dramatically, Engineering News, 6 May 2011. Available at: http://www.engineeringnews.co.za/article/dramatic-change-in-retail-sector-2011-04-18 39 Paelo,A., Robb, G. and Vilakazi, T., Study on Barriers to Entry in Liquid Fuel Distribution in South Africa, Centre for Competition, Regulation and Economic Development (CCRED), Working Paper 13/2014, 2014 40 Paelo,A., Robb, G. and Vilakazi, T., Study on Barriers to Entry in Liquid Fuel Distribution in South Africa, Centre for Competition, Regulation and Economic Development (CCRED), Working Paper 13/2014, 2014 41 http://www.bdlive.co.za/business/retail/2013/12/02/forecourt-store-concept-gains-momentum 42 See http://businesstech.co.za/news/business/111527/how-much-money-petrol-attendants-earn-in-south-africa/

25
economy magnify the sector’s economic contribution. The value chain represented in the figure below will be the basis of the EIA and the write up that follows.
Source: KPMG analysis

26
Economic footprint

27
4 Petroleum industry’s economic footprint in South Africa
During 2014, the petroleum industry contributed towards the South African economy through job creation, infrastructure development, community development and transformation. This section of the report provides insight into the nature and magnitude of the petroleum industry’s contribution to the economy, as well as the knock on effects that have resulted from the industry’s direct contributions. Section 4.1 explains the economic impact of the capital investment by SAPIA members while section 4.2 deals with the economic contribution of the SAPIA members’ operations.
4.1 The petroleum industry’s contribution towards capital investment in the economy
The South African petroleum industry is Sub-Saharan Africa’s largest crude refining sector with a capacity of 703 000 boe/d, which has remained constant since 2010. There have also been talks of a new 300 000 boe/d refining complex near Port Elizabeth known as Project Mthombo.
Over the past three years the SAPIA member companies and its refineries have invested close to R20 billion into infrastructure development43 in the petroleum industry.
Over the same period, SAPIA member companies has invested about R1.7 billion in refinery maintenance.
Source: SAPIA Annual Report for 2012, 2013 and 2014
Through the investment spending by SAPIA member companies and its refineries it supports continued economic benefits to South Africa, such as economic growth, the creation of jobs and poverty alleviation.
43 Infrastructure is the basic physical systems of a business or nation; transportation, communication, sewage, water and electric systems are all examples of infrastructure. These systems tend to be high-cost investments; however, they are vital to a country's economic development and prosperity.
6 465
4 312
9 014
0
2 000
4 000
6 000
8 000
10 000
2012 2013 2014
Cap
ital e
xpen
ditu
re (R
and
mill
ions
)
Infrastructure development
380
638 646
0
100
200
300
400
500
600
700
2012 2013 2014
Cap
ital e
xpen
ditu
re (R
and
mill
ions
)
Refinery shutdown capital expenditure

28
The following table shows the estimated economic activity created due to the infrastructure investment of R9 014 million and refinery maintenance of R646 million by the petroleum industry during 2014.
GDP impact (Rand millions)
Direct impact
Indirect impact
Induced impact
Total impact
Infrastructure development
R7 728 million
R2 529 million
R4 271 million
R14 538 million
Refinery maintenance
R609 million
R259 million
R300 million
R1 169 million
Total GDP impact
R8 337 million
R2 799 million
R4 571 million
R15 706 million
Source: KPMG analysis from 2014 Social Accounting Matrix for South Africa
The total estimated additional economic activity created due to the total investment spending44 in 2014 was in the order of R15.7 billion. Hence, the national GDP increased by this amount, due to investment by the petroleum sector. The direct impact accounts for 53%, which shows the importance of the so-called multiplier effect of capital investment in the petroleum industry on the South African economy. The GDP impact represents an estimated 0.4% of the South African GDP45.
44 This includes the infrastructure development as well as the refinery maintenance. 45 Total GDP of South Africa for 2014 = R3 812 607 million (Source: South African Reserve Bank (SARB) Bulletin, June 2016).

29
The table below shows the estimated impact on employment from infrastructure investment spending in the petroleum industry during 201446.
Employment impact (number)
Direct impact
Indirect impact
Induced impact
Total impact
Infrastructure development 14 616 7 926 13 157 35 699
Refinery maintenance 1 640 817 926 3 383
Total employment impact
16 256 8 743 14 083 39 082
Source: KPMG analysis from 2014 Social Accounting Matrix for South Africa
The investment spending on petroleum infrastructure in South Africa sustained about 39 000 jobs. This represents 0.3%47 of total formal employment in South Africa during 2014.
In 2014 approximately 16 200 jobs were sustained directly through the investment spending. Over the same period, approximately 23 000 jobs were created indirectly in those sectors that provide inputs into the petroleum infrastructure and refinery maintenance components, as well as through the payment of salaries and wages to people who were directly employed at the various stages of the infrastructure expansion and ongoing maintenance.
Due to the investment in petroleum infrastructure and refinery maintenance, total government revenue increased by an estimated R3.2 billion during 2014. The increase in government revenue flows from the collection of direct and indirect tax revenue by petroleum companies such as Engen, Chevron, to name only a few, as well as the broader fiscal impacts generated through the linkages the infrastructure investment has with other economic sectors.
46 Please note that the employment figures shown in the table only include formal sector jobs created. Jobs created in the informal sector are not included and therefore underestimates the total number of jobs that could potentially be created in the economy. 47 Total number of jobs in South Africa for 2014 was 15 319 611(Source: StatsSA Statistical release P0211, Quarterly Labour Force Survey (QLFS), Quarter 1, 2016).
2 984
211
3 194
-
500
1 000
1 500
2 000
2 500
3 000
3 500
Infrastructuredevelopment
Refinerymaintenance
Total impact
Impa
ct o
n go
vern
men
t rev
enue
(R
and
mill
ions
)

30
Households in South Africa also benefitted from the investment in petroleum infrastructure and refinery maintenance. This is done through the downward stream of income sources, i.e. salaries and wages. The total income received by households in 2014 was in the order of R7.7 billion, an estimated R212 million of which was received by lower income households.
Source: KPMG analysis from 2014 Social Accounting Matrix for South Africa
From the above, it is evident that investment in petroleum infrastructure development and improvement contributed positively towards improving productivity and efficiency in the country in 2014. The increase in overall productivity and efficiency drove overall economic growth, which was a result of the long-term nature of the economic benefit streams created, especially in downstream user sectors. It is also evident that future investment will continue to have a positive impact on the South African economy, through the boost generated by investments in this type of infrastructure. The long-term economic benefits that could be realised because of additional investment into the petroleum industry is shown in the table below:
Potential long-term economic benefits
Every R1 new investment in infrastructure development and refinery maintenance in the petroleum industry potentially adds an additional R1.63 to the South African economy, highlighting the significant contribution infrastructure development and refinery maintenance makes to the economy, as well as efficiency and productivity thereof.
Additional investment into infrastructure development in the petroleum industry and refinery maintenance implies an additional 4 jobs per R1 million invested.
Every R1 new investment into infrastructure development and refinery maintenance by the petroleum industry potentially adds an additional 33 cents to national government revenue.
Future infrastructure investment into the petroleum industry and refinery maintenance implies poverty alleviation impact for the South African economy in that 2.8% of additional household income generated will flow to low-income households.
Source: KPMG analysis from 2014 Social Accounting Matrix for South Africa
7 183
504
7 687
198
15
212
-100 800
1 700 2 600 3 500 4 400 5 300 6 200 7 100 8 000
Infrastructuredevelopment
Refinerymaintenance
Total impact
Impa
ct o
n ho
useh
old
inco
me
(Ran
d m
illio
ns)
Total households Low-income households

31
4.2 The petroleum industry’s operation and its contribution to the economy
South Africa’s petroleum industry contributes towards the local economy in the following way, in 2014 joint turnover of the sector amounted to some R365 billion, paying over R6 billion in salaries, wages and benefits and providing R72 billion in duties and levies for the year. The sector employees about 9 000 individuals and provides further employment to over 600 000 people economy-wide. The fuel sector contributes about 6.5% to the country’s GDP while supplying some 18% of South Africa’s primary energy needs through annual sales of around 27 billion litres of liquid fuels. It also collects over R66 billion in fuel taxes on petrol and diesel, which is an important source of revenue for the government. In this section of the report, we consider the petroleum industry’s direct contribution to the economy; in terms of revenue generation and operational spend, as well as the knock on effects that have resulted from such expenditure.
4.2.1 The petroleum industry’s contribution to economic growth through revenue generation
Sale volumes in the petroleum, chemical products, rubber, and plastic products sector grew by 6.8% in 2014 and SAPIA’s members contributed to this growth ensuring security of supply to the South African market. Petrol and diesel consumption contributed to the increase were petrol consumption increased by 2% and diesel cconsumption increased by 11% when compared to 2013.
During 2014, the operating profit of the SAPIA members declined significantly, this decreased by about 83% over the three years
During 2014, SAPIA members generated R85 billion in value add. Even though there was a decrease from 2013 to 2014, the value add has grown by about 4% on average over the three years.
SAPIA members are the main contributers to the Petroleum products, chemicals, rubber and plastic sector48, accounting for to 98% of the sectors total GDP value in 201349.
Source: StatsSA Statistical release P0441 Gross Domestic Product, Quarter 3, 2014; SAPIA Annual Report for 2012, 2013 and 2014
Since GDP represents the total value of all final goods and services produced in the country, it is fundamental to the economic value of life of people in South Africa. It is therefore the most important
48 According the Standard Industry Classification (SIC) of all economical activities, The petroleum industry is classified under the Petroleum products, chemicals, rubber and plastic sector 49 The 2014 sector data was not released by the time this report was published. Due to the fact that the structure of the petroleum industry has not changed a lot between 2013 and 2014, we can assume that the same will hold for 2014.
8.6
10.2
1.4
-
2.0
4.0
6.0
8.0
10.0
12.0
2012 2013 2014
Ope
ratin
g pr
ofit
(Ran
d bi
llion
)
Operating profit of SAPIAmembers
79
92
85
70
75
80
85
90
95
2012 2013 2014
Val
ue a
dd (R
and
billi
ons)
Total value add of SAPIAmembers
2%
98%
GDP of Petroleumproducts, chemicals, rubberand plasticSAPIA members %contribution to sector GDP
32
and all-encompassing measure to determine the petroleum industry’s contribution towards economic growth in South Africa.
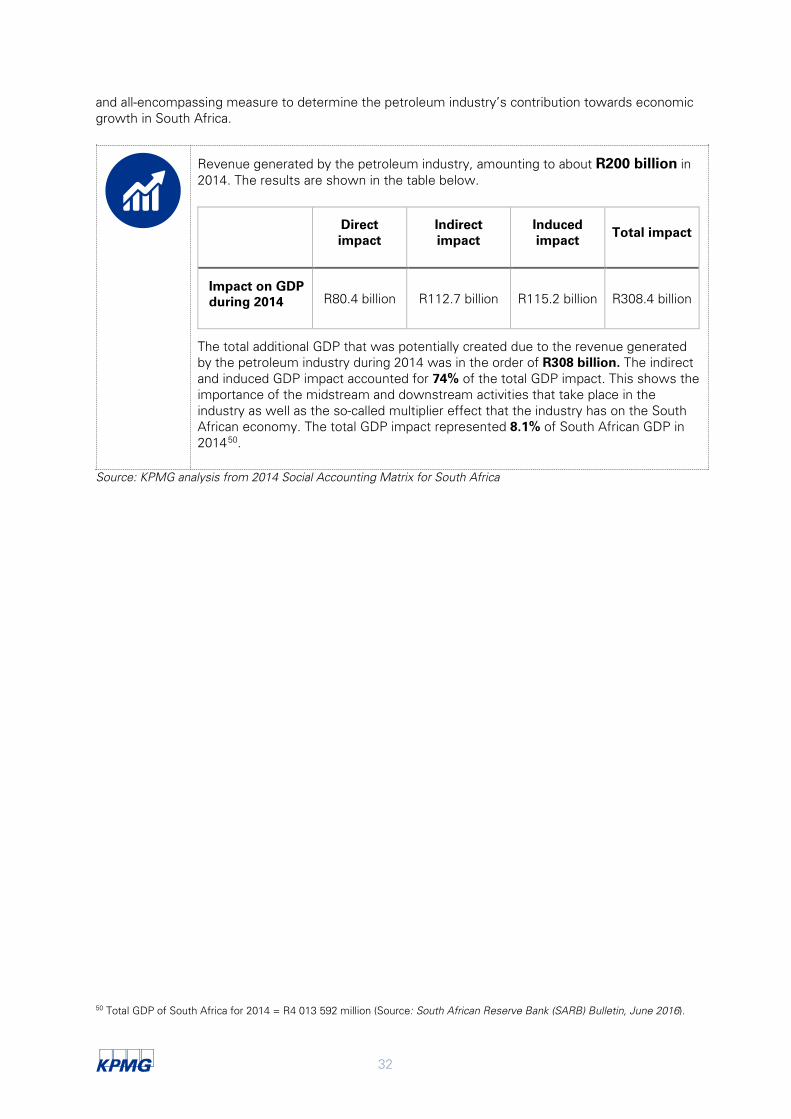
Revenue generated by the petroleum industry, amounting to about R200 billion in 2014. The results are shown in the table below.
Direct impact
Indirect impact
Induced impact
Total impact
Impact on GDP during 2014 R80.4 billion R112.7 billion R115.2 billion R308.4 billion
The total additional GDP that was potentially created due to the revenue generated by the petroleum industry during 2014 was in the order of R308 billion. The indirect and induced GDP impact accounted for 74% of the total GDP impact. This shows the importance of the midstream and downstream activities that take place in the industry as well as the so-called multiplier effect that the industry has on the South African economy. The total GDP impact represented 8.1% of South African GDP in 201450.
Source: KPMG analysis from 2014 Social Accounting Matrix for South Africa
50 Total GDP of South Africa for 2014 = R4 013 592 million (Source: South African Reserve Bank (SARB) Bulletin, June 2016).

33
4.2.2 Petroleum industry’s contribution to employment creation
The petroleum industry contributes towards promoting employment in the sector, which generates income for households, both directly and indirectly. The industry currently employ in excess of 8 700 people directly through its operations.
Between 2012 and 2013, growth in the Petroleum products, chemicals, rubber and plastic sector employment grew by 28%. However, despite only a 1% increase in jobs during 2014, it is still an important contributor to job sustaining in the economy.
During 2014, SAPIA member companies and its refineries employed in the order of 8 71951 people within its South African operations, contributing towards 42% of the formal employment in the Petroleum products, chemicals, rubber and plastic sector.
SAPIA member companies and its refineries’ labour force are skilled and semi skilled employees52. This implies that the member companies and its refineries provides better quality employment opportunities and thus higher paying salaries.
Source: StatsSA SAPIA Annual Report 2012, 2013, 2014
The petroleum industry have created and/or sustained three kinds of jobs in the South African economy. They include the direct jobs that were created because of on-going operations, the so-called indirect jobs resulting from multiplier effects of the operating expenditure and lastly the induced jobs that occur because of the payment of salaries and wages to people who are directly employed by the petroleum industry. These additional jobs, created due to the petroleum industry’s operations, are depicted below.
51 Combined workforce profile for direct employees of SAPIA member companies (Source: SAPIA, Annual Report, 2014) 52 SAPIA member companies does not employ unskilled employees
16 105
20 542 20 805
0
5 000
10 000
15 000
20 000
25 000
2012 2013 2014
Num
ber o
f em
ploy
ees
Formal employment of Petroleumproducts, chemicals, rubber andplastic sector
8 537
9 118
8 719
8 200
8 400
8 600
8 800
9 000
9 200
2012 2013 2014
Num
ber o
f em
ploy
ees
Employment of SAPIA membercompanies and its refineries
36% 35% 36%
64% 65% 64%
0%
20%
40%
60%
80%
100%
2012 2013 2014
Unskilled labour
Semi-skilled employee

34
The table below shows the impact on employment during 2014.53
Direct impact
Indirect impact
Induced impact
Total impact
Potential number of jobs sustained 80 455 291 417 378 463 750 335
The petroleum industry’s operations sustained about 750 300 jobs in South Africa during 2014, representing about 4.9%54 of the total formal employment in South Africa.
The petroleum industry had a higher impact on the skilled and semi-skilled labour force than in the unskilled labour force. Almost 64% of the jobs created fall within these two categories.
Source: KPMG analysis from 2014 Social Accounting Matrix for South Africa
4.2.3 The petroleum industry’s contribution to public finance
The petroleum industry’s contribution to public finance represents a major part of the positive impact it makes within the societies in which it operates. The industry’s contribution to public finances is both direct and indirect, through a wide range of taxes, as well as non-taxation revenue mechanisms.
During 2014, according to the SAPIA annual report, SAPIA members paid R20 million in income tax while about R72 billion was paid in the form of duties and levies. This amounts to approximately 8% of total annual government revenue, thus illustrating the importance of the sectors tax contribution to government revenue. Corporate tax payments often only account for a relatively small proportion of the total tax and other contributions paid out by SAPIA members. Members however make a significant contribution through taxes paid by their employees and suppliers as well as through taxes collected on behalf of government, which include, VAT and excise duties.
The petroleum industry also contributes indirectly to government tax revenue and stimulates economic activity throughout its operations, incorporating a wide range of producers and suppliers, as well as retailers and distributors.
53 Please note that the employment figures shown in the table only include formal sector jobs created. Jobs created in the informal sector are not included and therefore underestimates the total number of jobs that could potentially be created in the economy. 54 Total number of jobs in South Africa for 2014 was 16 018 068 (Source: StatsSA Statistical release P0211, Quarterly Labour Force Survey (QLFS), Quarter 1, 2016).
169 985
313 058
267 293
0
50 000
100 000
150 000
200 000
250 000
300 000
350 000
Impact onskilled
employment
Impact onsemi-skilledemployment
Impact onunskilled
employment
Num
ber o
f em
ploy
ees

35
During 2014, the operations of the petroleum industry in the economy increased total government revenue by an estimated R87.0 billion. This figure constitutes direct and indirect tax revenue, as well as the broader fiscal impacts generated through the linkages the petroleum industry has with other economic sectors.
Source: KPMG analysis from 2014 Social Accounting Matrix for South Africa
4.2.4 The petroleum industry’s contribution to poverty alleviation
The petroleum industry contributes towards poverty alleviation through its impact on the economic viability of low-income households. The operations of the industry generate additional income for low-income households, especially through the activation of downward streams of income sources.
The total income received by households was nearly R199.2 billion in 2014, an estimated R6.3 billion of which flowed to lower income households.
Source: KPMG analysis from 2014 Social Accounting Matrix for South Africa
During 2014, the petroleum industry’s operations contributed to a more efficient economy through the long-term nature of the economic benefit streams it created, especially in the downstream user sectors. The long-term economic benefits that could be realised are shown in the table below:
Potential long-term economic benefits
Every R1 revenue generated by the petroleum industry the economy gains an additional R1.54.
For every R1 million of revenue generated the petroleum industry sustains 4 jobs per year
For every R1 revenue generated by the petroleum industry, an additional 43 cents will flow to national government.
Future revenue generated by the petroleum industry implies poverty alleviation for South Africa’s economy. 3.2% of additional household income generated through the industry will flow to low-income households.
Source: KPMG analysis from 2014 Social Accounting Matrix for South Africa.

36
4.3 Petroleum industry’s value chain and its contribution to the economy The petroleum industry’s presence in the South African market has contributed positively towards economic development through its contribution to job creation, employing more than 300 000 employees (directly and indirectly). The industry also contributes positively to fiscal revenue and value-add in the chemicals sector through increased revenue and security of supply. In the diagram below, we provide a summary of each value chain components. In this section of the report, we consider the industry’s direct contribution to the economy through each part of its value chain; in terms of operational spend, as well as the knock on effects that have resulted from such expenditure.
0
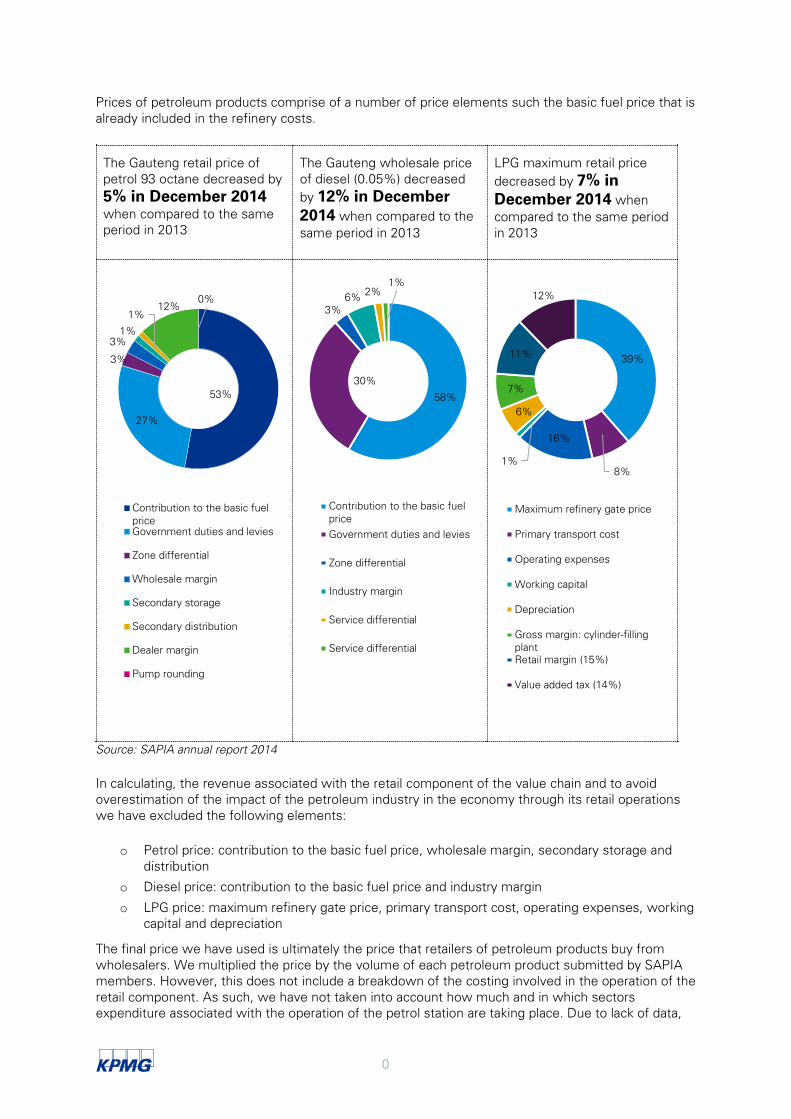
Prices of petroleum products comprise of a number of price elements such the basic fuel price that is already included in the refinery costs.
The Gauteng retail price of petrol 93 octane decreased by 5% in December 2014 when compared to the same period in 2013
The Gauteng wholesale price of diesel (0.05%) decreased by 12% in December 2014 when compared to the same period in 2013
LPG maximum retail price decreased by 7% in December 2014 when compared to the same period in 2013
Source: SAPIA annual report 2014
In calculating, the revenue associated with the retail component of the value chain and to avoid overestimation of the impact of the petroleum industry in the economy through its retail operations we have excluded the following elements:
o Petrol price: contribution to the basic fuel price, wholesale margin, secondary storage and distribution
o Diesel price: contribution to the basic fuel price and industry margin
o LPG price: maximum refinery gate price, primary transport cost, operating expenses, working capital and depreciation
The final price we have used is ultimately the price that retailers of petroleum products buy from wholesalers. We multiplied the price by the volume of each petroleum product submitted by SAPIA members. However, this does not include a breakdown of the costing involved in the operation of the retail component. As such, we have not taken into account how much and in which sectors expenditure associated with the operation of the petrol station are taking place. Due to lack of data,
53%
27%
3%
3%1%
1%12%
0%
Contribution to the basic fuelpriceGovernment duties and levies
Zone differential
Wholesale margin
Secondary storage
Secondary distribution
Dealer margin
Pump rounding
58%
30%
3%6% 2%
1%
Contribution to the basic fuelpriceGovernment duties and levies
Zone differential
Industry margin
Service differential
Service differential
39%
8%
16%
1%
6%
7%
11%
12%
Maximum refinery gate price
Primary transport cost
Operating expenses
Working capital
Depreciation
Gross margin: cylinder-fillingplantRetail margin (15%)
Value added tax (14%)

1
we have not considered the impact the consumer stores associated with the petrol station and its associated revenue and operational expenditure have on the economy. This is therefore likely to lead to a more conservative estimate of the impact of the petroleum industry’s retail activities.
In the table below, we summarise the economic impact results for each part of the petroleum industry’s value chain where both the direct and indirect economic contributions are shown for GDP, employment and tax impacts resulting from operational spend in each part of the value chain.

2
Total GDP impact
(Rand million) R61 R3 371 R212 614 R812 R2 953 R8 438 R80 219
Direct impact R9 R890 R46 648 R355 R806 R2 228 R33 501
Indirect impact R29 R559 R92 587 R90 R909 R2 842 R15 495
Induced impact R23 R1 006 R79 137 R367 R1 238 R3 368 R31 223
GDP multiplier55 1.08 1.51 1.06 1.68 1.40 1.32 0.52
Direct employment56 39 1 538 4 809 176 767 3 127 70 000
Total employment impact 198 8 093 486 478 1 650 8 631 23 705 221 580
Skilled employment 46 2 673 113 726 448 2 124 6 601 44 365
Semi-skilled employment
99 3 281 225 804 732 3 826 10 355 68 962
Unskilled employment
53 2 139 146 948 470 2 681 6 749 108 254
Employment multiplier57 3 4 2 3 4 4 4
Total Tax impact (R million) R19 R907 R61 049 R205 R823 R2 411 R21 638
Tax multiplier58 0.34 0.41 0.30 0.42 0.39 0.38 0.39
Source: KPMG analysis from 2014 Social Accounting Matrix for South Africa
55 GDP multiplier measures the effect of aggregate spending over time.In its simplest terms, the GDP multiplier measures the amount of direct, indirect and induced impacts. 56 Direct employment refers to people employed directly by a company at each component of the value chain and they are part of the company’s payroll. 57 Employment multiplier measures the amount of direct, indirect and induced jobs created (or lost) in the area. Direct jobs are related to the specific industry, while indirect jobs are those that support the industry. Induced jobs are those that are a result of direct/indirect employee’s spending money in the community. 58 Tax multiplier measures the amount of total tax which are related to the specific industry. Generally, industries with a higher multiplier are more desirable.
3
When considering the value chain components and the impact they have on the economy, activities in the refinery component of the value chain has contributed towards the largest share of the total GDP impact on the economy. The GDP impact for this component of the value chain accounted for close to 69% of the total GDP impact. These results are in line with expectations, given that a considerable proportion of the activities required to produce petroleum products takes place here.
Although refinery activities have contributed significantly to the total GDP impact, in terms of the economic multiplier effect the trend differs. While distribution activities only contribute marginally to the overall GDP impact, this component has a slightly higher GDP multiplier effect. This essentially implies that distribution activities have more midstream and downstream linkages that create more value add for the economy. This is also the case with storage and head office activities; although they did not contribute significantly to the total GDP impact, relative to refinery activities, they too produce high GDP multipliers.
In the case of employment impacts, refinery and retail activities have the largest employment impact, accounting for about 95% of the total employment impact. Similar to the GDP impact, sectors that create significant employment opportunities do not necessarily produce the highest employment multiplier effects. In this case, head office, storage and wholesale activities produce the highest employment multiplier effects, of 4 jobs per R1 million spent per value chain component. These multipliers are comparatively higher than refinery multipliers, which contribute significantly to the total number of direct, indirect and induced job opportunities created. This could be due to the nature of high quality of employment opportunities and higher salaries in parts of the value chain that produce relatively lower employment multiplier effects.
When evaluating the tax revenue impacts for each of the value chain components, the value chain component with the largest shares are refinery and retail activities. They account for approximately 95% of the total tax revenue impact, and have an overall tax revenue multiplier of 0.30 and 0.39, respectively. It is worth noting that, although the refinery and retail activities contributions to total tax revenue was significantly higher compared to the other value chain components, they did not produce the biggest multiplier effects. Distribution and head office activities produced the highest tax multiplier effects, 0.42 and 0.41 respectively, even though they contributed among the lowest amounts towards the overall tax revenue impact. This is likely due to the different taxes paid by each component of the value chain.

4
CSI contribution
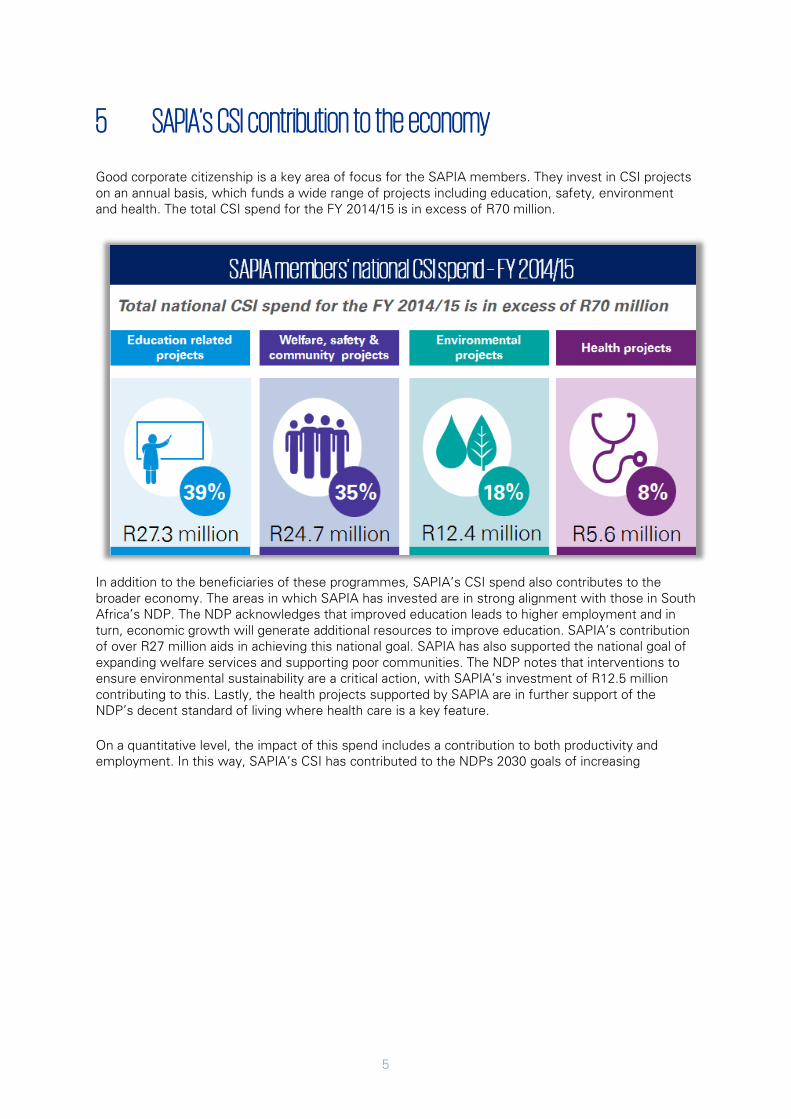
5
5 SAPIA’s CSI contribution to the economy
Good corporate citizenship is a key area of focus for the SAPIA members. They invest in CSI projects on an annual basis, which funds a wide range of projects including education, safety, environment and health. The total CSI spend for the FY 2014/15 is in excess of R70 million.
In addition to the beneficiaries of these programmes, SAPIA’s CSI spend also contributes to the broader economy. The areas in which SAPIA has invested are in strong alignment with those in South Africa’s NDP. The NDP acknowledges that improved education leads to higher employment and in turn, economic growth will generate additional resources to improve education. SAPIA’s contribution of over R27 million aids in achieving this national goal. SAPIA has also supported the national goal of expanding welfare services and supporting poor communities. The NDP notes that interventions to ensure environmental sustainability are a critical action, with SAPIA’s investment of R12.5 million contributing to this. Lastly, the health projects supported by SAPIA are in further support of the NDP’s decent standard of living where health care is a key feature.
On a quantitative level, the impact of this spend includes a contribution to both productivity and employment. In this way, SAPIA’s CSI has contributed to the NDPs 2030 goals of increasing
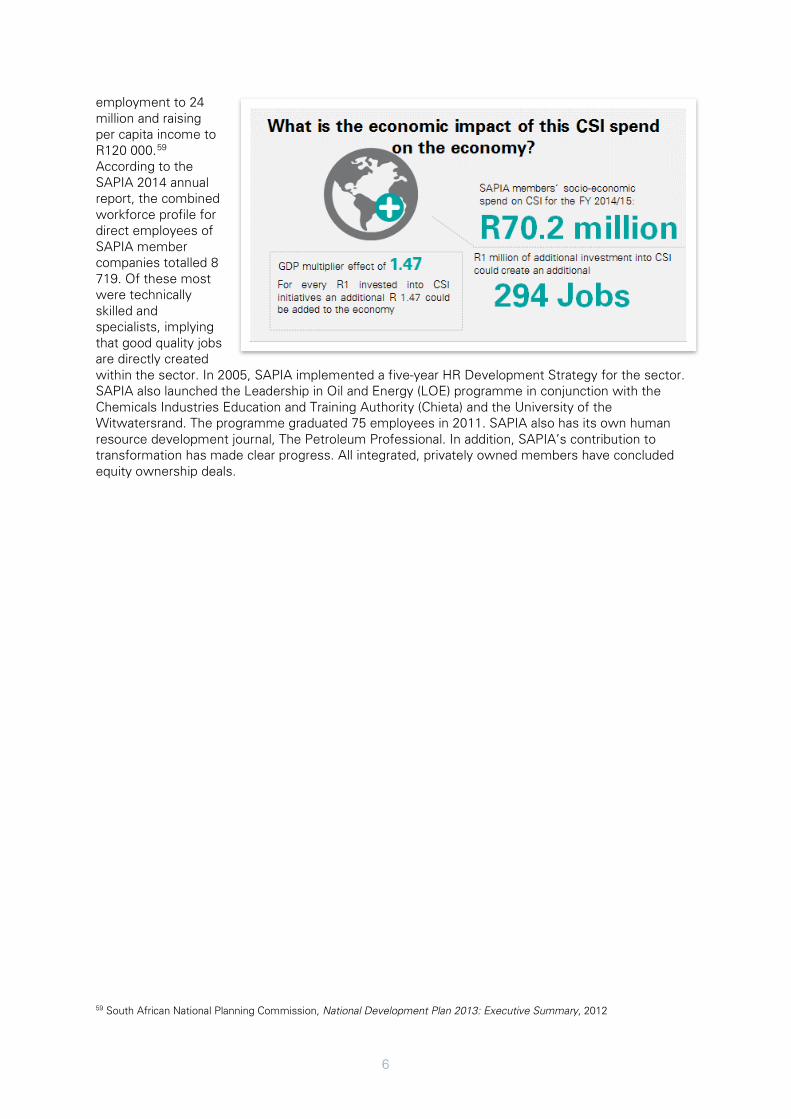
6
employment to 24 million and raising per capita income to R120 000.59 According to the SAPIA 2014 annual report, the combined workforce profile for direct employees of SAPIA member companies totalled 8 719. Of these most were technically skilled and specialists, implying that good quality jobs are directly created within the sector. In 2005, SAPIA implemented a five-year HR Development Strategy for the sector. SAPIA also launched the Leadership in Oil and Energy (LOE) programme in conjunction with the Chemicals Industries Education and Training Authority (Chieta) and the University of the Witwatersrand. The programme graduated 75 employees in 2011. SAPIA also has its own human resource development journal, The Petroleum Professional. In addition, SAPIA’s contribution to transformation has made clear progress. All integrated, privately owned members have concluded equity ownership deals.
59 South African National Planning Commission, National Development Plan 2013: Executive Summary, 2012

7
Conclusion
8
6 Conclusion
SAPIA was established in July 1994 to represent the collective interests of the South African petroleum industry60. The association is committed to representing petroleum and liquefied petroleum gas companies in South Africa. Its mandate is to promote inclusive social and economic growth by working together within the petroleum industry. Therefore, SAPIA influences the petroleum products, chemicals, rubber and plastic sector, as well as the economy in terms of the forward and backward linkages with other sectors. In this section, we highlight the petroleum industry’s contribution to overall economic development through some of their objectives and activities.
6.1 Security of supply According to the former Department of Minerals and Energy’s (DME) Energy Security Master Plan for Liquid Fuels, “Energy security means ensuring that diverse energy resources, in sustainable quantities and at affordable prices, are available to the South African economy in support of economic growth and poverty alleviation…”. Investment by SAPIA members contributes to the strategic infrastructure development of the industry, which ensures security of supply. For example, the Storage activities of SAPIA members enables effective responses to changes in supply and demand, which safeguard security of supply. In addition, the existence of these storage facilities means that storage activities in the EIA has a GDP multiplier of 1.4. This shows that Storage activities, through many economic linkages (i.e. maintenance, transport and business services), contribute an additional R1.40 to GDP for every R1 of revenue generation.
6.2 Industry transformation and skills development SAPIA 20 year: A Memorandum of Understanding between the then DME and SAPIA established the Supplier Development Agency (SDA). Its aim is to accelerate the empowerment of Historically Disadvantaged South African (HDSAs) by increasing access to procurement opportunities in the industry. The petroleum industry is characterised by an extended and complex value chain, each part of which has linkages to several sectors of the economy, e.g. building and construction, finance and insurance and transport. This increases the industry’s potential for adding economic value through supplier development and the SDA.
SAPIA launched the Leadership in Oil and Energy (LOE) programme that graduated 75 employees in 2011. SAPIA also has its own human resource development journal, The Petroleum Professional. SAPIA members’ activities increase the number of job opportunities, alleviating poverty for low-income households, but the quality of each job is also improved through such initiatives. The EIA results show that in 2014, the petroleum industry sustained 955 600 jobs, representing 6.2% of the total formal employment in South Africa.
6.3 Regulatory framework associated with the petroleum industry
High capital investments, required for upgrading technologies, are hindered by the uncertainty in South Africa’s regulatory environment. SAPIA engages regularly with regulatory bodies such as the DoE and Department of Mineral Resources on instruments like carbon tax and the 20-year liquid fuels infrastructure roadmap. This is part of their aim to create clarity and finalisation of regulation for industry players. This will further encourage investment, which can potentially increase the R15.6 billion GDP contribution by current SAPIA members’ capital investment. It is important that SAPIA
60 SAPIA, Annual Report, 2014
9
continue its engagement with DOE, National Treasury and other industry players to ensure that all its economic contributions are optimised, for the benefit of all South Africans.
6.4 The petroleum industry’s economic and social contributions to the South African economy
In the sections above, we showed that the petroleum industry’s operational activities and investments have a substantial impact on the South African economy in terms of its contribution to employment creation, to economic growth as well as government tax revenue.
The SAPIA members also contribute to society as operators and investors that support economic development, as contributors to tax revenue, and as corporate citizens. Because the members see themselves as good corporate citizens, the promotion of equality, prevention of unfair discrimination, corporate social responsibility, ethical behaviour and managing environmental impacts are central components of how they do business. The members are driven to leave a positive mark on the communities in which they operate. Being proactive and trustworthy corporate citizens and working for the common good are understood as much more than social investment, but is fundamental to the sustainability of the industry.
These impacts together with potential future impacts of the petroleum industry’s operation and investment in the South African economy are summarised in more detail below.
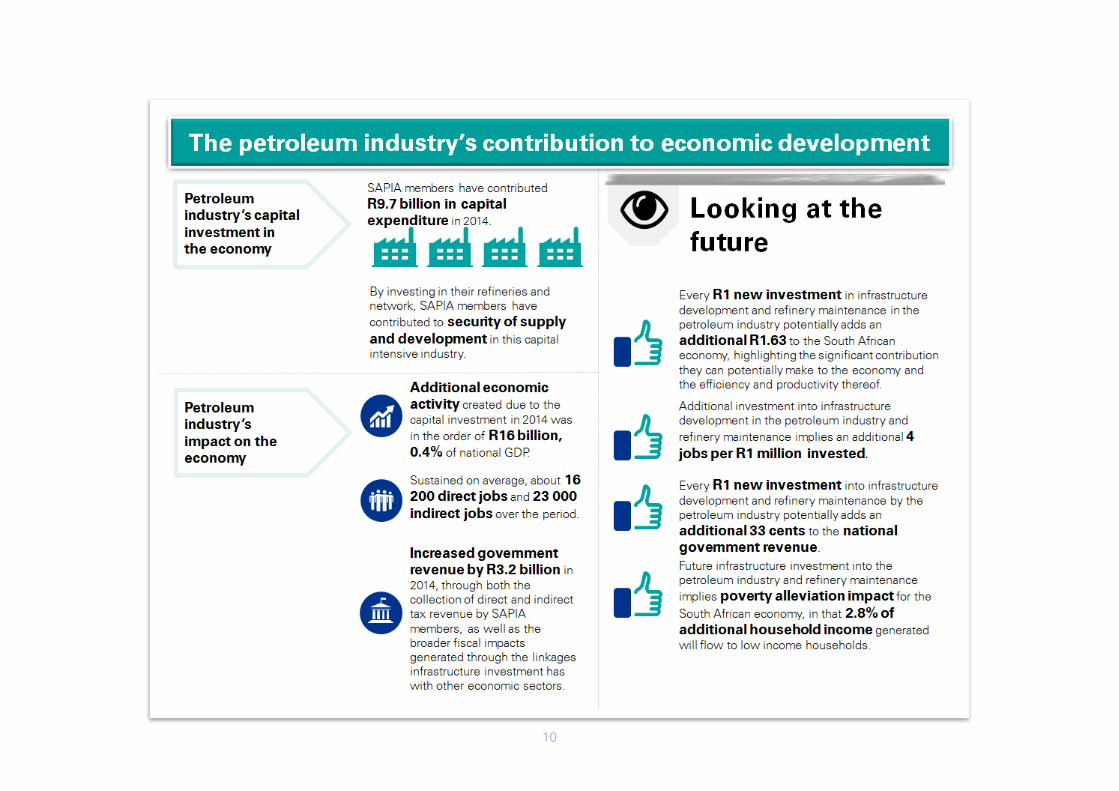
10

11

12

© 2016 KPMG Services Pty Ltd a South African company and a member firm of the KPMG network of independent member firms affiliated with KPMG International Cooperative (“KPMG International”), a Swiss entity. All rights reserved.
The information contained herein is of a general nature and is not intended to address the circumstances of any particular individual or entity. Although we endeavour to provide accurate and timely information, there can be no guarantee that such information is accurate as of the date it is received or that it will continue to be accurate in the future. No one should act on such information without appropriate professional advice after a thorough examination of the particular situation.
The KPMG name, logo and “cutting through complexity” are registered trademarks or trademarks of KPMG International Cooperative (“KPMG International”).
Contact us
Lullu Krugel Financial Risk Management Partner T +27 (0)82 712 4049 E [email protected]
Jeaunes Viljoen Financial Risk Management Senior Manager T +27 (0)82 719 3214 E [email protected]
Salome Ntsibande Financial Risk Management Manager T +27 (0)82 712 6284 E [email protected]
Misha Morar Financial Risk Management Senior Advisor T +27 (0)60 994 7767 E [email protected]
www.kpmg.com