s ignal a nd i mage p rocessing of o ptical c oherence t omography at 1310 nm w avelength f or n on...
TRANSCRIPT

Signal & Image Processing : An International Journal (SIPIJ) Vol.6, No.2, April 2015
DOI : 10.5121/sipij.2015.6205 53
SIGNAL AND IMAGE PROCESSING OF OPTICAL
COHERENCE TOMOGRAPHY AT 1310 NM
WAVELENGTH FOR NON BIOLOGICAL
SAMPLES
Yogesh Rao1#
, Hareesh Panakkal2, Nisha Sarwade
1*, Roshan
Makkar
3
1Department of Electrical Engineering, VJTI, Mumbai, India
2 Model Engineering College, Thrikkakara, India
3SAMEER, IITB Campus, Powai, Mumbai, India
ABSTRACT
OCT is a recently developed optical interferometric technique for non-invasive diagnostic medical imaging
in vivo; the most sensitive optical imaging modality.OCT finds its application in ophthalmology, blood flow
estimation and cancer diagnosis along with many non biomedical applications. The main advantage of
OCT is its high resolution which is in µm range and depth of penetration in mm range. Unlike other
techniques like X rays and CT scan, OCT does not comprise any x ray source and therefore no radiations
are involved. This research work discusses the basics of spectral domain OCT (SD-OCT), experimental
setup, data acquisition and signal processing involved in OCT systems. Simulation of OCT involving
modelling and signal processing, carried out on Lab VIEW platform has been discussed. Using the
experimental setup, some of the non biomedical samples have been scanned. The signal processing and
image processing of the scanned data was carried out in MATLAB and Lab VIEW, some of the results thus
obtained have been discussed in the end.
KEYWORDS
Image Processing, Opto electronics, Signal Processing, Topographic Imaging
1. INTRODUCTION
A lot of research is been carried out in the field of signal and biomedical optical image processing
so as to improve the existing medical techniques. As a result of this, spectral domain optical
coherence tomography (SD-OCT) was been proposed in early 2000s which could be used to
image various aspects of biological tissues. Some of these include structural information, blood
flow, polarization sensitivity, elastography, spectroscopy etc [1]. Any combination of above
imaging modes can be used to bring out specific features of biological tissues as desired [1]. OCT
is based on Michelson interferometry principle. The Michelson interferometer setup consists of a
broadband source, which is split by the 50:50 or 90:10 beam splitter along the reference arm and
the sample arm. The reference arm consists of mirror and the sample arm consists of sample to be
scanned for imaging.
The backscattered light from the sample and reference arm are collected and allowed to interfere.
The reference mirror is highly reflective and almost all the light that is incident on its surface is
reflected back. However the samples used for imaging are human tissues like retina or skin which
are highly absorptive in nature. Reflectivity of any surface is given by Fresnel’s formula.

Signal & Image Processing : An International Journal (SIPIJ) Vol.6, No.2, April 2015
54
(1)
where n1 and n2 are the refractive indices of the media and R is the reflectivity. So the back
reflection from mirror and sample needs to be collimated and made to interfere, which is then
given to detector module that comprises of spectrometer. The source, sample, reference arm and
the detector are connected to the beam splitter via optical fibers, allowing light to pass through it.
Fig.1. Optical Coherence Tomography experimental setup using Michelson Interferometer principle
Fig.1 explains the experimental setup designed to carry out OCT. The broadband source used is
super luminescent diode (EXALOS SLD source) having central wavelength 1310 nm and FWHM
spectral bandwidth of 100 nm. The source is connected to 50:50 or 90:10 coupler via circulator to
provide isolation. The coupler power is given to reference and sample arm using lens mechanism.
The lens module comprises of collimating and focusing lens having focal length of 18.4 mm and
30 mm respectively. To scan the sample, translational stages are used. The back reflections from
both arms is collected and made to interfere which is given to Ibsen Photonics ROCK NIR 900-
1700nm spectrometer. The data generated from the spectrometer is given to computer where it is
processed to get 2D or 3D images.
2. SIGNAL PROCESSING IN OCT
The OCT imaging of any sample depends upon many factors. The FWHM bandwidth of selected
source, the spectrometer resolution, type of coupler used, NA of lens, noise that gets added while
carrying out the test, all influence the resolution and imaging depth and resolution of the 2D
image.
2.1. SLD Source
Generally a broadband source is selected for OCT. Resolution of the image is governed by the
coherence length of source. If Tc is the time over which a propagating wave may be
considered coherent, then Lc (coherence length) is the distance travelled by wave in Tc amount of
time.
Lc = c * Tc (2)
Where c is the speed of light, Tc is the coherence time. Lc can also be expressed as:
Signal & Image Processing : An International Journal (SIPIJ) Vol.6, No.2, April 2015
55
(3)
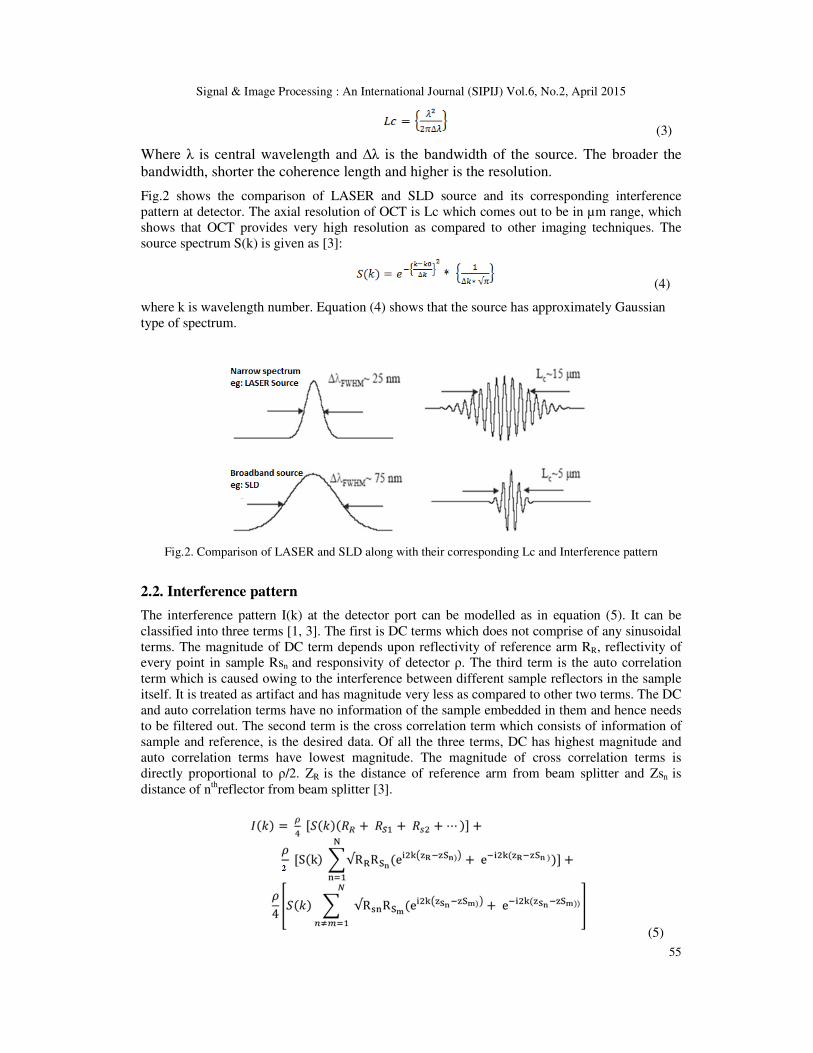
Where λ is central wavelength and ∆λ is the bandwidth of the source. The broader the
bandwidth, shorter the coherence length and higher is the resolution.
Fig.2 shows the comparison of LASER and SLD source and its corresponding interference
pattern at detector. The axial resolution of OCT is Lc which comes out to be in µm range, which
shows that OCT provides very high resolution as compared to other imaging techniques. The
source spectrum S(k) is given as [3]:
(4)
where k is wavelength number. Equation (4) shows that the source has approximately Gaussian
type of spectrum.
Fig.2. Comparison of LASER and SLD along with their corresponding Lc and Interference pattern
2.2. Interference pattern
The interference pattern I(k) at the detector port can be modelled as in equation (5). It can be
classified into three terms [1, 3]. The first is DC terms which does not comprise of any sinusoidal
terms. The magnitude of DC term depends upon reflectivity of reference arm RR, reflectivity of
every point in sample Rsn and responsivity of detector ρ. The third term is the auto correlation
term which is caused owing to the interference between different sample reflectors in the sample
itself. It is treated as artifact and has magnitude very less as compared to other two terms. The DC
and auto correlation terms have no information of the sample embedded in them and hence needs
to be filtered out. The second term is the cross correlation term which consists of information of
sample and reference, is the desired data. Of all the three terms, DC has highest magnitude and
auto correlation terms have lowest magnitude. The magnitude of cross correlation terms is
directly proportional to ρ/2. ZR is the distance of reference arm from beam splitter and Zsn is
distance of nthreflector from beam splitter [3].
(5)
Signal & Image Processing : An International Journal (SIPIJ) Vol.6, No.2, April 2015
56
2.3. Signal processing of the data acquired at detector
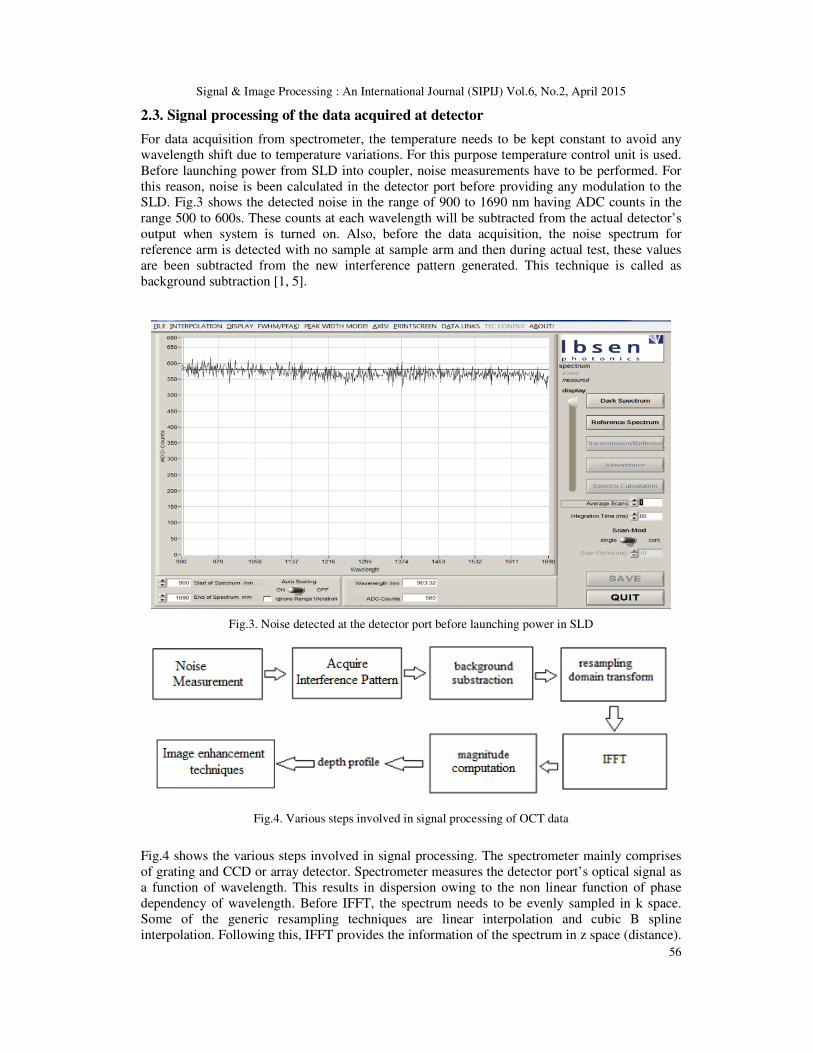
For data acquisition from spectrometer, the temperature needs to be kept constant to avoid any
wavelength shift due to temperature variations. For this purpose temperature control unit is used.
Before launching power from SLD into coupler, noise measurements have to be performed. For
this reason, noise is been calculated in the detector port before providing any modulation to the
SLD. Fig.3 shows the detected noise in the range of 900 to 1690 nm having ADC counts in the
range 500 to 600s. These counts at each wavelength will be subtracted from the actual detector’s
output when system is turned on. Also, before the data acquisition, the noise spectrum for
reference arm is detected with no sample at sample arm and then during actual test, these values
are been subtracted from the new interference pattern generated. This technique is called as
background subtraction [1, 5].
Fig.3. Noise detected at the detector port before launching power in SLD
Fig.4. Various steps involved in signal processing of OCT data
Fig.4 shows the various steps involved in signal processing. The spectrometer mainly comprises
of grating and CCD or array detector. Spectrometer measures the detector port’s optical signal as
a function of wavelength. This results in dispersion owing to the non linear function of phase
dependency of wavelength. Before IFFT, the spectrum needs to be evenly sampled in k space.
Some of the generic resampling techniques are linear interpolation and cubic B spline
interpolation. Following this, IFFT provides the information of the spectrum in z space (distance).
Signal & Image Processing : An International Journal (SIPIJ) Vol.6, No.2, April 2015
57
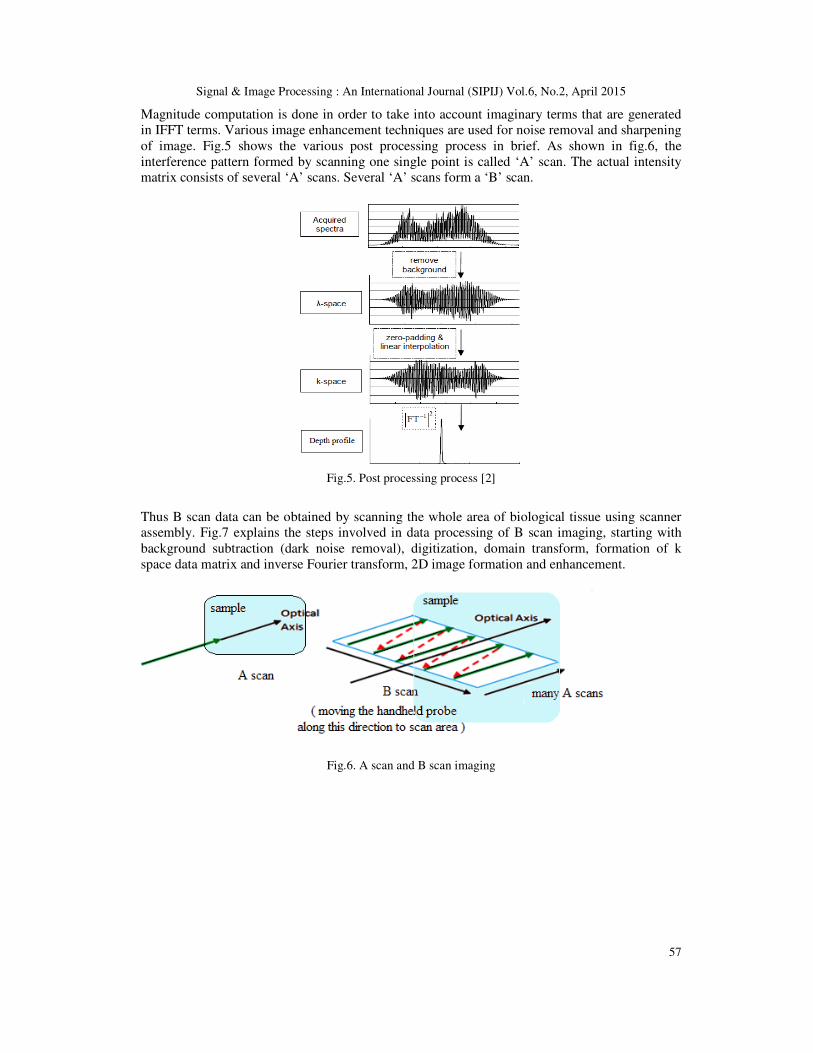
Magnitude computation is done in order to take into account imaginary terms that are generated
in IFFT terms. Various image enhancement techniques are used for noise removal and sharpening
of image. Fig.5 shows the various post processing process in brief. As shown in fig.6, the
interference pattern formed by scanning one single point is called ‘A’ scan. The actual intensity
matrix consists of several ‘A’ scans. Several ‘A’ scans form a ‘B’ scan.
Fig.5. Post processing process [2]
Thus B scan data can be obtained by scanning the whole area of biological tissue using scanner
assembly. Fig.7 explains the steps involved in data processing of B scan imaging, starting with
background subtraction (dark noise removal), digitization, domain transform, formation of k
space data matrix and inverse Fourier transform, 2D image formation and enhancement.
Fig.6. A scan and B scan imaging

Signal & Image Processing : An International Journal (SIPIJ) Vol.6, No.2, April 2015
58
Fig.7. Steps involved in B scan imaging
3. SIMULATION OF OCT ON LAB VIEW
A GUI was created using Lab VIEW to accept various hardware specifications from the user.
MATLAB scripts were used to process the information and generate the simulated images. The
various control fields were central wavelength of the source, half bandwidth of the source, power
of the source, responsivity of the detector, number of reflectors and number of samples. Using the
signal processing steps as discussed in fig.4, various graphs were plotted. These include source
spectrum, Si non linearity constant to account for non linearity in λ space, interference pattern,
IFFT after domain transform and the simulated images before and after filtering the DC and auto
correlation terms.
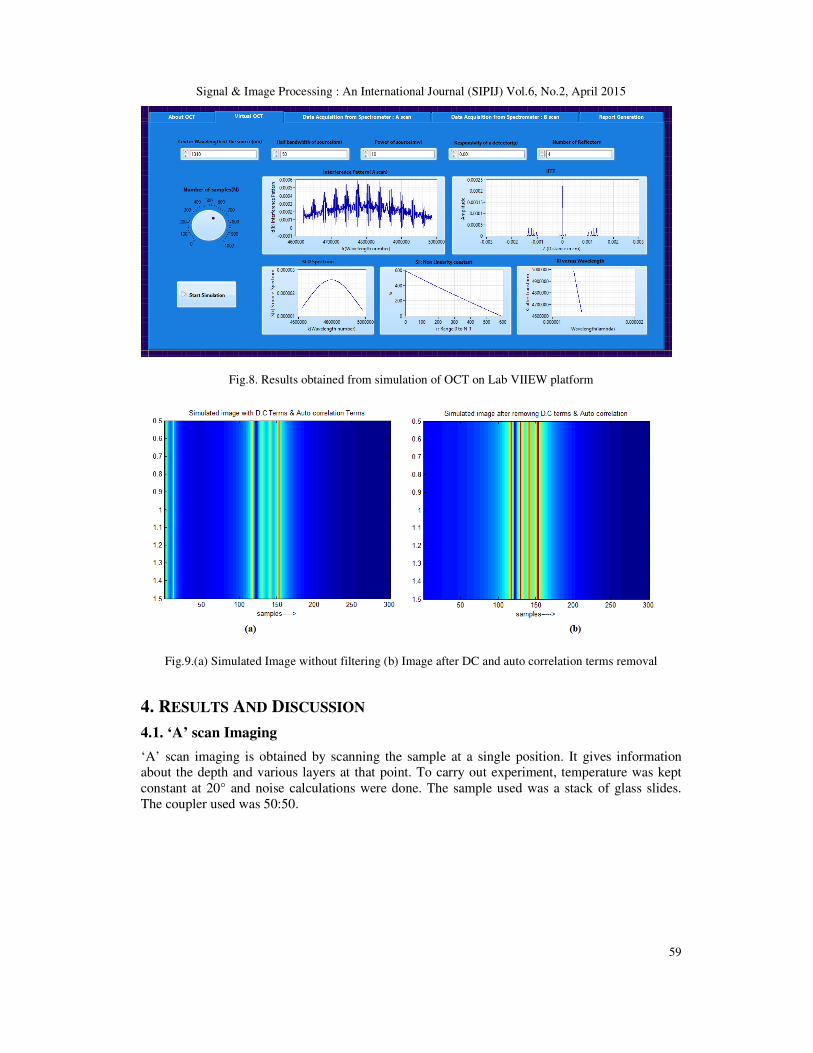
Fig.8 shows the results obtained for central wavelength of 1310 nm, half bandwidth of 50 nm,
power of source being 10 mw, number of reflectors equal to 4, responsivity of detector being
0.001 and number of samples being 600. The source spectrum is Gaussian in shape. The IFFT of
the interference pattern shows that the DC term has highest magnitude. Since the number of
reflectors were 4, four peaks are present in IFFT. The simulated image in fig.9(a) shows that 6
reflectors have been detected instead of 4. This is because; the DC and auto correlation terms
have not been filtered out. Fig.9 (b) shows the final simulated image that is generated after
filtering of data. In general, the sample consists of enumerable reflectors where every point in the
sample may correspond to a single reflector. The reflectivity of any point in sample depends upon
many factors like its RI, wavelength of light incident, absorption characteristics etc.
Signal & Image Processing : An International Journal (SIPIJ) Vol.6, No.2, April 2015
59
Fig.8. Results obtained from simulation of OCT on Lab VIIEW platform
Fig.9.(a) Simulated Image without filtering (b) Image after DC and auto correlation terms removal
4. RESULTS AND DISCUSSION
4.1. ‘A’ scan Imaging
‘A’ scan imaging is obtained by scanning the sample at a single position. It gives information
about the depth and various layers at that point. To carry out experiment, temperature was kept
constant at 20° and noise calculations were done. The sample used was a stack of glass slides.
The coupler used was 50:50.

Signal & Image Processing : An International Journal (SIPIJ) Vol.6, No.2, April 2015
60
Fig.10. A scan Imaging
Fig.10 shows the results obtained from imaging of glass slide. The interference pattern acquired
from spectrometer is been plotted. Resampling of data is performed and domain transformation
from λ to k space is done. The modified A scan (interference pattern) is been plotted. IFFT of ‘A’
scan is done to get the information in z (distance) domain. The IFFT being symmetric shows DC
and cross- correlation terms. After DC removal, the actual depth profile is been plotted.
Finally A scan image is been generated which gives information of various layers at the point that
was being scanned. The maximum depth zmax of penetration is given as [4]:
zmax = { π * N } / { 2 * ∆k } (6)
where N is the number of samples, ∆k ={ kmax – kmin }. For central wavelength of 1310 nm and
BW of 100 nm, zmax comes out to be 0.5 mm.
4.2. ‘B’ scan Imaging
'B scan imaging is obtained by scanning the sample in a particular direction so as to get
information of depth profile of the entire area. B scan imaging results in 2D images. To scan the
sample, motion stages were used. The sample used for imaging was glass slide. The interference
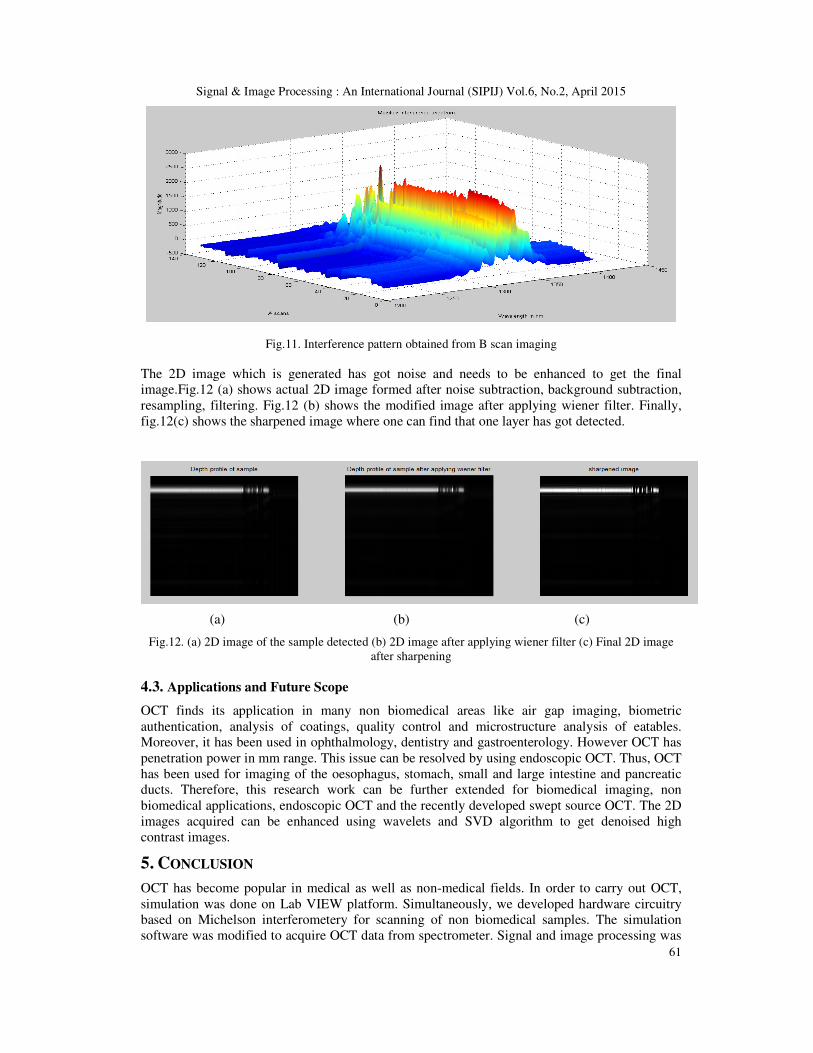
that was obtained is as shown in fig.11, where the x axis corresponds to the wavelength in nm, y
axis corresponds to the number of ‘A’ scans and z axis represents magnitude (ADC counts).
Signal & Image Processing : An International Journal (SIPIJ) Vol.6, No.2, April 2015
61
Fig.11. Interference pattern obtained from B scan imaging
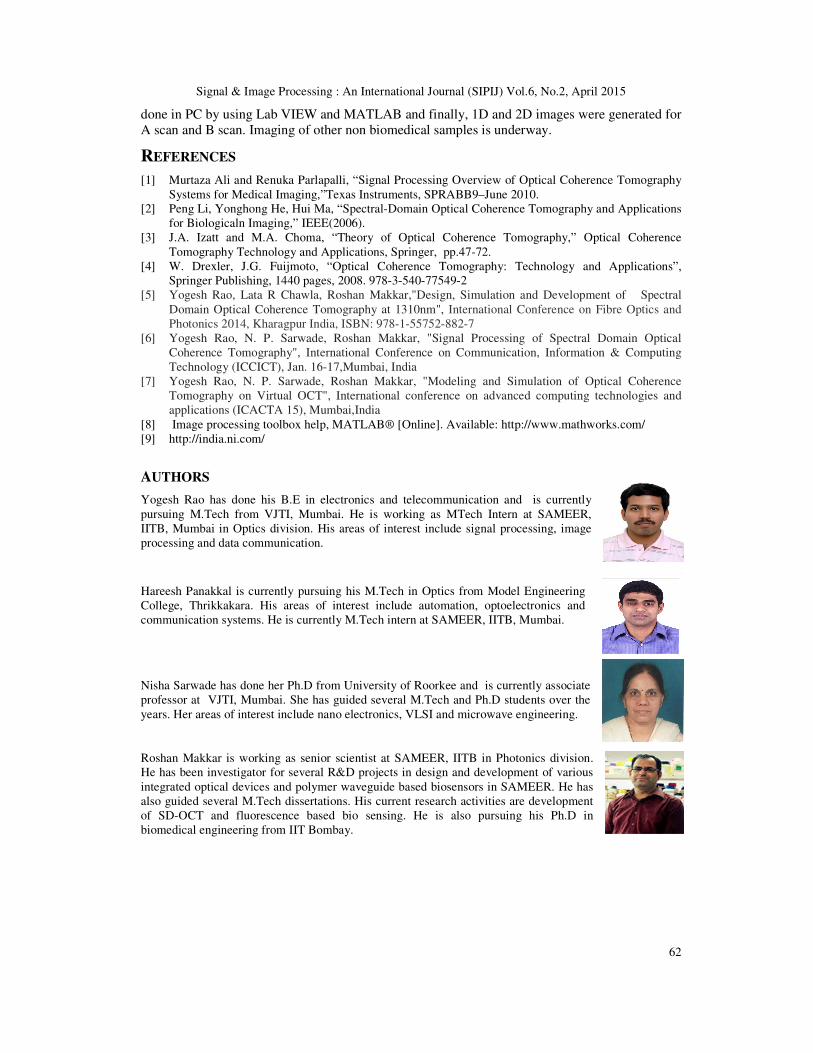
The 2D image which is generated has got noise and needs to be enhanced to get the final
image.Fig.12 (a) shows actual 2D image formed after noise subtraction, background subtraction,
resampling, filtering. Fig.12 (b) shows the modified image after applying wiener filter. Finally,
fig.12(c) shows the sharpened image where one can find that one layer has got detected.
(a) (b) (c)
Fig.12. (a) 2D image of the sample detected (b) 2D image after applying wiener filter (c) Final 2D image
after sharpening
4.3. Applications and Future Scope
OCT finds its application in many non biomedical areas like air gap imaging, biometric
authentication, analysis of coatings, quality control and microstructure analysis of eatables.
Moreover, it has been used in ophthalmology, dentistry and gastroenterology. However OCT has
penetration power in mm range. This issue can be resolved by using endoscopic OCT. Thus, OCT
has been used for imaging of the oesophagus, stomach, small and large intestine and pancreatic
ducts. Therefore, this research work can be further extended for biomedical imaging, non
biomedical applications, endoscopic OCT and the recently developed swept source OCT. The 2D
images acquired can be enhanced using wavelets and SVD algorithm to get denoised high
contrast images.
5. CONCLUSION
OCT has become popular in medical as well as non-medical fields. In order to carry out OCT,
simulation was done on Lab VIEW platform. Simultaneously, we developed hardware circuitry
based on Michelson interferometery for scanning of non biomedical samples. The simulation
software was modified to acquire OCT data from spectrometer. Signal and image processing was
Signal & Image Processing : An International Journal (SIPIJ) Vol.6, No.2, April 2015
62
done in PC by using Lab VIEW and MATLAB and finally, 1D and 2D images were generated for
A scan and B scan. Imaging of other non biomedical samples is underway.
REFERENCES
[1] Murtaza Ali and Renuka Parlapalli, “Signal Processing Overview of Optical Coherence Tomography
Systems for Medical Imaging,”Texas Instruments, SPRABB9–June 2010.
[2] Peng Li, Yonghong He, Hui Ma, “Spectral-Domain Optical Coherence Tomography and Applications
for Biologicaln Imaging,” IEEE(2006).
[3] J.A. Izatt and M.A. Choma, “Theory of Optical Coherence Tomography,” Optical Coherence
Tomography Technology and Applications, Springer, pp.47-72.
[4] W. Drexler, J.G. Fuijmoto, “Optical Coherence Tomography: Technology and Applications”,
Springer Publishing, 1440 pages, 2008. 978-3-540-77549-2
[5] Yogesh Rao, Lata R Chawla, Roshan Makkar,"Design, Simulation and Development of Spectral
Domain Optical Coherence Tomography at 1310nm", International Conference on Fibre Optics and
Photonics 2014, Kharagpur India, ISBN: 978-1-55752-882-7
[6] Yogesh Rao, N. P. Sarwade, Roshan Makkar, "Signal Processing of Spectral Domain Optical
Coherence Tomography", International Conference on Communication, Information & Computing
Technology (ICCICT), Jan. 16-17,Mumbai, India
[7] Yogesh Rao, N. P. Sarwade, Roshan Makkar, "Modeling and Simulation of Optical Coherence
Tomography on Virtual OCT", International conference on advanced computing technologies and
applications (ICACTA 15), Mumbai,India
[8] Image processing toolbox help, MATLAB® [Online]. Available: http://www.mathworks.com/
[9] http://india.ni.com/
AUTHORS
Yogesh Rao has done his B.E in electronics and telecommunication and is currently
pursuing M.Tech from VJTI, Mumbai. He is working as MTech Intern at SAMEER,
IITB, Mumbai in Optics division. His areas of interest include signal processing, image
processing and data communication.
Hareesh Panakkal is currently pursuing his M.Tech in Optics from Model Engineering
College, Thrikkakara. His areas of interest include automation, optoelectronics and
communication systems. He is currently M.Tech intern at SAMEER, IITB, Mumbai.
Nisha Sarwade has done her Ph.D from University of Roorkee and is currently associate
professor at VJTI, Mumbai. She has guided several M.Tech and Ph.D students over the
years. Her areas of interest include nano electronics, VLSI and microwave engineering.
Roshan Makkar is working as senior scientist at SAMEER, IITB in Photonics division.
He has been investigator for several R&D projects in design and development of various
integrated optical devices and polymer waveguide based biosensors in SAMEER. He has
also guided several M.Tech dissertations. His current research activities are development
of SD-OCT and fluorescence based bio sensing. He is also pursuing his Ph.D in
biomedical engineering from IIT Bombay.