s chool i mprovement g rants an overview of fiscal year (fy) 2010 1 draft
TRANSCRIPT

SCHOOL IMPROVEMENT GRANTS
An Overview of Fiscal Year (FY) 2010
1
DR
AFT

SCHOOL IMPROVEMENT GRANTS (SIG)
Lessons learned from last year Overview of FY 2010 SIG Changes to the FY 2010 Non-Regulatory
Guidance Changes to the FY 2010 SIG Application
2
DR
AFT

LESSONS LEARNED FROM LAST YEAR
o Suggestions from the NASTID Conference to improve the FY 2010 SIG competition
3
DR
AFT
SUGGESTIONS FROM THE NASTID CONFERENCE TO IMPROVE THE FY 2010
SIG COMPETITION
Do not make major changes to the policy or the new application. There are no major policy changes for the FY
2010 SIG competition. ED is allowing SEAs to retain large sections of its
application from FY 2009. Give LEAs and schools more time to
develop a competitive application and plan for implementation. The guidance and application are being released
earlier to allow LEAs and schools more time to develop a competitive application.
The pre-implementation period also gives LEAs and schools flexibility to take initial steps and prepare for the implementation of the intervention models.
4
DR
AFT

SUGGESTIONS FROM THE NASTID CONFERENCE TO IMPROVE THE FY 2010
SIG COMPETITION Provide additional technical assistance to
States throughout the application process. ED will be holding weekly “office hours” during
which States can schedule time to call in to discuss questions on the application and focus on PLA definitions and generating new lists of Tier I, Tier II, and Tier III schools.
Give additional feedback on the application review process. ED is restructuring its staffing to provide more
support and consistent feedback to SEAs during the application review process. 5
DR
AFT

SUGGESTIONS FROM THE NASTID CONFERENCE TO IMPROVE THE FY 2010
SIG COMPETITION
Share best practices of other States, especially with regard to the LEA application process and monitoring. SEAs that thought comprehensively from the
beginning of the SIG application process about how to structure their LEA competition, set clear selection and evaluation criteria, and developed monitoring protocols had success in ensuring that their SIG funds were used to serve their persistently lowest-achieving schools in LEAs with the capacity and commitment to fully and effectively implement the four required school intervention models .
Ensure collaboration and communication among staff working on the PLA definition and those working on the lists of Tier I, Tier II, and Tier III schools to ensure consistency.
6
DR
AFT

THE FY 2010 SIG COMPETITION
7
DR
AFT

OVERVIEW OF FY 2010 SIG There are no major policy changes for the FY
2010 SIG competition. There are a few changes to the FY 2010 non-
regulatory guidance addressing: Flexibility to generate new lists Pre-implementation Parent and community engagement
Modifications and new questions are noted in the non-regulatory guidance.
Most of the FY 2010 SIG application is identical to the FY 2009 application. An SEA will be required to update only those
sections that include changes from it FY 2009 application.
New section on evaluation criteria for pre-implementation and one new waiver have been added for FY 2010.
8
DR
AFT

PRE-IMPLEMENTATION
LEAs may use FY 2010 SIG funds prior to the 2011-2012 school year (pre-implementation period). Examples of how funds may be used include, but
are not limited to: holding parent and community meetings to review
school performance, discuss the new model to be implemented, and develop school improvement plans in line with the model selected;
recruiting and hiring the incoming principal, leadership team, and instructional staff;
conducting a rigorous review process to select, and then contracting with, a charter management organization, an education management organization, or an external provider;
providing professional development that will enable staff to effectively implement new or revised instructional programs that are aligned with the school’s comprehensive instructional plan and intervention model.
9
DR
AFT

PARENT AND COMMUNITY ENGAGEMENT
There is an increased emphasis in the FY 2010 guidance on consulting with families and community members during the selection, planning, and implementation of a school intervention model.
The non-regulatory guidance also emphasizes the importance of family engagement activities to support student achievement generally.
10
DR
AFT

CHANGES TO THE SIG NON-REGULATORY GUIDANCE FOR FY 2010
o Generating New Lists of Tier I, Tier II, and Tier III Schools
• Process of generating new lists• Newly eligible schools
o Allocating FY 2009 carryover and FY 2010 SIG fundso Rule of Nineo Two-Year Flexibility
11
DR
AFT

GENERATING NEW LISTS OF TIER I, TIER II, AND TIER III SCHOOLS
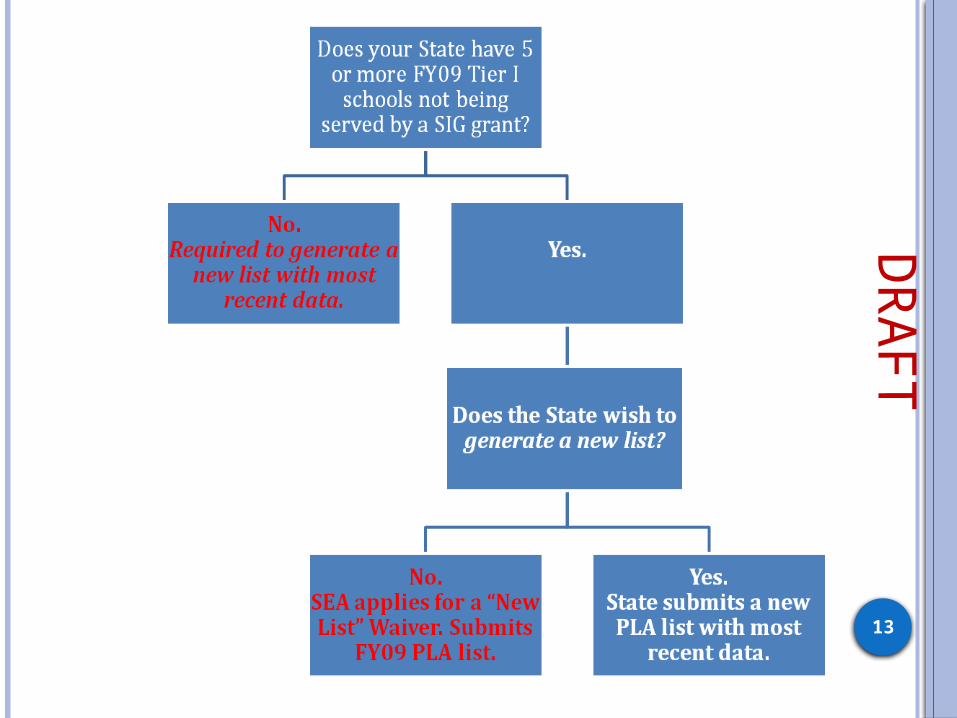
For FY 2010, each State will fall into one of three categories:
1. States that are required to generate new lists of Tier I, Tier II, and Tier III schools;
2. States that voluntarily choose to generate new lists of Tier I, Tier II, and Tier III schools; and
3. States that choose to request a waiver to retain their FY 2009 lists of schools.
All States generating new lists must use their most recent achievement and graduation data.
12
DR
AFT
13
DR
AFT

14
DR
AFT
PROCESS OF GENERATING NEW LISTS
Like last year, Tier I schools are selected from among Title I schools in improvement, corrective action, or restructuring and Tier II schools are selected from among secondary schools that are eligible for, but do not receive, Title I funds.
States are generating lists from Title I schools that are in improvement, corrective action, or restructuring.
However, States that generate new lists for the FY 2010 competition need to consider two factors when taking into account currently served Tier I, Tier II, and Tier III schools that were funded through the FY 2009 competition:1. whether such currently served schools must be included in
the pool of schools from which the SEA identifies the bottom five percent of schools (or five schools) for Tiers I and II; and
2. whether such currently served schools may be counted toward the number of Tier I and Tier II schools that the SEA must identify as the bottom five percent of schools (or five schools) for the purposes of the FY 2010 competition.
15
DR
AFT
TIER I SCHOOLS
16
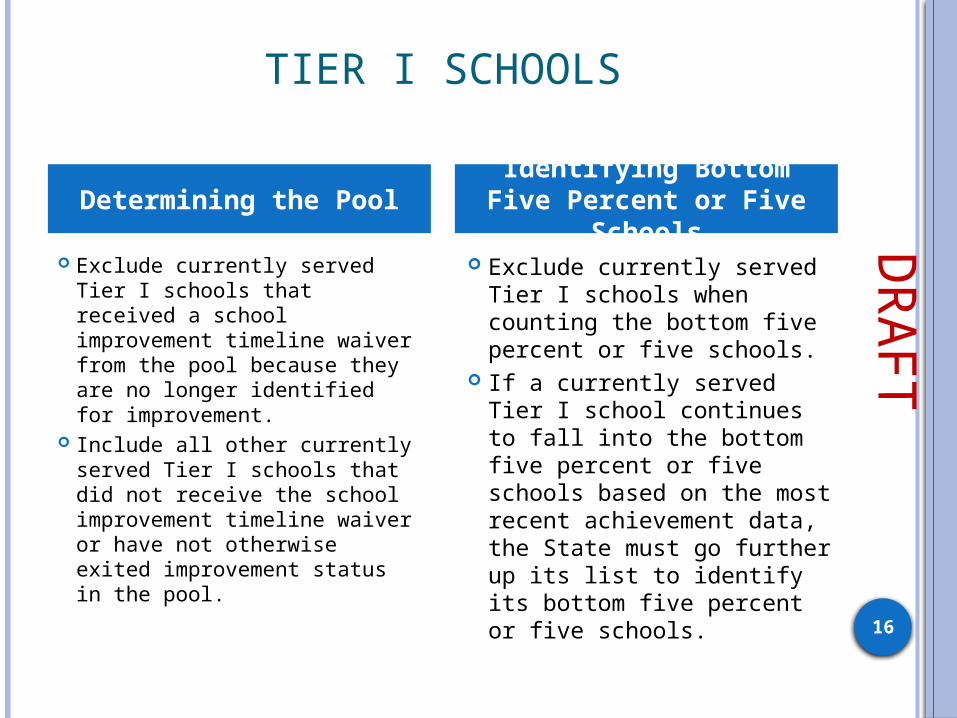
Exclude currently served Tier I schools that received a school improvement timeline waiver from the pool because they are no longer identified for improvement.
Include all other currently served Tier I schools that did not receive the school improvement timeline waiver or have not otherwise exited improvement status in the pool.
Exclude currently served Tier I schools when counting the bottom five percent or five schools.
If a currently served Tier I school continues to fall into the bottom five percent or five schools based on the most recent achievement data, the State must go further up its list to identify its bottom five percent or five schools.
Determining the PoolIdentifying Bottom Five Percent or Five Schools D
RA
FT
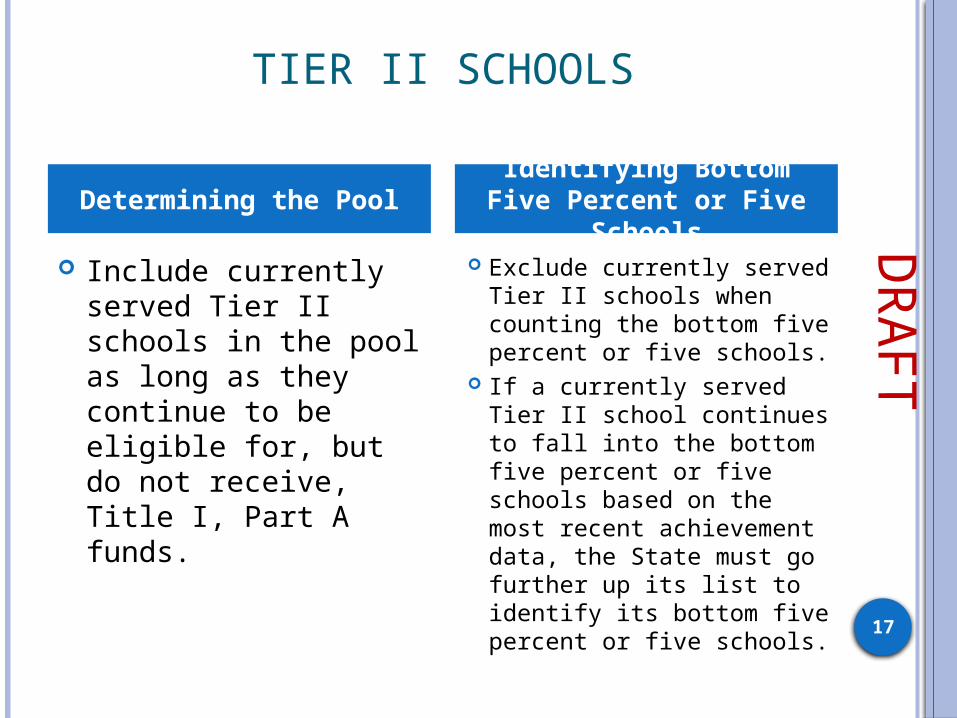
TIER II SCHOOLS
17
Include currently served Tier II schools in the pool as long as they continue to be eligible for, but do not receive, Title I, Part A funds.
Exclude currently served Tier II schools when counting the bottom five percent or five schools.
If a currently served Tier II school continues to fall into the bottom five percent or five schools based on the most recent achievement data, the State must go further up its list to identify its bottom five percent or five schools.
Determining the PoolIdentifying Bottom Five Percent or Five Schools D
RA
FT

EXAMPLE 1: IDENTIFYING BOTTOM FIVE PERCENT OR FIVE SCHOOLS
FOR FY 2010 An SEA identified 11 Tier I
schools in FY 2009 and served five of those schools (Washington, Adams, Jefferson, Madison, and Monroe) with FY 2009 SIG funds.
The SEA voluntarily chooses to generate new lists of Tier I, Tier II, and Tier III schools.
The SEA had an increase in the number of Title I schools identified for improvement, corrective action, or restructuring, and now must identify 12 schools as Tier I for FY 2010.
If any of the State’s currently served Tier I schools continue to fall into the bottom five percent based on the most recent achievement data, the SEA must go further up its list to identify a total of 12 schools that are eligible for FY 2010 SIG funds, as shown on the right.
18
Bottom 5% - List of Tier I Schools for FY 2010
12 Grant Not served in FY 200911 Johnson Not served in FY 200910 Lincoln Not served in FY 20099 Buchanan Not served in FY 20098 Pierce Not served in FY 2009
7 Fillmore Not served in FY 20096 Taylor Not served in FY 20095 Polk Not served in FY 20094 Tyler Not served in FY 20093 Harrison Not served in FY 20092 Van Buren Not served in FY 20091 Jackson Not served in FY 2009
Not Counted
Madison Served Tier I school in FY 2009; Still in bottom 5%
Not Counted
Jefferson Served Tier I school in FY 2009; Still in bottom 5%
Not Counted
Adams Served Tier I school in FY 2009; Still in bottom 5%
Not Counted
Washington Served Tier I school in FY 2009; Still in bottom 5%
Not in bottom 5%Not
CountedMonroe Served Tier I school in FY 2009
DR
AFT

CURRENTLY SERVED TIER III SCHOOLS
19
Include currently served Tier III schools in the pool from which Tier I schools are selected as long as the Tier III schools remain Title I schools in improvement, corrective action, or restructuring.
Include currently served Tier III schools in the pool from which Tier II schools are selected if the Tier III school is a secondary school that is no longer receiving Title I funds, but remains eligible to receive Title I funds.
An SEA may count a currently served Tier III school toward the number of Tier I and Tier II schools that the SEA must identify in the bottom five percent or five schools for the purposes of the FY 2010 SIG competition if the currently served Tier III school falls within the bottom five percent (or five) schools in the pool of schools for Tier I or Tier II.
Determining the PoolsIdentifying Bottom Five Percent or Five Schools D
RA
FT

Currently served Tier III schools identified in the bottom five percent or five schools in FY 2010 can only be served as a Tier I or Tier II school. It cannot continue to receive SIG funds as a Tier III school beyond the 2010–2011 school year.
If the LEA in which such a school is located wishes to continue receiving SIG funds for that school, it must apply for SIG funds through the FY 2010 competition to serve the school as a Tier I or Tier II school, as appropriate.
Exception: A Tier III school that is using SIG funds to implement one of the school intervention models beginning in the 2010–2011 school year may continue to receive FY 2009 SIG funds over the full three years of its grant to support that implementation.
20
DR
AFT

EXAMPLE 2: IDENTIFYING BOTTOM FIVE PERCENT OR FIVE SCHOOLS FOR FY
2010 An SEA identified six Tier I
schools in FY 2009 and served all six of those schools (Cedar, Dogwood, Evergreen, Maple, Oak, and Pine) with FY 2009 SIG funds. The SEA also served two Tier III schools (Birch and Cherry).
The SEA must generate new lists of Tier I, Tier II, and Tier III schools because it has less than five unserved Tier I schools.
After examining its pool of schools, the SEA determines it must identify six schools as Tier I for FY 2010.
If any of the State’s currently served Tier III schools fall into the bottom five percent based on the most recent achievement data, the SEA may count a currently served Tier III school toward the number of Tier I schools that the SEA must identify for the purposes of the FY 2010 SIG competition, as seen on the right.
21
Bottom 5% - List of Tier I Schools for FY 2010
6 Redwood Not served in FY 20095 Walnut Not served in FY 20094 Sycamore Not served in FY 20093 Willow Not served in FY 20092 Elm Not served in FY 20091 Birch Served Tier III school in FY 2009
Not Counted
Maple Served Tier I school in FY 2009; Still in bottom 5%
Not Counted
Evergreen Served Tier I school in FY 2009; Still in bottom 5%
Not Counted
Dogwood Served Tier I school in FY 2009; Still in bottom 5%
Not Counted
Cedar Served Tier I school in FY 2009; Still in bottom 5%
Not in bottom 5%Not
CountedOak Served Tier I school in FY 2009
Not Counted
Pine Served Tier I school in FY 2009
Not Counted
Cherry Served Tier III school in FY 2009
DR
AFT

QUESTIONS TO ASK WHEN GENERATING NEW LIST OF TIER I
SCHOOLS1. Did the State accurately determine the pool of
schools from which the bottom five percent (or five schools) is calculated?
Are all Title I schools in improvement, corrective action, and restructuring included?
Are currently served Tier I schools with school improvement timeline waivers excluded?
Are currently served Tier III schools that remain Title I schools in improvement, corrective action, or restructuring included?
If the State wanted to exclude schools with an assessed student population of less than __ students from its pool, did the State apply for an n-size waiver?
2. Did the State accurately identify the lowest-achieving five percent (or five schools) from the pool of schools?
Did the State exclude currently served Tier I schools from its list? Did the State include a currently served Tier III school if it falls within
the bottom five percent (or five) of the pool of schools for Tier I?
22
DR
AFT

QUESTIONS TO ASK WHEN GENERATING NEW LIST OF TIER II
SCHOOLS1. Did the State accurately determine the pool of schools
from which the bottom five percent (or five schools) is calculated?
Are all secondary schools that are eligible for, but not receiving, Title I funds included?
Are currently served Tier II schools included? If the State wanted to exclude schools with an assessed student
population of less than __ students from its pool, did the State apply for an n-size waiver?
If a State wanted to include secondary schools that have not made adequate yearly progress (AYP) for at least two consecutive years or are in the State’s lowest quintile of performance based on proficiency rates on the State’s assessments in reading/language arts and mathematics combined in its pool, did the State apply for a Tier II waiver?
2. Did the State accurately identify the lowest-achieving five percent (or five schools) from the pool of schools?
Did the State exclude currently served Tier II schools from its list? Did the State include a currently served Tier III school if it falls within the
bottom five percent (or five) of the pool of schools for Tier II?
23
DR
AFT

ALLOCATING FY 2009 CARRYOVER AND FY 2010 SIG FUNDS:
IMPLEMENTATION In the FY 2009 competition, SEAs generally provided a
full three years of funding from their SIG allocations to each LEA receiving a SIG award (i.e., SEAs “frontloaded” their SIG awards).
For the FY 2010 SIG competition, in order to maximize the number of Tier I and Tier II schools their LEAs can serve while enabling schools to implement models over three years: SEAs should “frontload” FY 2009 SIG carryover funds to
make three-year awards to LEAs. SEAs should use FY 2010 funds to award only the first-
year awards of a three-year SIG grant, with continuation awards in years two and three coming from subsequent SIG appropriations.
If SEAs use FY 2009 carryover funds to make the first year of three-year awards, in most cases there would not be sufficient funds to make continuation awards in subsequent fiscal years.
24
DR
AFT

MAXIMIZING THE NUMBER OF SCHOOLS SERVEDEXAMPLE -- A STATE HAS $36 MILLION IN FY 2009 CARRYOVER SIG FUNDS AND $21 MILLION IN FY 2010 FUNDS
If a State awards each school implementing a school intervention model an average of $1 million per year over three years, the SEA would be able to fund 12 schools with FY 2009 carryover funds (i.e., the $36 million would cover all three years of funding for those 12 schools).
Additionally the State could serve 21 schools with FY 2010 funds (i.e., the $21 million would cover the first year of funding for each of those schools, and the second and third years would be funded through continuation grants from subsequent SIG appropriations).
Thus, the State would be able to support interventions in a total of 33 schools.
If a State awards each school implementing a school intervention model an average of $1 million per year over three years and elected to frontload all funds available for its FY 2010 SIG competition (FY 2009 carryover funds and its FY 2010 allocation), it would have to divide $57 million by $3 million per school over three years.
Thus, the State would be able to fund interventions in only 19 schools.
Frontloading Only FY 2009 Carryover Funds
Frontloading All Funds
25
DR
AFT

RULE OF NINE An LEA with nine or more Tier I and Tier II
schools, including both schools that are being served with FY 2009 SIG funds and schools that are eligible to receive FY 2010 SIG funds, may not implement the transformation model in more than 50 percent of those schools.
Example 1: For FY 2009, an LEA has seven Tier I schools and two Tier II schools for a total of nine Tier I and Tier II schools. Using FY 2009 SIG funds, it implemented the transformation model in four of those schools. For FY 2010, the LEA has two additional Tier I schools and two additional Tier II schools for a total of 13 Tier I and Tier II schools.
This means the LEA may implement the transformation model in a total of six schools, or two schools in addition to those that are being served with FY 2009 funds.
26
DR
AFT

RULE OF NINE Example 2: In FY 2009, an LEA had four Tier I schools
and four Tier II schools, so it was not affected by the rule of nine (because it only had eight Tier I and Tier II schools). Using FY 2009 SIG funds, it implemented the transformation model in all four Tier I schools and two Tier II schools. For FY 2010, the LEA has three additional schools identified as Tier I, so it now has a total of 11 Tier I and Tier II schools, which means the rule of nine would apply. As a result, it may implement the transformation model in only five of its schools.
Under these circumstances, the LEA would not be required to stop implementing the transformation model in one of its schools, but it would not be permitted to implement the transformation model in any additional Tier I or Tier II schools that it seeks to serve.
27
DR
AFT

TWO-YEAR FLEXIBILITY An SEA may award SIG funds to an LEA for a
Tier I or Tier II school that has implemented, in whole or in part, a turnaround model, restart model, or transformation model within the last two years so that the LEA and school can continue or complete the intervention being implemented.
For FY 2010, the earliest an LEA could have begun to implement one of the school intervention models including the replacement of a principal or school staff is the start of the 2008-2009 school year.
This means, for example, that an LEA or school implementing the turnaround or transformation model in the 2011-2012 school year must replace a principal hired prior to the 2008-2009 school year.
28
DR
AFT

CHANGES TO THE FY 2010 APPLICATION
29
DR
AFT
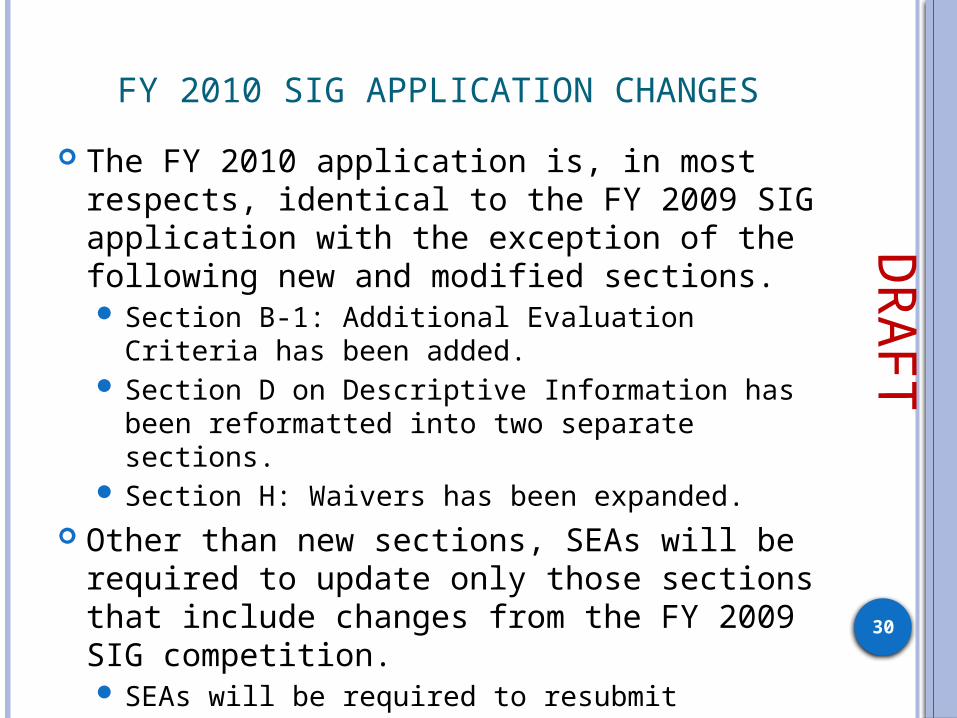
FY 2010 SIG APPLICATION CHANGES
The FY 2010 application is, in most respects, identical to the FY 2009 SIG application with the exception of the following new and modified sections. Section B-1: Additional Evaluation Criteria has
been added. Section D on Descriptive Information has been
reformatted into two separate sections. Section H: Waivers has been expanded.
Other than new sections, SEAs will be required to update only those sections that include changes from the FY 2009 SIG competition. SEAs will be required to resubmit sections of
their FY 2009 applications that contain no changes for the FY 2010 competition.
A checklist has been added to provide a roadmap for completing the FY 2010 application.
30
DR
AFT

UPDATING ONLY SECTIONS THAT INCLUDE CHANGES FROM THE FY
2009 APPLICATION
The Department expects that most SEAs will be able to retain Section B on Evaluation Criteria, Section C on Capacity, and Section D (parts 2-8) on Descriptive Information, sections that make up the bulk of the SIG application. An SEA has the option to update any of the material in these sections if it so desires.
However, we recommend that States review all sections of the FY 2010 application to ensure that sections that are not changed align with any revisions made in updated sections.
31
DR
AFT

FY 2010 SIG APPLICATION FORMATTING
SEAs should note that they will only be able to insert information in designated spaces (form fields) in the application because of formatting restrictions. Clicking on a section of the application that is restricted will automatically jump the cursor to the next form field which may cause users to skip over information in the application. Users may avoid this issue by using the scroll bar to review the application. However, due to these restrictions, the Department recommends that SEAs print a copy of the application and review it in its entirety before filling out the form.
32
DR
AFT

DR
AFT
33

NEW SECTION B-1:EVALUATION CRITERIA ON
PRE-IMPLEMENTATION
34
DR
AFT

REFORMATTED SECTION D ON DESCRIPTIVE INFORMATION
35
DR
AFT

REFORMATTED SECTION D ON DESCRIPTIVE INFORMATION
36
DR
AFT

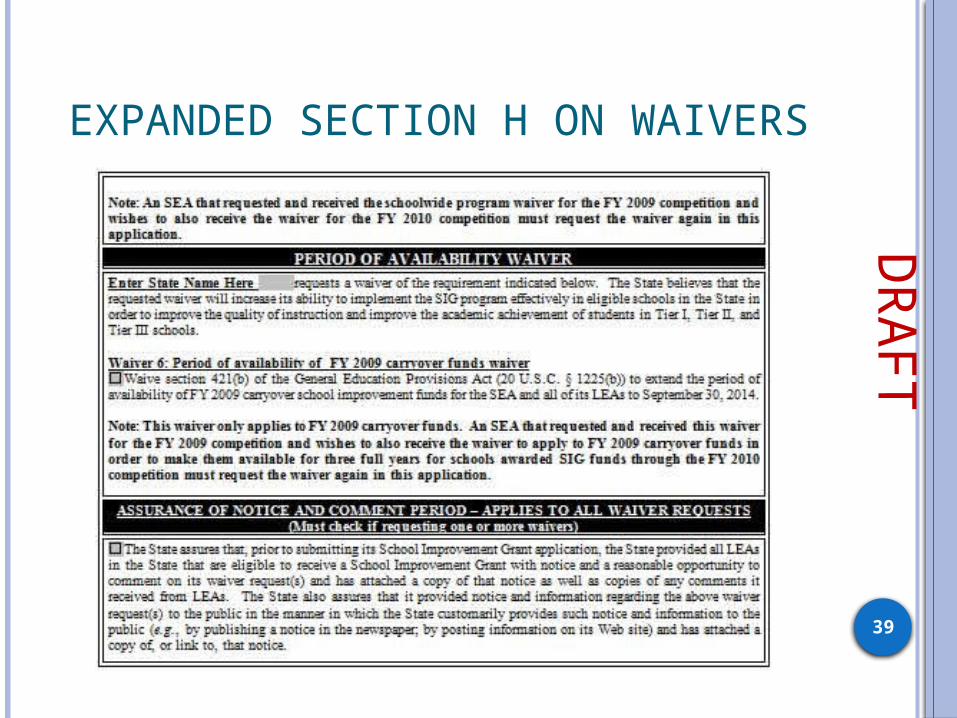
EXPANDED SECTION H ON WAIVERS
37
DR
AFT

EXPANDED SECTION H ON WAIVERS
38
DR
AFT
EXPANDED SECTION H ON WAIVERS
39
DR
AFT

WAIVERS INCLUDED IN THE FY 2010 SIG APPLICATION
o Tier II waiver o Offered during the FY 2009 competition, but was not
included in last year’s application.
o n-size waivero Offered during the FY 2009 competition, but was not
included in last year’s application.
o New list waiver (New waiver for FY 2010)o This waiver is only available to States that have five or
more unserved schools remaining on their FY 2009 Tier I lists.
o School improvement timeline waivero Schoolwide program waivero Period of availability of FY 2009 carryover
funds waiver
40
DR
AFT

SIG CHECKLIST
41
DR
AFT

ADDITIONAL INFORMATION
http://www.ed.gov/programs/sif/index.html FY 2010 SIG Non-Regulatory Guidance &
Application Final Requirements Approved SEA Applications
42
DR
AFT