s an ra l ro ad n e t wo rk m a n a g em en t syst em …
TRANSCRIPT

SANRAL ROAD NETWORK
MANAGEMENT SYSTEM
1
By Dumi Nkabinde
30 August 2019
PRESENTATION OUTLINE
• RSA Roads, Why care for the asset
• SANRAL Network Condition
• Road Asset Management System by SANRAL
• SANRAL Budget / Projects
• Future Transport
2

3

Authority Paved Gravel Total
SANRAL 22 214 0 22 214
Provinces - 9 46 548 226 273 272 821
Metros - 8 51 682 14 461 66 143
Municipalities 37 680 219 223 256 903
Total 158 124 459 957 618 081
Un-Proclaimed (Estimate) 131 919 131 919
Estimated Total 158 124 591 876 750 000
SA ROAD NETWORK - 2018
Un-Proclaimed Roads = Public roads not formally gazetted by any Authority
4

Freight flow on road and rail (10th State of Logistics Survey 2014)
Also important to note that of the person trips recorded in National Household Travel
Survey, 2013, by transport modes are as follow:
Minibus taxi’s (41.6%)
Private Vehicles (23.4%)
Walking (18.5%) – Along road corridors
busses (10.2%)
Trains (4.4%)
Other (1.9%)
2017 figures indicated similar trend.
Roads account for 87.9% of Freight and 93.7% of Person Trips
Mode Choice Factor Percentage
Travel time 32.6
Travel Cost 26.1
Flexibility 9.2
Other 32.1
SOUTH AFRICAN ROAD USE 5
6
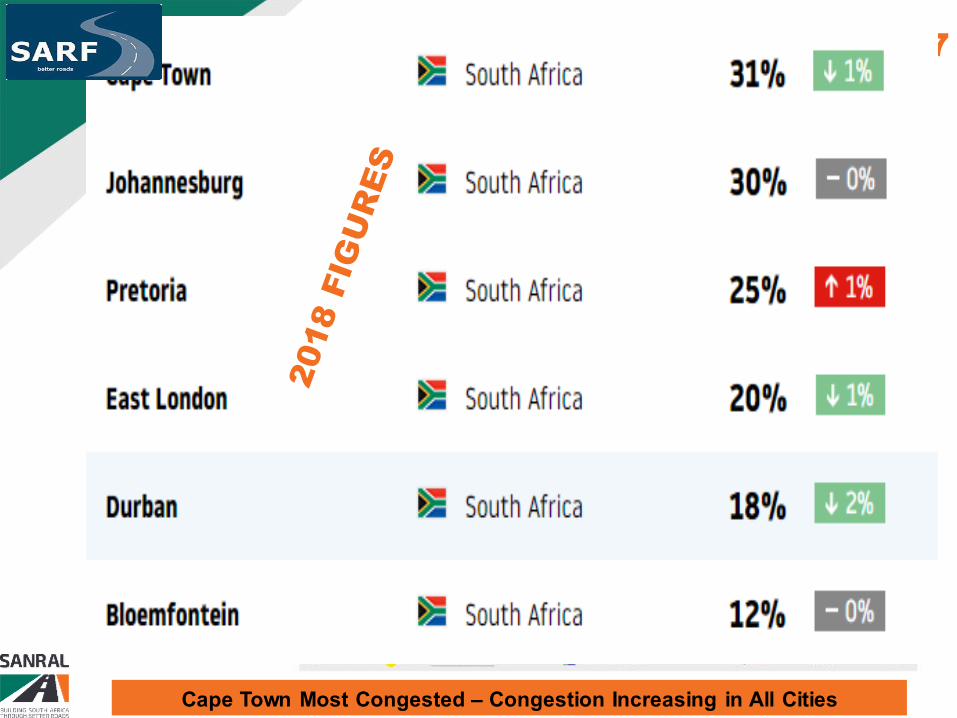
SA ROAD CONGESTION - 2017
Cape Town Most Congested – Congestion Increasing in All Cities
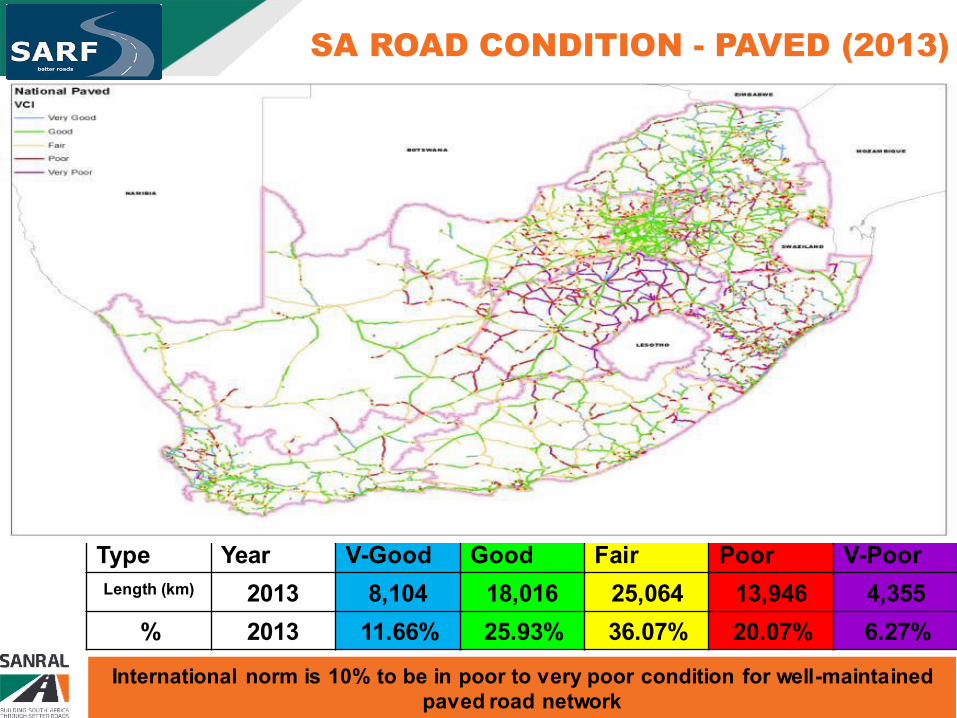
SA ROAD CONDITION - PAVED (2013)
Type Year V-Good Good Fair Poor V-Poor
Length (km) 2013 8,104 18,016 25,064 13,946 4,355
% 2013 11.66% 25.93% 36.07% 20.07% 6.27%
International norm is 10% to be in poor to very poor condition for well-maintained paved road network
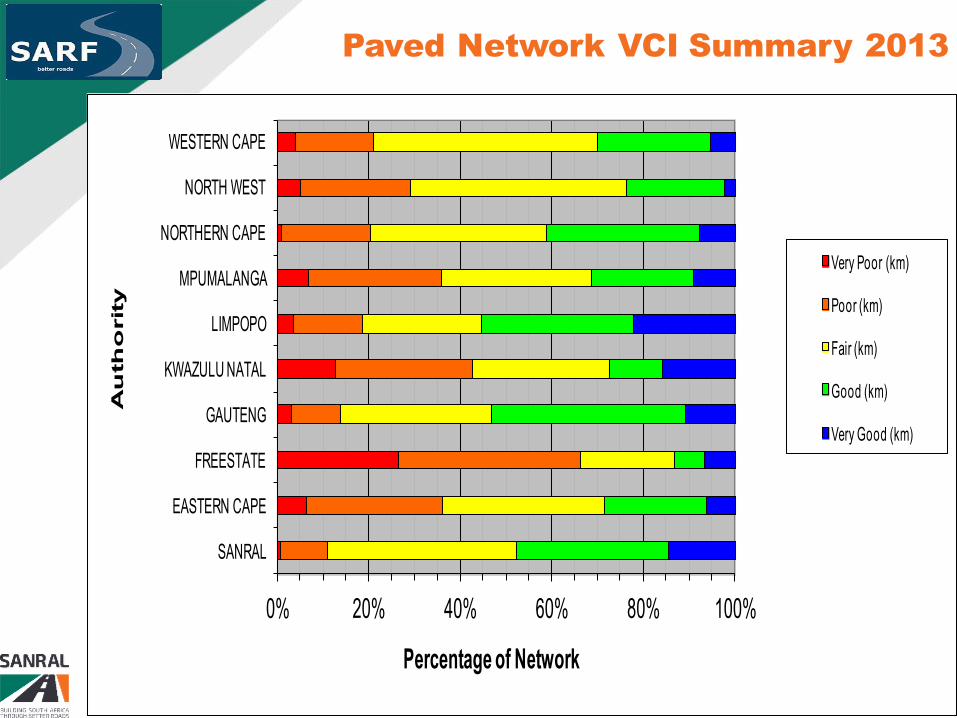
Paved Network VCI Summary 2013
0% 20% 40% 60% 80% 100%
SANRAL
EASTERN CAPE
FREESTATE
GAUTENG
KWAZULU NATAL
LIMPOPO
MPUMALANGA
NORTHERN CAPE
NORTH WEST
WESTERN CAPE
Percentage of Network
Au
th
orit
y
Very Poor (km)
Poor (km)
Fair (km)
Good (km)
Very Good (km)
8

0
20
40
60
80
100
2008 2013 2018 2023 2028
Year
Ro
ad
Co
nd
itio
n Good
Fair
Poor
Very Poor
Preventative Maintenance Actions
No Maintenance
Moisture Ingress
(Typically Designed for Traffic Expected over 20-30 Years)
Road Deterioration due to Traffic Loading & Environment
Very Good
SOUTH AFRICAN PAVEMENT DESIGN
SA Pavement Design Requires Performance of Preventative Maintenance to achieve design life – Not Zero Maintenance Design
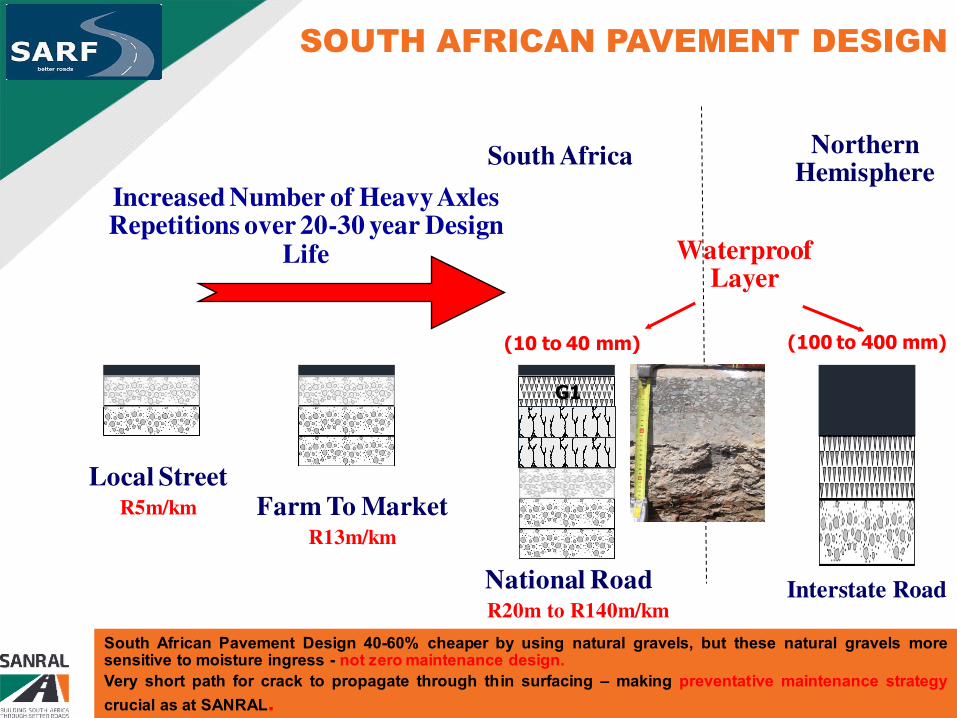
Northern Hemisphere
Waterproof Layer
Local Street R5m/km Farm To Market
R13m/km
National Road R20m to R140m/km
Increased Number of Heavy Axles Repetitions over 20-30 year Design
Life
South Africa
SOUTH AFRICAN PAVEMENT DESIGN
(10 to 40 mm) (100 to 400 mm)
G1
Interstate Road
10
South African Pavement Design 40-60% cheaper by using natural gravels, but these natural gravels more sensitive to moisture ingress - not zero maintenance design.
Very short path for crack to propagate through thin surfacing – making preventative maintenance strategy
crucial as at SANRAL.

New Road CONSTRUCTON Cost per km
Difference due to terrain (Flat, Rolling, Mountainous), Number of Interchanges, Number of Trucks, Climate, etc.

Our Pavements are seriously getting old 12
As seen 76% of paved network older than original 20 year design life, resulting in a high risk for accelerated deterioration under poor preventative maintenance regime as with most road authorities in South Africa.

Why is it Happening – Axle Loads
Decreasing
Layer
Strength
RSA designed for 8.2 ton axle load, Now its 9 ton SADC accord signed 2015 allows 10 ton. Overstressing of the weaker layers subgrades Economic Growth Just-in-time (small frequent loads) => no warehouse costs
Wearing course
Base layer
Subbase layer
Upper selected subgrade
Lower selected subgrade
In situ subgrade
Structural layers •High shear stress •“Large” strains
Subgrade •Low shear stress •Small strains
Surfacing
Half-axle tyre loads
13

Why is it Happening – Tyre Pressure
Modern truck tyres are 30% more fuel efficient, but
results in 30% + increase in damage to pavement
surface layers (especially when overloaded and
under or over inflated)
New Tyre Technology
Increased Tyre Pressure to
Reduce Contact Area
Which results in reduce Rolling
Resistance and 30% decrease in
Fuel Consumption
Decreasing
Layer
Strength
Wearing course
Base layer
Subbase layer
Upper selected subgrade
Lower selected subgrade
In situ subgrade
Structural layers •High shear stress •“Large” strains
Subgrade •Low shear stress •Small strains
Surfacing
Half-axle tyre loads
14

PORT SHEPSTONE
CHIPINGE
DURBAN
BEIRA
FRANCISTOWN
GABORONE
WINDHOEK
WALVISBAY
KEETMANSHOOP
BLOEMFONTEIN
ROUXVILLE
WEPENER
KLERKSDORP
ZEERUST JOHANNESBURG
MAPUTO
LADYSMITH
VOLKSRUST
EAST LONDON
PORT ELIZABETH MOSSEL BAY
OUDTSHOORN
CERES
CAPE TOWN
MESSINA
TZANEEN
SOMERSET WEST
PRETORIA
Wet (>1000 mm/yr)
Moderate (500 – 1000)
Dry (< 500 mm/yr)
Where is it Happening – Rainfall Zones
Wetter areas have higher moisture ingress risk if no preventative maintenance.
Wetter areas have more intense agriculture activity, more traffic. KZN traffic 16X that of NCP
15
0
20
40
60
80
100
2008 2013 2018 2023 2028
Year
Ro
ad
Co
nd
itio
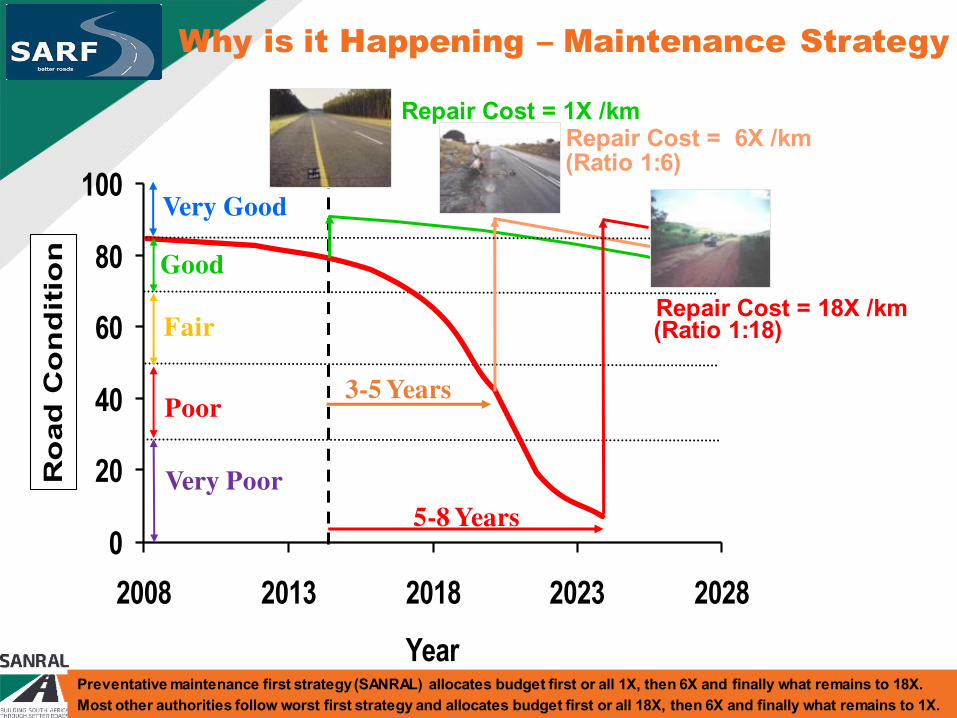
nWhy is it Happening – Maintenance Strategy
Repair Cost = 1X /km
Good
Fair
Poor
Very Poor
3-5 Years
Repair Cost = 6X /km
5-8 Years
Repair Cost = 18X /km
(Ratio 1:6)
(Ratio 1:18)
Very Good
16
Preventative maintenance first strategy (SANRAL) allocates budget first or all 1X, then 6X and finally what remains to 18X.
Most other authorities follow worst first strategy and allocates budget first or all 18X, then 6X and finally what remains to 1X.

Road User Cost is up to 90% of Total Life Cycle Transportation Cost Road User Cost – Fuel, Oil, Tyres, Maintenance, Depreciation, Accidents, Time, Cargo Damage
Distance Travel in 1 hour: Very Good = 100km vs Very Poor = 20 to 25 km
17
What Is The Price We Pay – Road User
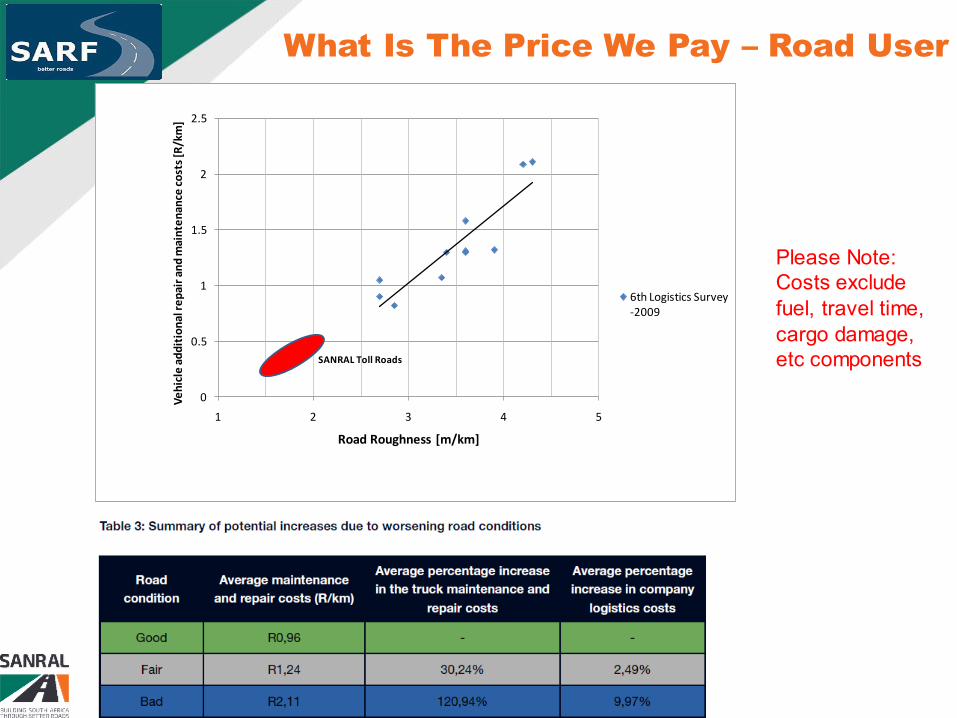
What Is The Price We Pay – Road User
Please Note: Costs exclude fuel, travel time, cargo damage, etc components
18
0
0.5
1
1.5
2
2.5
1 2 3 4 5
Ve
hic
le a
dd
itio
na
l re
pa
ir a
nd
ma
inte
na
nce
co
sts
[R/k
m]
Road Roughness [m/km]
6th Logistics Survey
-2009
SANRAL Toll Roads

19
SANRAL NETWORK CONDITION
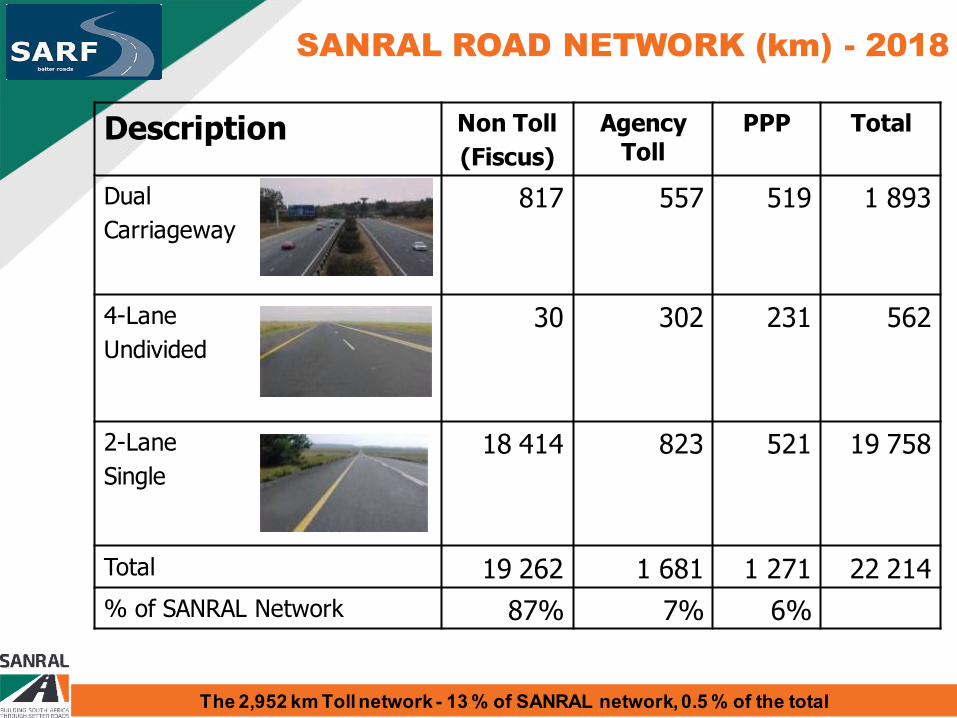
Description Non Toll
(Fiscus)
Agency Toll
PPP Total
Dual
Carriageway
817
557 519 1 893
4-Lane
Undivided
30 302 231 562
2-Lane
Single
18 414 823
521
19 758
Total 19 262 1 681 1 271 22 214
% of SANRAL Network 87% 7% 6%
SANRAL ROAD NETWORK (km) - 2018
The 2,952 km Toll network - 13 % of SANRAL network, 0.5 % of the total
20

SANRAL PAVEMENT CONDITION - 2018
Type Year V-Good Good Fair Poor V-Poor
Length (km) 2018 3,609 10,730 7,001 887 13
% 2018 16.3% 48.3% 31.5% 4.0% 0.1%
21

SANRAL PAVEMENT CONDITION TREND
Currently 900 km or 4.1% of SANRAL roads are in poor to very poor surface condition, which are well within the international norm of 10% for well-maintained network. The Average OCI of 74, is also above international norm of 70.
This is largely due to the preventative maintenance first strategy followed by SANRAL, the impact of all preventative maintenance on roads incorporated since 2012 is evident in 2016 & 2017 condition results.
The condition of remainder of strategic and primary roads under provincial administration is substantially worse (36.2% in poor to very poor), and needs to be addressed as matter of priority due to negative impact on South African economy.
22

SANRAL AVERAGE DAILY TRAFFIC
More than 70 % of SANRAL network has less than 5000 vpd – “Below Toll Threshold” – Thus reliant on National Treasury allocations. 30 % Toll viable of which 13 % is already tolled.
23

SANRAL NETWORK VEHICLE KILOMETRE TRAVEL
SANRAL network only 3.6% of length, but carries 34.1% of vehicle kilometres. Also carries 70% of the long distance road freight traffic (43% of total freight).
24
25
Road Asset
Management System
by SANRAL
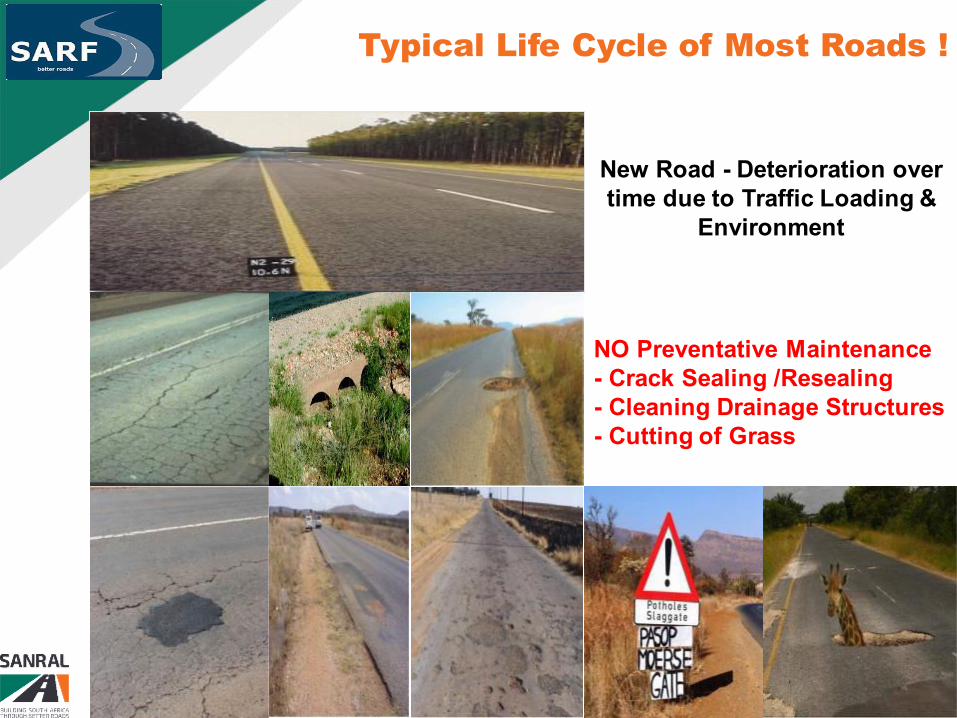
Typical Life Cycle of Most Roads !
New Road - Deterioration over time due to Traffic Loading &
Environment
NO Preventative Maintenance - Crack Sealing /Resealing - Cleaning Drainage Structures - Cutting of Grass
26

What Is The Solution – Automatic Pothole Patching?
Nooooooo…. Potholes are the symptom
not the cause…
27
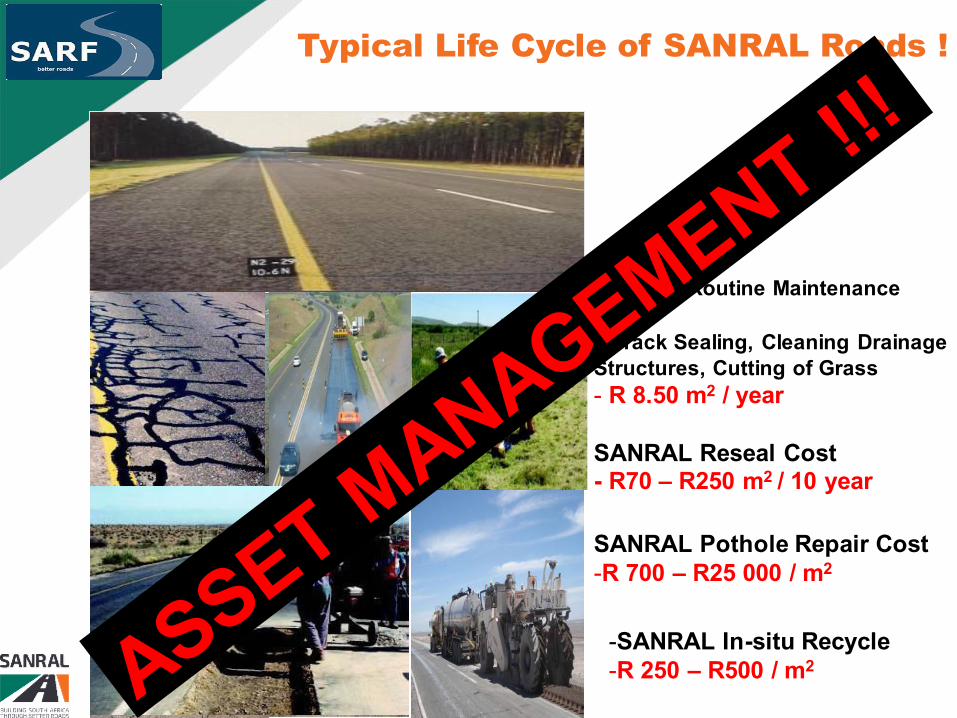
Typical Life Cycle of SANRAL Roads !
SANRAL Routine Maintenance Cost
- Crack Sealing, Cleaning Drainage
Structures, Cutting of Grass
- R 8.50 m2 / year SANRAL Reseal Cost - R70 – R250 m2 / 10 year
SANRAL Pothole Repair Cost -R 700 – R25 000 / m2
-SANRAL In-situ Recycle -R 250 – R500 / m2
28
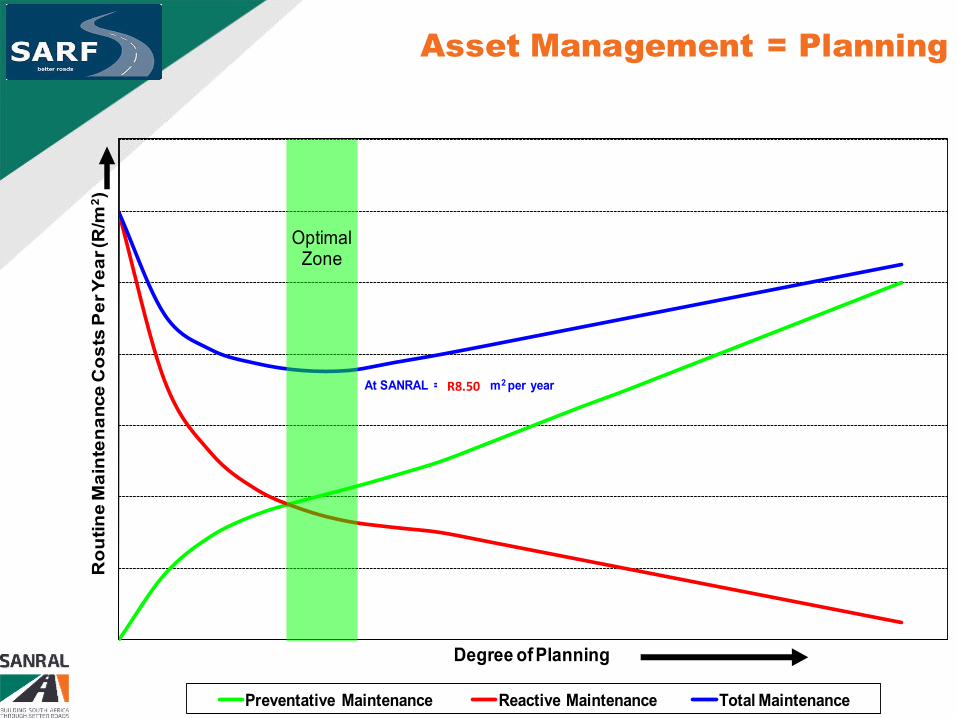
Asset Management = Planning
Ro
uti
ne
Ma
inte
na
nce
Co
sts
Pe
r Y
ea
r (R
/m2)
Degree of Planning
Preventative Maintenance Reactive Maintenance Total Maintenance
Optimal Zone
At SANRAL = R 6.50 / m2 per yearR8.50
29
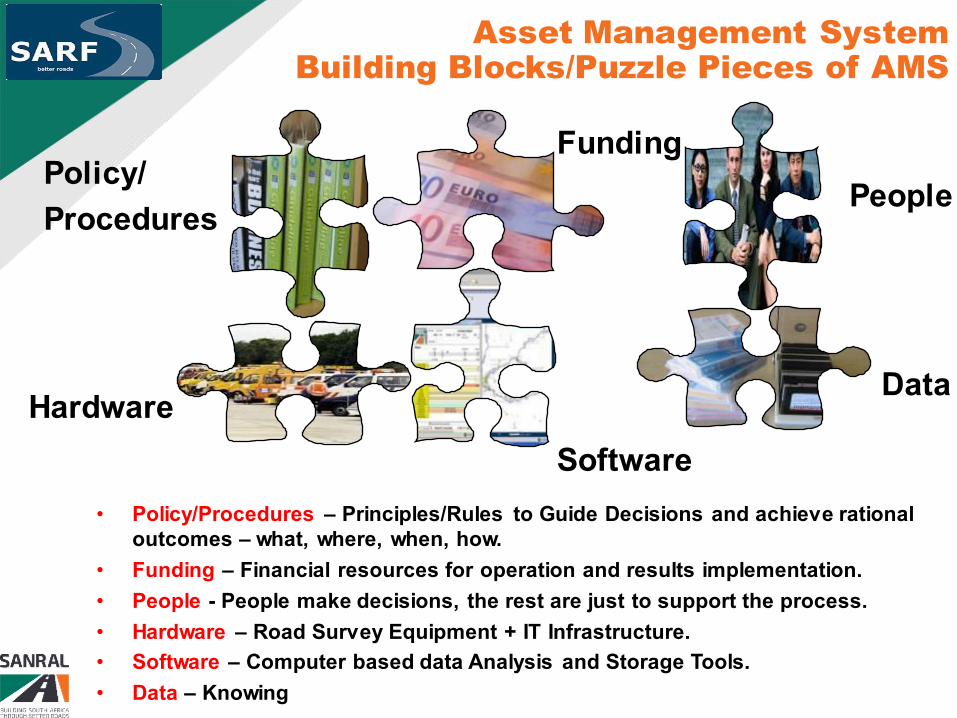
Asset Management System Building Blocks/Puzzle Pieces of AMS
• Policy/Procedures – Principles/Rules to Guide Decisions and achieve rational outcomes – what, where, when, how.
• Funding – Financial resources for operation and results implementation.
• People - People make decisions, the rest are just to support the process.
• Hardware – Road Survey Equipment + IT Infrastructure.
• Software – Computer based data Analysis and Storage Tools.
• Data – Knowing what you have, its condition and performance Trend.
Hardware
Software
Data
People
Funding Policy/
Procedures
30

• For asset management to be successful all the “pieces of the puzzle” need to be in place in a “balanced equilibrium”
• It does not help you have the most advance survey vehicle but no means
to effectively store and analyse the data, or
• Have the most sophisticate software, but the quality of your data is
suspect !
• Without Funding and People – Nothing will happen !!!
Hardware
Software
Data
People
Funding
Policy/
Procedures
Road Asset Management System - Success 31

AMS Hardware/Condition Data: SANRAL
Various condition parameters collected using SANRAL Road Survey
Vehicles: • Standardized procedures (COTO TMH 13)
• Roughness – how bumpy is the road – speed, wear, etc
• Rut Depth – water pond on surface - safety
• Macro Texture – assist vehicle tire to drain water – safety, noise
• Cracking – how much water will get in - deterioration
• Deflection – remaining structural life of pavement
• Alignment (DGPS) – Speed, Fuel Consumption, etc
• ROW Video – Road Signs, Section Measurements, etc
• Surveys at between 75 to 100 km/h
2D/3D Surface Images
32

AMS Condition Data - Bridges
• Manual Visual Assessments (DER) • Bridge condition is visually assessed through a standardized procedure (COTO
TMH 19) by certified inspectors to determine the Degree, Extent and Relevancy of each defect.
• Bridge repairs are prioritised according to severity and Relevancy of defects
• 3 to 5 year cycle
• 9874 Bridges & Major Culverts
0
33

AMS Condition Data : Traffic Data
• Traffic Event Logger (TEL) Standardized procedures (COTO TMH 3, 8, 14) Inductive Loop Based Technology (1000)
+ Piezo (200) + WIM (45)
Cluster Monitoring 1 to 3 year for Secondary Stations
34

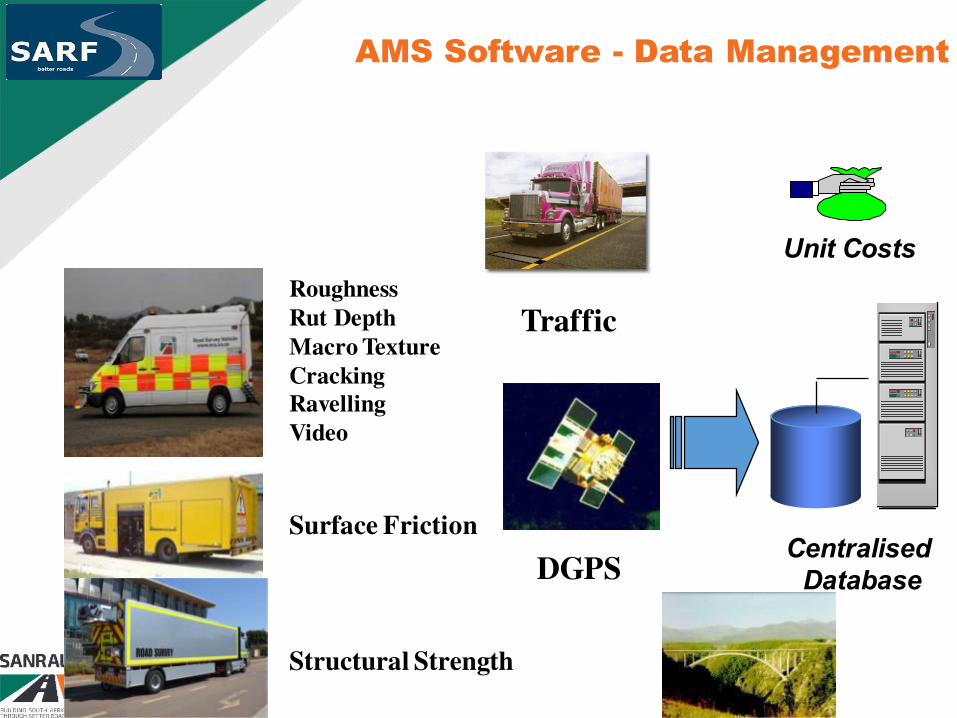
AMS Software - Data Management
Roughness
Rut Depth
Macro Texture
Cracking
Ravelling
Video
Surface Friction
Structural Strength
Centralised
Database
Traffic
Bridge
DGPS
Unit Costs
36

Economic Analysis
& Optimisation
Road Deterioration &
Maintenance Effects
Road User Effects
Centralised
Database
Dynamic
Segmentation
Uniform Sections
AMS Software - Life Cycle Modelling
Condition Surveys
37

HDM-4 Road Network Inputs
129 Variables
38

SANRAL AMS Budgeting Procedure
Instrumental Data
CBA
Priority
List
PMS RDME
RUE
Bridge Inspections
BMS BDME
RUE
CBA
Priority
List
Traffic
Projected Total Volume (Sites)
No. America Europe Asia-Pacific Government Total
Sm. Systems 12,000 6,600 2,100 3,000 23,700
Med. Systems 6,200 3100 560 950 10,810
Lg. Systems 2,650 1850 180 400 5,080
Total 20,850 11,550 2,840 4,350 39,590
Projected Total Revenue (billions of $)
No. America Europe Asia-Pacific Government Total
Sm. Systems $1.12 $0.62 $0.20 $0.28 $2.21
Med. Systems $1.59 $0.80 $0.14 $0.24 $2.78
Lg. Systems $1.80 $1.26 $0.12 $0.27 $3.46
Total $4.52 $2.67 $0.46 $0.80 $8.45
Super Project List
Budget Optimisation (forward)
Projected Total Volume (Sites)
No. America Europe Asia-Pacific Government Total
Sm. Systems 12,000 6,600 2,100 3,000 23,700
Med. Systems 6,200 3100 560 950 10,810
Lg. Systems 2,650 1850 180 400 5,080
Total 20,850 11,550 2,840 4,350 39,590
Projected Total Revenue (billions of $)
No. America Europe Asia-Pacific Government Total
Sm. Systems $1.12 $0.62 $0.20 $0.28 $2.21
Med. Systems $1.59 $0.80 $0.14 $0.24 $2.78
Lg. Systems $1.80 $1.26 $0.12 $0.27 $3.46
Total $4.52 $2.67 $0.46 $0.80 $8.45
Eastern Projected Total Volume (Sites)
No. America Europe Asia-Pacific Government Total
Sm. Systems 12,000 6,600 2,100 3,000 23,700
Med. Systems 6,200 3100 560 950 10,810
Lg. Systems 2,650 1850 180 400 5,080
Total 20,850 11,550 2,840 4,350 39,590
Projected Total Revenue (billions of $)
No. America Europe Asia-Pacific Government Total
Sm. Systems $1.12 $0.62 $0.20 $0.28 $2.21
Med. Systems $1.59 $0.80 $0.14 $0.24 $2.78
Lg. Systems $1.80 $1.26 $0.12 $0.27 $3.46
Total $4.52 $2.67 $0.46 $0.80 $8.45
Southern Projected Total Volume (Sites)
No. America Europe Asia-Pacific Government Total
Sm. Systems 12,000 6,600 2,100 3,000 23,700
Med. Systems 6,200 3100 560 950 10,810
Lg. Systems 2,650 1850 180 400 5,080
Total 20,850 11,550 2,840 4,350 39,590
Projected Total Revenue (billions of $)
No. America Europe Asia-Pacific Government Total
Sm. Systems $1.12 $0.62 $0.20 $0.28 $2.21
Med. Systems $1.59 $0.80 $0.14 $0.24 $2.78
Lg. Systems $1.80 $1.26 $0.12 $0.27 $3.46
Total $4.52 $2.67 $0.46 $0.80 $8.45
Northern Projected Total Volume (Sites)
No. America Europe Asia-Pacific Government Total
Sm. Systems 12,000 6,600 2,100 3,000 23,700
Med. Systems 6,200 3100 560 950 10,810
Lg. Systems 2,650 1850 180 400 5,080
Total 20,850 11,550 2,840 4,350 39,590
Projected Total Revenue (billions of $)
No. America Europe Asia-Pacific Government Total
Sm. Systems $1.12 $0.62 $0.20 $0.28 $2.21
Med. Systems $1.59 $0.80 $0.14 $0.24 $2.78
Lg. Systems $1.80 $1.26 $0.12 $0.27 $3.46
Total $4.52 $2.67 $0.46 $0.80 $8.45
Western
Programming Programming Programming Programming
Pavement Management System Bridge Management System
39
42
SANRAL BUDGET / PROJECTS
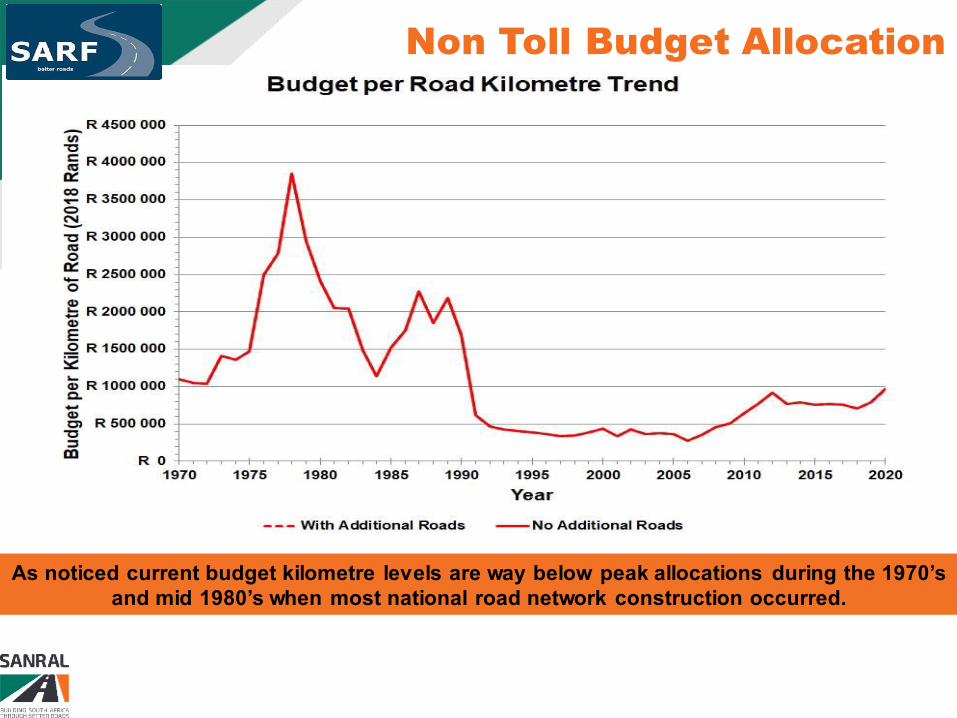
Non Toll Budget Allocation
As noticed current budget kilometre levels are way below peak allocations during the 1970’s and mid 1980’s when most national road network construction occurred.
43

Major Cost Drivers
Bitumen represents anything from 5 % to 60 % of the cost of a maintenance activity, as a result the length of road that can be maintained per year for every Rand is impacted by
these bitumen price fluctuations that is beyond control of SANRAL.
44

Major Cost Drivers
Considering the expenditure on the SANRAL network, it is obvious that the length of road that can be maintained per year for every Rand has been decreasing over time at rates much
higher than what the CPI indicates.
45
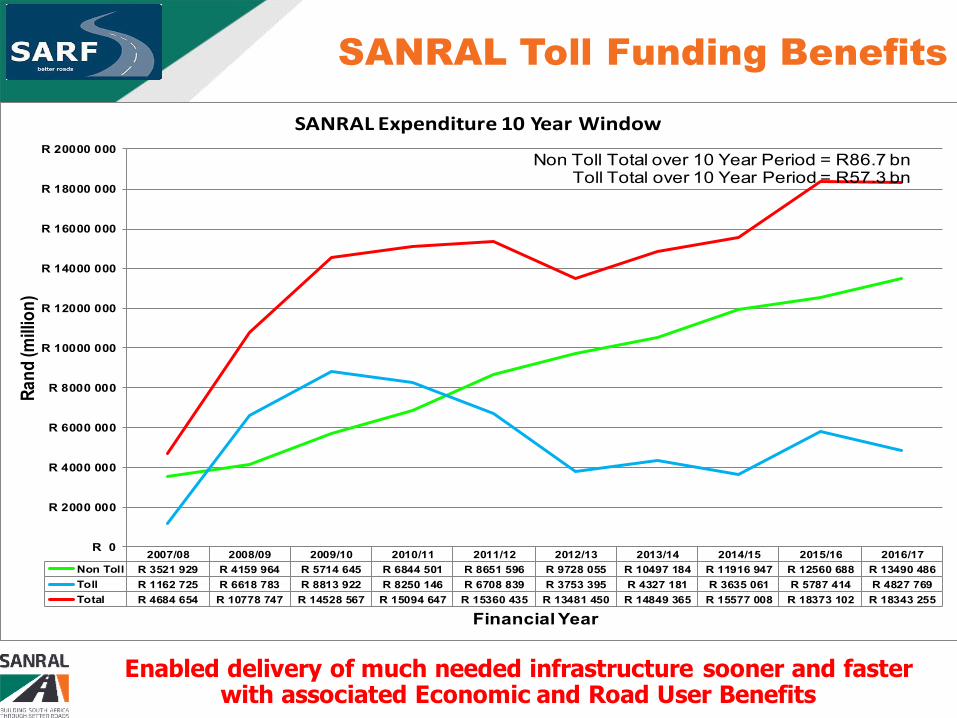
2007/08 2008/09 2009/10 2010/11 2011/12 2012/13 2013/14 2014/15 2015/16 2016/17
Non Toll R 3521 929 R 4159 964 R 5714 645 R 6844 501 R 8651 596 R 9728 055 R 10497 184 R 11916 947 R 12560 688 R 13490 486
Toll R 1162 725 R 6618 783 R 8813 922 R 8250 146 R 6708 839 R 3753 395 R 4327 181 R 3635 061 R 5787 414 R 4827 769
Total R 4684 654 R 10778 747 R 14528 567 R 15094 647 R 15360 435 R 13481 450 R 14849 365 R 15577 008 R 18373 102 R 18343 255
R 0
R 2000 000
R 4000 000
R 6000 000
R 8000 000
R 10000 000
R 12000 000
R 14000 000
R 16000 000
R 18000 000
R 20000 000
Ra
nd
(mill
ion
)
Financial Year
SANRAL Expenditure 10 Year Window
Non Toll Total over 10 Year Period = R86.7 bnToll Total over 10 Year Period = R57.3 bn
SANRAL Toll Funding Benefits
Enabled delivery of much needed infrastructure sooner and faster with associated Economic and Road User Benefits
46
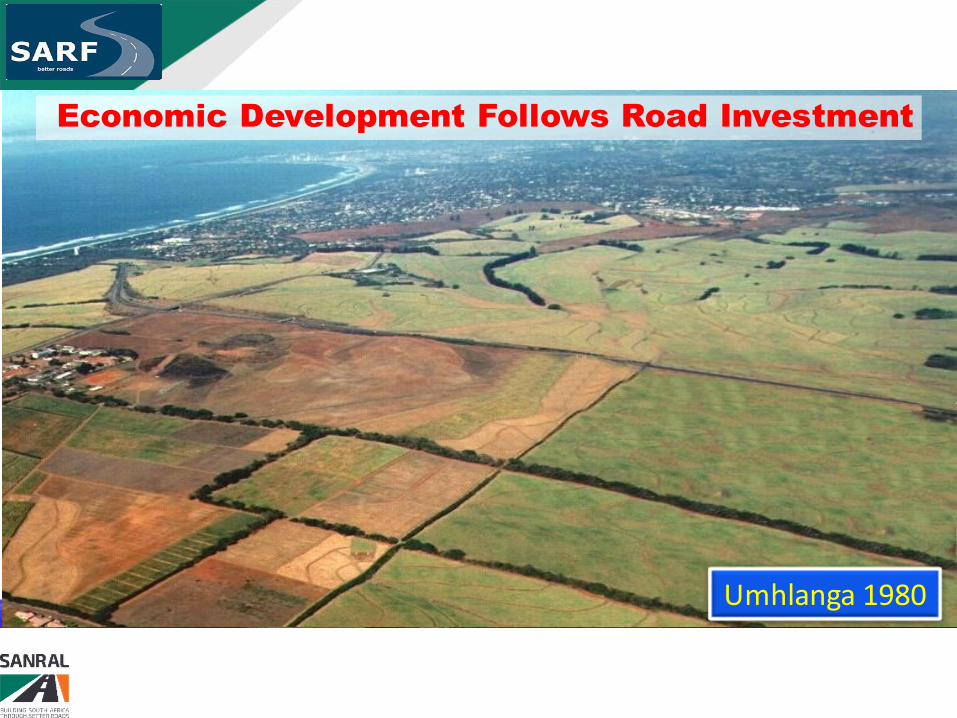
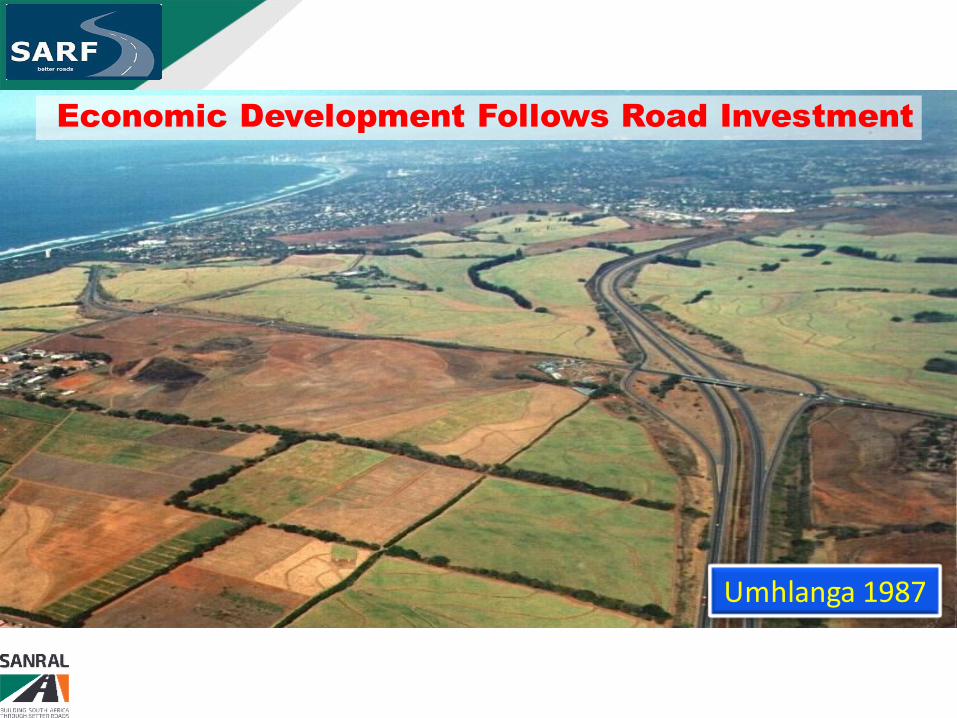
Umhlanga 1980
Economic Development Follows Road Investment
Umhlanga 1987
Economic Development Follows Road Investment
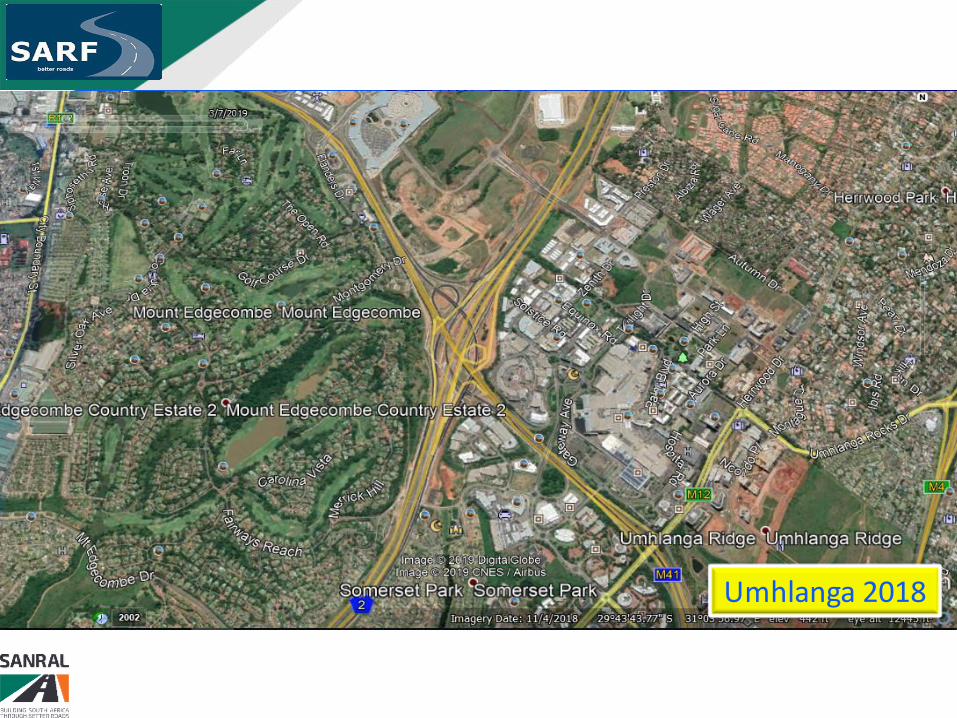
Umhlanga 2018

SANRAL Projects over MTEF 50
MTEF 363 Projects R64.7 billion

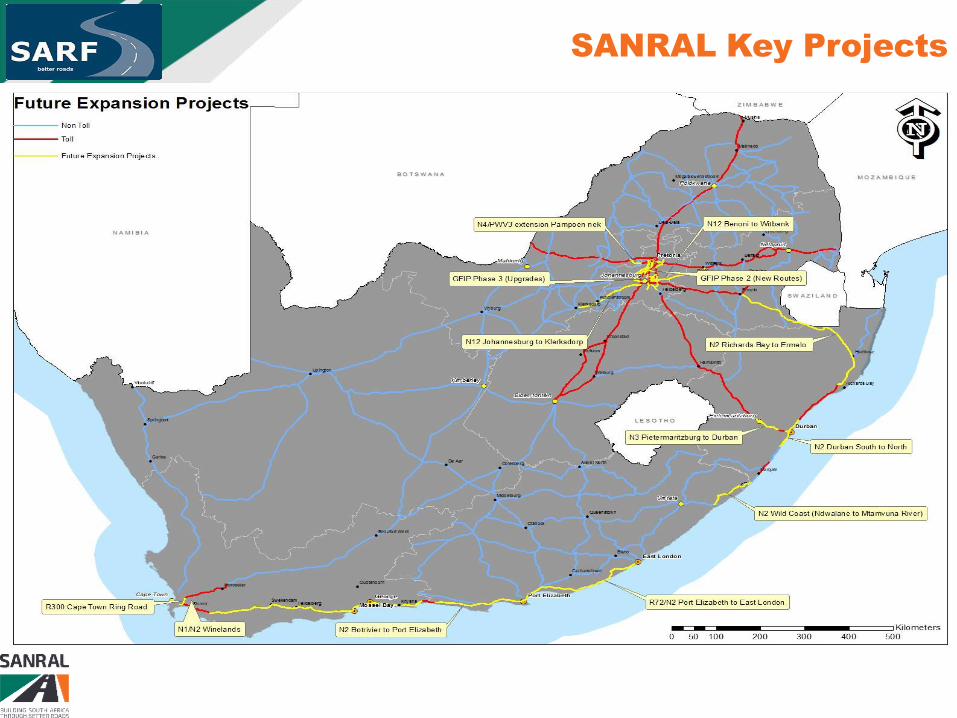
SANRAL Key Projects: Status
Project Initial Capital Costs
(R’000 2014R) Current Status
GFIP Phase 2 (New Routes) R 25 768 840 Nothing - Not declared national roads (Gauteng)
GFIP Phase 3 (Upgrades) R 17 655 160 Nothing - Not declared national roads (Gauteng)
R300 Cape Town Ring Road R 4 861 600 Nothing - Extensions not declared national roads
N1/N2 Winelands R 9 316 100 Toll Declaration set aside, cannot proceed until funding is
resolved
N2 Botrivier to Port Elizabeth R 11 272 540 Basic Planning, cannot proceed until funding is resolved / EIA
N2 Wild Coast (Ndwalane to Mtamvuna River)
(SIP 3) R 7 578 656
Construction funded by Fiscus, 1 Bridge Awarded, 1 in Tender
Adjudication, Haul Road Construction 98% Completed, Road
Detail design in Progress, Toll Declaration for Operations
Required by National Treasury
N2 Durban South (Prospecton) to North
(Umdloti) R 7 847 000 Detail design, cannot proceed until funding is resolved / EIA
N2 Richards Bay to Ermelo R 7 284 140 Detail Design, cannot proceed until funding is resolved / EIA
N3 Pietermaritzburg (Twickenham) to Durban
(EB Cloete) (SIP 2) R 15 777 205 Detail design, cannot proceed until funding is resolved / EIA
N3 De Beers (SIP 2) R 5 500 000 N3 De Beers replaced with New Van Reenen Development.
Complex Concession Amendments Required to implement
N4/PWV3 extension Pampoen nek R 1 716 900 Pampoen Nek Construction Started (Non Toll) due to ROD
Expiring
N12 Johannesburg to Klerksdorp R 2 731 700 Basic Planning, cannot proceed until funding is resolved / EIA
N12 Benoni to Witbank R 811 840 Basic Planning, cannot proceed until funding is resolved / EIA
R72/N2 Port Elizabeth to East London R 6 301 200 Detail Design, Phased Construction Started (Non Toll)
R573 Moloto Road (SIP 1) R 3 902 176 Detail Design, Phased Construction Started in Limpopo and
Mpumalanga (Non Toll), Gauteng Part not declared national road
Note: Most of these key capacity expansion projects (R128 bn) were previously planned to occur through toll financing, if no longer possible, then SANRAL will require additional funding from National Treasury to enable implementation.
51
SANRAL Key Projects 52
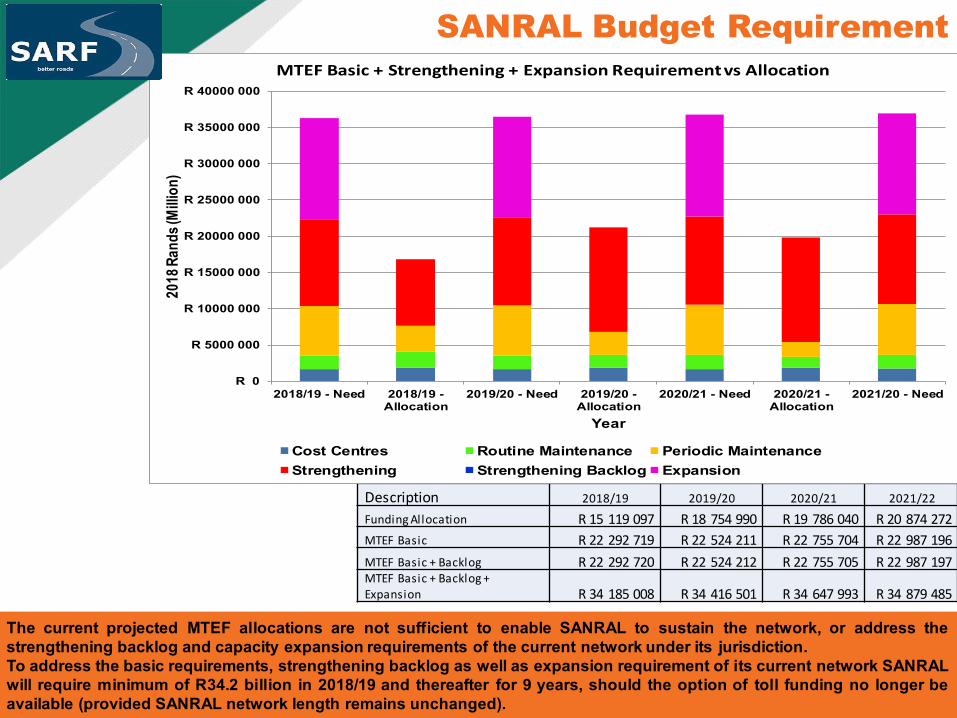
SANRAL Budget Requirement
Description 2018/19 2019/20 2020/21 2021/22
Funding Allocation R 15 119 097 R 18 754 990 R 19 786 040 R 20 874 272
MTEF Basic R 22 292 719 R 22 524 211 R 22 755 704 R 22 987 196
MTEF Basic + Backlog R 22 292 720 R 22 524 212 R 22 755 705 R 22 987 197
MTEF Basic + Backlog +
Expansion R 34 185 008 R 34 416 501 R 34 647 993 R 34 879 485
53
R 0
R 5000 000
R 10000 000
R 15000 000
R 20000 000
R 25000 000
R 30000 000
R 35000 000
R 40000 000
2018/19 - Need 2018/19 -Allocation
2019/20 - Need 2019/20 -Allocation
2020/21 - Need 2020/21 -Allocation
2021/20 - Need
2018
Ran
ds
(Mill
ion
)
Year
MTEF Basic + Strengthening + Expansion Requirement vs Allocation
Cost Centres Routine Maintenance Periodic Maintenance
Strengthening Strengthening Backlog Expansion
The current projected MTEF allocations are not sufficient to enable SANRAL to sustain the network, or address the strengthening backlog and capacity expansion requirements of the current network under its jurisdiction. To address the basic requirements, strengthening backlog as well as expansion requirement of its current network SANRAL will require minimum of R34.2 billion in 2018/19 and thereafter for 9 years, should the option of toll funding no longer be available (provided SANRAL network length remains unchanged).
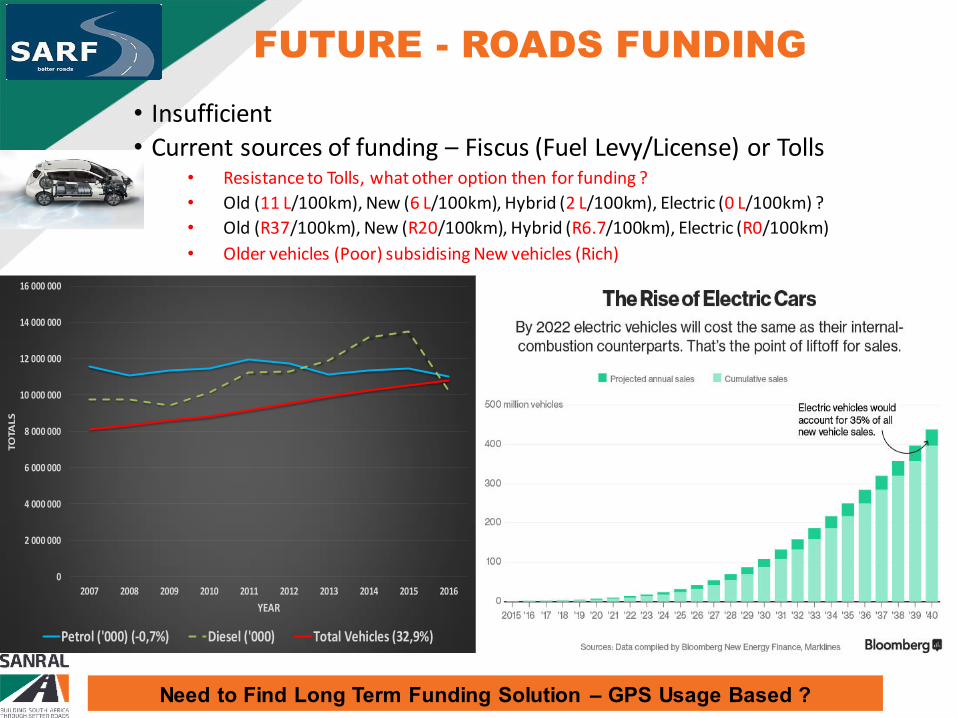
FUTURE - ROADS FUNDING
• Insufficient
• Current sources of funding – Fiscus (Fuel Levy/License) or Tolls • Resistance to Tolls, what other option then for funding ?
• Old (11 L/100km), New (6 L/100km), Hybrid (2 L/100km), Electric (0 L/100km) ?
• Old (R37/100km), New (R20/100km), Hybrid (R6.7/100km), Electric (R0/100km)
• Older vehicles (Poor) subsidising New vehicles (Rich)
54
0
2 000 000
4 000 000
6 000 000
8 000 000
10 000 000
12 000 000
14 000 000
16 000 000
2007 2008 2009 2010 2011 2012 2013 2014 2015 2016
TO
TA
LS
YEAR
Petrol ('000) (-0,7%) Diesel ('000) Total Vehicles (32,9%)
Need to Find Long Term Funding Solution – GPS Usage Based ?

55
Future Transport that
SANRAL must consider
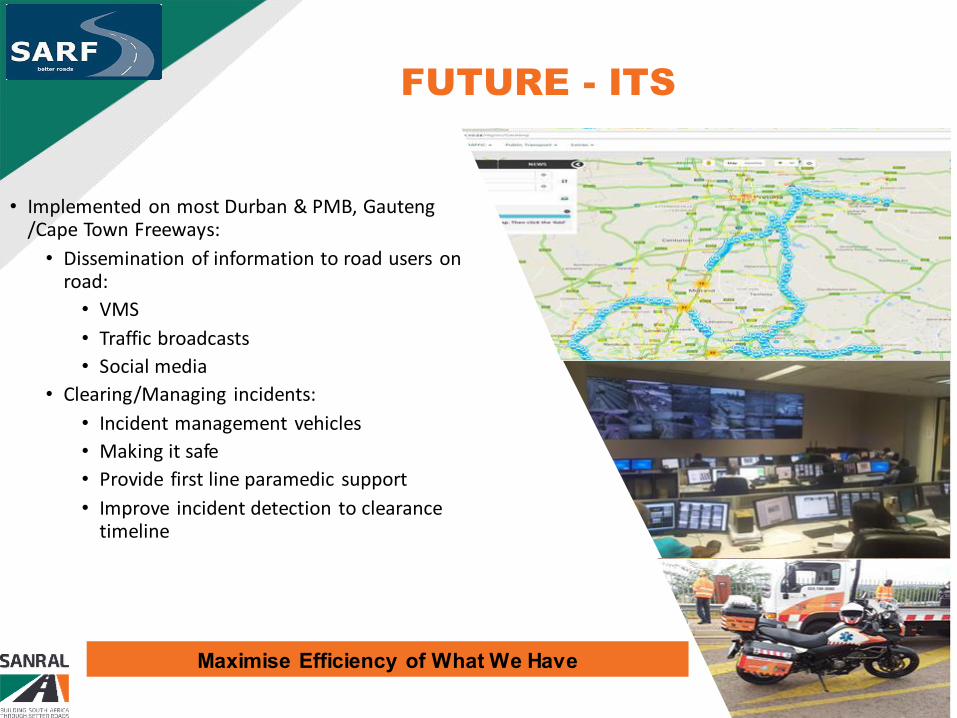
FUTURE - ITS
• Implemented on most Durban & PMB, Gauteng /Cape Town Freeways:
• Dissemination of information to road users on road:
• VMS
• Traffic broadcasts
• Social media
• Clearing/Managing incidents:
• Incident management vehicles
• Making it safe
• Provide first line paramedic support
• Improve incident detection to clearance timeline
56
Maximise Efficiency of What We Have

FUTURE WIM USE
• Overload Control • Old – Screeners at Static Weigh Bridges
• 50 to 100 km impact radius
• Construction/Operational Costs
• Human Factor
• Future – WIM-Enforcement • Direct Weight Enforcement integrate with Average
Speed over Distance (ASOD) – 250+ Installations • Been trialled over past 5 years
• Awaiting National Regulator Compulsory Standards Type Approval for ASOD and WIM-E
• End 2018
• Realtime Integration to SANRAL Central Operations Centre
• Realtime Tracking of Load Movements Country Wide (OD)
• Direct Enforcement (Speed/Load)
• Insurance Fraud
• Security Applications
• Abnormal Permits Enforcement
• Industry Self Regulation Verification
57
57 (Not to scale)

FUTURE – PERSONAL ROAD TRANSPORT
• Autonomous Vehicles / Mobility as a Service (Maas)
58
Autonomous Vehicles
2025 – Level 4 (option for override)
Benefits:
Accident Reduction
Closer following distances - increasing capacity
of existing roadways
Intersection Efficiency
No road signs / lane markings /safety barriers -
Dynamic lanes that can shift direction
Significant parking reduction (23 hours)
Mobility for All (No Driver Licence)
Distance to work - Increase
Mobility as a Service (Maas)
The provision of transport as a flexible, personalised on-
demand service that integrates all types of mobility
opportunities and presents them to the user in a
completely integrated manner to enable them to get
from A to B as easily as possible.
Already now (Uber, Google Waze) but real change
with autonomous vehicles !
Benefits:
Private Vehicle Ownership Reduction
Significant parking reduction
Tracking user demand in real time and optimising demand
dynamically with available capacity
Dynamic pricing to encourage users to avoid peak time
services and spread demand

FUTURE – PERSONAL ROAD TRANSPORT 59
60
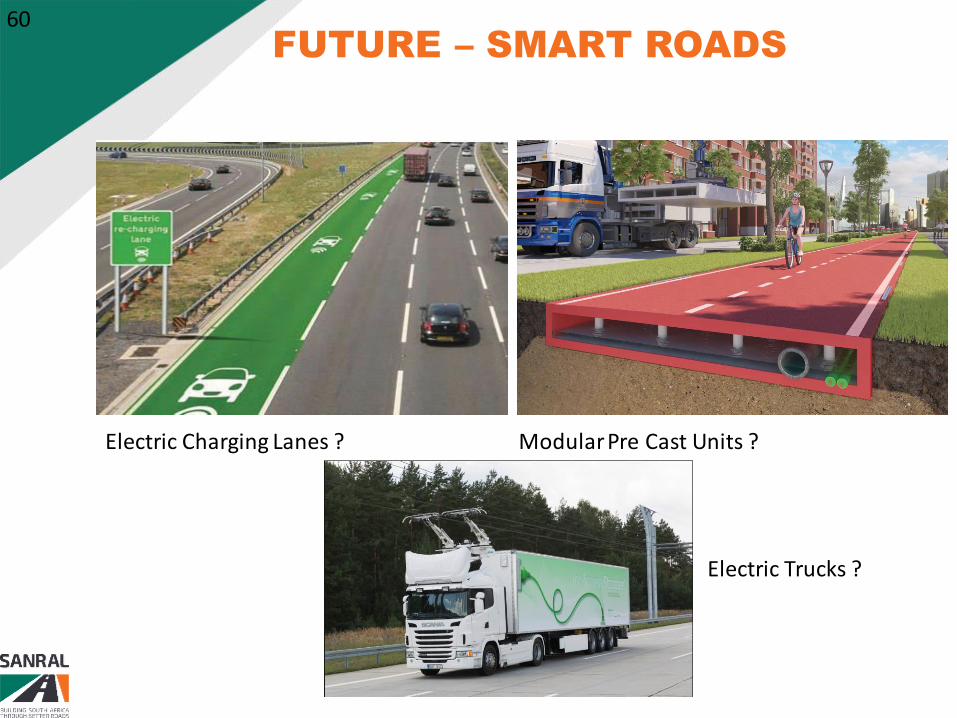
FUTURE – SMART ROADS
Electric Charging Lanes ? Modular Pre Cast Units ?
Electric Trucks ?
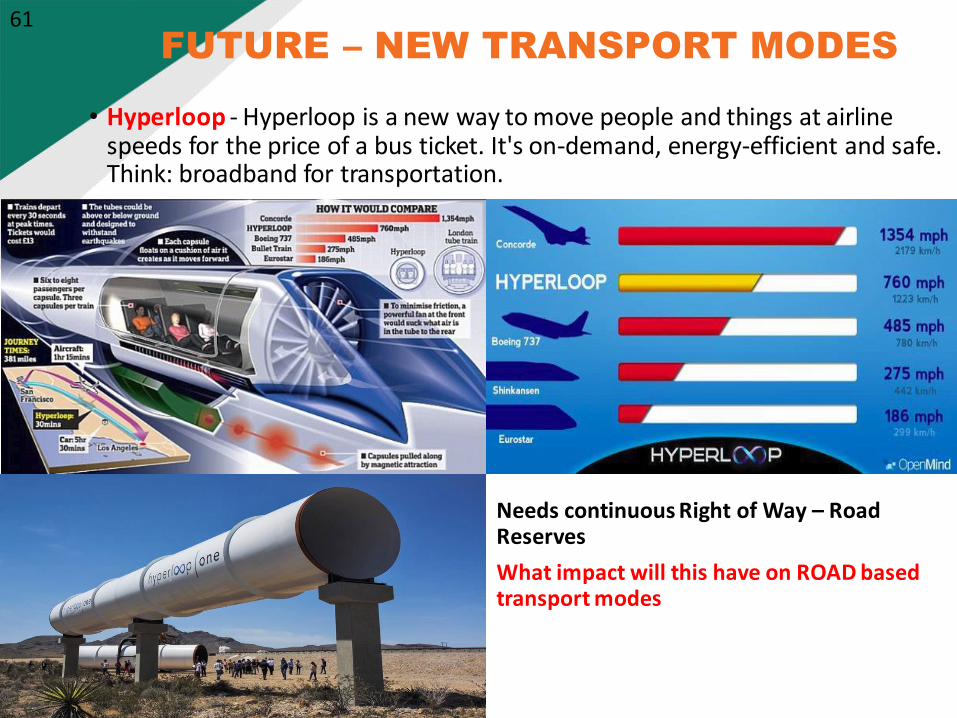
FUTURE – NEW TRANSPORT MODES
Needs continuous Right of Way – Road Reserves
What impact will this have on ROAD based transport modes
• Hyperloop - Hyperloop is a new way to move people and things at airline speeds for the price of a bus ticket. It's on-demand, energy-efficient and safe. Think: broadband for transportation.
61

THANK YOU www.sanral.co.za
62
62