s. a. anjorin, a. o. jemiluyi & akintayo t. c. … · typical examples of noise and vibration...
TRANSCRIPT

European Journal of Engineering and Technology Vol. 3 No. 6, 2015 ISSN 2056-5860
Progressive Academic Publishing, UK Page 1 www.idpublications.org
EVALUATION OF INDUSTRIAL NOISE: A CASE STUDY OF TWO NIGERIAN
INDUSTRIES
S. A. Anjorin, A. O. Jemiluyi & Akintayo T. C.
Department of Mechanical Engineering
The Federal University of Technology
PMB 704 Akure, NIGERIA
ABSTRACT
This study is aimed at quantifying noise pollution from industrial noise (machine and human
generated) at two selected processing and manufacturing industries namely: Denki Wire and
Cable Nigeria Limited and Wanwood Nigeria Limited, both in Akure, Ondo State, Nigeria.
The machines used for processing and production in these two industries were considered for
the research study as well as their operators and workers. Emphasis was given to noise
emitted by the individual industrial machines. The average noise equivalent level (LAeq) was
studied to identify the noisy machines and to generate baseline data. A precision grade sound
level meter was used to determine the various pressure levels of sound at thirty minutes
interval for five days. It was observed that noise limit values were exceeded at almost all
machines based on the regulation criteria and international standard. Also, the results of this
study shows that noise control measures were not put in place or where provided they were
not adequate in the industries surveyed.
Keywords: Industrial noise pollution, industrial machines, workers, noise control measures.
INTRODUCTION
Most machinery and manufacturing processes generate noise as an unwanted by-product of
their output. Typical examples of noise and vibration sources in the industrial environs
include; combustion processes associated with furnaces, impact noise associated with punch
processes, motors, generators and other electro-mechanical devices, unbalanced rotating
shafts, gears, steam or gas flows in piping systems, pumps, compressors, washing machines,
vibrating panel etc.
The mechanism of noise generation depends on the particular noise operations and equipment
including crushing, riveting, punch presses, drilling, pneumatic equipment, tumbling barrels,
dividing and metal cutting such as punching, pressing, lathes, milling machines and grinders
as well as pumps, in-plant conveying systems etc. Equipment induced vibration is widely
recognized as a health hazard. It is a physical stressor to which many people are exposed to at
work place.
High levels of industrial noise remain a problem all over the world. In the USA, more than 30
million workers are exposed to noise hazards (NIOSH, 1998). In Germany, 4-5 million
people (12%-15 % of the workforce) are exposed to noise levels defined as hazardous by
World Health Organization (WHO, 1991). The effects of sound pressure level generated
depend on the type of the noise source, distance from the source to the receiver and the nature
of working environment. For a given machine, the sound pressure level depends on the part
of total mechanical or electrical energy that is transformed into acoustical energy. Although
noise is associated with almost every work activity, some activities are associated with
particularly high levels of noise, the most important of which are working with impact
process, handling certain types of materials and flying commercial jets. Occupations at

European Journal of Engineering and Technology Vol. 3 No. 6, 2015 ISSN 2056-5860
Progressive Academic Publishing, UK Page 2 www.idpublications.org
highest risk for noise induced hearing loss (NIHL) include those in manufacturing,
construction, transportation, mining, agriculture, and military. (Von Gierke, et al, 1982).
High level noise not only hinders communication between workers, but depending on the
level, quality and exposure duration of noise, it may also result in different type of physical,
physiological and psychological effects on the workers. The acceptable noise exposure
standard in the workplace is 85 dB(A) averaged over an eight-hour period. This is not to
imply that below 85 dB(A) a safe condition exist. It simply means that an eight-hour
exposure of 85 dB(A) is considered to represent an acceptable level of risk to hearing health
in the workplace.
Data for developing countries are scarce, but available evidence suggests that average noise
levels are well above the industrial level recommend in many developed nations (Suter,
2000). Many researchers have delved into industrial noise and assessed the adverse health
effects it has on industrial workers (Goerlzer et al, 2001; Van Kenpen et al, 2002; Hernandez-
Gaytan et al, 2000; Palmer et al, 2001; Osibogun et al, 2000; Hessel, 2000; Georgiescu, 2000;
Davis, 1989; Shaikh, 1996). A number of studies have been carried out to evaluate industrial
noise in processing, mining, oil and gas, construction and manufacturing industries and the
results show that high percentage of industrial workers were exposed to more than 85dB(A)
noise levels (Ydego, 1991; Boateng and Amedofu, 2004). In spite of these studies, high noise
levels have been taken for granted in industries in developing countries especially Nigeria
Ydego (1974) investigated the industrial noise exposure of workers in a Textile industry in
Tanzania. The results of the investigation indicate gross industrial exposure to noise where
more than 30 % of the workers are exposed to noise levels exceeding 90 dB(A).
Kisku and Bhargava (2006) looked into the major sources of noise producing machines of a
thermal plant and showed that lowest average noise (70.37 dB(A)) was found at control room
while the highest average noise (95.91 dB(A) was at F.D fan. Compressors generate the
second highest noise of (89.98 dB(A)). Saadu (1985) assessed the industrial noise of
newspaper printing press, steel rolling mill, soft drink bottling, match making, mattress
making, beer brewing and bottling industries in Ilorin metropolis. The lowest and highest
average noise recorded were 82 dB(A) at mattress making industry and 98 dB(A) at beer
brewing and bottling industry respectively.
For Industrial noise, the best characterized health outcome is hearing impairment. The first
effects of exposure to excess noise are typically an increase in the threshold of hearing
(threshold shift) as assessed by audiometry. Audiometry defined as a change in hearing
threshold of average 10dB or more at 2000,3000 and 4000Hz in either ear (poorer hearing)
(NIOSH,1998).
Industrial employees are exposed to noises from a variety of sources, such as: traffic noise
from busy roadways, stationary vehicles and street noise, Compressors and pneumatic tools
in garages, workshops and maintenance areas, handheld power tools, heavy machinery and
other equipment, ventilation systems operating at substandard levels, human sources such as
children and co-workers. (Ahmed et al, 2000).
In view of the negative effect of noise on industrial workers, there is need to evaluate
industrial noise by using Denki Wire & Cable Limited and Wanwood Nigeria Limited both in
Akure, Ondo State, Nigeria as a case study.

European Journal of Engineering and Technology Vol. 3 No. 6, 2015 ISSN 2056-5860
Progressive Academic Publishing, UK Page 3 www.idpublications.org
RESEARCH METHODOLOGY
Field work
Study area: - The study reported here was carried out at two manufacturing and processing
industries (Denki wire & cable and Wanwood industries, both in Akure, Ondo State of
Nigeria). Estimates of noise levels were determined in all machines of the industries using a
simple digital sound level meter.
Noise measurement: - The digital sound level meter was the principal instrument used to
measure the noise of the machines. The instrument was held in hand and pointed towards the
direction of the source of noise from a distance not less than 1m. The measured values were
then used to compute various noise descriptions such as equivalent sound level, the daytime
average noise level, the noise pollution level using the following noise equations.
(i) Equivalent continuous sound pressure level, ( . This sums up the total energy
over some time period (T) and gives a level equivalent to the average sound energy over that
period. Such average levels are usually based on integration of A-weighted levels. Thus
T, is the average energy equivalent of the A-weighted sound over a period T.
(1)
(ii) Daily personal noise exposure of a worker ) is expressed in dB(A) using this
formula:
(2)
T = daily duration of a worker’s exposure to noise (hours)
= 8 hours (8 hr/day allowable exposure duration, adopted by ISO 1999 Standard)
20 µ (minimum sound frequency of a normal ear of a healthy young person)
weighted instantaneous sound pressure in pascals
(iii) The noise pollution level
(3)
where;
= noise pollution level
= sound level exceeded in 10% of the time
= sound level exceeded in 90% of the time
(iv) The maximum time of exposure is given as;
(4)
where;
t = maximum exposure duration (seconds)
L = exposure level dB(A)
µ = exchange rate
= Recommended exposure limit (REL)
Data collection
Data collections through the use of one hundred and twenty (120) structured questionnaires
were administered out of which one hundred and two (102) were received.
Interview/discussion was done with the employees in the industries. The questionnaire

European Journal of Engineering and Technology Vol. 3 No. 6, 2015 ISSN 2056-5860
Progressive Academic Publishing, UK Page 4 www.idpublications.org
comprises of personal information of employee, noise exposure records and site information
(history of machines).
Instrumentation and noise survey
The experimental apparatus employed in the recording of noise levels consist of a precision
grade sound level meter inch condenser microphone and with frequency range and
measuring level range of 31.5Hz to 8KHz and 35 to 130 dB(A) respectively. The desired
response of the Sound Level Meter (SLM) was set to A-weighting. When measurements
were made, the microphone was located in such a way as not to be in acoustic shadow of any
obstacle in appreciable field of reflected waves. (Harris, C.M 1991); (U.S.A Dept. of labour
1974).
The Federal Medical Centre, Owo, was approached for the health record of hearing impaired
patients. It was discovered that between 4.8 to 12.2 % of the patients who reported hearing
difficulties were diagnosed to have noise induced hearing loss. Ondo State Environmental
Protection Agency was visited to know the stand of state government and responses to noise
related problems. It was discovered that there is strong regulation for the control of noise but
the enforcement is at low ebb.
Procedure for noise measurement
Proper care was taken against reflected sound waves from the operators’ body when using the
sound level meter. The noise level was recorded at a regular interval of thirty (30) minutes for
fifteen times for five days which gives a total of seven hundred and sixty five (765) readings
in all the machines. The noise level meter was pointed to the direction of the major source of
noise in each location and being very sensitive it gives the accurate readings which were
recorded from the meter screen (Liquid Crystal Display, LCD).
A total number of Twelve (12) industrial machines were assessed for noise emissions, Six (6)
at Denki Wire & Cable and Six (6) at Wanwood industries. The noise exposure patterns of
these machines are as tabulated in Table 1.
Subjects
The participants in this study were workers in the two industries. Workers aged between 20-
50 years who had spent between six months to ten years were interviewed. A structured bio-
data, daily noise exposure level and machine information questionnaire to elicit information
from the selected workers was used. Administering of the questionnaire was done by passive
interview of the employers in the two industries.
RESULTS AND DISCUSSION
Twelve industrial machines were assessed for noise emission. The hourly sound pressure
levels recorded during survey work for the different machines in the two industries are
presented in Figures 1 – 12. The range of the noise level ( ) for the two industries is
82.84 to 117.50 dB (A). The daily noise exposure of workers in the industries surveyed
exceed the maximum exposure limits of 85 dB(A) recommended by FEPA and OSHA. As at
the time of this measurement, the highest and lowest average equivalent continuous noise

European Journal of Engineering and Technology Vol. 3 No. 6, 2015 ISSN 2056-5860
Progressive Academic Publishing, UK Page 5 www.idpublications.org
levels were 117.50 dB(A) and 82.84 dB(A) of Circular saw machine and Coiling machine
respectively.
All these machines emitted time varying/impassive noise exposure pattern. At Denki Wire &
Cable industries, the highest noise producing machine was Generator 95.39 dB(A), followed
by Wire Drawing machine 92.85 dB(A), Rewinding machine 90.25 dB(A), Cabling machine
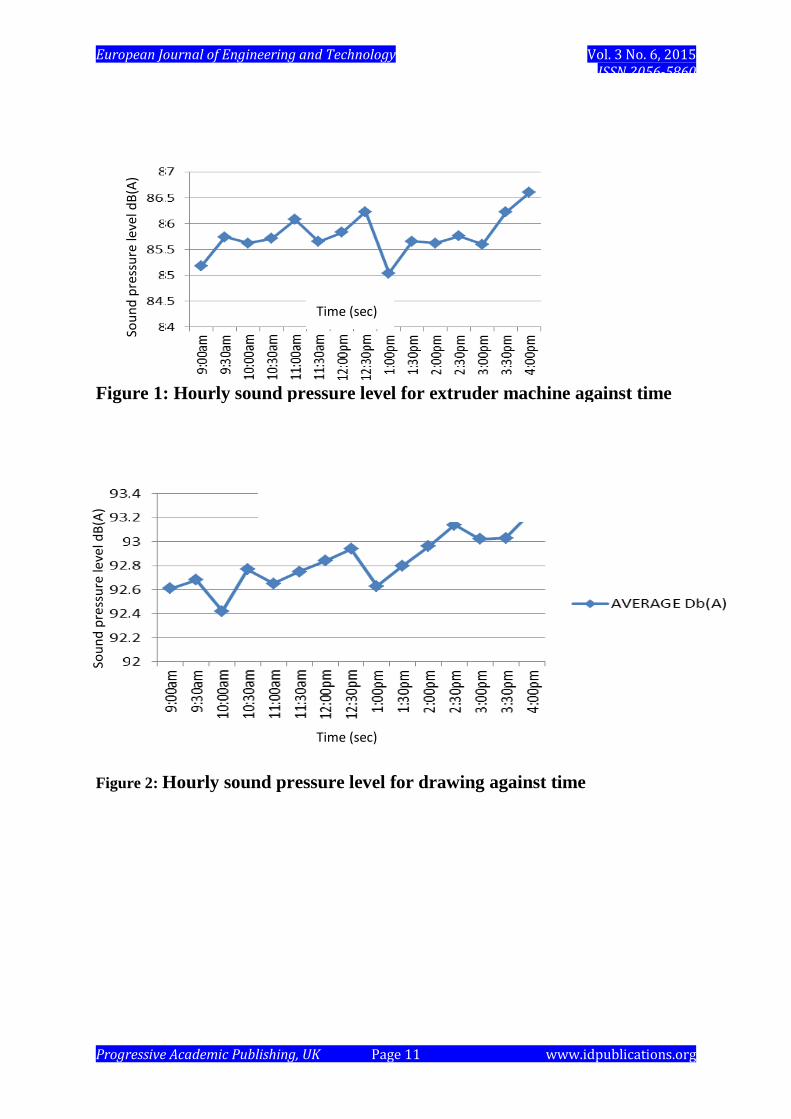
85.81 dB(A), Extruder machine 85.72 dB(A) and Coiling machine 82.84 dB(A) in that order.
At Wanwood Nig. Ltd, the highest noise producing machine was Circular saw machine
117.50 dB(A), Power chain saw 114.06 dB(A), Band saw 100.72 dB(A), Generator 99.81
dB (A), Planning machine 93.40 dB(A) and Tractor 89.39 dB(A) also in that order.
The possibility of developing a chronic health hazard problem is very high for workers
working in these environments and other areas where noise levels are greater than 85 dB(A),
This is because after the workers are exposed to high noise levels, they come out from the
noise source after their duty hours to an environment of lower noise level; hence,
physiological change and psychological stress occurred in their system. The result of this
survey shows that (83.33%) of the machines in the two industries produced noise above 85
dB(A) based on Occupational Safety and Health Administration, OSHA / WHO / ISO /
FEPA criteria.
Noise level is never constant; it changes with the number, type, speed and conditions of use
of the equipment which produce the noise as well as the operating skill of the machine
operator.
Noise levels for the woodworking machineries
Some of the factors affecting noise when using woodworking machineries include:
Species: (Wood Machinability/Hardness/Thickness) Hard, stiff timbers mean more
noise and more noise transmission. The tougher the wood, the higher the noise produced.
Thinner work pieces generally vibrate more if the work piece is not securely clamped
Machine setting (Timber control): The freer the timber, the greater the vibration and
the noise level.
Moisture content: Dry timber is brittle and good transmitter of noise.
Tooling sharpness: Cutter sharpness is important as dull knives and worn blades and
bands exert more force on the timber and so make more noise.
Tooling speed: Noise increases with tool speed. High speed can cause too much heat
lessening the life of the tool, while low speed will cause overfeeding thereby increasing the
machine noise. Cutting speed needs to be reduced when cutting dry woods.
Tooling balance: Out of balance tools create vibration, changes in cutting conditions,
reduce cutting efficiency and increase noise levels.
Machine condition: Old or new, woodworking machinery needs to be properly
maintained. A well maintained bandsaw may have a 10 dB(A) difference between idling and
cutting noises, but a poorly maintained machine may show hardly any difference. Well
maintained condition contributes to how well it runs and noise level. (Johnson L.L, 1982)
Noise levels for the electrical machines
Electrical machines in Denki Wire and Cable did not produce much noise compared with
woodworking machinery as presented in the Tables 2 and 3.

European Journal of Engineering and Technology Vol. 3 No. 6, 2015 ISSN 2056-5860
Progressive Academic Publishing, UK Page 6 www.idpublications.org
Noise in electrical machines can be mechanical or electrical caused by internal or external
factors. Mechanical noise occur either due to wear over time of various elements or as a
result of shock transmitted from the driven elements. Electromagnetic excited vibrations are
also substantial cause of the audible noise radiated by most electrical machines. Vibrations
due to internal causes include unbalanced rotating parts, weakening of the magnetic core
wedges, weakness in the functioning of the stator and advanced wear of the bearings. Bearing
components (rings, cage, rolling bodies) in the actual operation generates vibration and noise.
Other causes of noise are overload (drawing excessive current over a sustained period of
time), many machines running at the same time means more noise, fluctuations in the
supplied voltage and sudden increase in voltage (surge) and varying rotation speed of
generators.
The workers in these industries generally work for more than 8 hours per day and 6 days per
week (>48 hrs/wk) and are exposed to high noise level. The noise exposure levels in these
industries are excessively high as compared to the maximum permissible noise exposure limit
of
(i) 85 – 90 dB (A) for 40 hours per week, as suggested by ISO. (ISO, R-1999 (1971)
(ii) 90 dB (A) for 40 hours per week allowed in United Kingdom, Denmark, Canada
(iii) 85 dB (A) for 40 hours per week allowed by Occupational Safety & Health Act
(USA)
(USA, Dept. of labour, 1974)
Such high level of noise not only hinders the communication between the workers, but its
long term exposure may also result in ill effects especially in permanent hearing threshold
shift. The hazardous nature of industrial noise in Nigeria laid credence to the formulation of
permissible levels/standard by the federal environmental protection agency to which an
employee may be subjected to. The FEPA Noise exposure limits guideline for Nigeria is
shown in Table 4.
But this guideline has been violated in many processing and manufacturing industries in
Nigeria due to inefficiency of the statutory body in enforcing and implementing the
regulatory laws to limit high level of industrial noise and the unawareness of the workers
about the ill- effects of high level of noise. (FEPA, 1991)
Analysis of the results of the Questionnaires
A total of 120 questionnaires were administered to study:
employee’s bio-data including the age and sex distribution
employee’s daily noise exposure level
employee’s working environment (level of noise produced) and machines
maintenance
effects of noise on employee’s vis-a-vis job performance, interference with
communication, hearing impairment, response to doctors consultation etc
The working environment was very noisy, 77.45% of the respondent agreed to that fact. Also
it was deduced that there was a correlation between a very noisy working environment and
the frequency of hearing impairment caused on the respondent. Although the machines were
adequately maintained, the working environment was very noisy. Factors like machines
condition, operation processes or the workpiece might be responsible. It is thus evident that
the noise produced was as a result of the production processes. 80.39% and 51.96% of the

European Journal of Engineering and Technology Vol. 3 No. 6, 2015 ISSN 2056-5860
Progressive Academic Publishing, UK Page 7 www.idpublications.org
respondent confirmed negative interference with their communication and job performance
respectively.
CONCLUSION
The following conclusions can be drawn about the level of noise pollution in the selected
processing and manufacturing industries (Denki Wire & Cable) and (Wanwood Nig. Ltd.):
The average noise exposure level ( ) in both industries is found to be above 85
dB(A) and that is well above the healthy noise level of 85 dB(A) recommended by World
Health Organization (WHO).
The workers in the industries are at high risk of developing noise induced hearing loss
(NIHL) and other associated ailments due to excessive exposure to industrial noise.
The damaging consequences of exposure to excessive noise are cumulative and
usually do not shows up for several years since workers who work in such noisy environment
soon become desensitized. They get used to the noise quickly, they do not notice anymore,
they do not worry about it and they do not take precaution to protect themselves from its
debilitating effects.
There is need to develop and apply a well-defined, comprehensive and enforceable
noise regulation. The limit of 85 dB(A) for 8 hours/day stipulated by OSHA (also stated by
Nigerian factories Act 1960) has to be followed with caution as working hours in most of the
processing and manufacturing industries in Nigeria are above 8 hours/day and 48 hours/week.
Noise exposure level should be reduced by providing a wide green belt of thick
vegetation around the factories’ premises, covering the outer surfaces of the rooms within the
factories with sound absorbing materials, setting a noise limit of at least 5 – 10 dB (A) below
the prescribed standard, designing/fabricating new machines for the factories, organizing
periodic health education programs for the workers and enforcing /implementing the noise
regulatory laws by appropriate government agencies.
REFERENCES
Ahmed H.O, Dennis J.H, Badran A, Ismail M, Ballal S.G, Ashoor A, Jerwood D. (2000).
Noise exposure and hearing loss of workers in two plants in eastern Saudi Arabia.
Annals of occupational hygiene. 58:371-380.
Boateng C.A, Amedofu G.K. (2004). Industrial noise pollution and its effects on the
capabilities of workers; A study from sawmills, printing presses and corn mills. African
Journal of Health Science, 11; 1-2.
Davis A. C (1989). The prevalence of hearing impairment and reported hearing disability
among adults in Great Britain. International Journal of Epidemiology 82: 911-917.
FEPA (1991). National interim guidelines and standards for industrial effluents, gaseous
emission and hazardous waste in Nigeria, Federal Environmental Protection Agency
(FEPA) 52.
Goelzer B, Hansen C.H, Sehrndt G.A (2001). Occupational exposure to noise evaluation,
prevention and control. Geneva, World Health Organization and Dortmund / Berlin, the
Federal Institute for Occupational Safety and Health. WHO / FIOSH
Georgiescu L. (2000). Non auditory damages of industrial noise in workers. Institute of
public Health, Timisoara, Romania. CEJOEM 2-3, 171-175.
Harris C. M. (1991). Handbook of Acoustical Measurement and Noise Control, 3rd Edition,
McGraw- Hill Book Co., New York.

European Journal of Engineering and Technology Vol. 3 No. 6, 2015 ISSN 2056-5860
Progressive Academic Publishing, UK Page 8 www.idpublications.org
Hernandez–Gaytan S.I., Santos-Burgo A.C, Becker-Meyer J.P, Macias-Carrillo C, Lopez-
Cervantes M (2000). Prevalence of hearing loss and correlated factors in a cement
plant. Salud publica de Mexico. (Public Health of Mexico) 106-111.
Hessel P. (2000) Hearing loss among construction workers in Edmonton, Alberta, Canada.
Journal of Occupational and Environmental medicine, 57
ISO Recommendation, R-1999. (1971). Assessment of occupational noise exposure for
hearing conversation purpose. International Standard Organization, Geneva.
ISO (1999). International Organization for Standardization, “Acoustics determination of
occupational noise exposure and estimation of noise – induced hearing impairment”.
ISO 199. 2.
Johsnon L. L. (1982). “Some Refinement in Sawing Techniques for circular saws in the
sawmill”, Conference of the New Zealand Educational Saw Doctors Association.
Kisku G.C and Bhargara S.K, (2006). Assessment of noise level in a medium scale thermal
plant. Indian journal of occupational, environment and medicine. 10:133-139
Nagi G.K, Dhillon M.K, Dhaliwal G.S, (1990). Noise Pollution: Its effect and control.
Commonwealth publishers, New Delhi. 22
NIOSH (1998). Criteria for recommend Standard: Occupational Noise Exposure, Revised
Criteria. Cincinnati, OH, National Institute for Occupational Safety and Health.
Osibogun A, Igweze I.A, Adeniran L.O. (2000). Noise Induced Hearing loss among Textile
Workers in Lagos Metropolis. The Nigerian Postgraduate Medical Journal. 104- 111.
Palmer K, Pannett B, Griffin M. (2001). Occupational exposure to noise and hearing
difficulties in Great Britain. University of Southampton for the Health and safety
Executive (Contract Report 361/2001)
Saadu A.A. (1988). Community and Occupational noise survey and analysis of some selected
Nigeria cities and industries (Ph.d Thesis) University of Benin, Nigeria.
Shaikh G.H. (1996). Noise problem in a polyester fiber plant in Pakistan Industrial health, 34;
427-431.
Suter A. (2000). Standard and Regulations. American Industrial Hygiene Association, The
Noise Manual, Revised 5th
Edition, Fair fax, VA.
Unites State of America (USA) Department of Labour (1974). Occupational Safety and
Health Standards, Volume 39, No. 125, Part 11.
Van Kempen E.E, Kruize H, Ameling C.B, Staatsen B.A, de Hollander A.E (2002). The
Association between noise exposure and blood pressure and Ischemic heart disease; a
meta-analysis. Environmental Health Perspectives; (307-317).
Von Gierke H.E, Robinson D, Karmy S.J (1982). Results of the workshop on impulse noise
and auditory hazard. Institute of sound and vibration research, Southampton, U.K.
ISVR Memorandum 618. Journal of sound and vibration. 579 – 584.
WHO (1991). Report of the informal working Group of Deafness and hearing Impairment
Programme Planning, Geneva, World Health Organization
Ydego M. (1974). Assessment of noise pollution in Friendship Textile Mill Limited. Ubang,
Dar es Salaam. Environmental Engineering 17; 479-485.

European Journal of Engineering and Technology Vol. 3 No. 6, 2015 ISSN 2056-5860
Progressive Academic Publishing, UK Page 9 www.idpublications.org
Table 1: Noise Exposure Pattern of the machines in the Industries visited
Location Noise source Noise exposure pattern
Denki Wire & cable Industry Drawing Machine Steady continuous state
Coiling machine Steady cyclic state
Rewinding machine Steady continuous state
Extruder Machine Steady continuous state
Cabling Machine Steady continuous state
Generator 1 Steady continuous state
Wanwood Industry Circular Machine Time varying/Impulsive
Power chain Machine Time varying/Impulsive
Tractor Time varying/Impulsive
Band saw Time varying/Impulsive
Planning Machine Time varying/Impulsive
Generator II Steady continuous state
Table 2: Mean observed noise levels in Wanwood Nig. Limited
Location Machines Noise level dB(A)
Wanwood Industries Tractor 89.39
Circular saw 117.50
Band saw 100.72
Planning Machine 93.40
Generator 2 97.43
Power Chain saw 114.90

European Journal of Engineering and Technology Vol. 3 No. 6, 2015 ISSN 2056-5860
Progressive Academic Publishing, UK Page 10 www.idpublications.org
Table 3: Mean observed noise levels in Denki Wire and Cable Limited
Table 4: FEPA Noise exposure limit guidelines for Nigeria
Location Machines Noise level dB(A)
Denki wire & cable industries
Cabling Machine 85.81
Coiling Machine 82.84
Extruder Machine 85.72
Drawing Machines 92.85
Generator 1 95.39
Rewinding Machine 90.25
Duration per day (Hours) Possible Exposure limits(dB(A))
8
6
4
3
2
1.5
1
0.5
0.25 or less
90
92
95
97
100
102
105
110
115
European Journal of Engineering and Technology Vol. 3 No. 6, 2015 ISSN 2056-5860
Progressive Academic Publishing, UK Page 11 www.idpublications.org
Figure 1: Hourly sound pressure level for extruder machine against time
Figure 2: Hourly sound pressure level for drawing against time
Time (sec)
Time (sec)
Sou
nd
pre
ssu
re le
vel d
B(A
)
Sou
nd
pre
ssu
re le
vel d
B(A
)

European Journal of Engineering and Technology Vol. 3 No. 6, 2015 ISSN 2056-5860
Progressive Academic Publishing, UK Page 12 www.idpublications.org
Figure 3: Hourly sound pressure level for cabling machine against time
Figure 4: Hourly sound pressure level for circular saw machine against time
Time (sec)
Sou
nd
pre
ssu
re le
vel d
B(A
)
Sou
nd
pre
ssu
re le
vel d
B(A
)
Time (sec)

European Journal of Engineering and Technology Vol. 3 No. 6, 2015 ISSN 2056-5860
Progressive Academic Publishing, UK Page 13 www.idpublications.org
Figure 5: Hourly sound pressure level for power chain machine against
time
Figure 6: Hourly sound pressure level for tractor against time
109
110
111
112
113
114
115
116
117
87.5
88
88.5
89
89.5
90
90.5
91
91.5
92
Time (sec)
Sou
nd
pre
ssu
re le
vel d
B(A
)
Time (sec)
Sou
nd
pre
ssu
re le
vel d
B(A
)

European Journal of Engineering and Technology Vol. 3 No. 6, 2015 ISSN 2056-5860
Progressive Academic Publishing, UK Page 14 www.idpublications.org
Figure 7 : Hourly sound pressure level for band saw machine against time
Figure 8: Hourly sound pressure level for Generator II machine against time
87.5
88
88.5
89
89.5
90
90.5
91
91.5
92
87.5
88
88.5
89
89.5
90
90.5
91
91.5
92
Time (sec) Sou
nd
pre
ssu
re le
vel d
B(A
)
Time (sec)
Sou
nd
pre
ssu
re le
vel d
B(A
)

European Journal of Engineering and Technology Vol. 3 No. 6, 2015 ISSN 2056-5860
Progressive Academic Publishing, UK Page 15 www.idpublications.org
Figure 9: Hourly sound pressure level for generator I machine against time
Figure 10: Hourly sound pressure level for planning machine against time
87.5
88
88.5
89
89.5
90
90.5
91
91.5
92
87.5
88
88.5
89
89.5
90
90.5
91
91.5
92
Time (sec)
Sou
nd
pre
ssu
re le
vel d
B(A
)
Time (sec)
Sou
nd
pre
ssu
re le
vel d
B(A
)

European Journal of Engineering and Technology Vol. 3 No. 6, 2015 ISSN 2056-5860
Progressive Academic Publishing, UK Page 16 www.idpublications.org
Figure 11: Hourly sound pressure level for coiling machine against time
Figure 12: Hourly sound pressure level for rewinding machine against time
87.5
88
88.5
89
89.5
90
90.5
91
91.5
92
87.5
88
88.5
89
89.5
90
90.5
91
91.5
92
Time (sec)
Sou
nd
pre
ssu
re le
vel d
B(A
)
Time (sec)
Sou
nd
pre
ssu
re le
vel d
B(A
)