ryan white hiv/aids program aids drug assistance program … · 2019-09-17 · adr annual...
TRANSCRIPT

Ryan White HIV/AIDS Program
AIDS Drug Assistance Program (ADAP)
Annual Client-Level Data Report 2017

iiADR Annual Client-Level Data Report
The Ryan White HIV/AIDS Program AIDS Drug Assistance Program (ADAP) Annual Client-Level Data Report is published by the Division of Policy and Data, HIV/AIDS Bureau (HAB), Health Resources and Services Administration (HRSA), U.S. Department of Health and Human Services, Rockville, Maryland.
Data are presented for clients reported to the HRSA HAB AIDS Drug Assistance Program Data Report (ADR) data system for calendar years 2014 through 2017.
The AIDS Drug Assistance Program (ADAP) Annual Client-Level Data Report is not copyrighted and may be used and copied without permission. Citation of the source is, however, appreciated.
Suggested CitationHealth Resources and Services Administration. Ryan White HIV/AIDS Program AIDS Drug Assistance Program (ADAP) Annual Client-Level Data Report 2017.September 2019.
hab.hrsa.gov/data/data-reports. Published
Health Resources and Services Administration
Thomas Engels........................................................................................................... Acting Administrator
HIV/AIDS Bureau, Health Resources and Services Administration
Laura W. Cheever, MD, ScM ..................................................................................Associate Administrator
Heather Hauck, MSW, LICSW ....................................................................Deputy Associate Administrator
Antigone Dempsey, MEd ................................................................... Director, Division of Policy and Data
Tracy Matthews, MHA, RN ........................... CAPT, USPHS; Deputy Director, Division of Policy and Data
Susan Robilotto, DO .......................................................... Director, Division of State HIV/AIDS Programs
Rene Sterling, PhD, MHA ......................................Deputy Director, Division of State HIV/AIDS Programs
Glenn Clark, MSW ........................................ADAP Senior Advisor, Division of State HIV/AIDS Programs
Information about the Ryan White HIV/AIDS Program (RWHAP): hab.hrsa.gov
Information about the RWHAP AIDS Drug Assistance Program: hab.hrsa.gov/about-ryan-white-hivaids-program/part-b-aids-drug-assistance-program
Educational and technical assistance materials about HIV infection and the Ryan White HIV/AIDS Program: targetHIV.org
Acknowledgments
Publication of this report was made possible by the contributions of the Ryan White HIV/AIDS Program ADAP grant recipients that provided ADAP data to HRSA.
iiiADR Annual Client-Level Data Report
ContentsCommentary 1
Technical Notes 5
References 8
Tables 9
1 AIDS Drug Assistance Program clients (non-RSR), by year and selected characteristics and services received, 2014–2017—United States and 3 territories ............... 9
2 AIDS Drug Assistance Program clients (non-RSR), by race/ethnicity and selected characteristics, 2017—United States and 3 territories ........................................................... 10
3 AIDS Drug Assistance Program clients (non-RSR), by gender and selected characteristics, 2017—United States and 3 territories ............................................................11
4 AIDS Drug Assistance Program clients (non-RSR), by federal poverty level and selected characteristics, 2017—United States and 3 territories ............................................ 12
5 AIDS Drug Assistance Program clients (non-RSR), by health care coverage and selected characteristics, 2017—United States and 3 territories ............................................ 13
6 AIDS Drug Assistance Program clients (non-RSR), by HHS region and selected characteristics, 2017—United States and 3 territories ........................................................... 14
7 AIDS Drug Assistance Program clients (non-RSR), by service received and selected characteristics, 2017—United States and 3 territories ........................................................... 15
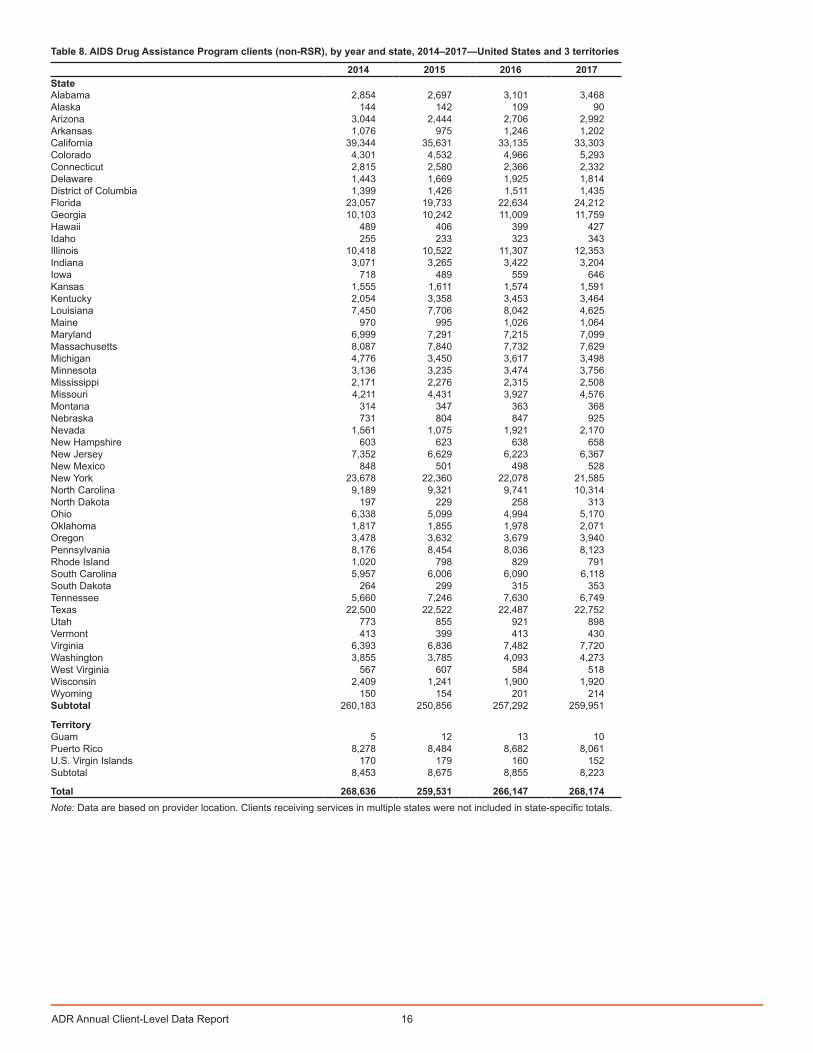
8 AIDS Drug Assistance Program clients (non-RSR), by year and state, 2014–2017— United States and 3 territories ............................................................................................... 16
9 AIDS Drug Assistance Program clients (non-RSR), by age group and state, 2017— United States and 3 territories ............................................................................................... 17
10 AIDS Drug Assistance Program clients (non-RSR), by race/ethnicity and state, 2017— United States and 3 territories ............................................................................................... 19
11 AIDS Drug Assistance Program clients (non-RSR), by gender and state, 2017— United States and 3 territories ............................................................................................... 21
12 AIDS Drug Assistance Program clients (non-RSR), by federal poverty level and state, 2017—United States and 3 territories .................................................................................... 23
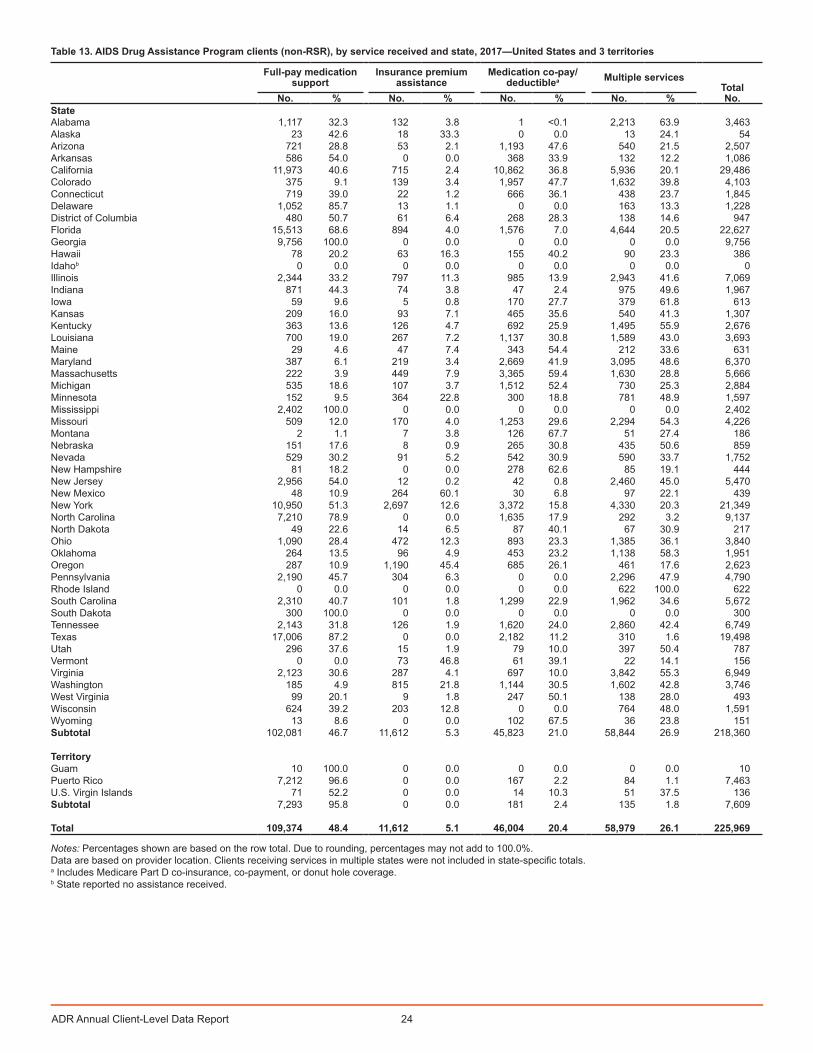
13 AIDS Drug Assistance Program clients (non-RSR), by service received and state, 2017—United States and 3 territories .................................................................................... 24

1ADR Annual Client-Level Data Report
COMMENTARYThe Ryan White HIV/AIDS Program (RWHAP), first enacted by U.S. Congress in 1990, provides a comprehensive system of direct HIV healthcare, essential support services, and medications for more than half a million people with HIV in the United States. The RWHAP has five statutorily defined Parts that provide funding for medical and support services, technical assistance, clinical training, and the development of innovative models of care to meet the needs of different communities and populations affected by HIV. The RWHAP provides grant funding to all 50 states, the District of Columbia, Puerto Rico, the U.S. Virgin Islands, and six U.S. Pacific jurisdictions to support HIV care and treatment services. The RWHAP legislation authorizes a portion of Part B funds to be designated for the AIDS Drug Assistance Program (ADAP), which provides U.S. Food and Drug Administration (FDA)-approved medications to low-income people with HIV who have limited or no health care coverage.
ADAP funds may be used to provide HIV and HIV-related prescription drugs and/or to purchase health care coverage for eligible clients and for services that enhance access to, adherence to, and monitoring of drug treatments. The ADAP is critical to ensuring that people with HIV are able to adhere to medication regimens and remain virally suppressed. People with HIV who achieve and maintain an undetectable viral load have effectively no risk of sexually transmitting the virus to an HIV-negative partner. The medication and health care coverage assistance offered by ADAP is crucial for attaining optimal HIV health outcomes among people with HIV, for preventing further transmission of the virus and, ultimately, for ending the HIV epidemic.
History of HRSA’s RWHAP AIDS Drug Assistance ProgramThe RWHAP is administered by the U.S. Department of Health and Human Services (HHS), Health Resources and Services Administration (HRSA), HIV/AIDS Bureau (HAB). The RWHAP legislation was first enacted in 1990 when Congress passed the Ryan White Comprehensive AIDS Resources Emergency (CARE) Act to address the crisis of the HIV epidemic in the United States. This legislation has been amended and reauthorized four times: in 1996, 2000, 2006, and most recently in 2009, as the Ryan White HIV/AIDS Treatment Extension Act of 2009.
In 1987, the FDA approved the drug azidothymidine (AZT, zidovudine, Retrovir) to treat HIV in the United States [1]. At that time, the cost of this drug was about $10,000 per year, per person—preventing access for most people with HIV [2]. In 1991, HRSA launched the AZT Drug Reimbursement Program with $30 million approved by Congress under a public health emergency provision allowing low-income people with HIV access to HIV treatment [2]. HRSA’s AZT Drug Reimbursement Program laid the foundation for ADAP, authorized under the CARE Act in 1996 as a separate line item under Title II (Part B) and classified as a core medical service.
Each state/territory operates an ADAP, and each is unique because of the state’s HIV prevalence, health care system, and administrative structures used to ensure HIV medications are available to eligible RWHAP clients [2]. The purpose of ADAP, as stated in the RWHAP legislation, is “to provide therapeutics to treat HIV or prevent the serious deterioration of health arising from HIV in eligible individuals, including measures for the prevention and treatment of opportunistic infections” [3]. To be eligible to receive assistance from a state/territory under ADAP, the client must have a medical diagnosis of HIV and have a low income, as determined by the state/territory.
Since Congress first appropriated funds for ADAP in 1996, ADAPs have expanded considerably, as has the availability of antiretroviral medication. Between 1996 and its reauthorization in 2000, ADAP program funding increased from $52 million to $528 million. In addition, for the first time in 2000, ADAPs were permitted to pay health care coverage costs to support coverage of HIV-related medications [2,4].

2ADR Annual Client-Level Data Report
In 2006, funding rose another 50%, in a continued effort to reach underserved populations. During the 2009 reauthorization of ADAP, funding levels reached $835 million for fiscal year 2010 [1–4].
In recent years, ADAP funding has leveled. Full-year appropriations for the RWHAP in fiscal year 2017 were $2.3 billion, with $900.3 million (39%) allocated for ADAP. The significant increases in ADAP funding since the program was first appropriated underscore the important role of ADAP services for people with HIV, as evidenced by the following:
• increased and improved HIV testing, resulting in more people knowing their HIV status
• increased number of people on ART after the U.S. Public Health Services’ guidelines indicating the need for early treatment of people with HIV
• more people living longer with HIV
• more intensive use of HIV drugs for long-term survivors
• increased cost-sharing associated with health insurance
• increased cost of medications and health care coverage; and
• prevention of new infections through treatment of HIV.
As is true for the entire RWHAP, ADAPs serve as the payor of last resort. ADAP grant recipients and subrecipients are expected to enroll clients into health care coverage for which the client may be eligible (i.e., Medicare, Medicaid, or other public and private plans). ADAPs coordinate with other payors and programs to provide clients with access to HIV medications [2,4].
Inaugural ADAP Client-Level Data ReportThis report is the first publication of national ADAP client-level data submitted through the ADAP Data Report (ADR) data system. The ADR was implemented in 2013 and includes annual, client-level data collected by the ADAP in each state/territory. ADR data describe the demographic characteristics of clients accessing ADAP services and the ADAP-funded services used. HRSA can use these data to evaluate the reach and impact of ADAP on a national level.
The ADR data do not include information about clients receiving non-ADAP RWHAP services, such as core medical and support services. However, many ADAP clients also receive these services. Together, ADAP services and RWHAP direct care and support services create a comprehensive system of care and treatment for people with HIV. Data for clients receiving non-ADAP RWHAP services are reported to HRSA through the RWHAP Services Report (RSR) and are published annually in the RWHAP Annual Client-Level Data Report [5].
This document includes data reported to HRSA for all clients receiving ADAP services during calendar years 2014 through 2017. The data presented include client demographics, socioeconomic factors (e.g., income as a percentage of the federal poverty level [FPL], health care coverage), and service utilization. Although ADR data reporting began in 2013, this report includes data beginning in 2014 to ensure the data quality.
Highlights of the AnalysesThe data presented in this report should be interpreted with caution. Each ADAP operates within the broader context of the state’s health care system and public health infrastructure.
RWHAP AIDS Drug Assistance Program ClientsEach year, ADAPs serve approximately 260,000 or more people with HIV. The number of people receiving ADAP services has been largely consistent from 2014 through 2017. In 2017, 268,174
3ADR Annual Client-Level Data Report
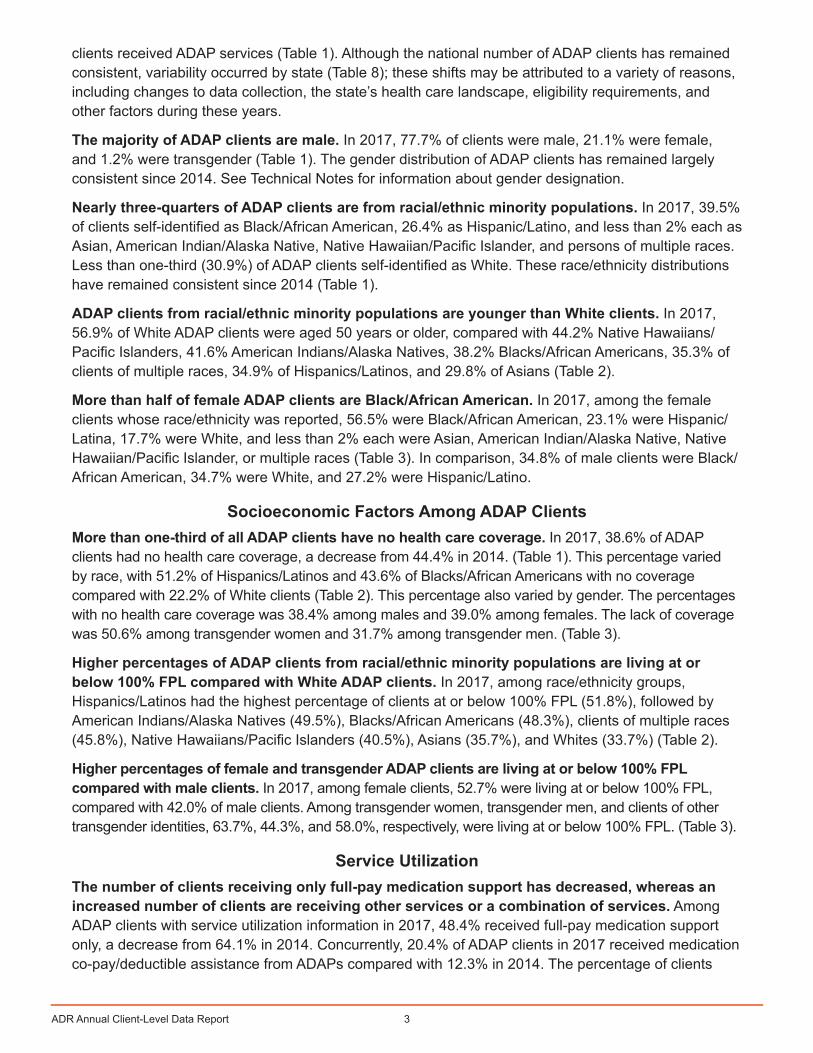
clients received ADAP services (Table 1). Although the national number of ADAP clients has remained consistent, variability occurred by state (Table 8); these shifts may be attributed to a variety of reasons, including changes to data collection, the state’s health care landscape, eligibility requirements, and other factors during these years.
The majority of ADAP clients are male. In 2017, 77.7% of clients were male, 21.1% were female, and 1.2% were transgender (Table 1). The gender distribution of ADAP clients has remained largely consistent since 2014. See Technical Notes for information about gender designation.
Nearly three-quarters of ADAP clients are from racial/ethnic minority populations. In 2017, 39.5% of clients self-identified as Black/African American, 26.4% as Hispanic/Latino, and less than 2% each as Asian, American Indian/Alaska Native, Native Hawaiian/Pacific Islander, and persons of multiple races. Less than one-third (30.9%) of ADAP clients self-identified as White. These race/ethnicity distributions have remained consistent since 2014 (Table 1).
ADAP clients from racial/ethnic minority populations are younger than White clients. In 2017, 56.9% of White ADAP clients were aged 50 years or older, compared with 44.2% Native Hawaiians/Pacific Islanders, 41.6% American Indians/Alaska Natives, 38.2% Blacks/African Americans, 35.3% of clients of multiple races, 34.9% of Hispanics/Latinos, and 29.8% of Asians (Table 2).
More than half of female ADAP clients are Black/African American. In 2017, among the female clients whose race/ethnicity was reported, 56.5% were Black/African American, 23.1% were Hispanic/Latina, 17.7% were White, and less than 2% each were Asian, American Indian/Alaska Native, Native Hawaiian/Pacific Islander, or multiple races (Table 3). In comparison, 34.8% of male clients were Black/African American, 34.7% were White, and 27.2% were Hispanic/Latino.
Socioeconomic Factors Among ADAP ClientsMore than one-third of all ADAP clients have no health care coverage. In 2017, 38.6% of ADAP clients had no health care coverage, a decrease from 44.4% in 2014. (Table 1). This percentage varied by race, with 51.2% of Hispanics/Latinos and 43.6% of Blacks/African Americans with no coverage compared with 22.2% of White clients (Table 2). This percentage also varied by gender. The percentages with no health care coverage was 38.4% among males and 39.0% among females. The lack of coverage was 50.6% among transgender women and 31.7% among transgender men. (Table 3).
Higher percentages of ADAP clients from racial/ethnic minority populations are living at or below 100% FPL compared with White ADAP clients. In 2017, among race/ethnicity groups, Hispanics/Latinos had the highest percentage of clients at or below 100% FPL (51.8%), followed by American Indians/Alaska Natives (49.5%), Blacks/African Americans (48.3%), clients of multiple races (45.8%), Native Hawaiians/Pacific Islanders (40.5%), Asians (35.7%), and Whites (33.7%) (Table 2).
Higher percentages of female and transgender ADAP clients are living at or below 100% FPL compared with male clients. In 2017, among female clients, 52.7% were living at or below 100% FPL, compared with 42.0% of male clients. Among transgender women, transgender men, and clients of other transgender identities, 63.7%, 44.3%, and 58.0%, respectively, were living at or below 100% FPL. (Table 3).
Service UtilizationThe number of clients receiving only full-pay medication support has decreased, whereas an increased number of clients are receiving other services or a combination of services. Among ADAP clients with service utilization information in 2017, 48.4% received full-pay medication support only, a decrease from 64.1% in 2014. Concurrently, 20.4% of ADAP clients in 2017 received medication co-pay/deductible assistance from ADAPs compared with 12.3% in 2014. The percentage of clients

4ADR Annual Client-Level Data Report
receiving multiple services also increased from 17.1% in 2014 to 26.1% in 2017 (Table 1). These changes may be attributed to changes in the health care landscape during this timeframe.
The use of full-pay medication services is higher among clients younger than age 50 years, and the number of medication co-pay/deductible services is higher among clients aged 50 years and older. In 2017, 69.9% of clients accessing full-pay medication services were younger than age 50. In comparison, among clients accessing medication co-pay/deductible services, 65.7% were aged 50 years and older. Clients receiving health care coverage premium assistance or receiving multiple services were distributed evenly between clients older and younger than 50 years of age (Table 7).
For each service type, distribution differs by HHS Region. In 2017, among clients receiving medication co-pay/deductible, the highest percentage were in Region 9 (27.7%; Arizona, California, Guam, Hawaii, and Nevada). Among ADAP clients receiving full-pay medication only, the highest percentage was in Region 4 (37.3%; Alabama, Florida, Georgia, Kentucky, Mississippi, North Carolina, South Carolina, and Tennessee). Region 4 also had the highest percentage (22.8%) of ADAP clients receiving multiple services compared with other regions. Among clients receiving insurance premium assistance, the highest percentage (23.3%) was in Region 2 (New Jersey, New York, Puerto Rico, and U.S. Virgin Islands) (Table 7).

5ADR Annual Client-Level Data Report
TECHNICAL NOTESThe AIDS Drug Assistance Program (ADAP) Data Report (ADR) is the U.S. Department of Health and Human Services (HHS), Health Resources and Services Administration (HRSA), HIV/AIDS Bureau’s (HAB) primary source of annual, client-level data to evaluate the impact of the ADAP program on a national level. The ADR allows HAB to characterize the individuals using the program, describe the ADAP-funded services being used, and delineate costs associated with these services [6].
The ADR was developed and implemented in 2013. To allow sufficient time for data quality assessment, ADR data included in this report begin with 2014. All Part B ADAP recipients are required to submit data to the ADR as a condition of the RWHAP Part B grant award. The ADR consists of two components: (1) the Recipient Report and (2) the Client Report. The Recipient Report is a collection of informationabout ADAP administration, funding, and policies. The Client Report (or client-level data) is a collectionof records that includes each ADAP client’s encrypted unique identifier (“eUCI”), basic demographic data,enrollment and certification information, and client-level data for clients enrolled during the calendar yearreporting period (January 1 to December 31) [6].
ADR data do not include information on non-ADAP RWHAP services, such as outpatient ambulatory health services, case management, or other services provided by RWHAP. Although the ADR may include RWHAP clients who received additional services, the ADR does not collect information to identify which clients overlap with other RWHAP services. Client-level data from these services are reported through another data system [5] and are published annually in the RWHAP Annual Client-Level Data Report.
Presentation of DataThe data in this report include information received by HRSA HAB for clients served by ADAP during calendar years 2014–2017. The purpose of the client demographics is to describe the sociodemographic characteristics of all clients enrolled in the ADAP, regardless of whether they received services (i.e., a client can be enrolled in ADAP but not use the service) [6].
• Tables 1–7: National-level data—Numbers and percentages of clients served by ADAP (non-RSR), presented by year, selected demographic stratifications, HHS region, and servicesreceived.
• Tables 8‒13: State-level data—Numbers and percentages of clients served by the ADAP (non-RSR) by state, presented by selected demographic stratifications
Tables 1‒8 display subtotals for each subpopulation and the overall totals. The subtotals are displayed to reflect the denominator used for the percentage calculation of each subpopulation. Because of missing data, the values in each column may not sum to the column total.
ADAP ClientsTo be eligible for enrollment in ADAP services, an ADAP client must have a diagnosis of HIV and a low income as defined by the state of residence. An ADAP client is any person who is certified as eligible to receive ADAP services, regardless of whether the person used ADAP services during the reporting period. During the reporting period, an ADAP client may have received medication assistance and/or health insurance assistance, been disenrolled, and/or been deemed eligible but did not receive any services. In the event of a funding shortage, clients may be placed on a waiting list (there are currently no ADAP waiting lists) [6].

6ADR Annual Client-Level Data Report
Age GroupADAP recipients are required to report the client’s year of birth. This information is used to calculate the client’s age during the designated year as a discrete variable. For tables displaying age groups (Tables 1–7), client ages were categorized to align with the Centers for Disease Control and Prevention’s (CDC) National HIV Surveillance System (NHSS) age group delineations. The age group delineations are as follow: <13, 13–14, 15–19, 20–24, 25–29, 30–34, 35–39, 40–44, 45–49, 50–54, 55–59, 60–64, and ≥65 years. In Table 9, client ages were categorized using broader age group delineations: <13, 13‒24, 25‒34, 35‒44, 45‒54, 55‒64, and ≥65 years.
Race/EthnicityRecipients report race/ethnicity information for ADAP clients according to the Office of Management and Budget (OMB) reporting standards. The OMB standards have five categories for race: American Indian or Alaska Native, Asian, Black or African American, Native Hawaiian or Other Pacific Islander, and White. Data on ethnicity have two categories: (1) Hispanic or Latino, and (2) not Hispanic or Latino. Race and ethnicity are submitted as separate variables and combined for analysis. The race/ethnicity variable is categorized as American Indian or Alaska Native, Asian, Black or African American, Hispanic or Latino, Native Hawaiian or other Pacific Islander, White, and “multiple races” (two or more categories of race reported).
In this report, clients categorized by race were not Hispanic or Latino; however, the number of clients reported in each race category may include clients whose ethnicity was not reported. ADAP recipients are expected to make every effort to obtain and report race and ethnicity, based on each client’s self-report. Self-identification is the preferred means of obtaining this information.
GenderGender-related data are based on client self-report. Gender designations in this report are male, female, or transgender. Transgender is an umbrella term used to identify people whose sex assigned at birth does not match their current gender identity or expression. Transgender clients are subsequently reported as transgender male to female (MTF), transgender female to male (FTM), or transgender unknown; the transgender unknown category may include transgender people who do not identify with these transgender variable options.
Federal Poverty LevelPoverty level characterizes the client’s annual household income as a percentage of the FPL at the end of the reporting period. The poverty levels were categorized as 0–100% FPL, 101–138% FPL, 139–250% FPL, 251–400% FPL, and >400% FPL.
Health Care CoverageADAP recipients are required to report all sources of health care coverage that each client had for any part of the reporting period, regardless of whether the ADAP paid for it. Health care coverage was categorized as private employer, private individual, Medicare, Medicaid, Medicare and Medicaid (dual eligibility), Veterans Administration, Indian Health Service, other plan, multiple coverages, and no coverage. The Medicaid classification also includes the Children’s Health Insurance Program (CHIP) and other public state health care coverage programs. The Medicare Part D classification is a stand-alone prescription drug coverage insurance and includes co-insurance, co-payment, or donut hole coverage.
ADAP ServicesADAP services include both medication assistance services and health care coverage premium and cost-sharing assistance services, which are provided to eligible clients enrolled in ADAP. All ADAP funds, regardless of their source (e.g., state funds, RWHAP Part B ADAP Base, RWHAP Part B Base,

7ADR Annual Client-Level Data Report
RWHAP Part B Supplemental Funding, ADAP Emergency Relief Funds, RWHAP Part A contributions, 340B rebates, ADAP Crisis Task Force Rebates), are reported in the ADR [6].
Medication assistance (i.e., full-pay medication support) is the use of ADAP funds to purchase FDA-approved medications for the treatment of HIV and the prevention and treatment of other opportunistic infections commonly associated with HIV/AIDS. In addition, other types of medications can be purchased by ADAP recipients using ADAP funding if those medications support a client’s retention in care (e.g., medication to treat hepatitis C).
Health care coverage assistance is the use of ADAP funds to pay for one or more of the following:
• Full premium payment
• Partial premium payment
• Medication co-pay/deductible (including Medicare Part D coinsurance, co-payment, or donut hole coverage)
A full premium payment is when the ADAP pays 100% of the client’s health insurance premium. A partial payment is when the ADAP pays a portion of the health insurance premium (i.e., <100%). A medication co-pay/deductible (including Medicare Part D-related costs) is when the ADAP pays the co-pay/deductible for the client’s HIV-related medication. Medication co-pays, deductibles, and coinsurance are considered health care coverage assistance services, not medication services [6].
RegionThe U.S. Department of Health and Human Services (HHS) uses 10 geographic designations for classifying regions of the United States that encompass all states and territories. The classification of states and territories within these regions is as follows:
• Region 1: Connecticut, Maine, Massachusetts, New Hampshire, Rhode Island, Vermont
• Region 2: New Jersey, New York, Puerto Rico, U.S. Virgin Islands
• Region 3: Delaware, District of Columbia, Maryland, Pennsylvania, Virginia, West Virginia
• Region 4: Alabama, Florida, Georgia, Kentucky, Mississippi, North Carolina, South Carolina, Tennessee
• Region 5: Illinois, Indiana, Michigan, Minnesota, Ohio, Wisconsin
• Region 6: Arkansas, Louisiana, New Mexico, Oklahoma, Texas
• Region 7: Iowa, Kansas, Missouri, Nebraska
• Region 8: Colorado, Montana, North Dakota, South Dakota, Utah, Wyoming
• Region 9: Arizona, California, Guam, Hawaii, Nevada
• Region 10: Alaska, Idaho, Oregon, Washington
The six U.S. Pacific jurisdictions are included in HHS Region 9; however, only Guam submits client-level data. The other jurisdictions, therefore, are not included in this report. Puerto Rico and the U.S. Virgin Islands are included in Region 2.
StateState data are displayed in Tables 8‒13. State-level analyses include data submitted for all RWHAP ADAP services. Clients receiving services in multiple states are not included in state-specific totals; these clients make up less than 2% of the total RWHAP population. In addition, data presented by state include data for all clients served by State ADAPs and are not separated by the type of ADAP-specific funding (i.e., RWHAP Part B, RWHAP Part B Supplemental, and ADAP Emergency Relief Funds).
8ADR Annual Client-Level Data Report
REFERENCES1. Health Resources and Services Administration (HRSA). 2019. Ryan White & Global HIV/AIDS
Program–A Living History. hab.hrsa.gov/livinghistory/index.htm. Accessed May 17, 2019.
2. HRSA. Ryan White HIV/AIDS Program AIDS Drug Assistance Program (ADAP) Manual 2016. January 2016. Available at www.targethiv.org/library/aids-drug-assistance-program-adap-manual.
3. U.S. Public Health Service. December 18, 2015; Amended January 28, 2016. The Ryan White HIV/AIDS Treatment Extension Act of 2009. “Title XXVI of the Public Health Service Act.” Available at hab.hrsa.gov/sites/default/files/hab/program-grants-management/legislationtitlexxvi.pdf.
4. NASTAD. 2018. 2018 Annual Report: National Ryan White HIV/AIDS Program Part B & ADAP Monitoring Project Annual Report. www.nastad.org/sites/default/files/Uploads/2018/2018-national-rwhap-partb-adap-monitoring-project-annual-report.pdf.
5. HRSA. 2018. Ryan White HIV/AIDS Program Annual Client-Level Data Report 2017. Available at hab.hrsa.gov/data/data-reports.
6. HRSA. 2019. AIDS Drug Assistance Program Data Report (ADR) Instruction Manual 2018. Available at www.targethiv.org/library/adr-instruction-manual.
9ADR Annual Client-Level Data Report
TABLES
2014 2015 2016 2017No. % No. % No. % No. %
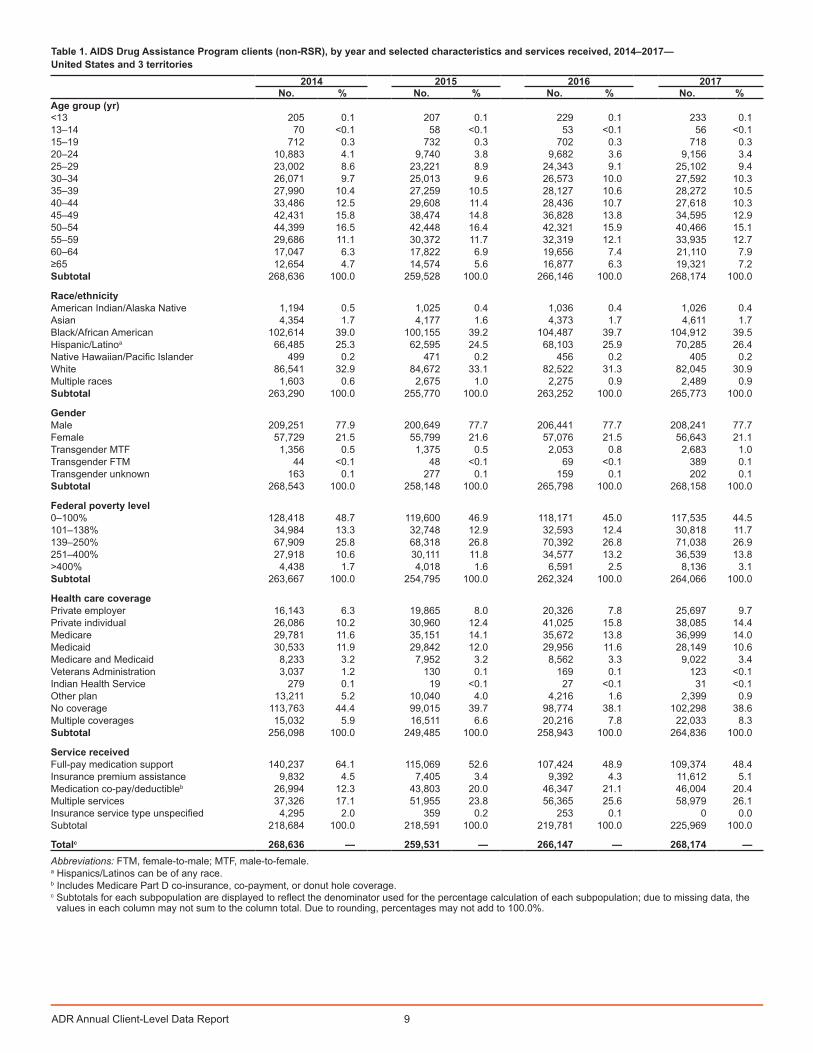
Age group (yr)<13 205 0.1 207 0.1 229 0.1 233 0.113–14 70 <0.1 58 <0.1 53 <0.1 56 <0.115–19 712 0.3 732 0.3 702 0.3 718 0.320–24 10,883 4.1 9,740 3.8 9,682 3.6 9,156 3.425–29 23,002 8.6 23,221 8.9 24,343 9.1 25,102 9.430–34 26,071 9.7 25,013 9.6 26,573 10.0 27,592 10.335–39 27,990 10.4 27,259 10.5 28,127 10.6 28,272 10.540–44 33,486 12.5 29,608 11.4 28,436 10.7 27,618 10.345–49 42,431 15.8 38,474 14.8 36,828 13.8 34,595 12.950–54 44,399 16.5 42,448 16.4 42,321 15.9 40,466 15.155–59 29,686 11.1 30,372 11.7 32,319 12.1 33,935 12.760–64 17,047 6.3 17,822 6.9 19,656 7.4 21,110 7.9≥65 12,654 4.7 14,574 5.6 16,877 6.3 19,321 7.2Subtotal 268,636 100.0 259,528 100.0 266,146 100.0 268,174 100.0
Race/ethnicityAmerican Indian/Alaska Native 1,194 0.5 1,025 0.4 1,036 0.4 1,026 0.4Asian 4,354 1.7 4,177 1.6 4,373 1.7 4,611 1.7Black/African American 102,614 39.0 100,155 39.2 104,487 39.7 104,912 39.5Hispanic/Latinoa 66,485 25.3 62,595 24.5 68,103 25.9 70,285 26.4Native Hawaiian/Pacific Islander 499 0.2 471 0.2 456 0.2 405 0.2White 86,541 32.9 84,672 33.1 82,522 31.3 82,045 30.9Multiple races 1,603 0.6 2,675 1.0 2,275 0.9 2,489 0.9Subtotal 263,290 100.0 255,770 100.0 263,252 100.0 265,773 100.0
GenderMale 209,251 77.9 200,649 77.7 206,441 77.7 208,241 77.7Female 57,729 21.5 55,799 21.6 57,076 21.5 56,643 21.1Transgender MTF 1,356 0.5 1,375 0.5 2,053 0.8 2,683 1.0Transgender FTM 44 <0.1 48 <0.1 69 <0.1 389 0.1Transgender unknown 163 0.1 277 0.1 159 0.1 202 0.1Subtotal 268,543 100.0 258,148 100.0 265,798 100.0 268,158 100.0
Federal poverty level0–100% 128,418 48.7 119,600 46.9 118,171 45.0 117,535 44.5101–138% 34,984 13.3 32,748 12.9 32,593 12.4 30,818 11.7139–250% 67,909 25.8 68,318 26.8 70,392 26.8 71,038 26.9251–400% 27,918 10.6 30,111 11.8 34,577 13.2 36,539 13.8>400% 4,438 1.7 4,018 1.6 6,591 2.5 8,136 3.1Subtotal 263,667 100.0 254,795 100.0 262,324 100.0 264,066 100.0
Health care coveragePrivate employer 16,143 6.3 19,865 8.0 20,326 7.8 25,697 9.7Private individual 26,086 10.2 30,960 12.4 41,025 15.8 38,085 14.4Medicare 29,781 11.6 35,151 14.1 35,672 13.8 36,999 14.0Medicaid 30,533 11.9 29,842 12.0 29,956 11.6 28,149 10.6Medicare and Medicaid 8,233 3.2 7,952 3.2 8,562 3.3 9,022 3.4Veterans Administration 3,037 1.2 130 0.1 169 0.1 123 <0.1Indian Health Service 279 0.1 19 <0.1 27 <0.1 31 <0.1Other plan 13,211 5.2 10,040 4.0 4,216 1.6 2,399 0.9No coverage 113,763 44.4 99,015 39.7 98,774 38.1 102,298 38.6Multiple coverages 15,032 5.9 16,511 6.6 20,216 7.8 22,033 8.3Subtotal 256,098 100.0 249,485 100.0 258,943 100.0 264,836 100.0
Service receivedFull-pay medication support 140,237 64.1 115,069 52.6 107,424 48.9 109,374 48.4Insurance premium assistance 9,832 4.5 7,405 3.4 9,392 4.3 11,612 5.1Medication co-pay/deductibleb 26,994 12.3 43,803 20.0 46,347 21.1 46,004 20.4Multiple services 37,326 17.1 51,955 23.8 56,365 25.6 58,979 26.1Insurance service type unspecified 4,295 2.0 359 0.2 253 0.1 0 0.0Subtotal 218,684 100.0 218,591 100.0 219,781 100.0 225,969 100.0
Totalc 268,636 — 259,531 — 266,147 — 268,174 —Abbreviations: FTM, female-to-male; MTF, male-to-female.a Hispanics/Latinos can be of any race. b Includes Medicare Part D co-insurance, co-payment, or donut hole coverage.c Subtotals for each subpopulation are displayed to reflect the denominator used for the percentage calculation of each subpopulation; due to missing data, the
values in each column may not sum to the column total. Due to rounding, percentages may not add to 100.0%.
Table 1. AIDS Drug Assistance Program clients (non-RSR), by year and selected characteristics and services received, 2014–2017— United States and 3 territories

10AD
R Annual C
lient-Level Data R
eport
Table 2. AIDS Drug Assistance Program clients (non-RSR), by race/ethnicity and selected characteristics, 2017—United States and 3 territories
American Indian/ Alaska Native Asian Black/
African American Hispanic/Latinoa Native Hawaiian/ Pacific Islander White Multiple races
No. % No. % No. % No. % No. % No. % No. %Age group (yr)<13 2 0.2 15 0.3 147 0.1 33 <0.1 0 0.0 28 <0.1 3 0.113–14 0 0.0 2 <0.1 40 <0.1 8 <0.1 0 0.0 4 <0.1 0 0.015–19 2 0.2 14 0.3 396 0.4 198 0.3 2 0.5 85 0.1 14 0.620–24 28 2.7 185 4.0 5,185 4.9 2,208 3.1 10 2.5 1,300 1.6 153 6.125–29 94 9.2 506 11.0 13,233 12.6 6,121 8.7 30 7.4 4,553 5.5 324 13.030–34 105 10.2 609 13.2 12,314 11.7 7,988 11.4 44 10.9 5,956 7.3 297 11.935–39 114 11.1 629 13.6 10,854 10.3 9,322 13.3 46 11.4 6,679 8.1 280 11.240–44 105 10.2 651 14.1 10,224 9.7 9,527 13.6 49 12.1 6,527 8.0 238 9.645–49 150 14.6 624 13.5 12,519 11.9 10,414 14.8 45 11.1 10,225 12.5 301 12.150–54 167 16.3 522 11.3 14,344 13.7 10,184 14.5 76 18.8 14,536 17.7 330 13.355–59 126 12.3 351 7.6 11,808 11.3 7,239 10.3 49 12.1 13,852 16.9 272 10.960–64 75 7.3 239 5.2 7,598 7.2 3,975 5.7 28 6.9 8,888 10.8 165 6.6≥65 58 5.7 264 5.7 6,250 6.0 3,068 4.4 26 6.4 9,412 11.5 112 4.5Subtotal 1,026 100.0 4,611 100.0 104,912 100.0 70,285 100.0 405 100.0 82,045 100.0 2,489 100.0
GenderMale 803 78.3 3,762 81.6 71,767 68.4 56,255 80.0 319 78.8 71,572 87.2 2,008 80.7Female 209 20.4 782 17.0 31,659 30.2 12,934 18.4 73 18.0 9,945 12.1 427 17.2Transgender 14 1.4 66 1.4 1,479 1.4 1,092 1.6 13 3.2 524 0.6 54 2.2Subtotal 1,026 100.0 4,610 100.0 104,905 100.0 70,281 100.0 405 100.0 82,041 100.0 2,489 100.0
Federal poverty level0–100% 495 49.5 1,627 35.7 49,633 48.3 36,030 51.8 162 40.5 27,365 33.7 1,119 45.8101–138% 125 12.5 468 10.3 11,523 11.2 7,645 11.0 34 8.5 10,451 12.9 297 12.2139–250% 247 24.7 1,360 29.8 25,787 25.1 16,499 23.7 107 26.8 25,833 31.9 640 26.2251–400% 117 11.7 851 18.7 13,115 12.8 7,728 11.1 73 18.3 13,992 17.3 323 13.2>400% 17 1.7 254 5.6 2,650 2.6 1,592 2.3 24 6.0 3,441 4.2 65 2.7Subtotal 1,001 100.0 4,560 100.0 102,708 100.0 69,494 100.0 400 100.0 81,082 100.0 2,444 100.0
Health care coveragePrivate employer 86 8.5 680 14.9 9,727 9.4 5,857 8.4 67 17.0 8,800 10.8 282 11.5Private individual 119 11.8 831 18.2 15,286 14.8 6,922 9.9 74 18.7 13,976 17.2 684 27.8Medicare 155 15.4 452 9.9 10,901 10.6 4,607 6.6 60 15.2 20,349 25.1 302 12.3Medicaid 167 16.6 357 7.8 9,846 9.5 10,327 14.8 35 8.9 6,944 8.5 262 10.6Medicare and Medicaid 60 5.9 59 1.3 3,000 2.9 1,721 2.5 9 2.3 3,973 4.9 134 5.4Veterans Administration 1 0.1 1 <0.1 53 0.1 6 <0.1 1 0.3 58 0.1 3 0.1Indian Health Service 24 2.4 0 0.0 1 <0.1 2 <0.1 0 0.0 1 <0.1 3 0.1Other plan 6 0.6 73 1.6 1,130 1.1 689 1.0 2 0.5 383 0.5 3 0.1No coverage 217 21.5 1,737 38.0 44,961 43.6 35,653 51.2 117 29.6 18,002 22.2 514 20.9Multiple coverages 174 17.2 386 8.4 8,224 8.0 3,910 5.6 30 7.6 8,740 10.8 274 11.1Subtotal 1,009 100.0 4,576 100.0 103,129 100.0 69,694 100.0 395 100.0 81,226 100.0 2,461 100.0
Totalb 1,026 — 4,611 — 104,912 — 70,285 — 405 — 82,045 — 2,489 —a Hispanics/Latinos can be of any race. b Subtotals for each subpopulation are displayed to reflect the denominator used for the percentage calculation of each subpopulation; due to missing data, the values in each column may not sum to the
column total. Due to rounding, percentages may not add to 100.0%.

11AD
R Annual C
lient-Level Data R
eport
Table 3. AIDS Drug Assistance Program clients (non-RSR), by gender and selected characteristics, 2017—United States and 3 territories
Male Female Transgender MTF Transgender FTM Transgender unknown Totala
No. % No. % No. % No. % No. % No. %Age group (yr)<13 109 0.1 122 0.2 * * * * * * 231 0.113–14 22 <0.1 34 0.1 * * * * * * 56 <0.115–19 478 0.2 227 0.4 9 0.3 4 1.0 0 0.0 718 0.320–24 7,677 3.7 1,291 2.3 156 5.8 18 4.6 13 6.4 9,155 3.425–29 21,612 10.4 2,961 5.2 456 17.0 36 9.3 37 18.3 25,102 9.430–34 22,756 10.9 4,318 7.6 434 16.2 35 9.0 48 23.8 27,591 10.335–39 21,520 10.3 6,260 11.1 407 15.2 52 13.4 30 14.9 28,269 10.540–44 19,738 9.5 7,459 13.2 363 13.5 35 9.0 21 10.4 27,616 10.345–49 25,523 12.3 8,701 15.4 307 11.4 44 11.3 17 8.4 34,592 12.950–54 31,261 15.0 8,876 15.7 271 10.1 41 10.5 15 7.4 40,464 15.155–59 26,348 12.7 7,365 13.0 156 5.8 59 15.2 7 3.5 33,935 12.760–64 16,217 7.8 4,779 8.4 70 2.6 33 8.5 8 4.0 21,107 7.9≥65 14,980 7.2 4,250 7.5 53 2.0 31 8.0 6 3.0 19,320 7.2Subtotal 208,241 100.0 56,643 100.0 2,682 100.0 388 100.0 202 100.0 268,156 100.0
Race/ethnicityAmerican Indian/Alaska Native 803 0.4 209 0.4 9 0.3 2 0.5 3 1.5 1,026 0.4Asian 3,762 1.8 782 1.4 52 1.9 6 1.6 8 4.1 4,610 1.7Black/African American 71,767 34.8 31,659 56.5 1,255 47.0 140 37.1 84 42.9 104,905 39.5Hispanic/Latinob 56,255 27.2 12,934 23.1 931 34.9 85 22.5 76 38.8 70,281 26.4Native Hawaiian/Pacific Islander 319 0.2 73 0.1 11 0.4 2 0.5 0 0.0 405 0.2White 71,572 34.7 9,945 17.7 360 13.5 139 36.9 25 12.8 82,041 30.9Multiple races 2,008 1.0 427 0.8 51 1.9 3 0.8 0 0.0 2,489 0.9Subtotal 206,486 100.0 56,029 100.0 2,669 100.0 377 100.0 196 100.0 265,757 100.0
Federal poverty level0–100% 86,180 42.0 29,375 52.7 1,688 63.7 170 44.3 116 58.0 117,529 44.5101–138% 24,066 11.7 6,378 11.4 277 10.5 78 20.3 16 8.0 30,815 11.7139–250% 57,790 28.2 12,626 22.7 488 18.4 89 23.2 43 21.5 71,036 26.9251–400% 30,239 14.7 6,067 10.9 169 6.4 37 9.6 23 11.5 36,535 13.8>400% 6,812 3.3 1,285 2.3 26 1.0 10 2.6 2 1.0 8,135 3.1Subtotal 205,087 100.0 55,731 100.0 2,648 100.0 384 100.0 200 100.0 264,050 100.0
Health care coveragePrivate employer 20,420 9.9 5,022 9.0 175 6.7 67 18.8 13 6.6 25,697 9.7Private individual 30,203 14.7 7,448 13.3 380 14.6 39 10.9 13 6.6 38,083 14.4Medicare 31,277 15.2 5,465 9.8 181 7.0 61 17.1 13 6.6 36,997 14.0Medicaid 19,182 9.3 8,557 15.3 353 13.6 39 10.9 14 7.1 28,145 10.6Medicare and Medicaid 6,742 3.3 2,183 3.9 72 2.8 17 4.8 6 3.0 9,020 3.4Veterans Administration 102 <0.1 19 <0.1 2 0.1 0 0.0 0 0.0 123 <0.1Indian Health Service 24 <0.1 7 <0.1 0 0.0 0 0.0 0 0.0 31 <0.1Other plan 1,844 0.9 548 1.0 1 <0.1 0 0.0 6 3.0 2,399 0.9No coverage 78,923 38.4 21,829 39.0 1,314 50.6 113 31.7 114 57.6 102,293 38.6Multiple coverages 16,958 8.2 4,915 8.8 119 4.6 21 5.9 19 9.6 22,032 8.3Subtotal 205,675 100.0 55,993 100.0 2,597 100.0 357 100.0 198 100.0 264,820 100.0
Totalc 208,241 — 56,643 — 2,683 — 389 — 202 — 268,158 —Abbreviations: FTM, female-to-male; MTF, male-to-female.* To ensure confidentiality, data have been suppressed. a Row totals include clients in the specified subpopulation with reported gender information. b Hispanics/Latinos can be of any race. c Subtotals for each subpopulation are displayed to reflect the denominator used for the percentage calculation of each subpopulation; due to missing data, the values in each column may not sum to the
column total. Due to rounding, percentages may not add to 100.0%.

12AD
R Annual C
lient-Level Data R
eport
Table 4. AIDS Drug Assistance Program clients (non-RSR), by federal poverty level and selected characteristics, 2017—United States and 3 territories0–100% FPL 101–138% FPL 139–250% FPL 251–400% FPL >400% FPL
No. % No. % No. % No. % No. %Age group (yr)<13 104 0.1 17 0.1 52 0.1 40 0.1 16 0.213–14 30 <0.1 2 <0.1 10 <0.1 8 <0.1 3 <0.115–19 504 0.4 54 0.2 97 0.1 37 0.1 11 0.120–24 5,288 4.5 931 3.0 1,971 2.8 639 1.7 73 0.925–29 12,344 10.5 2,326 7.5 6,311 8.9 3,089 8.5 488 6.030–34 13,128 11.2 2,467 8.0 6,614 9.3 4,026 11.0 748 9.235–39 13,783 11.7 2,824 9.2 6,610 9.3 3,721 10.2 854 10.540–44 13,232 11.3 2,956 9.6 6,585 9.3 3,597 9.8 858 10.545–49 15,709 13.4 3,791 12.3 8,548 12.0 4,874 13.3 1,161 14.350–54 17,460 14.9 4,825 15.7 10,455 14.7 5,828 16.0 1,364 16.855–59 13,329 11.3 4,417 14.3 9,853 13.9 4,814 13.2 1,108 13.660–64 7,274 6.2 3,092 10.0 6,808 9.6 2,997 8.2 744 9.1≥65 5,350 4.6 3,116 10.1 7,124 10.0 2,869 7.9 708 8.7Subtotal 117,535 100.0 30,818 100.0 71,038 100.0 36,539 100.0 8,136 100.0
Health care coveragePrivate employer 2,529 2.2 1,190 3.9 8,612 12.2 10,577 29.1 2,302 28.4Private individual 11,585 9.9 3,369 11.0 12,329 17.4 8,420 23.2 2,318 28.6Medicare 8,696 7.4 8,431 27.5 15,200 21.5 3,618 9.9 913 11.3Medicaid 22,185 18.9 1,823 5.9 2,950 4.2 981 2.7 132 1.6Medicare and Medicaid 4,955 4.2 2,296 7.5 1,499 2.1 233 0.6 25 0.3Veterans Administration 38 <0.1 38 0.1 27 <0.1 20 0.1 0 0.0Indian Health Service 23 <0.1 2 <0.1 5 <0.1 1 <0.1 0 0.0Other plan 1,453 1.2 158 0.5 414 0.6 292 0.8 66 0.8No coverage 60,246 51.4 11,046 36.0 22,107 31.2 6,895 19.0 1,241 15.3Multiple coverages 5,434 4.6 2,340 7.6 7,638 10.8 5,332 14.7 1,095 13.5Subtotal 117,144 100.0 30,693 100.0 70,781 100.0 36,369 100.0 8,092 100.0
Totala 117,535 — 30,818 — 71,038 — 36,539 — 8,136 —Abbreviation: FPL, federal poverty level.a Subtotals for each subpopulation are displayed to reflect the denominator used for the percentage calculation of each subpopulation; due to missing data, the values in each column may not sum to the
column total. Due to rounding, percentages may not add to 100.0%.

13AD
R Annual C
lient-Level Data R
eport
Table 5. AIDS Drug Assistance Program clients (non-RSR), by health care coverage and selected characteristics, 2017—United States and 3 territories
Private employer
Private individual Medicare Medicaid Medicare &
MedicaidVeterans
AdministrationIndian Health
Service Other plan No coverage Multiple coverages
No. % No. % No. % No. % No. % No. % No. % No. % No. % No. %Age group (year)<13 57 0.2 21 0.1 1 <0.1 43 0.2 0 0.0 0 0.0 0 0.0 0 0.0 87 0.1 21 0.113–14 12 <0.1 5 <0.1 0 0.0 13 <0.1 0 0.0 0 0.0 0 0.0 1 <0.1 17 <0.1 7 <0.115–19 53 0.2 48 0.1 0 0.0 161 0.6 1 <0.1 0 0.0 0 0.0 12 0.5 399 0.4 35 0.220–24 744 2.9 1,054 2.8 24 0.1 1,129 4.0 28 0.3 4 3.3 1 3.2 80 3.3 5,498 5.4 415 1.925–29 2,502 9.7 3,647 9.6 172 0.5 2,797 9.9 96 1.1 6 4.9 4 12.9 224 9.3 13,804 13.5 1,415 6.430–34 2,828 11.0 4,193 11.0 384 1.0 2,861 10.2 165 1.8 5 4.1 3 9.7 263 11.0 14,606 14.3 1,794 8.135–39 2,817 11.0 4,408 11.6 849 2.3 3,099 11.0 315 3.5 5 4.1 7 22.6 259 10.8 14,214 13.9 1,861 8.440–44 2,810 10.9 4,337 11.4 1,362 3.7 2,987 10.6 484 5.4 6 4.9 4 12.9 279 11.6 13,006 12.7 2,014 9.145–49 3,682 14.3 5,577 14.6 3,073 8.3 3,785 13.4 971 10.8 13 10.6 6 19.4 361 15.0 13,919 13.6 2,754 12.550–54 4,376 17.0 6,384 16.8 6,079 16.4 4,655 16.5 1,844 20.4 18 14.6 5 16.1 333 13.9 12,721 12.4 3,643 16.555–59 3,507 13.6 4,976 13.1 7,441 20.1 3,813 13.5 1,934 21.4 17 13.8 1 3.2 290 12.1 8,347 8.2 3,295 15.060–64 1,933 7.5 2,910 7.6 5,967 16.1 2,113 7.5 1,456 16.1 31 25.2 0 0.0 142 5.9 4,144 4.1 2,260 10.3≥65 376 1.5 525 1.4 11,647 31.5 693 2.5 1,728 19.2 18 14.6 0 0.0 155 6.5 1,536 1.5 2,519 11.4Totala 25,697 100.0 38,085 100.0 36,999 100.0 28,149 100.0 9,022 100.0 123 100.0 31 100.0 2,399 100.0 102,298 100.0 22,033 100.0a Subtotals for each subpopulation are displayed to reflect the denominator used for the percentage calculation of each subpopulation; due to missing data, the values in each column may not sum to the column total.
Due to rounding, percentages may not add to 100.0%.

14AD
R Annual C
lient-Level Data R
eport
Table 6. AIDS Drug Assistance Program clients (non-RSR), by HHS region and selected characteristics, 2017—United States and 3 territories
Region 1 Region 2 Region 3 Region 4 Region 5 Region 6 Region 7 Region 8 Region 9 Region 10No. % No. % No. % No. % No. % No. % No. % No. % No. % No. %
Age group (yr)<13 18 0.1 19 0.1 28 0.1 36 0.1 64 0.2 17 0.1 11 0.1 31 0.4 5 <0.1 4 <0.113–14 9 0.1 9 <0.1 3 <0.1 10 <0.1 13 <0.1 3 <0.1 2 <0.1 4 0.1 3 <0.1 0 0.015–19 27 0.2 97 0.3 61 0.2 204 0.3 143 0.5 84 0.3 31 0.4 29 0.4 27 0.1 15 0.220–24 215 1.7 756 2.1 752 2.8 3,460 5.0 1,132 3.8 1,358 4.4 401 5.2 201 2.7 765 2.0 116 1.325–29 571 4.4 2,605 7.2 2,334 8.7 8,496 12.4 2,963 9.9 3,705 11.9 927 12.0 588 7.9 2,441 6.3 472 5.530–34 718 5.6 3,165 8.8 2,490 9.3 8,417 12.3 3,051 10.2 4,020 12.9 951 12.3 749 10.1 3,367 8.7 664 7.735–39 1,020 7.9 3,506 9.7 2,503 9.4 7,760 11.3 3,052 10.2 4,013 12.9 929 12.0 903 12.1 3,762 9.7 824 9.540–44 1,119 8.7 3,588 9.9 2,475 9.3 7,288 10.6 3,013 10.1 3,765 12.1 882 11.4 824 11.1 3,817 9.8 847 9.845–49 1,699 13.2 4,715 13.0 3,295 12.3 9,078 13.2 3,730 12.5 3,952 12.7 1,021 13.2 1,022 13.7 4,862 12.5 1,221 14.150–54 2,320 18.0 5,896 16.3 4,075 15.3 9,849 14.4 4,544 15.2 4,012 12.9 1,030 13.3 1,156 15.5 6,100 15.7 1,484 17.255–59 2,238 17.3 5,245 14.5 3,726 14.0 7,377 10.8 3,822 12.8 3,111 10.0 833 10.8 936 12.6 5,330 13.7 1,317 15.260–64 1,562 12.1 3,415 9.4 2,471 9.3 4,058 5.9 2,323 7.8 1,807 5.8 430 5.6 522 7.0 3,691 9.5 831 9.6≥65 1,388 10.8 3,149 8.7 2,496 9.3 2,559 3.7 2,051 6.9 1,331 4.3 290 3.7 474 6.4 4,732 12.2 851 9.8Subtotal 12,904 100.0 36,165 100.0 26,709 100.0 68,592 100.0 29,901 100.0 31,178 100.0 7,738 100.0 7,439 100.0 38,902 100.0 8,646 100.0
Race/ethnicityAmerican Indian/Alaska Native 49 0.4 44 0.1 36 0.1 142 0.2 133 0.4 174 0.6 47 0.6 163 2.2 147 0.4 91 1.1Asian 206 1.6 640 1.8 300 1.1 441 0.6 498 1.7 356 1.2 119 1.5 129 1.7 1,660 4.3 262 3.1Black/African American 3,632 28.5 10,692 30.5 15,720 59.2 39,251 57.5 12,794 43.0 12,401 40.1 3,098 40.0 1,280 17.3 4,956 12.8 1,088 12.8Hispanic/Latinoa 3,311 26.0 17,466 49.8 3,152 11.9 10,695 15.7 4,371 14.7 9,867 31.9 853 11.0 1,867 25.2 17,101 44.1 1,602 18.8Native Hawaiian/Pacific Islander 29 0.2 10 <0.1 12 <0.1 48 0.1 24 0.1 16 0.1 12 0.2 16 0.2 194 0.5 44 0.5White 5,372 42.2 6,113 17.4 6,837 25.7 17,286 25.3 11,653 39.1 7,915 25.6 3,457 44.7 3,750 50.6 14,373 37.1 5,289 62.2Multiple races 127 1.0 97 0.3 511 1.9 421 0.6 311 1.0 177 0.6 152 2.0 200 2.7 360 0.9 133 1.6Subtotal 12,726 100.0 35,062 100.0 26,568 100.0 68,284 100.0 29,784 100.0 30,906 100.0 7,738 100.0 7,405 100.0 38,791 100.0 8,509 100.0
GenderMale 8,863 68.7 26,479 73.2 19,098 71.5 51,971 75.8 23,583 78.9 24,246 77.8 6,237 80.6 6,076 81.7 34,323 88.2 7,365 85.2Female 3,672 28.5 9,521 26.3 7,351 27.5 15,708 22.9 5,840 19.5 6,648 21.3 1,385 17.9 1,278 17.2 4,067 10.5 1,173 13.6Transgender 363 2.8 162 0.4 260 1.0 913 1.3 478 1.6 284 0.9 116 1.5 85 1.1 505 1.3 108 1.2Subtotal 12,898 100.0 36,162 100.0 26,709 100.0 68,592 100.0 29,901 100.0 31,178 100.0 7,738 100.0 7,439 100.0 38,895 100.0 8,646 100.0
Federal poverty level0–100% 5,931 46.3 16,527 47.4 9,205 34.6 36,033 53.8 12,298 42.2 15,174 48.8 3,446 44.6 3,218 43.9 12,904 33.2 2,799 32.6101–138% 1,616 12.6 2,921 8.4 3,076 11.6 8,026 12.0 3,603 12.4 4,494 14.5 827 10.7 844 11.5 4,218 10.8 1,193 13.9139–250% 2,954 23.1 7,583 21.7 7,170 26.9 16,434 24.5 8,689 29.8 9,452 30.4 2,173 28.1 1,826 24.9 12,297 31.6 2,460 28.6251–400% 1,831 14.3 6,265 18.0 5,259 19.8 5,991 8.9 4,022 13.8 1,854 6.0 1,211 15.7 1,157 15.8 7,099 18.3 1,850 21.5>400% 482 3.8 1,581 4.5 1,909 7.2 507 0.8 549 1.9 108 0.3 74 1.0 278 3.8 2,362 6.1 286 3.3Subtotal 12,814 100.0 34,877 100.0 26,619 100.0 66,991 100.0 29,161 100.0 31,082 100.0 7,731 100.0 7,323 100.0 38,880 100.0 8,588 100.0
Health care coveragePrivate employer 787 6.2 6,273 17.5 1,022 3.9 3,683 5.5 3,593 12.0 1,826 5.9 1,165 15.1 1,210 16.5 4,493 11.6 1,645 19.9Private individual 1,181 9.4 313 0.9 7,875 29.7 11,000 16.4 3,371 11.3 2,845 9.2 3,059 39.6 1,046 14.3 6,227 16.0 1,168 14.1Medicare 773 6.1 2,895 8.1 4,665 17.6 4,945 7.4 4,271 14.3 4,601 14.8 546 7.1 1,407 19.2 10,776 27.7 2,120 25.7Medicaid 3,807 30.2 8,008 22.4 2,386 9.0 2,790 4.2 6,193 20.8 827 2.7 382 4.9 1,879 25.7 732 1.9 1,145 13.9Medicare and Medicaid 1,827 14.5 2,209 6.2 810 3.1 168 0.3 2,299 7.7 54 0.2 284 3.7 109 1.5 228 0.6 1,034 12.5Veterans Administration 10 <0.1 0 0.0 19 0.1 39 0.1 16 0.1 1 <0.1 11 0.1 8 0.1 4 <0.1 15 0.2Indian Health Service 0 0.0 1 <0.1 0 0.0 1 <0.1 0 0.0 8 <0.1 0 0.0 12 0.2 8 <0.1 1 <0.1Other plan 23 0.2 1,858 5.2 273 1.0 76 0.1 113 0.4 2 <0.1 8 0.1 29 0.4 14 <0.1 3 <0.1No coverage 1,286 10.2 8,767 24.5 5,211 19.7 42,499 63.5 6,460 21.7 20,184 64.9 1,125 14.6 938 12.8 15,079 38.8 749 9.1Multiple coverages 2,906 23.1 5,421 15.2 4,249 16.0 1,690 2.5 3,508 11.8 738 2.4 1,151 14.9 677 9.3 1,318 3.4 375 4.5Subtotal 12,600 100.0 35,745 100.0 26,510 100.0 66,891 100.0 29,824 100.0 31,086 100.0 7,731 100.0 7,315 100.0 38,879 100.0 8,255 100.0
Totalb 12,904 — 36,165 — 26,709 — 68,592 — 29,901 — 31,178 — 7,738 — 7,439 — 38,902 — 8,646 —Note: See Technical Notes for the states/territories included in each region.a Hispanics/Latinos can be of any race. b Subtotals for each subpopulation are displayed to reflect the denominator used for the percentage calculation of each subpopulation; due to missing data, the values in each column may not sum to the column total.
Due to rounding, percentages may not add to 100.0%.

15ADR Annual Client-Level Data Report
Table 7. AIDS Drug Assistance Program clients (non-RSR), by service received and selected characteristics, 2017—United States and 3 territories
Full-pay medication Insurance premium assistance
Medication co-pay/ deductiblea Multiple services
Total No. No. % No. % No. % No. %
Age group (yr)<13 80 0.1 1 <0.1 47 0.1 37 0.1 16513–14 25 <0.1 1 <0.1 10 <0.1 8 <0.1 4415–19 398 0.4 8 0.1 62 0.1 45 0.1 51320–24 5,173 4.7 167 1.4 713 1.5 1,231 2.1 7,28425–29 13,342 12.2 778 6.7 1,817 3.9 4,506 7.6 20,44330–34 14,306 13.1 988 8.5 2,331 5.1 5,341 9.1 22,96635–39 14,485 13.2 1,099 9.5 2,663 5.8 5,624 9.5 23,87140–44 13,598 12.4 1,025 8.8 3,103 6.7 5,928 10.1 23,65445–49 15,050 13.8 1,604 13.8 5,050 11.0 7,777 13.2 29,48150–54 14,671 13.4 2,015 17.4 7,855 17.1 9,794 16.6 34,33555–59 10,267 9.4 1,755 15.1 8,085 17.6 8,622 14.6 28,72960–64 5,356 4.9 1,218 10.5 5,980 13.0 5,531 9.4 18,085≥65 2,623 2.4 953 8.2 8,288 18.0 4,535 7.7 16,399Subtotal 109,374 100.0 11,612 100.0 46,004 100.0 58,979 100.0 225,969
Race/ethnicityAmerican Indian/Alaska Native 246 0.2 67 0.6 199 0.4 221 0.4 733Asian 1,691 1.6 270 2.4 862 1.9 1,123 1.9 3,946Black/African American 46,197 42.7 3,126 27.4 15,243 33.3 21,988 37.5 86,554Hispanic/Latinob 41,479 38.4 2,343 20.5 8,036 17.6 10,395 17.7 62,253Native Hawaiian/Pacific Islander 107 0.1 25 0.2 110 0.2 92 0.2 334White 17,896 16.5 5,458 47.8 20,831 45.6 23,845 40.7 68,030Multiple races 517 0.5 139 1.2 443 1.0 934 1.6 2,033Subtotal 108,133 100.0 11,428 100.0 45,724 100.0 58,598 100.0 223,883
GenderMale 82,741 75.7 9,560 82.3 37,072 80.6 46,870 79.5 176,243Female 25,280 23.1 1,942 16.7 8,658 18.8 11,328 19.2 47,208Transgender MTF 1,125 1.0 85 0.7 235 0.5 587 1.0 2,032Transgender FTM 97 0.1 12 0.1 26 0.1 166 0.3 301Transgender unknown 125 0.1 12 0.1 7 <0.1 26 <0.1 170Subtotal 109,368 100.0 11,611 100.0 45,998 100.0 58,977 100.0 225,954
Federal poverty level0–100% 66,143 61.4 2,649 23.0 10,563 23.0 15,399 26.3 94,754101–138% 11,460 10.6 1,372 11.9 6,454 14.1 6,337 10.8 25,623139–250% 21,938 20.4 4,262 37.1 15,772 34.4 21,401 36.6 63,373251–400% 6,936 6.4 2,701 23.5 10,408 22.7 12,695 21.7 32,740>400% 1,247 1.2 509 4.4 2,716 5.9 2,655 4.5 7,127Subtotal 107,724 100.0 11,493 100.0 45,913 100.0 58,487 100.0 223,617
HHS RegionRegion 1 1,051 1.0 591 5.1 4,713 10.2 3,009 5.1 9,364Region 2 21,189 19.4 2,709 23.3 3,595 7.8 6,925 11.7 34,418Region 3 6,331 5.8 893 7.7 3,881 8.4 9,672 16.4 20,777Region 4 40,814 37.3 1,379 11.9 6,823 14.8 13,466 22.8 62,482Region 5 5,616 5.1 2,017 17.4 3,737 8.1 7,578 12.8 18,948Region 6 18,604 17.0 627 5.4 4,170 9.1 3,266 5.5 26,667Region 7 928 0.8 276 2.4 2,153 4.7 3,648 6.2 7,005Region 8 1,035 0.9 175 1.5 2,351 5.1 2,183 3.7 5,744Region 9 13,311 12.2 922 7.9 12,752 27.7 7,156 12.1 34,141Region 10 495 0.5 2,023 17.4 1,829 4.0 2,076 3.5 6,423
Totalc 109,374 — 11,612 — 46,004 — 58,979 — 225,969Abbreviations: FTM, female-to-male; MTF, male-to-female.Note: Percentages shown are based on the row total.a Includes Medicare Part D co-insurance, co-payment, or donut hole coverage.b Hispanics/Latinos can be of any race. c Subtotals for each subpopulation are displayed to reflect the denominator used for the percentage calculation of each subpopulation; due to missing data, the
values in each column may not sum to the column total. Due to rounding, percentages may not add to 100.0%.
16ADR Annual Client-Level Data Report
Table 8. AIDS Drug Assistance Program clients (non-RSR), by year and state, 2014–2017—United States and 3 territories
2014 2015 2016 2017StateAlabama 2,854 2,697 3,101 3,468Alaska 144 142 109 90Arizona 3,044 2,444 2,706 2,992Arkansas 1,076 975 1,246 1,202California 39,344 35,631 33,135 33,303Colorado 4,301 4,532 4,966 5,293Connecticut 2,815 2,580 2,366 2,332Delaware 1,443 1,669 1,925 1,814District of Columbia 1,399 1,426 1,511 1,435Florida 23,057 19,733 22,634 24,212Georgia 10,103 10,242 11,009 11,759Hawaii 489 406 399 427Idaho 255 233 323 343Illinois 10,418 10,522 11,307 12,353Indiana 3,071 3,265 3,422 3,204Iowa 718 489 559 646Kansas 1,555 1,611 1,574 1,591Kentucky 2,054 3,358 3,453 3,464Louisiana 7,450 7,706 8,042 4,625Maine 970 995 1,026 1,064Maryland 6,999 7,291 7,215 7,099Massachusetts 8,087 7,840 7,732 7,629Michigan 4,776 3,450 3,617 3,498Minnesota 3,136 3,235 3,474 3,756Mississippi 2,171 2,276 2,315 2,508Missouri 4,211 4,431 3,927 4,576Montana 314 347 363 368Nebraska 731 804 847 925Nevada 1,561 1,075 1,921 2,170New Hampshire 603 623 638 658New Jersey 7,352 6,629 6,223 6,367New Mexico 848 501 498 528New York 23,678 22,360 22,078 21,585North Carolina 9,189 9,321 9,741 10,314North Dakota 197 229 258 313Ohio 6,338 5,099 4,994 5,170Oklahoma 1,817 1,855 1,978 2,071Oregon 3,478 3,632 3,679 3,940Pennsylvania 8,176 8,454 8,036 8,123Rhode Island 1,020 798 829 791South Carolina 5,957 6,006 6,090 6,118South Dakota 264 299 315 353Tennessee 5,660 7,246 7,630 6,749Texas 22,500 22,522 22,487 22,752Utah 773 855 921 898Vermont 413 399 413 430Virginia 6,393 6,836 7,482 7,720Washington 3,855 3,785 4,093 4,273West Virginia 567 607 584 518Wisconsin 2,409 1,241 1,900 1,920Wyoming 150 154 201 214Subtotal 260,183 250,856 257,292 259,951
TerritoryGuam 5 12 13 10Puerto Rico 8,278 8,484 8,682 8,061U.S. Virgin Islands 170 179 160 152Subtotal 8,453 8,675 8,855 8,223
Total 268,636 259,531 266,147 268,174Note: Data are based on provider location. Clients receiving services in multiple states were not included in state-specific totals.

17AD
R Annual C
lient-Level Data R
eport
Table 9. AIDS Drug Assistance Program clients (non-RSR), by age group and state, 2017—United States and 3 territories
<13 yrs 13–24 yrs 25–34 yrs 35–44 yrs 45–54 yrs 55–64 yrs ≥65 yrs Total No. No. % No. % No. % No. % No. % No. % No. %
StateAlabama 0 0.0 264 7.6 1,117 32.2 874 25.2 773 22.3 391 11.3 49 1.4 3,468Alaska 0 0.0 1 1.1 11 12.2 16 17.8 32 35.6 25 27.8 5 5.6 90Arizona 2 0.1 96 3.2 471 15.7 592 19.8 836 27.9 677 22.6 318 10.6 2,992Arkansas 2 0.2 76 6.3 322 26.8 267 22.2 300 25.0 183 15.2 52 4.3 1,202California 0 0.0 608 1.8 4,859 14.6 6,469 19.4 9,398 28.2 7,810 23.5 4,159 12.5 33,303Colorado 15 0.3 155 2.9 936 17.7 1,140 21.5 1,571 29.7 1,091 20.6 385 7.3 5,293Connecticut 4 0.2 47 2.0 267 11.4 407 17.5 692 29.7 638 27.4 277 11.9 2,332Delaware 2 0.1 39 2.1 233 12.8 255 14.1 561 30.9 549 30.3 175 9.6 1,814District of Columbia 0 0.0 14 1.0 189 13.2 267 18.6 371 25.9 376 26.2 218 15.2 1,435Florida 9 <0.1 1,030 4.3 5,007 20.7 5,094 21.0 7,261 30.0 4,742 19.6 1,069 4.4 24,212Georgia 2 0.0 837 7.1 3,867 32.9 2,831 24.1 2,756 23.4 1,305 11.1 161 1.4 11,759Hawaii 0 0.0 14 3.3 37 8.7 65 15.2 106 24.8 127 29.7 78 18.3 427Idaho 0 0.0 17 5.0 72 21.0 81 23.6 82 23.9 66 19.2 25 7.3 343Illinois 15 0.1 594 4.8 2,625 21.2 2,626 21.3 3,383 27.4 2,383 19.3 727 5.9 12,353Indiana 1 <0.1 129 4.0 742 23.2 745 23.3 844 26.3 574 17.9 169 5.3 3,204Iowa 0 0.0 33 5.1 118 18.3 147 22.8 184 28.5 134 20.7 30 4.6 646Kansas 1 0.1 81 5.1 324 20.4 342 21.5 445 28.0 319 20.1 79 5.0 1,591Kentucky 8 0.2 108 3.1 645 18.6 746 21.5 1,027 29.6 729 21.0 201 5.8 3,464Louisiana 0 0.0 136 2.9 945 20.4 1,006 21.8 1,207 26.1 997 21.6 334 7.2 4,625Maine 8 0.8 23 2.2 86 8.1 195 18.3 334 31.4 314 29.5 104 9.8 1,064Maryland 13 0.2 136 1.9 1,035 14.6 1,361 19.2 1,977 27.8 1,770 24.9 807 11.4 7,099Massachusetts 3 <0.1 142 1.9 738 9.7 1,200 15.7 2,391 31.3 2,328 30.5 827 10.8 7,629Michigan 16 0.5 119 3.4 612 17.5 612 17.5 983 28.1 821 23.5 335 9.6 3,498Minnesota 24 0.6 149 4.0 681 18.1 795 21.2 1,076 28.6 760 20.2 271 7.2 3,756Mississippi 1 <0.1 243 9.7 749 29.9 625 24.9 554 22.1 267 10.6 69 2.8 2,508Missouri 4 0.1 281 6.1 1,250 27.3 1,074 23.5 1,181 25.8 646 14.1 140 3.1 4,576Montana 0 0.0 10 2.7 54 14.7 83 22.6 115 31.3 82 22.3 24 6.5 368Nebraska 6 0.6 39 4.2 186 20.1 248 26.8 241 26.1 164 17.7 41 4.4 925Nevada 3 0.1 76 3.5 438 20.2 451 20.8 620 28.6 405 18.7 177 8.2 2,170New Hampshire 3 0.5 13 2.0 73 11.1 125 19.0 220 33.4 175 26.6 49 7.4 658New Jersey 5 0.1 178 2.8 1,166 18.3 1,338 21.0 1,871 29.4 1,403 22.0 406 6.4 6,367New Mexico 3 0.6 13 2.5 79 15.0 100 18.9 142 26.9 150 28.4 41 7.8 528New York 5 <0.1 472 2.2 3,671 17.0 4,238 19.6 6,007 27.8 4,985 23.1 2,207 10.2 21,585North Carolina 1 <0.1 493 4.8 2,380 23.1 2,114 20.5 2,854 27.7 1,856 18.0 616 6.0 10,314North Dakota 5 1.6 18 5.8 72 23.0 78 24.9 84 26.8 45 14.4 11 3.5 313Ohio 3 0.1 191 3.7 961 18.6 934 18.1 1,466 28.4 1,201 23.2 414 8.0 5,170Oklahoma 0 0.0 71 3.4 474 22.9 461 22.3 609 29.4 376 18.2 80 3.9 2,071Oregon 3 0.1 57 1.4 538 13.7 764 19.4 1,258 31.9 953 24.2 367 9.3 3,940Pennsylvania 7 0.1 247 3.0 1,459 18.0 1,376 16.9 2,234 27.5 1,934 23.8 866 10.7 8,123Rhode Island 0 0.0 16 2.0 90 11.4 149 18.8 235 29.7 219 27.7 82 10.4 791South Carolina 6 0.1 337 5.5 1,421 23.2 1,266 20.7 1,813 29.6 1,053 17.2 222 3.6 6,118South Dakota 5 1.4 10 2.8 47 13.3 98 27.8 108 30.6 71 20.1 14 4.0 353Tennessee 9 0.1 362 5.4 1,727 25.6 1,498 22.2 1,889 28.0 1,092 16.2 172 2.5 6,749Texas 12 0.1 1,149 5.1 5,905 26.0 5,944 26.1 5,706 25.1 3,212 14.1 824 3.6 22,752Utah 1 0.1 36 4.0 199 22.0 277 30.8 243 27.1 117 13.0 25 2.8 898

18AD
R Annual C
lient-Level Data R
eport
Table 9. AIDS Drug Assistance Program clients (non-RSR), by age group and state, 2017—United States and 3 territories (cont.)
<13 yrs 13–24 yrs 25–34 yrs 35–44 yrs 45–54 yrs 55–64 yrs ≥65 yrs Total No. No. % No. % No. % No. % No. % No. % No. %
StateVermont 0 0.0 10 2.3 35 8.1 63 14.7 147 34.2 126 29.3 49 11.4 430Virginia 6 0.1 368 4.8 1,840 23.8 1,628 21.1 2,054 26.6 1,435 18.6 389 5.0 7,720Washington 1 <0.1 56 1.3 515 12.1 810 19.0 1,333 31.2 1,104 25.8 454 10.6 4,273West Virginia 0 0.0 12 2.3 68 13.1 91 17.6 173 33.4 133 25.7 41 7.9 518Wisconsin 5 0.3 106 5.5 393 20.5 353 18.4 522 27.2 406 21.1 135 7.0 1,920Wyoming 5 2.3 5 2.3 29 13.6 51 23.8 57 26.6 52 24.3 15 7.0 214Subtotal 224 0.1 9,717 3.7 51,758 19.9 54,370 20.9 72,326 27.8 52,771 20.3 18,785 7.2 259,951
TerritoryGuam 0 0.0 1 10.0 3 30.0 2 20.0 2 20.0 2 20.0 0 0.0 10Puerto Rico 6 0.1 210 2.6 927 11.5 1,487 18.4 2,689 33.4 2,226 27.6 516 6.4 8,061U.S. Virgin Islands 3 2.0 2 1.3 6 3.9 31 20.4 44 28.9 46 30.3 20 13.2 152Subtotal 9 0.1 213 2.6 936 11.4 1,520 18.5 2,735 33.3 2,274 27.7 536 6.5 8,223
Total 233 0.1 9,930 3.7 52,694 19.6 55,890 20.8 75,061 28.0 55,045 20.5 19,321 7.2 268,174Notes: Percentages shown are based on the row total. Due to rounding, percentages may not add to 100.0%.Data are based on provider location. Clients receiving services in multiple states were not included in state-specific totals or column subtotals and totals.

19AD
R Annual C
lient-Level Data R
eport
Table 10. AIDS Drug Assistance Program clients (non-RSR), by race/ethnicity and state, 2017—United States and 3 territories
American Indian/ Alaska Native Asian Black/
African American Hispanic/Latinoa Native Hawaiian/ Pacific Islander White Multiple races
Total No. No. % No. % No. % No. % No. % No. % No. %
StateAlabama 0 0.0 4 0.1 2,271 65.5 165 4.8 0 0.0 791 22.8 237 6.8 3,468Alaska 1 1.1 3 3.3 15 16.7 25 27.8 0 0.0 45 50.0 1 1.1 90Arizona 52 1.7 52 1.7 378 12.6 1,162 38.8 2 0.1 1,275 42.6 71 2.4 2,992Arkansas 4 0.3 3 0.2 543 45.2 111 9.2 2 0.2 531 44.2 8 0.7 1,202California 84 0.3 1,457 4.4 4,088 12.3 15,138 45.6 125 0.4 12,073 36.4 233 0.7 33,198Colorado 51 1.0 88 1.7 924 17.5 1,518 28.8 7 0.1 2,516 47.7 167 3.2 5,271Connecticut 6 0.3 21 0.9 858 37.0 604 26.0 4 0.2 826 35.6 0 0.0 2,319Delaware 2 0.1 2 0.1 1,170 64.5 139 7.7 0 0.0 489 27.0 12 0.7 1,814District of Columbia 1 0.1 10 0.7 966 67.3 269 18.7 0 0.0 185 12.9 4 0.3 1,435Florida 24 0.1 172 0.7 10,231 42.4 7,385 30.6 24 0.1 6,259 25.9 53 0.2 24,148Georgia 12 0.1 76 0.7 8,830 76.0 1,040 9.0 11 0.1 1,620 13.9 29 0.2 11,618Hawaii 2 0.5 68 15.9 18 4.2 57 13.3 39 9.1 207 48.5 36 8.4 427Idaho 2 0.6 5 1.5 28 8.2 64 18.7 0 0.0 231 67.3 13 3.8 343Illinois 23 0.2 202 1.6 6,049 49.0 2,737 22.2 15 0.1 3,247 26.3 80 0.6 12,353Indiana 7 0.2 95 3.1 1,172 38.0 309 10.0 1 <0.1 1,503 48.7 0 0.0 3,087Iowa 2 0.3 22 3.4 133 20.6 97 15.0 1 0.2 382 59.1 9 1.4 646Kansas 13 0.8 36 2.3 428 26.9 273 17.2 3 0.2 791 49.7 47 3.0 1,591Kentucky 10 0.3 37 1.1 1,195 34.5 210 6.1 2 0.1 1,958 56.5 52 1.5 3,464Louisiana 12 0.3 19 0.4 2,820 61.0 347 7.5 4 0.1 1,414 30.6 9 0.2 4,625Maine 10 0.9 6 0.6 213 20.0 41 3.9 0 0.0 755 71.0 39 3.7 1,064Maryland 14 0.2 55 0.8 5,197 74.2 653 9.3 7 0.1 1,045 14.9 30 0.4 7,001Massachusetts 22 0.3 147 2.0 2,253 30.0 2,324 30.9 21 0.3 2,685 35.7 60 0.8 7,512Michigan 13 0.4 56 1.6 1,601 45.8 232 6.6 4 0.1 1,543 44.1 49 1.4 3,498Minnesota 60 1.6 71 1.9 1,222 32.5 454 12.1 3 0.1 1,866 49.7 80 2.1 3,756Mississippi 1 <0.1 7 0.3 1,971 78.6 53 2.1 0 0.0 469 18.7 7 0.3 2,508Missouri 16 0.3 32 0.7 2,252 49.2 301 6.6 8 0.2 1,871 40.9 96 2.1 4,576Montana 21 5.7 4 1.1 17 4.6 19 5.2 2 0.5 305 82.9 0 0.0 368Nebraska 16 1.7 29 3.1 285 30.8 182 19.7 0 0.0 413 44.6 0 0.0 925Nevada 9 0.4 82 3.8 471 21.8 744 34.4 21 1.0 817 37.8 20 0.9 2,164New Hampshire 2 0.3 10 1.5 120 18.2 93 14.1 2 0.3 417 63.4 14 2.1 658New Jersey 5 0.1 112 1.8 2,821 44.3 2,206 34.6 10 0.2 1,116 17.5 97 1.5 6,367New Mexico 13 2.5 5 0.9 22 4.2 304 57.6 1 0.2 174 33.0 9 1.7 528New York 39 0.2 525 2.6 7,768 37.9 7,210 35.2 0 0.0 4,940 24.1 0 0.0 20,482North Carolina 71 0.7 76 0.7 6,586 64.4 1,103 10.8 6 0.1 2,383 23.3 0 0.0 10,225North Dakota 12 3.8 4 1.3 137 43.8 19 6.1 0 0.0 123 39.3 18 5.8 313Ohio 11 0.2 31 0.6 2,124 41.1 320 6.2 1 <0.1 2,600 50.3 83 1.6 5,170Oklahoma 108 5.2 33 1.6 468 22.6 228 11.0 2 0.1 1,080 52.2 151 7.3 2,070Oregon 51 1.3 94 2.5 279 7.3 658 17.3 20 0.5 2,701 71.0 0 0.0 3,803Pennsylvania 12 0.1 110 1.4 3,829 47.4 1,177 14.6 4 <0.1 2,953 36.5 0 0.0 8,085Rhode Island 3 0.4 13 1.7 151 20.1 217 28.9 1 0.1 367 48.8 0 0.0 752South Carolina 9 0.1 20 0.3 4,330 70.8 330 5.4 2 <0.1 1,382 22.6 43 0.7 6,116South Dakota 60 17.0 0 0.0 98 27.8 22 6.2 0 0.0 163 46.2 10 2.8 353Tennessee 15 0.2 49 0.7 3,837 57.0 409 6.1 3 <0.1 2,424 36.0 0 0.0 6,737Texas 37 0.2 296 1.3 8,548 38.0 8,877 39.5 7 <0.1 4,716 21.0 0 0.0 22,481Utah 8 0.9 32 3.6 83 9.3 263 29.5 6 0.7 497 55.7 4 0.4 893

20AD
R Annual C
lient-Level Data R
eport
Table 10. AIDS Drug Assistance Program clients (non-RSR), by race/ethnicity and state, 2017—United States and 3 territories (cont.)
American Indian/ Alaska Native Asian Black/
African American Hispanic/Latinoa Native Hawaiian/ Pacific Islander White Multiple races
Total No. No. % No. % No. % No. % No. % No. % No. %
StateVermont 6 1.4 9 2.1 37 8.8 32 7.6 1 0.2 322 76.5 14 3.3 421Virginia 5 0.1 118 1.5 4,476 58.0 896 11.6 1 <0.1 1,757 22.8 462 6.0 7,715Washington 37 0.9 160 3.7 766 17.9 855 20.0 24 0.6 2,312 54.1 119 2.8 4,273West Virginia 2 0.4 5 1.0 82 15.8 18 3.5 0 0.0 408 78.8 3 0.6 518Wisconsin 19 1.0 43 2.2 626 32.6 319 16.6 0 0.0 894 46.6 19 1.0 1,920Wyoming 11 5.3 1 0.5 21 10.1 26 12.6 1 0.5 146 70.5 1 0.5 207Subtotal 1,026 0.4 4,607 1.8 104,808 40.7 62,235 24.2 398 0.2 81,987 31.8 2,489 1.0 257,550
TerritoryGuam 0 0.0 1 10.0 1 10.0 0 0.0 7 70.0 1 10.0 0 0.0 10Puerto Rico 0 0.0 2 <0.1 7 0.1 8,009 99.4 0 0.0 43 0.5 0 0.0 8,061U.S. Virgin Islands 0 0.0 1 0.7 96 63.2 41 27.0 0 0.0 14 9.2 0 0.0 152Subtotal 0 0.0 4 <0.1 104 1.3 8,050 97.9 7 0.1 58 0.7 0 0.0 8,223
Total 1,026 0.4 4,611 1.7 104,912 39.5 70,285 26.4 405 0.2 82,045 30.9 2,489 0.9 265,773Notes: Percentages shown are based on the row total. Due to rounding, percentages may not add to 100.0%.Data are based on provider location. Clients receiving services in multiple states were not included in state-specific totals.a Hispanics/Latinos can be of any race.

21AD
R Annual C
lient-Level Data R
eport
Table 11. AIDS Drug Assistance Program clients (non-RSR), by gender and state, 2017—United States and 3 territories
Male Female Transgender MTF Transgender FTM Transgender unknown Total
No. No. % No. % No. % No. % No. %StateAlabama 2,564 73.9 845 24.4 49 1.4 10 0.3 0 0.0 3,468Alaska 77 85.6 13 14.4 0 0.0 0 0.0 0 0.0 90Arizona 2,527 84.5 432 14.4 30 1.0 3 0.1 0 0.0 2,992Arkansas 945 78.6 252 21.0 5 0.4 0 0.0 0 0.0 1,202California 29,599 88.9 3,259 9.8 405 1.2 30 0.1 3 <0.1 33,296Colorado 4,403 83.2 813 15.4 69 1.3 7 0.1 1 <0.1 5,293Connecticut 1,650 70.8 664 28.5 17 0.7 1 <0.1 0 0.0 2,332Delaware 1,161 64.0 635 35.0 18 1.0 0 0.0 0 0.0 1,814District of Columbia 1,007 70.2 390 27.2 35 2.4 3 0.2 0 0.0 1,435Florida 18,452 76.2 5,417 22.4 275 1.1 51 0.2 17 0.1 24,212Georgia 9,012 76.6 2,563 21.8 168 1.4 5 <0.1 11 0.1 11,759Hawaii 379 88.8 43 10.1 4 0.9 1 0.2 0 0.0 427Idaho 275 80.2 63 18.4 4 1.2 0 0.0 1 0.3 343Illinois 9,678 78.3 2,357 19.1 251 2.0 67 0.5 0 0.0 12,353Indiana 2,499 78.0 666 20.8 38 1.2 1 <0.1 0 0.0 3,204Iowa 529 81.9 112 17.3 5 0.8 0 0.0 0 0.0 646Kansas 1,272 79.9 300 18.9 19 1.2 0 0.0 0 0.0 1,591Kentucky 2,715 78.4 706 20.4 42 1.2 1 <0.1 0 0.0 3,464Louisiana 3,572 77.2 1,003 21.7 49 1.1 1 <0.1 0 0.0 4,625Maine 818 76.9 240 22.6 6 0.6 0 0.0 0 0.0 1,064Maryland 4,665 65.7 2,411 34.0 21 0.3 2 <0.1 0 0.0 7,099Massachusetts 5,120 67.2 2,445 32.1 57 0.7 1 <0.1 0 0.0 7,623Michigan 2,894 82.7 587 16.8 16 0.5 1 <0.1 0 0.0 3,498Minnesota 2,709 72.1 1,020 27.2 23 0.6 3 0.1 1 <0.1 3,756Mississippi 1,841 73.4 650 25.9 16 0.6 1 <0.1 0 0.0 2,508Missouri 3,726 81.4 768 16.8 82 1.8 0 0.0 0 0.0 4,576Montana 320 87.0 48 13.0 0 0.0 0 0.0 0 0.0 368Nebraska 710 76.8 205 22.2 10 1.1 0 0.0 0 0.0 925Nevada 1,811 83.5 330 15.2 27 1.2 1 <0.1 1 <0.1 2,170New Hampshire 472 71.7 175 26.6 9 1.4 0 0.0 2 0.3 658New Jersey 4,460 70.0 1,882 29.6 22 0.3 3 <0.1 0 0.0 6,367New Mexico 478 90.5 47 8.9 3 0.6 0 0.0 0 0.0 528New York 16,645 77.1 4,824 22.4 0 0.0 0 0.0 113 0.5 21,582North Carolina 7,585 73.5 2,624 25.4 100 1.0 1 <0.1 4 <0.1 10,314North Dakota 198 63.3 115 36.7 0 0.0 0 0.0 0 0.0 313Ohio 4,240 82.0 879 17.0 43 0.8 7 0.1 1 <0.1 5,170Oklahoma 1,709 82.5 350 16.9 10 0.5 2 0.1 0 0.0 2,071Oregon 3,437 87.2 469 11.9 31 0.8 2 0.1 1 <0.1 3,940Pennsylvania 6,216 76.5 1,859 22.9 2 <0.1 1 <0.1 45 0.6 8,123Rhode Island 458 57.9 66 8.3 136 17.2 131 16.6 0 0.0 791South Carolina 4,495 73.5 1,555 25.4 65 1.1 3 <0.1 0 0.0 6,118South Dakota 229 64.9 124 35.1 0 0.0 0 0.0 0 0.0 353Tennessee 5,307 78.6 1,348 20.0 80 1.2 13 0.2 1 <0.1 6,749Texas 17,542 77.1 4,996 22.0 207 0.9 7 <0.1 0 0.0 22,752Utah 757 84.3 134 14.9 6 0.7 1 0.1 0 0.0 898

22AD
R Annual C
lient-Level Data R
eport
Table 11. AIDS Drug Assistance Program clients (non-RSR), by gender and state, 2017—United States and 3 territories (cont.)
Male Female Transgender MTF Transgender FTM Transgender unknown Total
No. No. % No. % No. % No. % No. %StateVermont 345 80.2 82 19.1 1 0.2 2 0.5 0 0.0 430Virginia 5,609 72.7 1,981 25.7 127 1.6 3 <0.1 0 0.0 7,720Washington 3,576 83.7 628 14.7 55 1.3 14 0.3 0 0.0 4,273West Virginia 440 84.9 75 14.5 2 0.4 1 0.2 0 0.0 518Wisconsin 1,563 81.4 331 17.2 22 1.1 4 0.2 0 0.0 1,920Wyoming 169 79.0 44 20.6 1 0.5 0 0.0 0 0.0 214Subtotal 202,860 78.0 53,825 20.7 2,663 1.0 385 0.1 202 0.1 259,935
TerritoryGuam 7 70.0 3 30.0 0 0.0 0 0.0 0 0.0 10Puerto Rico 5,295 65.7 2,742 34.0 20 0.2 4 <0.1 0 0.0 8,061U.S. Virgin Islands 79 52.0 73 48.0 0 0.0 0 0.0 0 0.0 152Subtotal 5,381 65.4 2,818 34.3 20 0.2 4 <0.1 0 0.0 8,223
Total 208,241 77.7 56,643 21.1 2,683 1.0 389 0.1 202 0.1 268,158Abbreviations: FTM, female-to-male; MTF, male-to-female.Notes: Percentages shown are based on the row total. Due to rounding, percentages may not add to 100.0%.Data are based on provider location. Clients receiving services in multiple states were not included in state-specific totals.

23ADR Annual Client-Level Data Report
Table 12. AIDS Drug Assistance Program clients (non-RSR), by federal poverty level and state, 2017—United States and 3 territories
0–100% FPL 101–138% FPL 139–250% FPL 251–400% FPL >400% FPL Total No.No. % No. % No. % No. % No. %
StateAlabama 2,411 69.5 373 10.8 597 17.2 87 2.5 0 0.0 3,468Alaska 20 25.3 10 12.7 36 45.6 13 16.5 0 0.0 79Arizona 693 23.2 481 16.1 1,165 38.9 626 20.9 27 0.9 2,992Arkansas 525 45.7 154 13.4 322 28.0 141 12.3 8 0.7 1,150California 11,431 34.3 3,272 9.8 10,192 30.6 6,079 18.3 2,329 7.0 33,303Colorado 2,260 42.7 592 11.2 1,254 23.7 937 17.7 250 4.7 5,293Connecticut 1,032 44.3 205 8.8 688 29.5 393 16.9 14 0.6 2,332Delaware 885 50.9 207 11.9 366 21.1 213 12.3 67 3.9 1,738District of Columbia 592 41.3 190 13.2 307 21.4 254 17.7 92 6.4 1,435Florida 12,365 51.1 2,767 11.4 6,633 27.4 2,425 10.0 22 0.1 24,212Georgia 6,632 64.1 1,240 12.0 1,999 19.3 458 4.4 10 0.1 10,339Hawaii 114 26.7 79 18.5 176 41.2 56 13.1 2 0.5 427Idaho 154 52.0 57 19.3 81 27.4 4 1.4 0 0.0 296Illinois 6,329 51.2 1,229 9.9 2,905 23.5 1,517 12.3 373 3.0 12,353Indiana 1,410 44.0 486 15.2 1,047 32.7 252 7.9 9 0.3 3,204Iowa 120 18.8 44 6.9 272 42.6 187 29.3 16 2.5 639Kansas 715 44.9 196 12.3 442 27.8 221 13.9 17 1.1 1,591Kentucky 1,696 49.6 451 13.2 755 22.1 430 12.6 87 2.5 3,419Louisiana 909 19.7 545 11.8 2,070 44.8 1,059 22.9 42 0.9 4,625Maine 430 40.4 167 15.7 278 26.1 143 13.4 46 4.3 1,064Maryland 1,642 23.1 786 11.1 2,172 30.6 1,856 26.1 643 9.1 7,099Massachusetts 3,842 50.4 831 10.9 1,466 19.2 1,082 14.2 397 5.2 7,618Michigan 536 15.3 478 13.7 1,489 42.6 835 23.9 160 4.6 3,498Minnesota 1,671 44.8 477 12.8 963 25.8 615 16.5 0 0.0 3,726Mississippi 1,274 53.7 340 14.3 696 29.3 62 2.6 0 0.0 2,372Missouri 2,223 48.6 441 9.6 1,187 25.9 684 14.9 41 0.9 4,576Montana 110 43.7 49 19.4 66 26.2 27 10.7 0 0.0 252Nebraska 388 41.9 146 15.8 272 29.4 119 12.9 0 0.0 925Nevada 663 30.9 385 17.9 758 35.3 338 15.7 4 0.2 2,148New Hampshire 232 36.9 86 13.7 187 29.8 117 18.6 6 1.0 628New Jersey 1,381 26.3 457 8.7 1,554 29.6 1,415 26.9 445 8.5 5,252New Mexico 129 26.7 43 8.9 200 41.3 111 22.9 1 0.2 484New York 7,191 33.3 2,440 11.3 5,986 27.7 4,837 22.4 1,131 5.2 21,585North Carolina 5,701 55.3 1,718 16.7 2,520 24.4 375 3.6 0 0.0 10,314North Dakota 127 40.6 36 11.5 85 27.2 65 20.8 0 0.0 313Ohio 1,938 37.5 714 13.8 1,819 35.2 692 13.4 7 0.1 5,170Oklahoma 914 44.1 315 15.2 572 27.6 269 13.0 1 <0.1 2,071Oregon 1,651 41.9 526 13.4 944 24.0 656 16.6 163 4.1 3,940Pennsylvania 1,994 24.6 923 11.4 2,291 28.3 1,993 24.6 908 11.2 8,109Rhode Island 251 31.7 278 35.1 229 29.0 32 4.0 1 0.1 791South Carolina 2,906 47.5 538 8.8 1,512 24.7 859 14.0 303 5.0 6,118South Dakota 179 50.7 40 11.3 108 30.6 26 7.4 0 0.0 353Tennessee 3,048 45.2 599 8.9 1,722 25.5 1,295 19.2 85 1.3 6,749Texas 12,697 55.8 3,437 15.1 6,288 27.6 274 1.2 56 0.2 22,752Utah 469 52.2 87 9.7 257 28.6 75 8.4 10 1.1 898Vermont 144 37.8 49 12.9 106 27.8 64 16.8 18 4.7 381Virginia 3,942 51.1 861 11.2 1,861 24.1 857 11.1 199 2.6 7,720Washington 974 22.8 600 14.0 1,399 32.7 1,177 27.5 123 2.9 4,273West Virginia 150 29.0 109 21.0 173 33.4 86 16.6 0 0.0 518Wisconsin 414 34.2 219 18.1 466 38.5 111 9.2 0 0.0 1,210Wyoming 73 34.1 40 18.7 56 26.2 27 12.6 18 8.4 214Subtotal 109,577 42.8 30,793 12.0 70,989 27.7 36,526 14.3 8,131 3.2 256,016
TerritoryGuam 3 30.0 1 10.0 6 60.0 0 0.0 0 0.0 10Puerto Rico 7,886 >99.9 1 <0.1 1 <0.1 0 0.0 0 0.0 7,888U.S. Virgin Islands 69 45.4 23 15.1 42 27.6 13 8.6 5 3.3 152Subtotal 7,958 98.9 25 0.3 49 0.6 13 0.2 5 0.1 8,050
Total 117,535 44.5 30,818 11.7 71,038 26.9 36,539 13.8 8,136 3.1 264,066Abbreviation: FPL, federal poverty level.Notes: Percentages shown are based on the row total. Due to rounding, percentages may not add to 100.0%.Data are based on provider location. Clients receiving services in multiple states were not included in state-specific totals.
24ADR Annual Client-Level Data Report
Table 13. AIDS Drug Assistance Program clients (non-RSR), by service received and state, 2017—United States and 3 territories
Full-pay medication support
Insurance premium assistance
Medication co-pay/ deductiblea Multiple services
Total No. No. % No. % No. % No. %
StateAlabama 1,117 32.3 132 3.8 1 <0.1 2,213 63.9 3,463Alaska 23 42.6 18 33.3 0 0.0 13 24.1 54Arizona 721 28.8 53 2.1 1,193 47.6 540 21.5 2,507Arkansas 586 54.0 0 0.0 368 33.9 132 12.2 1,086California 11,973 40.6 715 2.4 10,862 36.8 5,936 20.1 29,486Colorado 375 9.1 139 3.4 1,957 47.7 1,632 39.8 4,103Connecticut 719 39.0 22 1.2 666 36.1 438 23.7 1,845Delaware 1,052 85.7 13 1.1 0 0.0 163 13.3 1,228District of Columbia 480 50.7 61 6.4 268 28.3 138 14.6 947Florida 15,513 68.6 894 4.0 1,576 7.0 4,644 20.5 22,627Georgia 9,756 100.0 0 0.0 0 0.0 0 0.0 9,756Hawaii 78 20.2 63 16.3 155 40.2 90 23.3 386Idahob 0 0.0 0 0.0 0 0.0 0 0.0 0Illinois 2,344 33.2 797 11.3 985 13.9 2,943 41.6 7,069Indiana 871 44.3 74 3.8 47 2.4 975 49.6 1,967Iowa 59 9.6 5 0.8 170 27.7 379 61.8 613Kansas 209 16.0 93 7.1 465 35.6 540 41.3 1,307Kentucky 363 13.6 126 4.7 692 25.9 1,495 55.9 2,676Louisiana 700 19.0 267 7.2 1,137 30.8 1,589 43.0 3,693Maine 29 4.6 47 7.4 343 54.4 212 33.6 631Maryland 387 6.1 219 3.4 2,669 41.9 3,095 48.6 6,370Massachusetts 222 3.9 449 7.9 3,365 59.4 1,630 28.8 5,666Michigan 535 18.6 107 3.7 1,512 52.4 730 25.3 2,884Minnesota 152 9.5 364 22.8 300 18.8 781 48.9 1,597Mississippi 2,402 100.0 0 0.0 0 0.0 0 0.0 2,402Missouri 509 12.0 170 4.0 1,253 29.6 2,294 54.3 4,226Montana 2 1.1 7 3.8 126 67.7 51 27.4 186Nebraska 151 17.6 8 0.9 265 30.8 435 50.6 859Nevada 529 30.2 91 5.2 542 30.9 590 33.7 1,752New Hampshire 81 18.2 0 0.0 278 62.6 85 19.1 444New Jersey 2,956 54.0 12 0.2 42 0.8 2,460 45.0 5,470New Mexico 48 10.9 264 60.1 30 6.8 97 22.1 439New York 10,950 51.3 2,697 12.6 3,372 15.8 4,330 20.3 21,349North Carolina 7,210 78.9 0 0.0 1,635 17.9 292 3.2 9,137North Dakota 49 22.6 14 6.5 87 40.1 67 30.9 217Ohio 1,090 28.4 472 12.3 893 23.3 1,385 36.1 3,840Oklahoma 264 13.5 96 4.9 453 23.2 1,138 58.3 1,951Oregon 287 10.9 1,190 45.4 685 26.1 461 17.6 2,623Pennsylvania 2,190 45.7 304 6.3 0 0.0 2,296 47.9 4,790Rhode Island 0 0.0 0 0.0 0 0.0 622 100.0 622South Carolina 2,310 40.7 101 1.8 1,299 22.9 1,962 34.6 5,672South Dakota 300 100.0 0 0.0 0 0.0 0 0.0 300Tennessee 2,143 31.8 126 1.9 1,620 24.0 2,860 42.4 6,749Texas 17,006 87.2 0 0.0 2,182 11.2 310 1.6 19,498Utah 296 37.6 15 1.9 79 10.0 397 50.4 787Vermont 0 0.0 73 46.8 61 39.1 22 14.1 156Virginia 2,123 30.6 287 4.1 697 10.0 3,842 55.3 6,949Washington 185 4.9 815 21.8 1,144 30.5 1,602 42.8 3,746West Virginia 99 20.1 9 1.8 247 50.1 138 28.0 493Wisconsin 624 39.2 203 12.8 0 0.0 764 48.0 1,591Wyoming 13 8.6 0 0.0 102 67.5 36 23.8 151Subtotal 102,081 46.7 11,612 5.3 45,823 21.0 58,844 26.9 218,360
TerritoryGuam 10 100.0 0 0.0 0 0.0 0 0.0 10Puerto Rico 7,212 96.6 0 0.0 167 2.2 84 1.1 7,463U.S. Virgin Islands 71 52.2 0 0.0 14 10.3 51 37.5 136Subtotal 7,293 95.8 0 0.0 181 2.4 135 1.8 7,609
Total 109,374 48.4 11,612 5.1 46,004 20.4 58,979 26.1 225,969
Notes: Percentages shown are based on the row total. Due to rounding, percentages may not add to 100.0%.Data are based on provider location. Clients receiving services in multiple states were not included in state-specific totals.a Includes Medicare Part D co-insurance, co-payment, or donut hole coverage. b State reported no assistance received.