rwanda national workshop on natural capital accounting ... · build rwanda water accounts (version...
TRANSCRIPT
World Water Day – Annual Conference – 22 & 23 March 2016 – WB WAVES NCA 2016 1
Rwanda National Workshop on Natural Capital Accounting
Water Accounts:
Progress, Key Findings, Next Steps
February 16, 2017, Kigali

Rwanda Natural Capital Accounting
• Overview
• SEEA Water Accounts
• Physical Flow & Asset Accounts
• Economic Accounts
• Results
• Implications & Policy
• Way forward & Programme sustainability
• Outreach & Publications
2
Dec 2017 Feb 2017
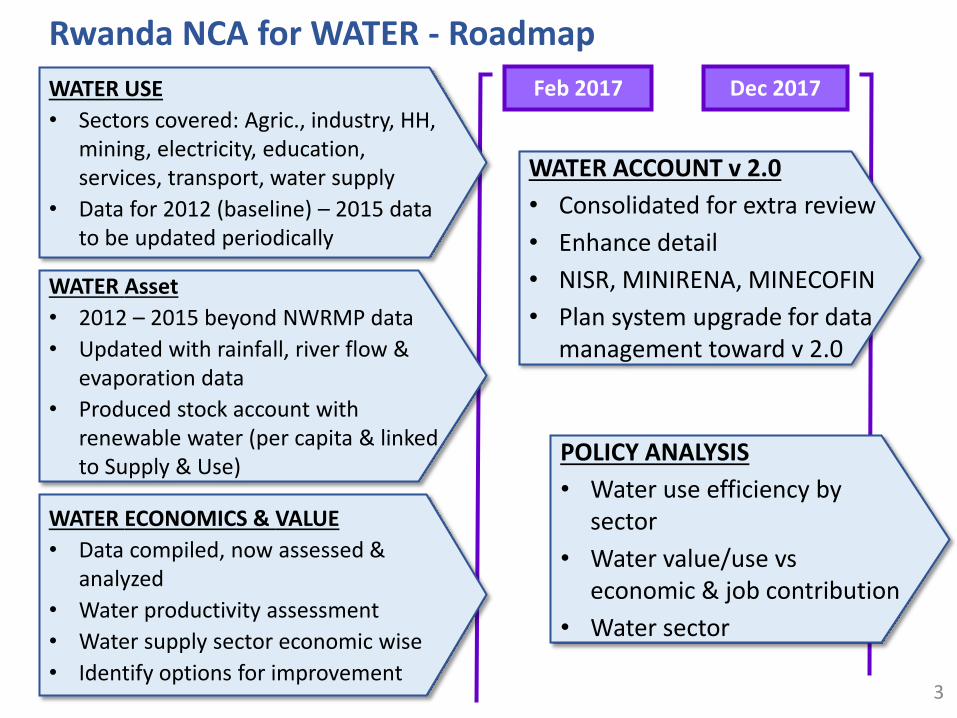
Rwanda NCA for WATER - Roadmap
3
WATER USE
• Sectors covered: Agric., industry, HH,
mining, electricity, education,
services, transport, water supply
• Data for 2012 (baseline) – 2015 data
to be updated periodically
WATER ACCOUNT v 2.0
• Consolidated for extra review
• Enhance detail
• NISR, MINIRENA, MINECOFIN
• Plan system upgrade for data
management toward v 2.0
WATER ECONOMICS & VALUE
• Data compiled, now assessed &
analyzed
• Water productivity assessment
• Water supply sector economic wise
• Identify options for improvement
WATER Asset
• 2012 – 2015 beyond NWRMP data
• Updated with rainfall, river flow &
evaporation data
• Produced stock account with
renewable water (per capita & linked
to Supply & Use) POLICY ANALYSIS
• Water use efficiency by
sector
• Water value/use vs
economic & job contribution
• Water sector
Introduction & Rationale
Water Sector & Institutional Issues
Water is a cross-cutting resource and Water resources are under pressure due to population growth (> 11.5 M) and rapid economic development (Rda: 6.9% GDP growth in 2015);
Extremely water dependent agriculture;
• 31% of GDP (2014) and Employing almost 50% of population (directly) and over 60 – 70 (incl. indirectly);
Water related issues in the country: Water resources, large & essential input to economy (agriculture), Water efficiency, shortage, water quality, water pollution which harm to economic output and value;
Previous statistics not detailed enough to provide accurate information on water allocation; water productivity, water resource use and water contribution to GDP and employment. 4

Why Water Accounts?
Inform policy makers in decision making and policy formulation as a National Development priority sector (identified in 2014 after scoping study conducted by MINIRENA);
Clarify and compare the economic values of water in competing uses;
Provide more accurate picture of overall water use, potential constraints to growth;
Relate economic production to water use, water productivity;
Look after performance water supply sector;
Monitor and enhance water productivity across sectors in Rwandan economy (use efficiency);
Identify potential for improvement performance ‘water supplying sector, like water efficiency in supply.
5

Flows from environment to economy
6
Flows within the
economy
Flows from
economy to environment
industries
Sewerage
households
Water abstraction
Public water
supply (WASAC,..)
What do PWFA for water measure?
Physical Water Flow Accounts

0
2.500
5.000
7.500
10.000
12.500
15.000
Year 2012 Year 2013
Year 2014 Year 2015
Trends for Water Consumption in Rwanda for 2012-
2015 (Mm3)
• Clearly agriculture is biggest
• Largely due to Evapotranspiration (ET), from land.
• ET mainly in agriculture (crops) & forests
• Trend impacted by both precipitation and weather & climate impacting ET
7

0
50
100
150
200
250
300
350
400
450
500
Year 2012 Year 2013 Year 2014 Year 2015
Trends for Water Consumption in Rwanda for 2012-
2015 (Mm3)
• Graph excludes agriculture
• To show other sectors
• Apparent growth
8

Trends on physical asset account for water resources Year 2012-
2015 in Million m3
Increase of water
resources in lakes, AR
and GW systems is
explained by observed
increase in rainfall than
abstracted water in
each year (e.g. 31.939
Mm3 of Rainfall against
17.023 Mm3 abstracted
water for year 2013)
0
100,000
200,000
300,000
400,000
500,000
600,000
Lakes Rivers Artificial reservoirs Soil water Groundwater
Trends of water resources in Rwanda for year 2012-2015 in million m3
Year 2012 Year 2013 Year 2014 Year 2015
9

Trends on physical asset account for water resources Year
2012-2015 in Million m3
The increase of water
resources in some stocks
like lakes, AR and GW
systems is explained by
observed increase in
rainfall, related
abstracted water in each
year
(e.g. 31.939 Mm3 of
Rainfall against 17.023
Mm3 abstracted water
for year 2013)
0
10,000
20,000
30,000
40,000
50,000
60,000
70,000
Rivers Artificial reservoirs Soil water Groundwater
Trends of water resources in Rwanda for year 2012-2015 in million m3,
excluding water in lakes
Year 2012 Year 2013 Year 2014 Year 2015
* Soil water: need further assessment, due to incompleteness of the current data
10

Water stress on Renewable Water Resource
• Linking Water flow Accounts to Water Asset Accounts
• Total Water Withdrawals (TWW), all sectors:
• Fresh Surface water abstractions
• Fresh Ground water abstractions
• Total Renewable Water Resource (TRWR) = IRWR+ERWR
•Water Stress %:
TWW / (TRWR-Env.)*100
Environmental Water requirements (Env.), to be included
11

Indicators SEEA – Water Accounts
Indicators derived from Rwanda Water Accounts:
• Water productivity
• Water stress (per capita & to water resource)
• Allocation
Allow Indicators to be reported to:
• EDPRS-3
• RBM&E
• GDSA
• SDGs i.e. 6 ‘water a age e t”
12

Results on Economic Water Accounts in Rwanda
1. Link Physical Water Accounts to economics in National
Accounts
2. Results: use, supply & productivity figures
3. At macro level and by economic sector (ISIC)
4. Integrated indicators to be derived
• Water productivity
• Progress in there over time
5. Performance indicators for Public Water Supply Sector
13

Water Consumption, GDP and Employment (%), 2012
Green water estimated
Agriculture created about 3.5% of jobs in formal way but yellow color shows other jobs created by agriculture
in inform way in Rwanda is 56% (Labour force statistical table)
14
0%
20%
40%
60%
80%
100%
GD
P, W
ater
Con
sum
ptio
n &
Em
ploy
men
t in
%
Rwanda economic sectors
% of Total Employment
% of GDP
% of Water Consumption

Water Productivity and efficiency (Rwf/m3)
Performance:
To monitor performance on water
productivity (green & blue water)
To link water abstractions from the
natural environment to economic
performance
Largely by sector
Time series 2012 – 2015
Allows to monitor progress over time
Possible Uses:
Can inform policy makers regarding
the performance and allocation of
water across sectors
Inform on contribution to economic
performance, employment
Indicates where water efficiency can
be improved
Inform on how Water Tariff can be
Reviewed
Chart here (Cor to insert)
0,0
20.000,0
40.000,0
60.000,0
80.000,0
100.000,0
120.000,0
GD
P /
wa
terc
on
s. (R
WF/m
3)
Rwanda economic sectors
Rwanda SEEA Water Accounts 2012
15

Water supply sector performance (1), efficiency
• Monitors efficiency in both:
• Water physical terms
• Economic terms
• Supply to abstraction ratio
• Shows efficiency
• Cost recovery
• Identification of options for improvements:
• Per supplier
• Progress over time
Source: WASAC data on water supply
0,0%
10,0%
20,0%
30,0%
40,0%
50,0%
60,0%
70,0%
80,0%
90,0%
100,0%
2012 2013 2014
Supply / abstraction Billing / abstraction
16
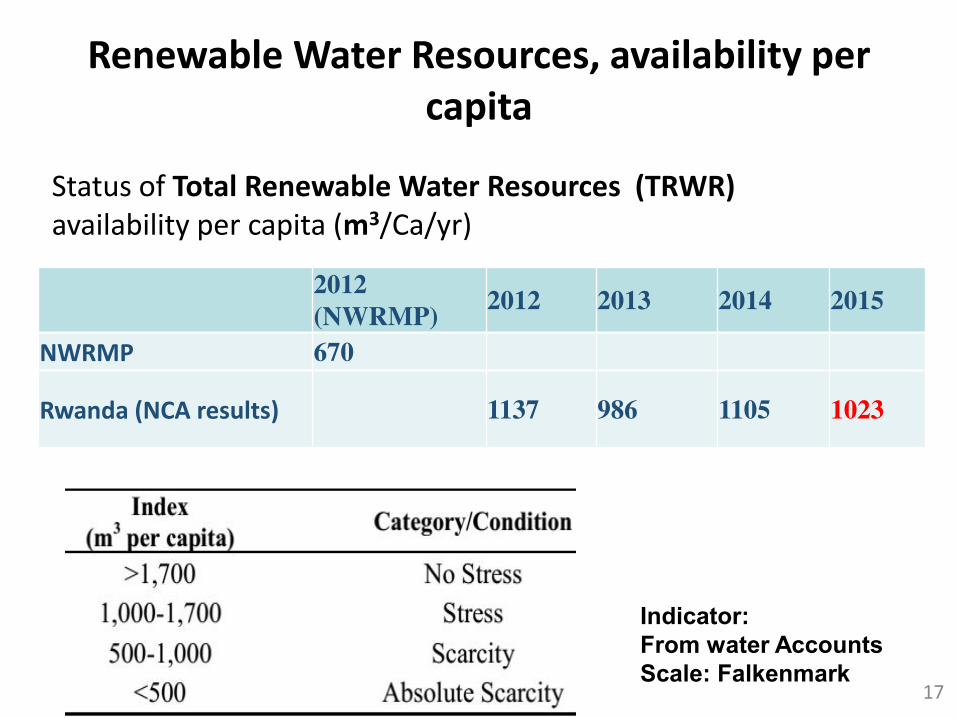
Status of Total Renewable Water Resources (TRWR)
availability per capita (m3/Ca/yr)
Renewable Water Resources, availability per
capita
2012
(NWRMP) 2012 2013 2014 2015
NWRMP 670
Rwanda (NCA results) 1137 986 1105 1023
17
Indicator:
From water Accounts
Scale: Falkenmark
Policy implication
• Indicators for EDPRS-3, SDGs, RBM&E, GDSA derivable from the Water Accounts (& National Accounts) ;
• NISR and UR researchers invited to do analysis, research and publish out of the available detailed Water Accounts data;
• Use for assessing levels and priorities for Water Use Fees Scheme ;
• Preference to extend the SEEA Water Accounts Rwanda to:
• Compilation for the 9 catchments
• Water Emission Accounts
• Water quality Accounts
• Public water supply towards extension of access & supply, efficiency decrease non revenue water improve on non-cost recovery tariff ; inform on how Water Tariff can be reviewed; and
• Further connect institutions and let anyone benefit from the accounts compiled and continue collecting required data for compiling water accounts. continuously.
18

Way forward and Programme Sustainability
• Build Rwanda Water Accounts (version 2) considering all economic sectors
• Collect additional data, next to data from Ministries, agencies, NISR, meteo, etc. also and at district level (30*)
• Build SEEA Water Accounts at catchment Level 1 (9*), depending on data and financial availability;
• Possible institutional setup for sustainability, Water Accounts Unit?
• Include NCA Programme under Rwanda Institutional Framework .
19

Thank you for your attention
Questions / Suggestions?
Rwanda, 16th Feb 2017