rva at pdc: overview and examples
TRANSCRIPT

RVA at PDC:
Overview and Examples
Fostering Disaster-Resilient Communities through
Information, Science, Technology and Exchange

• Conceived in the aftermath of Hurricane Iniki
(Impacted Kauai on Sept 11, 1992) • A center to establish access to new, innovative,
and more effective information resources
supporting all levels of emergency management to
better prepare for and respond to disasters.
• Established in 1996. • Today, PDC is an acknowledged leader in using
the application of science and technology to
advance international best practices in Disaster
Risk Reduction (DRR). • University of Hawaii: Managing Partner (‘06)
(c) Copyright 2006-2011 - PDC
Iniki – Sept 11, 1992
PDC Origins and Concept

• Program under UH • 75% Public funds, 25% Proposals/Grants • About 40 full time staff and contractors
• Hawaii: Maui and Oahu (36) • Vietnam, Thailand, Wash DC, CO. (4)
Staff Expertise: • Disaster Management • Geospatial Data and Visualization • Information System Engineering & Technology • Modeling, Simulation, & Risk Assessment
Maui HQ
HSCD Diamond Head
Ft. Shafter
PDC Location and
Composition

Building Bridges
Peer Review
Science
Community
The Public
Decision
Makers
Audience
Comfort with uncertainty
Vocabulary
Associations
High Low
Complex Simple
Technical
Groups Very
Public

• Applied Science & Technology
• Capability Building • Evidence-Based Information
Products • Policy & Decision
Makers • Disaster Managers • Planners • Humanitarian Assist.
Orgs
Integrating Information, Science,
Technology
Improve
Decision-Support
Capabilities
Communication Systems and Networks
Observation Systems , Data
Collection
Advanced Applications, Algorithms, Models
GIS, Visualization and Display
Systems
Integrated Approach

• Integrated Multi-hazard
Hazard Monitoring • Disaster Early Warning • Automated / Integrated
Modeling • Exposure Maps & Historical
Hazard data • Customized Impact
Modeling AND • Intra- and Inter-Agency Info
Sharing • User Added Situation
Reports • Damage Products, …
• Remote Access
EQ
Volcano
Hot Spots
Rain Tsunami Travel Time
Storm, EQ, Volcano Intensity Zones
Shake Maps (MMI)
Info Sharing
Mobile App
May 10, 2010
What Is DisasterAWARE?

• Technical Advisory Services
– ASEAN
• Workshops and Training
– Vietnam, APEC
• Data Collection and Assessment
Activities
– ADB
• Outreach to Both Worlds
– Risk, Hazards & Crisis in Public
Policy
– PRiMO
RVA Products and Services

An Approach to
Disaster Risk Reduction
Acknowledge Risk Assess Risk
Address Risk
Communicate Risk

Assess Risk
Acknowledge
Risk
Communicate
Risk Address Risk
• Helps stakeholders
understand patterns of risk
and consequences
• Identifies gaps and
“hotspots”
• Increases effectiveness of
DM and HADR activities
• Aids Prioritization
• Helps set meaningful goals
• Makes idea of risk more
tangible
Why Do Assessments?

• Frameworks Guide Data
Collection
• Modeling and Analysis
Outputs Provide Content for
DSS
• Modeling and Analysis
Results Provide Evidence for
Decision Making
• Theory and Methods Support
Capacity Development
• Socio-Economic and
Environmental Analysis
Provides More Complete
Picture
How Does RVA Support PDC Efforts
to Address Disaster Risk?
Decision and Policy
Support
Institutional Capacity
Development
Humanitarian
Assistance
Support
PDC Works to Address Risk through:

A methodology to determine the nature and extent of risk by
analyzing potential hazards and evaluating existing conditions
of vulnerability that together could potentially harm exposed
people, property, services, livelihoods and the environment on
which they depend.
Risk assessments (and associated risk mapping) include: a review of the
technical characteristics of hazards such as their location, intensity, frequency
and probability; the analysis of exposure and vulnerability including the
physical, social, health, economic and environmental dimensions; and the
evaluation of the effectiveness of prevailing and alternative coping capacities in
respect to likely risk scenarios. This series of activities is sometimes known as a
risk analysis process.
What Is a Risk Assessment?
(ISDR 2009)

Human-Environment
System
Event
Exposure/
Affected Area
Vulnerability
of Exposed
Elements
Hazard
Characteristics
In Exposed Area
Coping Capacity
of Exposed
Elements
Level of
Disruption
Beyond
Ability to Cope
Connectivity
Components of
Disaster Risk

Environmental
Systems
Economic
Systems
Social
Systems
Global
Regional
National
Local
Components of Disaster Risk

How Do We Assess All That?!!!
• We Don’t
• Estimations and Interpretations of Reality
• Practical Tools to Help Us Do Our Jobs More
Effectively
• Address a Limited Number of Factors
• What We Include Depends on Purpose and
Goals
• …but We Try to Keep in Mind What’s Missing
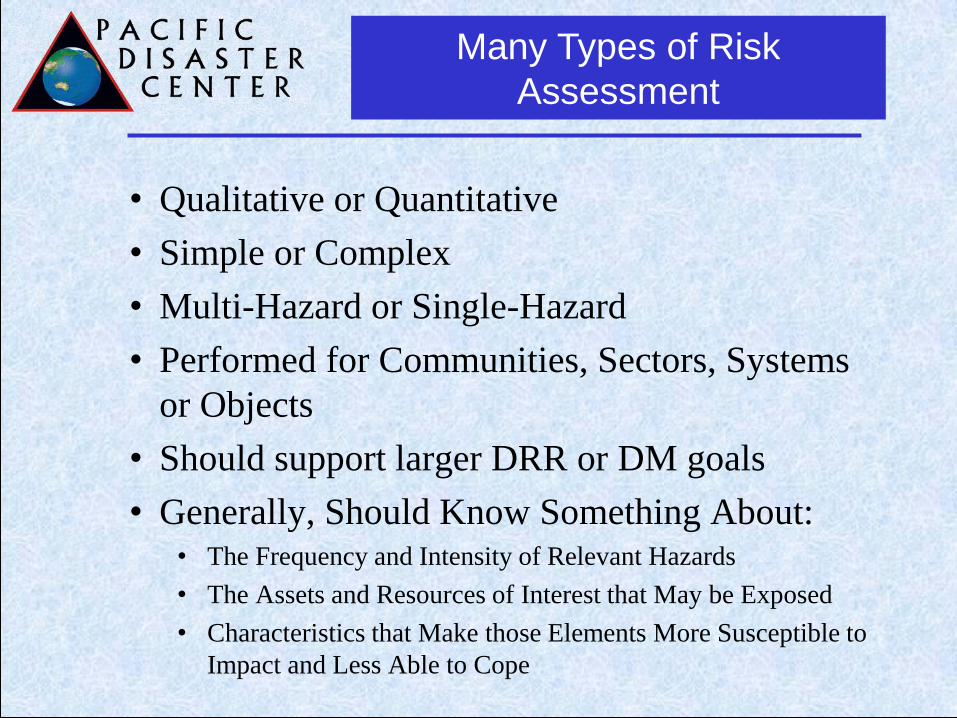
Many Types of Risk
Assessment
• Qualitative or Quantitative
• Simple or Complex
• Multi-Hazard or Single-Hazard
• Performed for Communities, Sectors, Systems
or Objects
• Should support larger DRR or DM goals
• Generally, Should Know Something About: • The Frequency and Intensity of Relevant Hazards
• The Assets and Resources of Interest that May be Exposed
• Characteristics that Make those Elements More Susceptible to
Impact and Less Able to Cope

Risk Assessment Road Map
Purpose, Goals, and Objectives of Risk Assessment
Scale
Participation and Roles
Characterize
Risk
Definitions
Conceptualization
Key Components
and Categories
Analyze Risk
Methods
Data Requirements
and Collection
Execution
Communicate
Risk
Representation
Reporting
Dissemination
Acknowledge
and
Address
Risk
Policy
Planning
Mitigation
Mainstreaming
Etc. Standardization/Interoperability

Assessment Examples*
http://yahyasheikho786.wordpress.com
*Please Do Not Distribute Examples Provided

Example 1: American Samoa:
Focus on Critical Facilities
County Village Facility
Name
Number
of
Buildings
Function Earthquake
Flood Landslide Storm
Surge /
Tsunami
Maoputasi Fagatogo
American
Samoa
Telecom. 1 Communications Medium Low Low High
Maoputasi Utulei
Dept of
Ed. 1 Government Medium Low Medium High
Maoputasi Fagatogo
High
Court 1 Government Medium Low Low High
Maoputasi Fagatogo
Inter-
island
Ferry
Terminal 1 Transportation Medium Low Medium High
Maoputasi Fagatogo
DPS Fire
Division 2 Fire Medium Low Medium High
Maoputasi Fagatogo
Container
Dock 1 Transportation Medium Low High High
Maoputasi
Pago
Pago
District
Court 1 Government Medium Low Low High
Maoputasi Satala
Star Kist
Samoa
Co. 2 Commercial Medium Medium Medium High

Loss Estimation for Critical Facilities
Tutuila, American Samoa
County Village Name Function Number
of
Employees
Estimated
Replacement
Cost ($)
Critical
Facilities
Ownership
Approx.
Value
Contents
($)
1st-Floor
Flood
Elevation
(feet)
Lealataua Leone
Leone
High
School School/Shelter $1,960,000 Gov’t.
$1,960,000 53
Maoputasi Fagaalu
KSBS
Radio
Station Communications 10 $384,000 Private
$384,000 15
Maoputasi Fagaalu
LBJ
Tropical
Medical Hospital 500 $18,836,193 Gov’t.
$28,254,289 17
Maoputasi Fagatogo
ASG
Gov't
Bldgs. Government $14,000,000 Gov’t.
$14,000,000 12.5
Maoputasi Fagatogo
DPS
Central
Station Police 230 $770,414 Gov’t.
$1,155,621 8
Maoputasi Fagatogo
DPS
Fire
Division Fire 25 $150,000 Gov’t.
$225,000 6
Tualauta Tafuna
PPG
Intl.
Airport Transportation 77 $69,080,080 Gov’t.
$69,080,080 15.5

• National Level Risk Assessment for Continent of Africa
• Interactive Map Viewer
– Visualize and Interact with Physical and Social Spatial Data, Risk Assessment Indicators and Indices
• Sub-National Analysis
– Example: Travel Costs in Kenya
Example 2: Support for HADR
Information Needs in Africa*
* Colvin, Peter, Heather M. Bell, Margaret Roth. 2009. PDC Support of Humanitarian
Assistance and Disaster Relief Information Needs in Africa. Maui, HI: PDC

=RISK Hazard CapacityVulnerability+ -= Hazard CapacityVulnerability+ -
Conflict HIV
Access to Food
and Water
Economic
Dependence Environmental
Stress Health Systems
Access to
Information
Population
Pressures
Dependent
Population Difference and
Inequality
=RISK Hazard CapacityVulnerability+ -
Hazard Is Modular,
Includes Exposure and
Specific Vulnerability
And Capacity
Vulnerability and Capacity
Components Are
Hazard Independent
=RISK Hazard CapacityVulnerability+ -
Economic
Strength
Government
Strength Infrastructure
Composite Index Allows
Drill Down into
Drivers of Hazard,
Exposure, Vulnerability,
And Capacity
Assessment Approach

Index Rank Index Rank Index Rank Index Rank
Country (Range 0-1) (Rank x of 53) (Range 0-1) (Rank x of 53) (Range 0-1) (Rank x of 53) (Range 0-1) (Rank x of 53)
Mauritius 0.90 1 0.93 3 0.89 1 0.89 2
Cape Verde 0.76 2 0.94 1 0.78 2 0.56 7
Botswana 0.73 3 0.93 3 0.26 10 0.99 1
Seychelles 0.71 4 0.78 6 0.71 3 0.65 6
South Africa 0.61 5 0.83 5 0.51 6 0.49 8
Tunisia 0.55 6 0.64 8 0.36 7 0.66 5
Namibia 0.48 7 0.84 4 0.19 20 0.43 10
Sao Tome and Principe 0.46 8 0.57 13 0.70 4 0.11 32
Equatorial Guinea 0.39 9 0.15 45 0.24 13 0.80 3
Morocco 0.38 11 0.56 14 0.27 9 0.31 16
Ghana 0.38 11 0.72 7 0.14 32 0.28 17
Economic StrengthTop 10
Capacity Governance Infrastructure
• Mauritius
– Higher Capacity in All Aspects
• Equatorial Guinea
– Weak Governance, High Economic Strength
• Ghana
– Strong Governance, Relatively Weak Infrastructure
Capacity Example
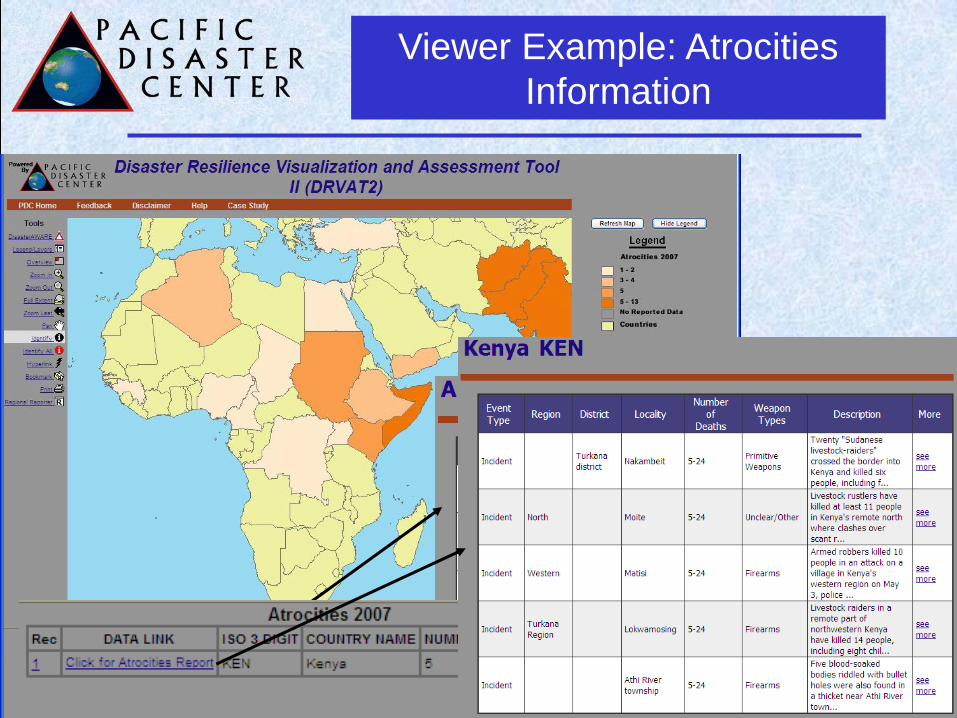
Viewer Example: Atrocities
Information

• Social Vulnerability
Estimation Based on
SoVI Method*
• Combined with
Hazard
• Applied to Examine
Recovery and Inform
Planning
*S. L. Cutter, B. J. Boruff, and W. L. Shirley. 2003. Social Vulnerability to Environmental Hazards, Social
Science Quarterly 84 (2): 242-261.
Example 3: Social Vulnerability
and Hazard in New Orleans
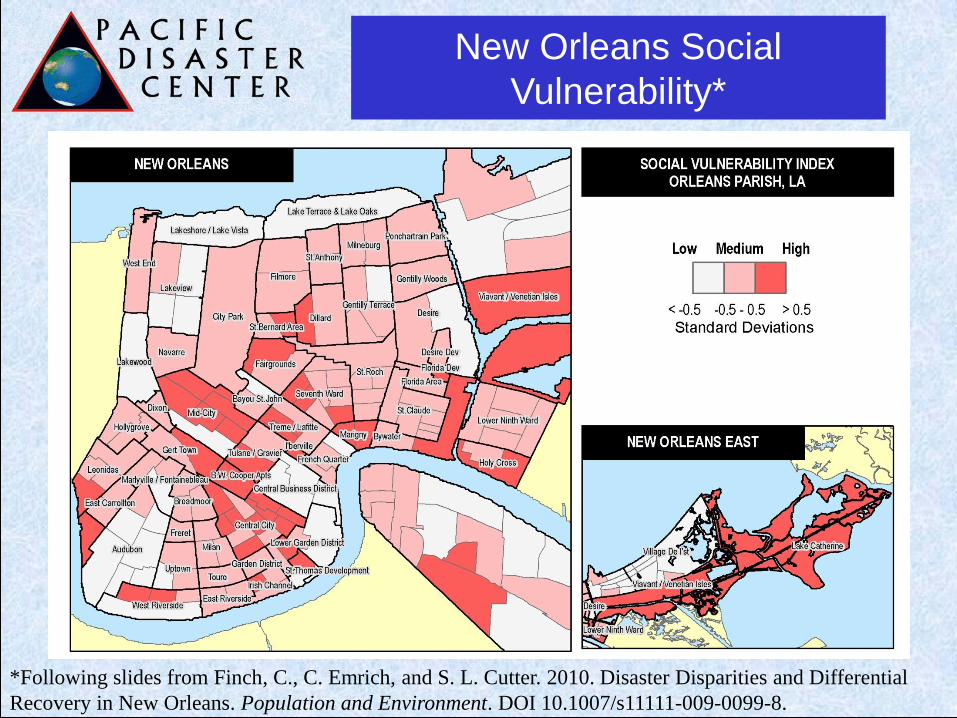
*Following slides from Finch, C., C. Emrich, and S. L. Cutter. 2010. Disaster Disparities and Differential
Recovery in New Orleans. Population and Environment. DOI 10.1007/s11111-009-0099-8.
New Orleans Social
Vulnerability*

New Orleans Flooding during
Katrina

Combining Hazard and
Vulnerability

SoVI Applications in Hawaii
(works in progress)

Example 4: Modeling Hazards
to Support Planning
(c) Copyright 2006-2010 - PDC
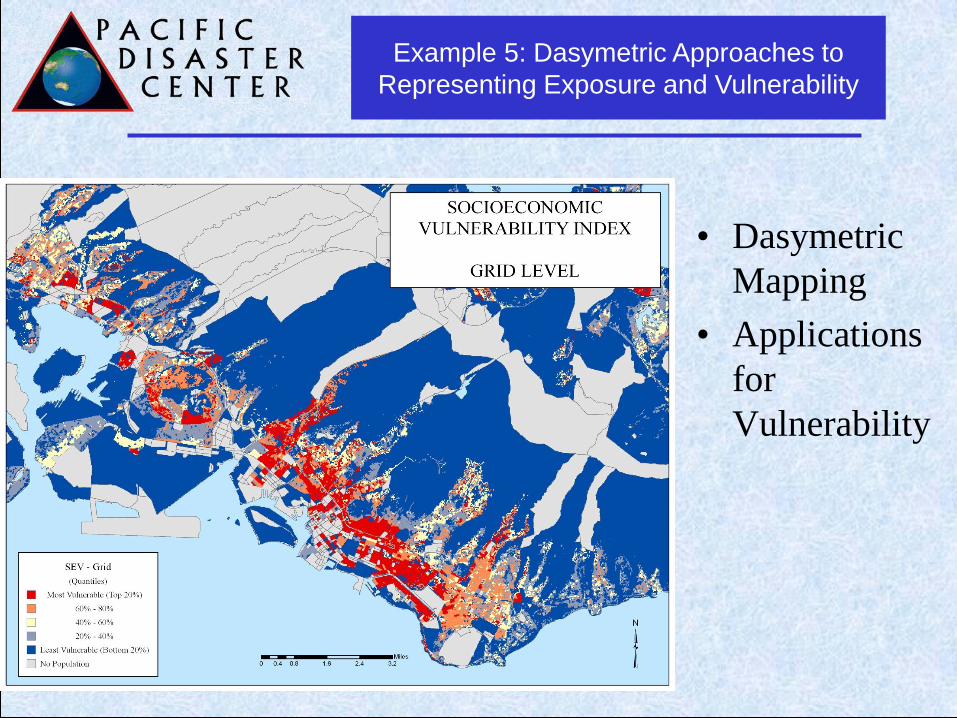
Example 5: Dasymetric Approaches to
Representing Exposure and Vulnerability
• Dasymetric
Mapping
• Applications
for
Vulnerability

• Project Goals – Identify and
Evaluate Threats to
the Monument
– Assess
Vulnerabilities of
Key Resources
– Prioritize At Risk
Areas for
Monitoring
Activities
Example 6: Multi-Hazard with
Environmental Resource Focus*
* Mielbrecht, S., P. Cowher, J. Livengood, H.M. Bell, C. Chiesa. 2009. Papahanaumokuakea Marine
National Monument Threat Assessment Report: A Natural and Environmental Threat Assessment. Project
Final Report. Maui, HI: PDC.

Characterizing Hazard,
or “Threat”
Participatory Approach
Enforceable Threats

Representing Resources,
Vulnerability and Risk
Questions?
www.noinvite.com
Heather Bell, PhD
Science Advisor
Editor-in-Chief, Risk,
Hazards & Crisis in Public
Policy
Pacific Disaster Center
808.891.7942
www.pdc.org
www.psocommons.org/rhcpp