r/v dana cruise 08/2020 - fiskeridir
TRANSCRIPT
DTU Aqua Cruise Report
R/V Dana
Cruise 08/2020
”DK IBTS 3Q 2020”

2
Vessel: R/V DANA Cruise dates (planned): 28/7 – 14/8 2020
Cruise number: 08/20 Cruise name: DK IBTS 3Q 2020
Port of departure: Hirtshals Date: 28 July Port of return: Hirtshals Date: 14 August Other ports: Esbjerg
Date and justification:
5 August: Scheduled exchange of scientific staff and crew
Participants
Leg 1: Hirtshals – Esbjerg
Name Institute Function and main tasks
Helle Rasmussen DTU Aqua, Monitering Cruise leader, Fish lab Maria Jarnum DTU Aqua, Monitering Technician, Fish lab Per Christensen DTU Aqua, Monitering Technician, Fish lab Flemming Thaarup DTU Aqua, Monitering Technician, Fish lab Jan W. Thomsen DTU Aqua, Monitering Technician, Fish lab Christian Petersen DTU Aqua, Monitering Technician, CTD, Maintenance Peter Munk DTU Aqua, Oceans and Arctic Scientist, Fish eggs and larvae Nathan Gravier DTU Aqua Scientist, Jellyfish
Leg 2: Esbjerg – Hirtshals
Name Institute Function and main tasks
Kai Wieland DTU Aqua, Monitoring Cruise leader, Fish lab Stina Hansen DTU Aqua, Monitoring Technician, Fish lab Tom Svoldgaard DTU Aqua, Monitoring Technician, Fish lab Anne-Mette Kroner DTU Aqua, Monitoring Technician, Fish lab Mads Jensen DTU Aqua, Monitoring Technician, Fish lab Christian Petersen DTU Aqua, Monitoring Technician, CTD, Maintenance Bastian Huwer DTU Aqua Scientist, Fish eggs and larvae Nathan Gravier DTU Aqua Scientist, Jellyfish
Objectives The survey is part of the 3rd quarter International Bottom Trawl Survey (IBTS) in the North Sea, which is coordinated by the ICES International Bottom Trawl Survey Working Group and has been conducted with standard fishing gear in the 3rd quarter since 1991. The IBTS aims to provide ICES assessment and science groups with consistent and standardised data for examining spatial and temporal changes in (a) the distribution and relative abundance of fish and fish assemblages; and (b) of the biological parameters of commercial fish species for stock assessment purposes. The main objectives in the 3rd quarter IBTS are to:
3
• To determine the distribution and relative abundance of pre-recruits of the main commercial species (cod, haddock, whiting, Norway pout, saithe, herring, sprat, and mackerel) with a view of deriving recruitment indices;
• To monitor changes in the stocks of commercial fish species independently of commercial fisheries data;
• To monitor the distribution and relative abundance of all fish species and selected invertebrates;
• To collect data for the determination of biological parameters for selected species; • To collect hydrographical and environmental information. • To collect information of the amount and distribution of marine litter
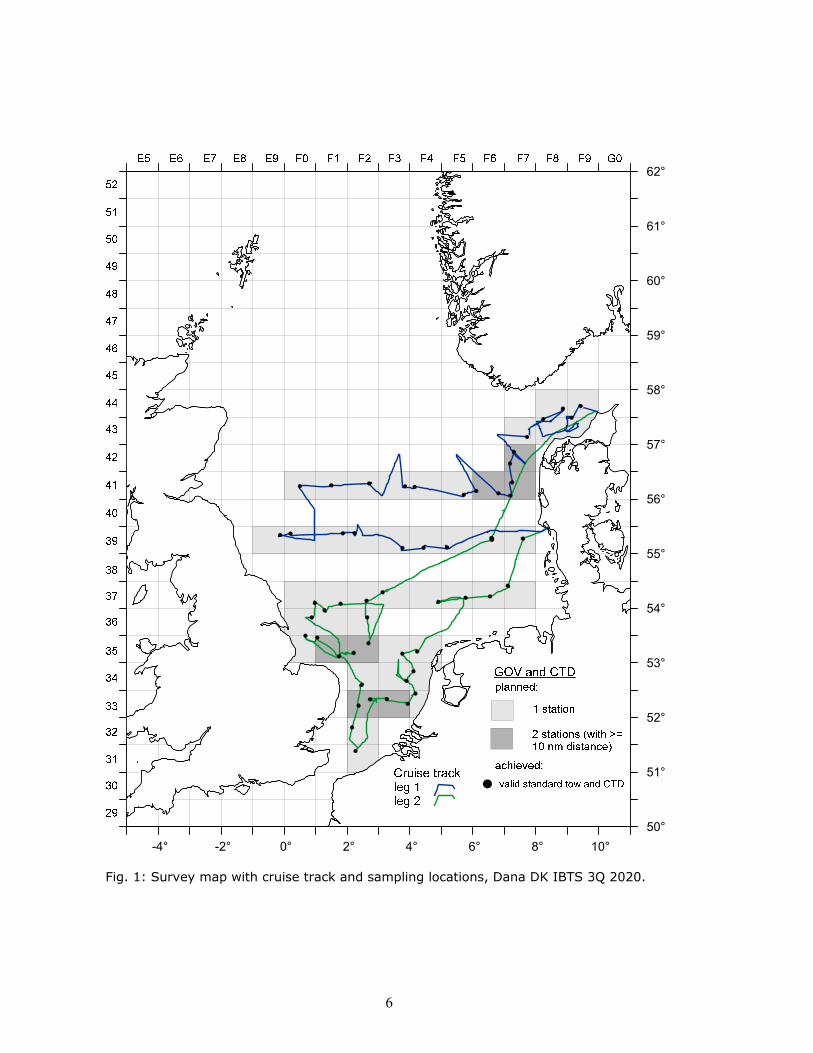
The area to be covered by Denmark with RV Dana in the 3rd quarter 2020 was allocated during the IBTS Working Group meeting in April 2020. Technical details are described in the current version of the survey manual (ICES 2015. Manual for the International Bottom Trawl Surveys. Series of ICES Survey Protocols. SISP 10-IBTS IX. 86 pp.). Collection of information on the trawl setting and retrieval duration of the standard 30 minute tows which has been started in 2018 based on a request by the ICES IBTSWG was continued to supplement the existing international data set. Additional midwater sampling with a MIK net for fish larvae and jellyfish was conducted during night. Itinerary R/V Dana left Hirtshals on Tuesday 28th July at 11:05 local time. The field work started in the western Skagerrak (Fig. 1). The vessel stayed in the port of Esbjerg on Wednesday 5th August from 9:30 to 12:15 for a scheduled exchange of scientific staff and crew.. R/V Dana returned to Hirtshals on Friday 14th August at 8:45 local time. Rough weather conditions delayed the sampling progress in the northeastern part of the survey area during the beginning of the survey whereas favorable weather conditions prevailed thereafter and in particular during the 2nd cruise leg (Fig. 2). Achievements The working area consisted of 47 ICES statistical rectangles located in the Skagerrak and the North Sea and in 7 of these rectangles two stations were planned (Fig. 1). The following activities were carried out: 54 valid standard trawl hauls with a GOV 36/47 (chalut á Grande Overture Verticale), all
hauls were carried with the standard groundgear A (see IBTS Manual for specifications) and with 60 m sweeps. In all of hauls Vonin flyers were used replacing the standard kite.
54 CTD profiles (with additional sensors for dissolved oxygen, fluorescence and turbidity)
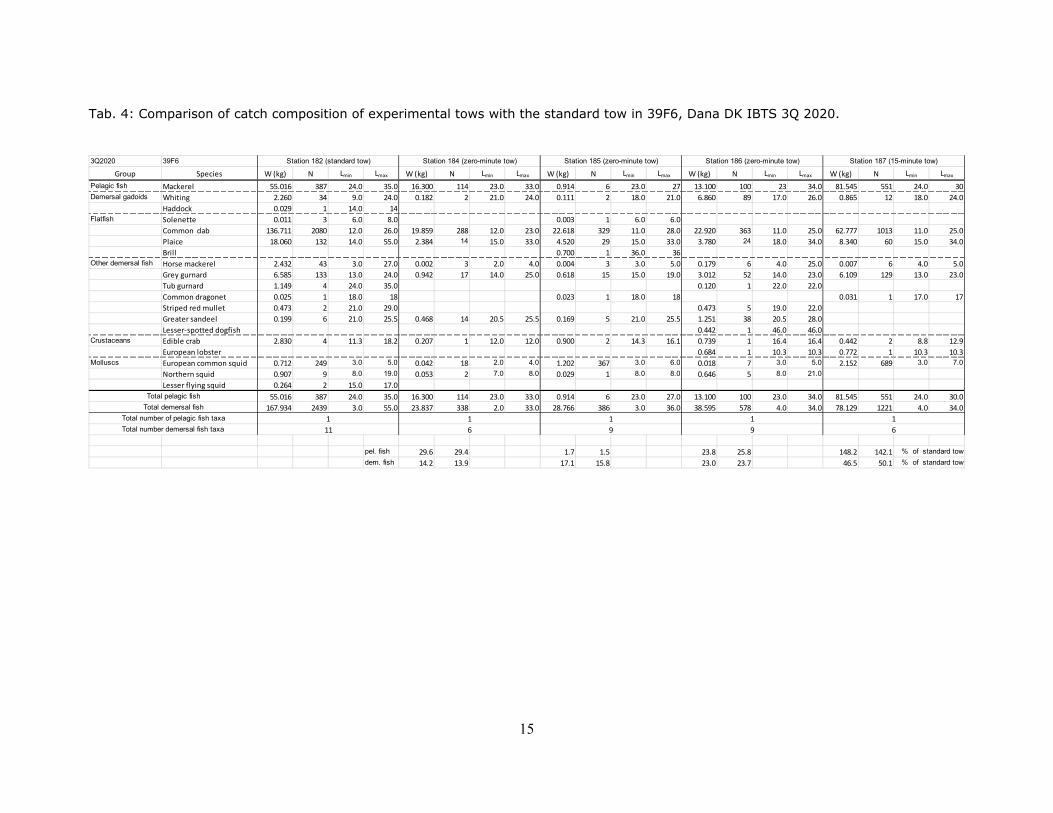
at standard GOV stations. Additional three so-called 0-minute and one 15-min experimental GOV tow were carried
4
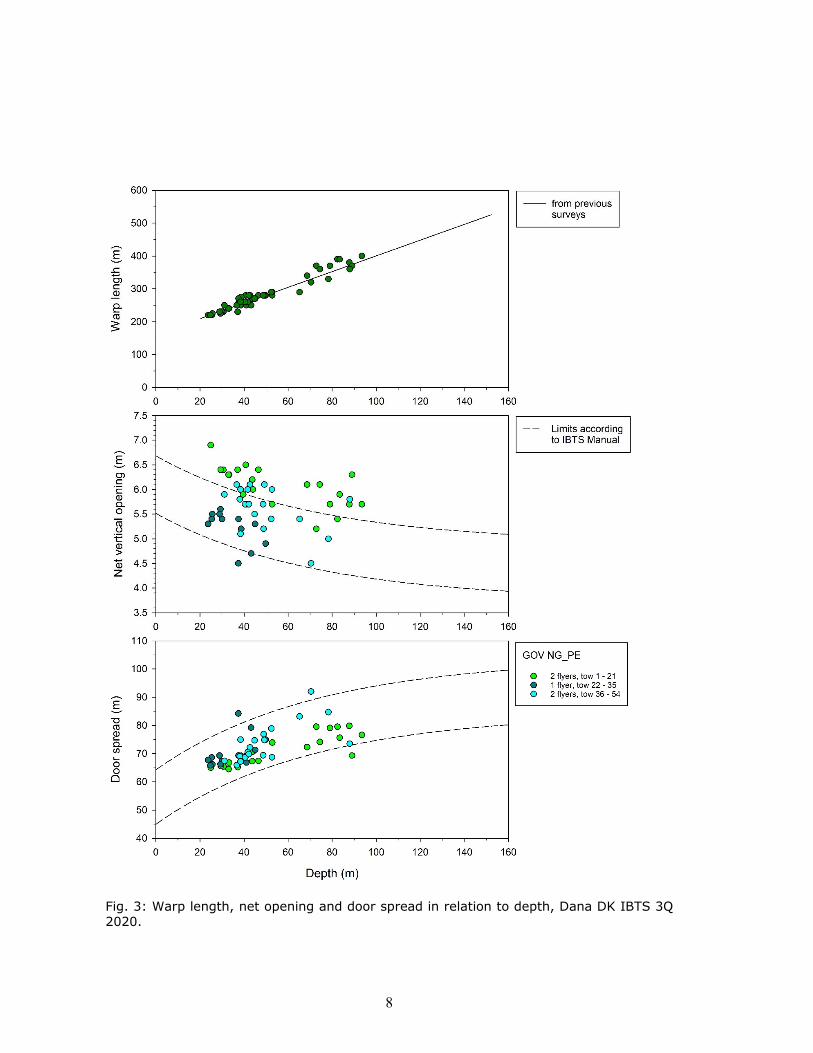
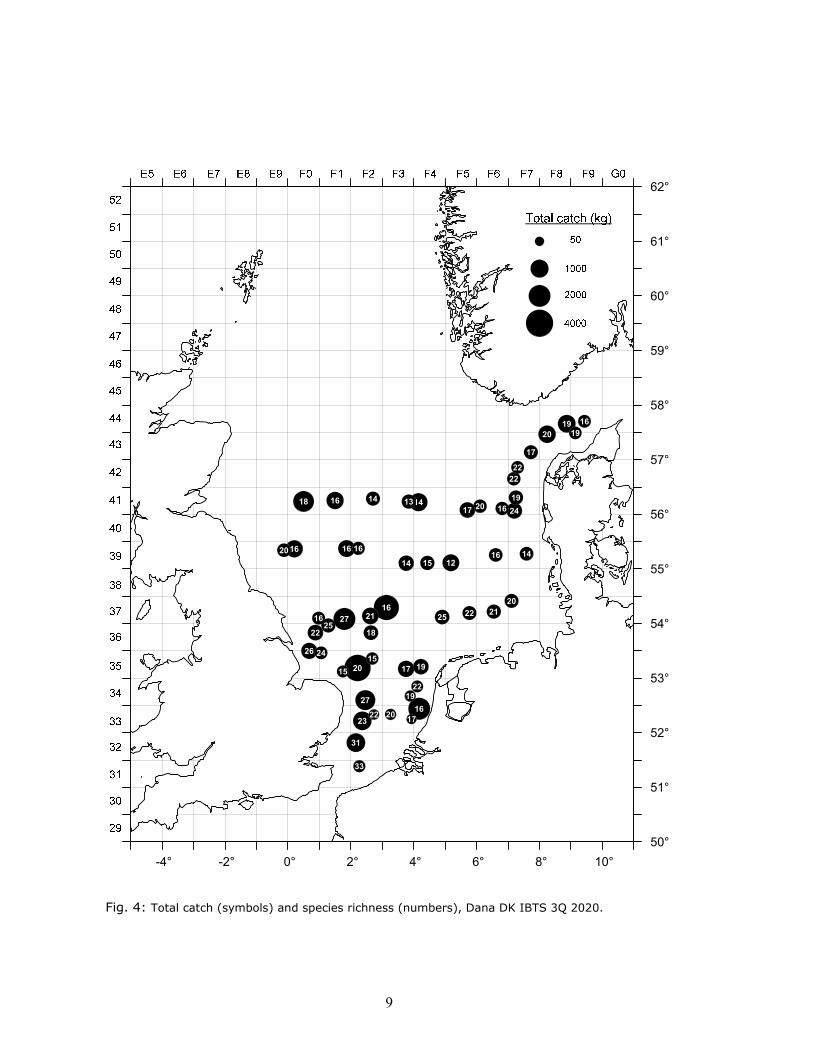
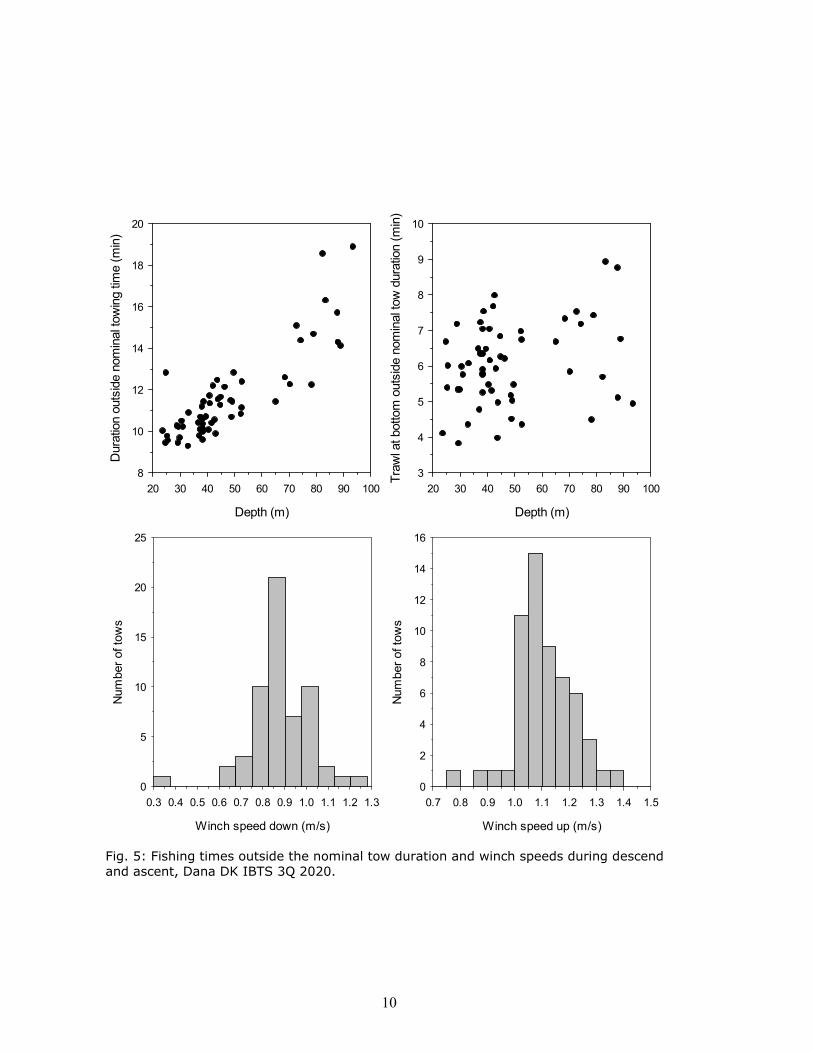
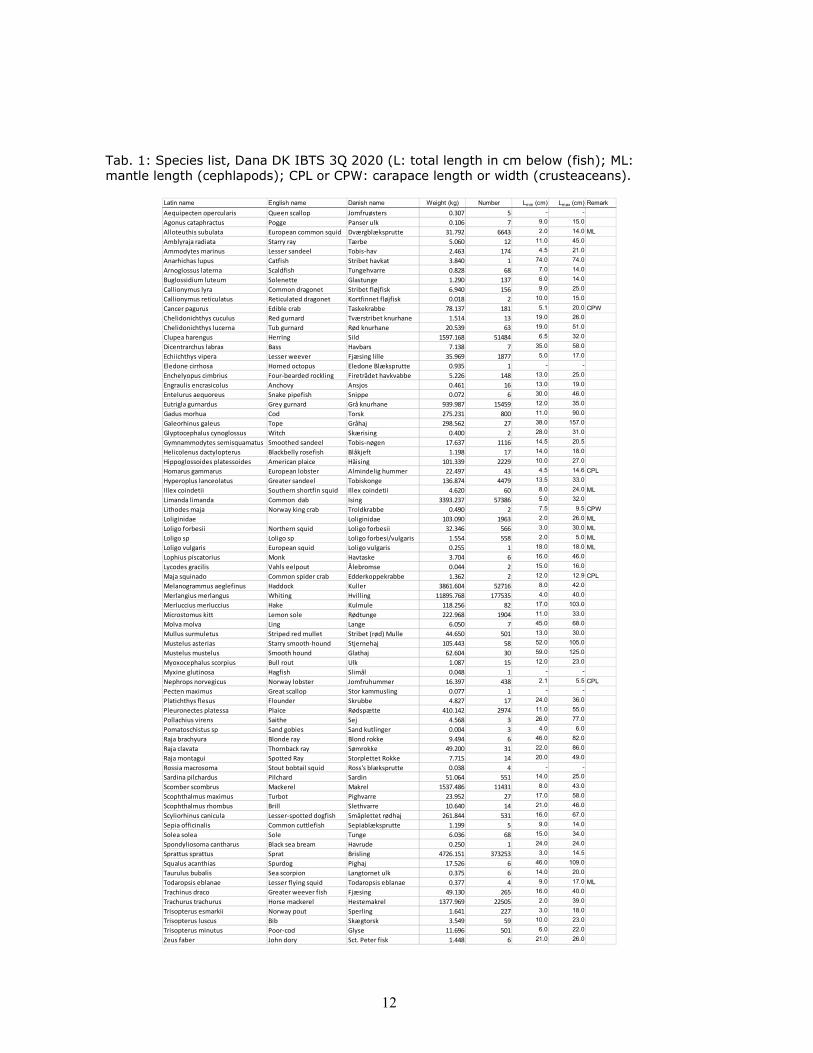
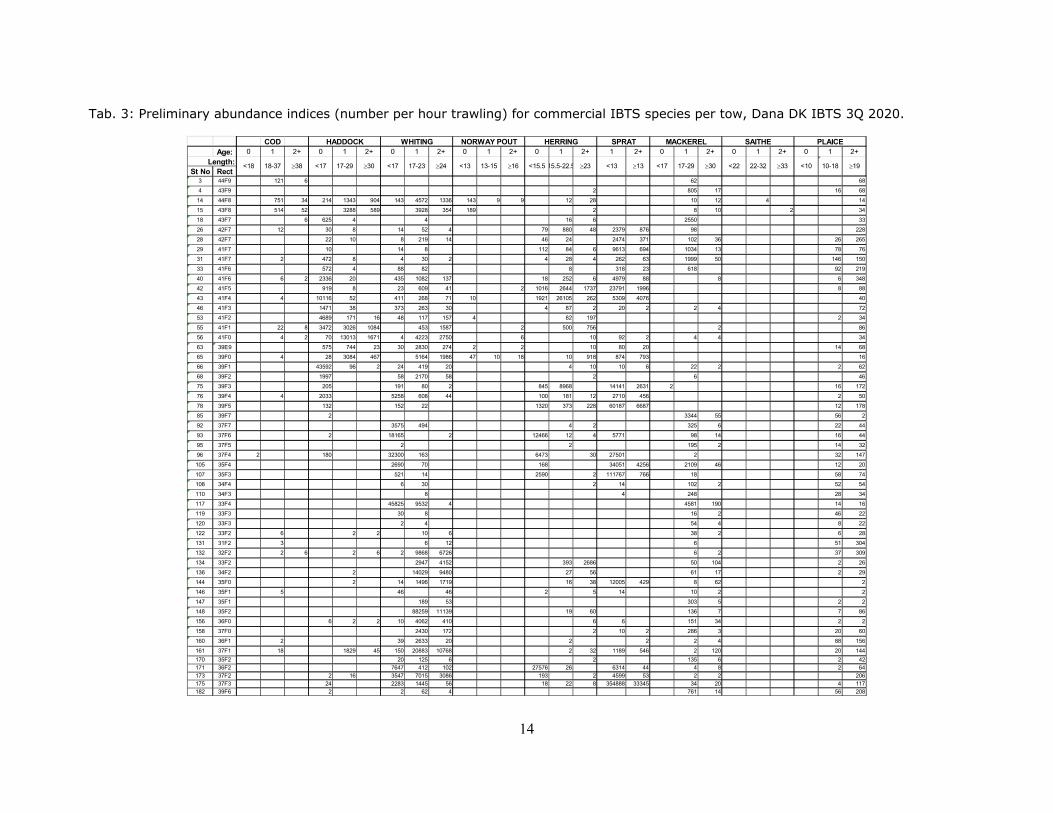
out adjacent to the standard 30-minute tow in rectangle 39F6. This was done in order to supplement an existing international data set for analyzing the effect of tow duration on catch rates of demersal fish species. Results Routine sampling The trawl parameters for the standard tows (Vertical net opening and door spread) as monitoring with a Scanmar system were in the range or close to the suggested limits specified in the IBTS manual in most cases (Fig. 3). A brand new polyethylene (PE) GOV trawl was used which showed some deviations from the net geometry observed with an older PE GOV applied in the past two years durin the first part of the survey. The reasons that the two PE GOV’s are obviously not identical although delivered from the same company could not be resolved. The remaining deviations from the theoretical values for door spread and in particular net opening from flume tank experiments can likely be attributed to the high sensibility of the GOV to current effects and bottom type. Sensors for wing spread have not been available on this survey. In total, 77 different species of fish, cephalopods and crustaceans were found in catches. The total weight of the catches from the 58 tows has been 32 tons (Tab. 1). Total catch and species richness in the standard tows ranged from 26 kg to 3.7 tons and from 12 to 33 different fish and IBTS invertebrate species, and high and species-rich catches were predominantly recorded in the southern and southwestern part of the survey area (Fig. 4). Length measurements were made for all commercial and non-commercial fish species. Sharks, skates and rays and selected shellfish species were measured separately by sex (length composition and weight). Single fish data (length, weight, sex and maturity) and otoliths were collected for the main commercial species (cod, haddock, whiting, Norway pout, saithe, herring, sprat, mackerel and plaice) as well as for hake in order to fulfil requirements of the national DCF (Data Collection Framework of the European Union) sampling requirements (Tab. 2). The preliminary abundance indices for the main commercial species indicate that e.g. whiting but also mackerel and plaice were widely distributed in the survey area whereas cod was quite rare and it appears noteworthy that only very few 0-group cod was caught (Tab. 3). Catch and species composition for the experimental tows (Fig. 6, Tab. 4) will further be analyzed in combination with the international data collected on this issue in the previous years. Total ‘fishing’ time and additional time the trawl was on the bottom outside the nominal tow duration of the 30 min standard tows ranged from 9 to 19 min and 4 to 9 min, respectively, of which total fishing time is positively correlated to depth, and winch speed during deployment and retrieval amounted to about 0.9 and 1.1 m/s on average (Fig. 5). Marine litter was recorded in each GOV catch using four main categories: plastic, glass, metals and miscellaneous, which were subdivided in several minor categories to meet the request by the IBTS Working Group. The total amount of marine litter was 14.3 kg. Temperature, salinity and dissolved oxygen content at surface and bottom were extracted from the CTD profiles for storage in the institute’s fish data base. The temperature and salinity values will be submitted to the ICES DATRAS database together with the GOV catch
5
results and measurements of surface and bottom currents (speed and direction) at the trawl stations to DATRAS, and the complete CTD profiles will be submitted to the ICES hydrographical data center. Additional activities Selected fish and squid species collections were taken for education and open ship arrangements at DTU Aqua. Results of the plankton sampling conducted during night will be reported later somewhere else. Others A cruise summary report has been delivered online to http://seadata.bsh.de/csr/online/V1_index.html.
6
Fig. 1: Survey map with cruise track and sampling locations, Dana DK IBTS 3Q 2020.
-4° -2° 0° 2° 4° 6° 8° 10°
50°
51°
52°
53°
54°
55°
56°
57°
58°
59°
60°
61°
62°

7
Fig. 2. Wind speed (m/s) and wind direction (°) recorded along the cruise track, Dana DK IBTS 3Q 2020.
8
Fig. 3: Warp length, net opening and door spread in relation to depth, Dana DK IBTS 3Q 2020.
9
Fig. 4: Total catch (symbols) and species richness (numbers), Dana DK IBTS 3Q 2020.
-4° -2° 0° 2° 4° 6° 8° 10°
50°
51°
52°
53°
54°
55°
56°
57°
58°
59°
60°
61°
62°
20
1627
16
18
27
31
23
2014
1920
16
16
12
16
21
17
26
2417
22
19
14
25
18
19
15
13
25
21
14
20
17
22
141620
22
16
16
16
16
22
24
19
15
33
15
22
20
19
22 17
10
Depth (m)
20 30 40 50 60 70 80 90 100
Dur
atio
n ou
tsid
e no
min
al to
win
g tim
e (m
in)
8
10
12
14
16
18
20
Depth (m)
20 30 40 50 60 70 80 90 100
Tra
wl a
t bot
tom
out
side
nom
inal
tow
dur
atio
n (m
in)
3
4
5
6
7
8
9
10
Winch speed down (m/s)
0.3 0.4 0.5 0.6 0.7 0.8 0.9 1.0 1.1 1.2 1.3
Num
ber
of to
ws
0
5
10
15
20
25
Winch speed up (m/s)
0.7 0.8 0.9 1.0 1.1 1.2 1.3 1.4 1.5
Num
ber
of to
ws
0
2
4
6
8
10
12
14
16
Fig. 5: Fishing times outside the nominal tow duration and winch speeds during descend and ascent, Dana DK IBTS 3Q 2020.

11
Fig. 6: Towing tracks of the experimental 0- and 15-min tow in rectangle 39F6, Dana DK IBTS 3Q2020.
6.58 6.59 6.60 6.61 6.6255.24
55.25
55.26
55.27
55.28
55.29
55.30
St 182
Deployment
Retrieval
Nominal30 mintowingpath
St 184
St 185
on bottom
Nominal15 mintowingpath
St 186
St 187
12
Tab. 1: Species list, Dana DK IBTS 3Q 2020 (L: total length in cm below (fish); ML: mantle length (cephlapods); CPL or CPW: carapace length or width (crusteaceans).
Latin name English name Danish name Weight (kg) Number Lmin (cm) Lmax (cm) Remark
Aequipecten opercularis Queen scallop Jomfruøsters 0.307 5 - -
Agonus cataphractus Pogge Panser ulk 0.106 7 9.0 15.0
Alloteuthis subulata European common squid Dværgblæksprutte 31.792 6643 2.0 14.0 ML
Amblyraja radiata Starry ray Tærbe 5.060 12 11.0 45.0
Ammodytes marinus Lesser sandeel Tobis‐hav 2.463 174 4.5 21.0
Anarhichas lupus Catfish Stribet havkat 3.840 1 74.0 74.0
Arnoglossus laterna Scaldfish Tungehvarre 0.828 68 7.0 14.0
Buglossidium luteum Solenette Glastunge 1.290 137 6.0 14.0
Callionymus lyra Common dragonet Stribet fløjfisk 6.940 156 9.0 25.0
Callionymus reticulatus Reticulated dragonet Kortfinnet fløjfisk 0.018 2 10.0 15.0
Cancer pagurus Edible crab Taskekrabbe 78.137 181 5.1 20.0 CPW
Chelidonichthys cuculus Red gurnard Tværstribet knurhane 1.514 13 19.0 26.0
Chelidonichthys lucerna Tub gurnard Rød knurhane 20.539 63 19.0 51.0
Clupea harengus Herring Sild 1597.168 51484 6.5 32.0
Dicentrarchus labrax Bass Havbars 7.138 7 35.0 58.0
Echiichthys vipera Lesser weever Fjæsing lille 35.969 1877 5.0 17.0
Eledone cirrhosa Horned octopus Eledone Blæksprutte 0.935 1 - -
Enchelyopus cimbrius Four‐bearded rockling Firetrådet havkvabbe 5.226 148 13.0 25.0
Engraulis encrasicolus Anchovy Ansjos 0.461 16 13.0 19.0
Entelurus aequoreus Snake pipefish Snippe 0.072 6 30.0 46.0
Eutrigla gurnardus Grey gurnard Grå knurhane 939.987 15459 12.0 35.0
Gadus morhua Cod Torsk 275.231 800 11.0 90.0
Galeorhinus galeus Tope Gråhaj 298.562 27 38.0 157.0
Glyptocephalus cynoglossus Witch Skærising 0.400 2 28.0 31.0
Gymnammodytes semisquamatus Smoothed sandeel Tobis‐nøgen 17.637 1116 14.5 20.5
Helicolenus dactylopterus Blackbelly rosefish Blåkjeft 1.198 17 14.0 18.0
Hippoglossoides platessoides American plaice Håising 101.339 2229 10.0 27.0
Homarus gammarus European lobster Almindelig hummer 22.497 43 4.5 14.6 CPL
Hyperoplus lanceolatus Greater sandeel Tobiskonge 136.874 4479 13.5 33.0
Illex coindetii Southern shortfin squid Illex coindetii 4.620 60 8.0 24.0 ML
Limanda limanda Common dab Ising 3393.237 57386 5.0 32.0
Lithodes maja Norway king crab Troldkrabbe 0.490 2 7.5 9.5 CPW
Loliginidae Loliginidae 103.090 1963 2.0 26.0 ML
Loligo forbesii Northern squid Loligo forbesii 32.346 566 3.0 30.0 ML
Loligo sp Loligo sp Loligo forbesi/vulgaris 1.554 558 2.0 5.0 ML
Loligo vulgaris European squid Loligo vulgaris 0.255 1 18.0 18.0 ML
Lophius piscatorius Monk Havtaske 3.704 6 16.0 46.0
Lycodes gracilis Vahls eelpout Ålebromse 0.044 2 15.0 16.0
Maja squinado Common spider crab Edderkoppekrabbe 1.362 2 12.0 12.9 CPL
Melanogrammus aeglefinus Haddock Kuller 3861.604 52716 8.0 42.0
Merlangius merlangus Whiting Hvilling 11895.768 177535 4.0 40.0
Merluccius merluccius Hake Kulmule 118.256 82 17.0 103.0
Microstomus kitt Lemon sole Rødtunge 222.968 1904 11.0 33.0
Molva molva Ling Lange 6.050 7 45.0 68.0
Mullus surmuletus Striped red mullet Stribet (rød) Mulle 44.650 501 13.0 30.0
Mustelus asterias Starry smooth‐hound Stjernehaj 105.443 58 52.0 105.0
Mustelus mustelus Smooth hound Glathaj 62.604 30 59.0 125.0
Myoxocephalus scorpius Bull rout Ulk 1.087 15 12.0 23.0
Myxine glutinosa Hagfish Slimål 0.048 1 - -
Nephrops norvegicus Norway lobster Jomfruhummer 16.397 438 2.1 5.5 CPL
Pecten maximus Great scallop Stor kammusling 0.077 1 - -
Platichthys flesus Flounder Skrubbe 4.827 17 24.0 36.0
Pleuronectes platessa Plaice Rødspætte 410.142 2974 11.0 55.0
Pollachius virens Saithe Sej 4.568 3 26.0 77.0
Pomatoschistus sp Sand gobies Sand kutlinger 0.004 3 4.0 6.0
Raja brachyura Blonde ray Blond rokke 9.494 6 46.0 82.0
Raja clavata Thornback ray Sømrokke 49.200 31 22.0 86.0
Raja montagui Spotted Ray Storplettet Rokke 7.715 14 20.0 49.0
Rossia macrosoma Stout bobtail squid Ross's blæksprutte 0.038 4 - -
Sardina pilchardus Pilchard Sardin 51.064 551 14.0 25.0
Scomber scombrus Mackerel Makrel 1537.486 11431 8.0 43.0
Scophthalmus maximus Turbot Pighvarre 23.952 27 17.0 58.0
Scophthalmus rhombus Brill Slethvarre 10.640 14 21.0 46.0
Scyliorhinus canicula Lesser‐spotted dogfish Småplettet rødhaj 261.844 531 16.0 67.0
Sepia officinalis Common cuttlefish Sepiablæksprutte 1.199 5 9.0 14.0
Solea solea Sole Tunge 6.036 68 15.0 34.0
Spondyliosoma cantharus Black sea bream Havrude 0.250 1 24.0 24.0
Sprattus sprattus Sprat Brisling 4726.151 373253 3.0 14.5
Squalus acanthias Spurdog Pighaj 17.526 6 46.0 109.0
Taurulus bubalis Sea scorpion Langtornet ulk 0.375 6 14.0 20.0
Todaropsis eblanae Lesser flying squid Todaropsis eblanae 0.377 4 9.0 17.0 ML
Trachinus draco Greater weever fish Fjæsing 49.130 265 16.0 40.0
Trachurus trachurus Horse mackerel Hestemakrel 1377.969 22505 2.0 39.0
Trisopterus esmarkii Norway pout Sperling 1.641 227 3.0 18.0
Trisopterus luscus Bib Skægtorsk 3.549 59 10.0 23.0
Trisopterus minutus Poor‐cod Glyse 11.696 501 6.0 22.0
Zeus faber John dory Sct. Peter fisk 1.448 6 21.0 26.0

13
Tab. 2: Number of single fish data (length, individual weight, and sex; maturity for herring, sprat and hake) and samples for ageing (hake: not read), Dana DK IBTS 3Q 2020.
Species Total
Herring (Clupea harengus) 485
Sprat (Sprattus sprattus) 220
Cod (Gadus morhua) 138
Haddock (Melanogrammus aeglefinus) 290
Whiting (Merlangius merlangus) 577
Saithe (Pollachius virens) 3
Norway pout (Trisopterus ermarkii) 13
Mackerel (Scomber scombrus) 340
Plaice (Pleuronectes platessa) 694
Hake (Merluccius merluccius) 65
Sum: 2825
14
Tab. 3: Preliminary abundance indices (number per hour trawling) for commercial IBTS species per tow, Dana DK IBTS 3Q 2020.
COD HADDOCK WHITING NORWAY POUT HERRING MACKEREL SAITHE PLAICEAge: 0 1 2+ 0 1 2+ 0 1 2+ 0 1 2+ 0 1 2+ 1 2+ 0 1 2+ 0 1 2+ 0 1 2+
St No Rect3 44F9 121 6 62 68
4 43F9 2 805 17 16 68
14 44F8 751 34 214 1343 904 143 4572 1336 143 9 9 12 28 10 12 4 14
15 43F8 514 52 3288 589 3928 354 189 2 8 10 2 34
18 43F7 6 625 4 4 16 6 2550 33
26 42F7 12 30 8 14 52 4 79 880 48 2379 876 98 228
28 42F7 22 10 8 219 14 46 24 2474 371 102 36 26 265
29 41F7 10 14 8 112 84 6 9613 694 1034 13 78 76
31 41F7 2 472 8 4 30 2 4 28 4 262 63 1999 50 146 150
33 41F6 572 4 88 82 8 318 23 618 92 219
40 41F6 6 2 2336 20 435 1082 137 18 252 6 4979 88 8 6 348
42 41F5 919 8 23 609 41 2 1016 2644 1737 23791 1996 8 88
43 41F4 4 10116 52 411 268 71 10 1921 26105 262 5309 4076 40
46 41F3 1471 38 373 263 30 4 87 2 20 2 2 4 72
53 41F2 4689 171 16 48 117 157 4 82 197 2 34
55 41F1 22 8 3472 3026 1084 453 1587 2 500 756 2 86
56 41F0 4 2 70 13013 1671 4 4223 2750 6 10 92 2 4 4 34
63 39E9 575 744 23 30 2830 274 2 2 10 80 20 14 68
65 39F0 4 28 3084 467 5164 1986 47 10 18 10 918 874 793 16
66 39F1 43592 96 2 24 419 20 4 10 10 6 22 2 2 62
68 39F2 1997 58 2170 58 2 6 46
75 39F3 205 191 80 2 845 8968 14141 2631 2 16 172
76 39F4 4 2033 5258 608 44 100 181 12 2710 456 2 50
78 39F5 132 152 22 1320 373 228 60187 6687 12 178
85 39F7 2 3344 55 56 2
92 37F7 3575 494 4 2 325 6 22 44
93 37F6 2 18165 2 12466 12 4 5771 98 14 16 44
95 37F5 2 2 195 2 14 32
96 37F4 2 180 32300 163 6473 30 27501 2 32 147
105 35F4 2690 70 168 34051 4256 2109 46 12 20
107 35F3 521 14 2590 2 111767 766 18 58 74
108 34F4 6 30 2 14 102 2 52 54
110 34F3 8 4 248 28 34
117 33F4 45825 9532 4 4581 190 14 16
119 33F3 30 8 16 2 46 22
120 33F3 2 4 54 4 8 22
122 33F2 6 2 2 10 6 38 2 6 28
131 31F2 3 6 12 6 51 304
132 32F2 2 6 2 6 2 9868 6726 6 2 37 309
134 33F2 2947 4152 393 2686 50 104 2 26
136 34F2 2 14029 9480 27 56 61 17 2 29
144 35F0 2 14 1496 1719 16 38 12005 429 8 62 2
146 35F1 5 46 46 2 5 14 10 2 2
147 35F1 189 53 303 5 2 2
148 35F2 88259 11139 19 60 136 7 7 86
156 36F0 6 2 2 10 4062 410 6 6 151 34 2 2
158 37F0 2430 172 2 10 2 286 3 20 60
160 36F1 2 39 2633 20 2 2 2 4 88 156
161 37F1 18 1829 45 150 20883 10768 2 32 1189 546 2 120 20 144
170 35F2 20 125 6 2 135 6 2 42171 36F2 7647 412 102 27576 26 6314 44 4 8 2 64173 37F2 2 16 3547 7015 3086 193 2 4599 53 2 2 206175 37F3 24 2283 1445 56 18 22 8 354888 33345 34 20 4 117182 39F6 2 2 62 4 761 14 56 208
Length:<18 18-37 38 <17 17-29 30 <17 17-23 24 <13 13-15 16 <15.5 15.5-22.5 23 <13 13 <10 10-18 19
SPRAT
33<17 17-29 30 <22 22-32
15
Tab. 4: Comparison of catch composition of experimental tows with the standard tow in 39F6, Dana DK IBTS 3Q 2020.
3Q2020 39F6
Group Species W (kg) N Lmin Lmax W (kg) N Lmin Lmax W (kg) N Lmin Lmax W (kg) N Lmin Lmax W (kg) N Lmin Lmax
Pelagic fish Mackerel 55.016 387 24.0 35.0 16.300 114 23.0 33.0 0.914 6 23.0 27 13.100 100 23 34.0 81.545 551 24.0 30Demersal gadoids Whiting 2.260 34 9.0 24.0 0.182 2 21.0 24.0 0.111 2 18.0 21.0 6.860 89 17.0 26.0 0.865 12 18.0 24.0
Haddock 0.029 1 14.0 14Flatfish Solenette 0.011 3 6.0 8.0 0.003 1 6.0 6.0
Common dab 136.711 2080 12.0 26.0 19.859 288 12.0 23.0 22.618 329 11.0 28.0 22.920 363 11.0 25.0 62.777 1013 11.0 25.0
Plaice 18.060 132 14.0 55.0 2.384 14 15.0 33.0 4.520 29 15.0 33.0 3.780 24 18.0 34.0 8.340 60 15.0 34.0
Brill 0.700 1 36.0 36Other demersal fish Horse mackerel 2.432 43 3.0 27.0 0.002 3 2.0 4.0 0.004 3 3.0 5.0 0.179 6 4.0 25.0 0.007 6 4.0 5.0
Grey gurnard 6.585 133 13.0 24.0 0.942 17 14.0 25.0 0.618 15 15.0 19.0 3.012 52 14.0 23.0 6.109 129 13.0 23.0
Tub gurnard 1.149 4 24.0 35.0 0.120 1 22.0 22.0
Common dragonet 0.025 1 18.0 18 0.023 1 18.0 18 0.031 1 17.0 17
Striped red mullet 0.473 2 21.0 29.0 0.473 5 19.0 22.0
Greater sandeel 0.199 6 21.0 25.5 0.468 14 20.5 25.5 0.169 5 21.0 25.5 1.251 38 20.5 28.0
Lesser‐spotted dogfish 0.442 1 46.0 46.0Crustaceans Edible crab 2.830 4 11.3 18.2 0.207 1 12.0 12.0 0.900 2 14.3 16.1 0.739 1 16.4 16.4 0.442 2 8.8 12.9
European lobster 0.684 1 10.3 10.3 0.772 1 10.3 10.3Molluscs European common squid 0.712 249 3.0 5.0 0.042 18 2.0 4.0 1.202 367 3.0 6.0 0.018 7 3.0 5.0 2.152 689 3.0 7.0
Northern squid 0.907 9 8.0 19.0 0.053 2 7.0 8.0 0.029 1 8.0 8.0 0.646 5 8.0 21.0
Lesser flying squid 0.264 2 15.0 17.0
55.016 387 24.0 35.0 16.300 114 23.0 33.0 0.914 6 23.0 27.0 13.100 100 23.0 34.0 81.545 551 24.0 30.0
167.934 2439 3.0 55.0 23.837 338 2.0 33.0 28.766 386 3.0 36.0 38.595 578 4.0 34.0 78.129 1221 4.0 34.0
pel. fish 29.6 29.4 1.7 1.5 23.8 25.8 148.2 142.1 % of standard tow
dem. fish 14.2 13.9 17.1 15.8 23.0 23.7 46.5 50.1 % of standard tow
1 1Total number demersal fish taxa 11 6 9 9 6
Total demersal fish
Total number of pelagic fish taxa 1 1 1
Station 182 (standard tow) Station 184 (zero-minute tow) Station 185 (zero-minute tow) Station 186 (zero-minute tow)
Total pelagic fish
Station 187 (15-minute tow)