russia 50 2017 - brand financebrandfinance.com/images/upload/russia_50_2017_locked_eng.pdf · 4....
TRANSCRIPT
Russia 502017The annual report on the most valuable Russian brandsApril 2017
Brand Finance Russia 50 April 2017 3.Brand Finance Australia 100 March 2016 2. 3.Brand Finance Global 500 February 2016 2. Brand Finance Airlines 30 30 February 2015 2.
Brand Finance Russia 50 April 2017 2.
Foreword.
Foreword 2
Definitions 4
Methodology 6
Understand Your Brand’s Value 7
Executive Summary 8
Full Table (RUBm) 12
Full Table (USDm) 13
How We Can Help 14
Contact Details 15
Contents
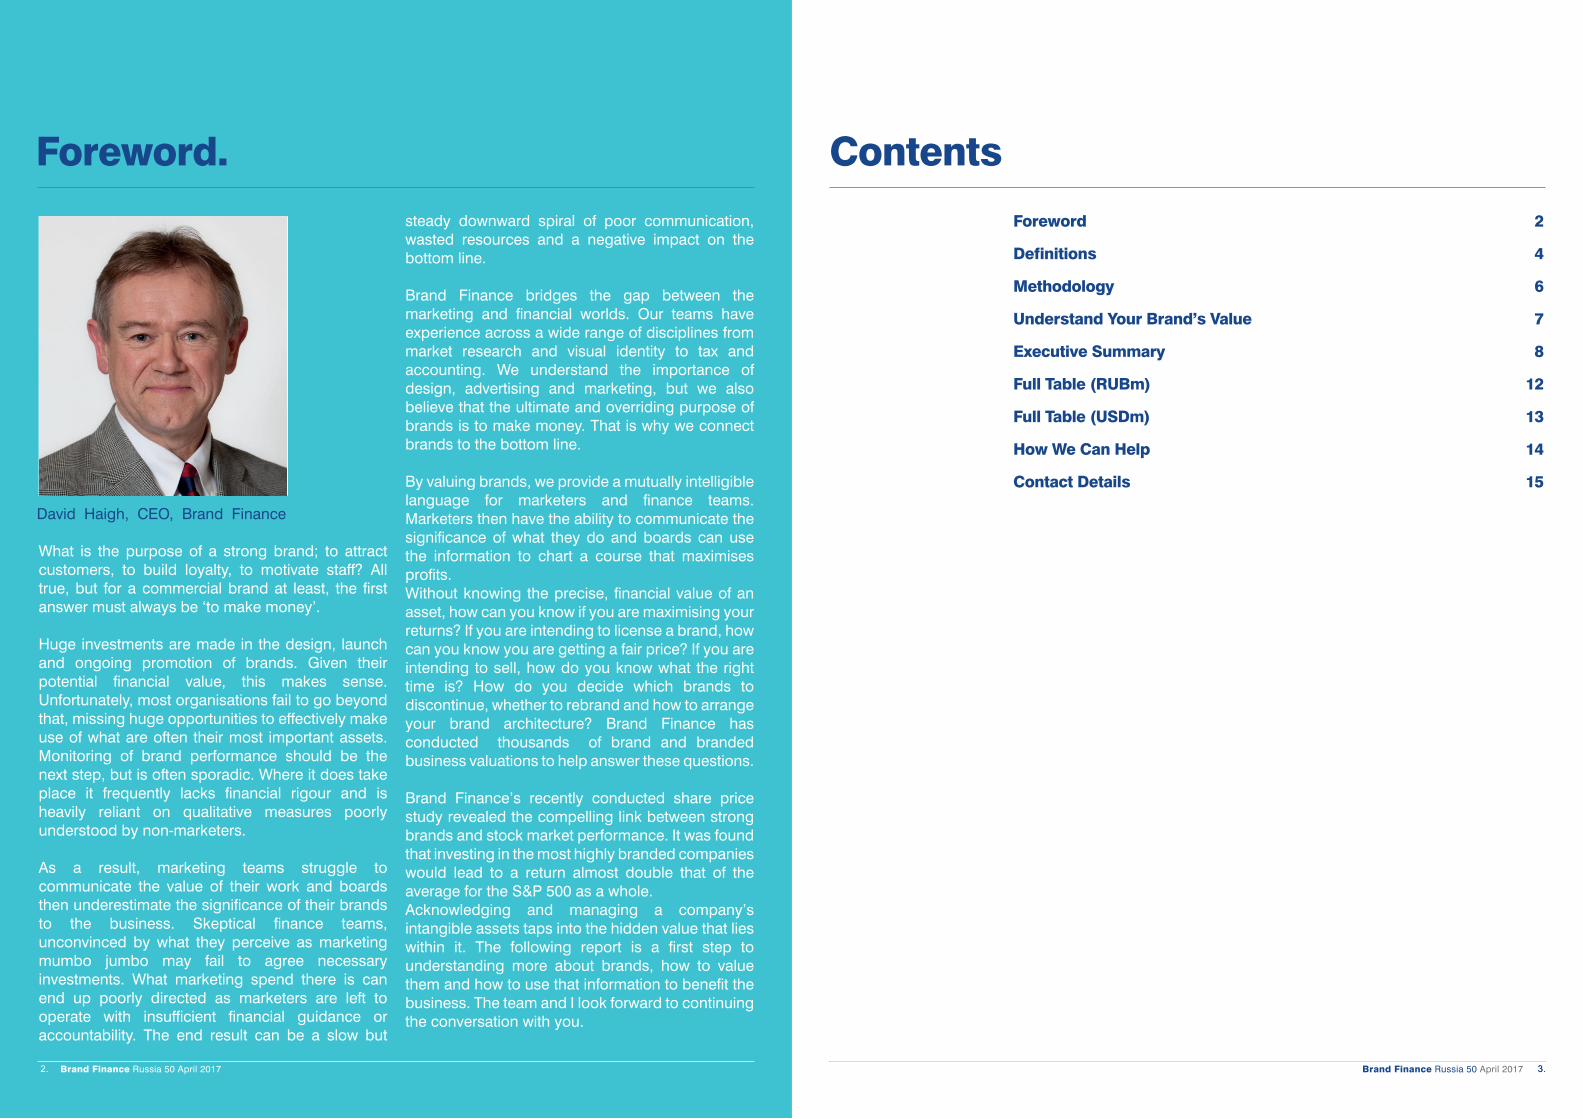
David Haigh, CEO, Brand Finance
What is the purpose of a strong brand; to attract customers, to build loyalty, to motivate staff? All true, but for a commercial brand at least, the first answer must always be ‘to make money’.
Huge investments are made in the design, launch and ongoing promotion of brands. Given their potential financial value, this makes sense. Unfortunately, most organisations fail to go beyond that, missing huge opportunities to effectively make use of what are often their most important assets. Monitoring of brand performance should be the next step, but is often sporadic. Where it does take place it frequently lacks financial rigour and is heavily reliant on qualitative measures poorly understood by non-marketers.
As a result, marketing teams struggle to communicate the value of their work and boards then underestimate the significance of their brands to the business. Skeptical finance teams, unconvinced by what they perceive as marketing mumbo jumbo may fail to agree necessary investments. What marketing spend there is can end up poorly directed as marketers are left to operate with insufficient financial guidance or accountability. The end result can be a slow but
steady downward spiral of poor communication, wasted resources and a negative impact on the bottom line.
Brand Finance bridges the gap between the marketing and financial worlds. Our teams have experience across a wide range of disciplines from market research and visual identity to tax and accounting. We understand the importance of design, advertising and marketing, but we also believe that the ultimate and overriding purpose of brands is to make money. That is why we connect brands to the bottom line.
By valuing brands, we provide a mutually intelligible language for marketers and finance teams. Marketers then have the ability to communicate the significance of what they do and boards can use the information to chart a course that maximises profits. Without knowing the precise, financial value of an asset, how can you know if you are maximising your returns? If you are intending to license a brand, how can you know you are getting a fair price? If you are intending to sell, how do you know what the right time is? How do you decide which brands to discontinue, whether to rebrand and how to arrange your brand architecture? Brand Finance has conducted thousands of brand and branded business valuations to help answer these questions.
Brand Finance’s recently conducted share price study revealed the compelling link between strong brands and stock market performance. It was found that investing in the most highly branded companies would lead to a return almost double that of the average for the S&P 500 as a whole. Acknowledging and managing a company’s intangible assets taps into the hidden value that lies within it. The following report is a first step to understanding more about brands, how to value them and how to use that information to benefit the business. The team and I look forward to continuing the conversation with you.
Brand Finance Russia 50 April 2017 5.Brand Finance Russia 50 April 2017 4.
Definitions
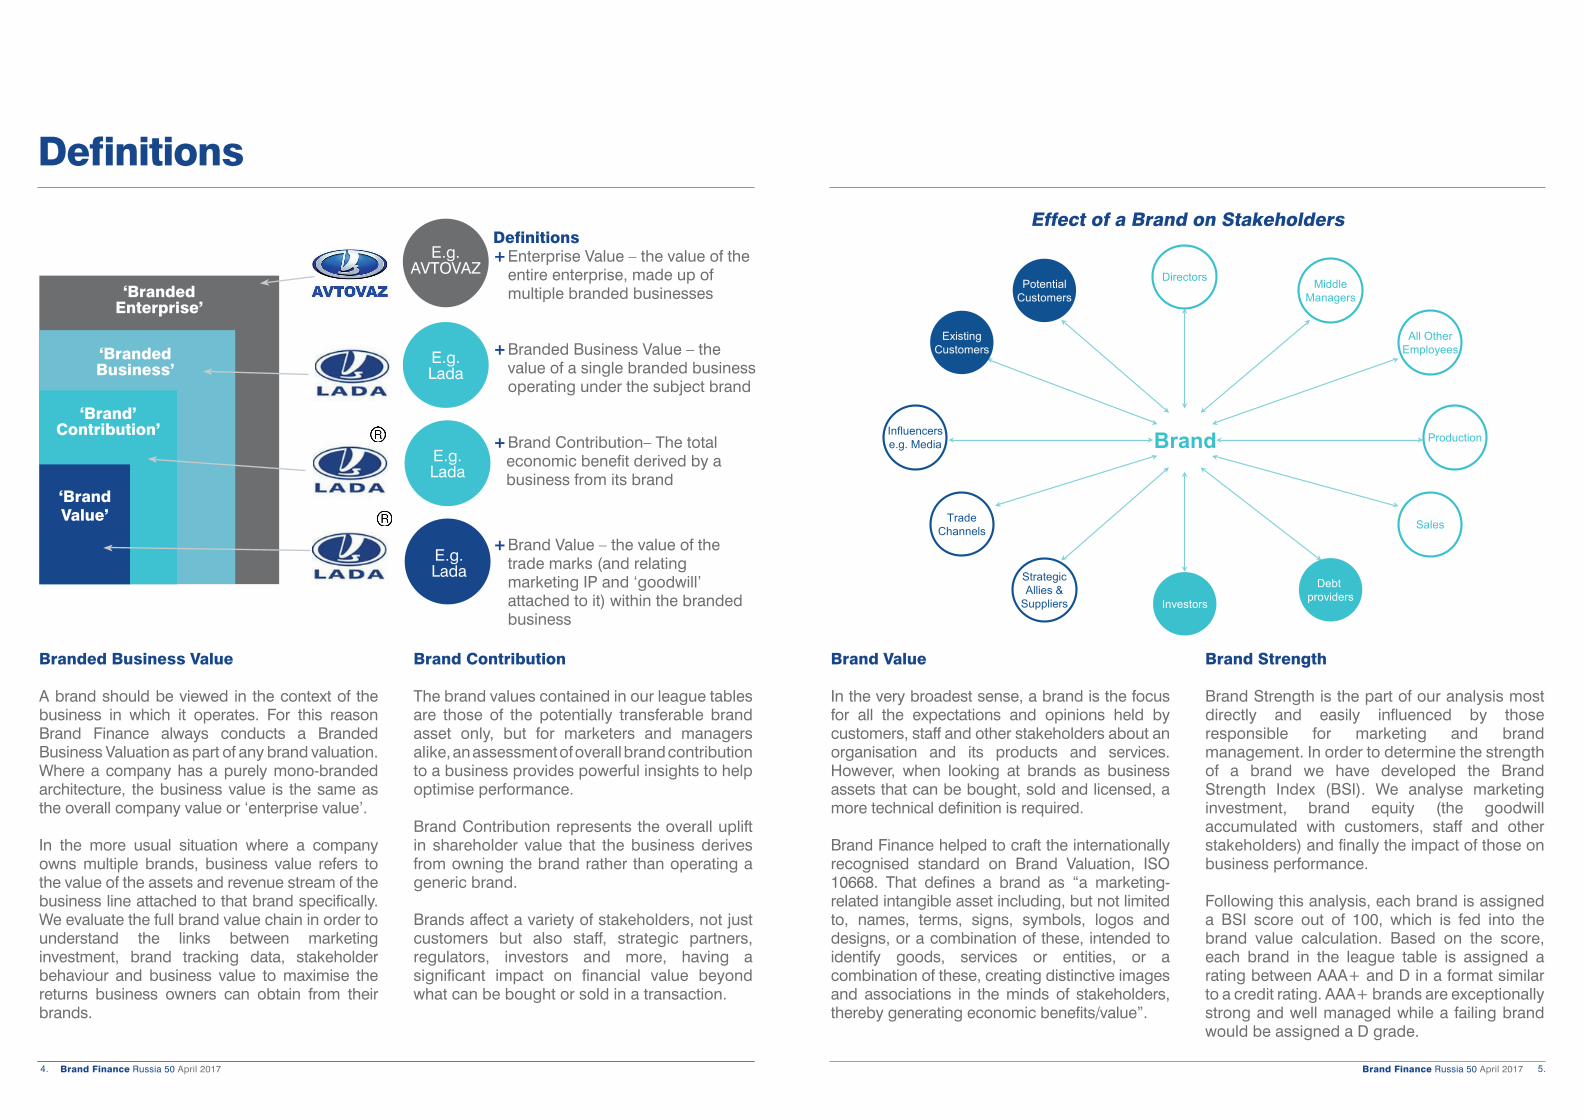
Definitions+ Enterprise Value – the value of the
entire enterprise, made up of multiple branded businesses
+ Branded Business Value – the value of a single branded business operating under the subject brand
+ Brand Contribution– The total economic benefit derived by a business from its brand
+ Brand Value – the value of the trade marks (and relating marketing IP and ‘goodwill’ attached to it) within the branded business
‘Branded Business’
‘Branded Enterprise’
E.g.AVTOVAZ
E.g.Lada
E.g.Lada
‘Brand Value’
‘Branded Business’
‘Branded Enterprise’
‘Brand’ Contribution’
E.g.Lada
Branded Business Value
A brand should be viewed in the context of the business in which it operates. For this reason Brand Finance always conducts a Branded Business Valuation as part of any brand valuation. Where a company has a purely mono-branded architecture, the business value is the same as the overall company value or ‘enterprise value’.
In the more usual situation where a company owns multiple brands, business value refers to the value of the assets and revenue stream of the business line attached to that brand specifically. We evaluate the full brand value chain in order to understand the links between marketing investment, brand tracking data, stakeholder behaviour and business value to maximise the returns business owners can obtain from their brands.
Brand Contribution
The brand values contained in our league tables are those of the potentially transferable brand asset only, but for marketers and managers alike, an assessment of overall brand contribution to a business provides powerful insights to help optimise performance.
Brand Contribution represents the overall uplift in shareholder value that the business derives from owning the brand rather than operating a generic brand.
Brands affect a variety of stakeholders, not just customers but also staff, strategic partners, regulators, investors and more, having a significant impact on financial value beyond what can be bought or sold in a transaction.
Brand Value
In the very broadest sense, a brand is the focus for all the expectations and opinions held by customers, staff and other stakeholders about an organisation and its products and services. However, when looking at brands as business assets that can be bought, sold and licensed, a more technical definition is required.
Brand Finance helped to craft the internationally recognised standard on Brand Valuation, ISO 10668. That defines a brand as “a marketing-related intangible asset including, but not limited to, names, terms, signs, symbols, logos and designs, or a combination of these, intended to identify goods, services or entities, or a combination of these, creating distinctive images and associations in the minds of stakeholders, thereby generating economic benefits/value”.
Brand Strength
Brand Strength is the part of our analysis most directly and easily influenced by those responsible for marketing and brand management. In order to determine the strength of a brand we have developed the Brand Strength Index (BSI). We analyse marketing investment, brand equity (the goodwill accumulated with customers, staff and other stakeholders) and finally the impact of those on business performance.
Following this analysis, each brand is assigned a BSI score out of 100, which is fed into the brand value calculation. Based on the score, each brand in the league table is assigned a rating between AAA+ and D in a format similar to a credit rating. AAA+ brands are exceptionally strong and well managed while a failing brand would be assigned a D grade.
Effect of a Brand on Stakeholders
PotentialCustomers
ExistingCustomers
Influencerse.g. Media
TradeChannels
StrategicAllies &
Suppliers Investors
Debt providers
Sales
Production
All OtherEmployees
MiddleManagers
Directors
Brand
Brand Finance Russia 50 April 2017 7.Brand Finance Russia 50 April 2017 6.
Methodology
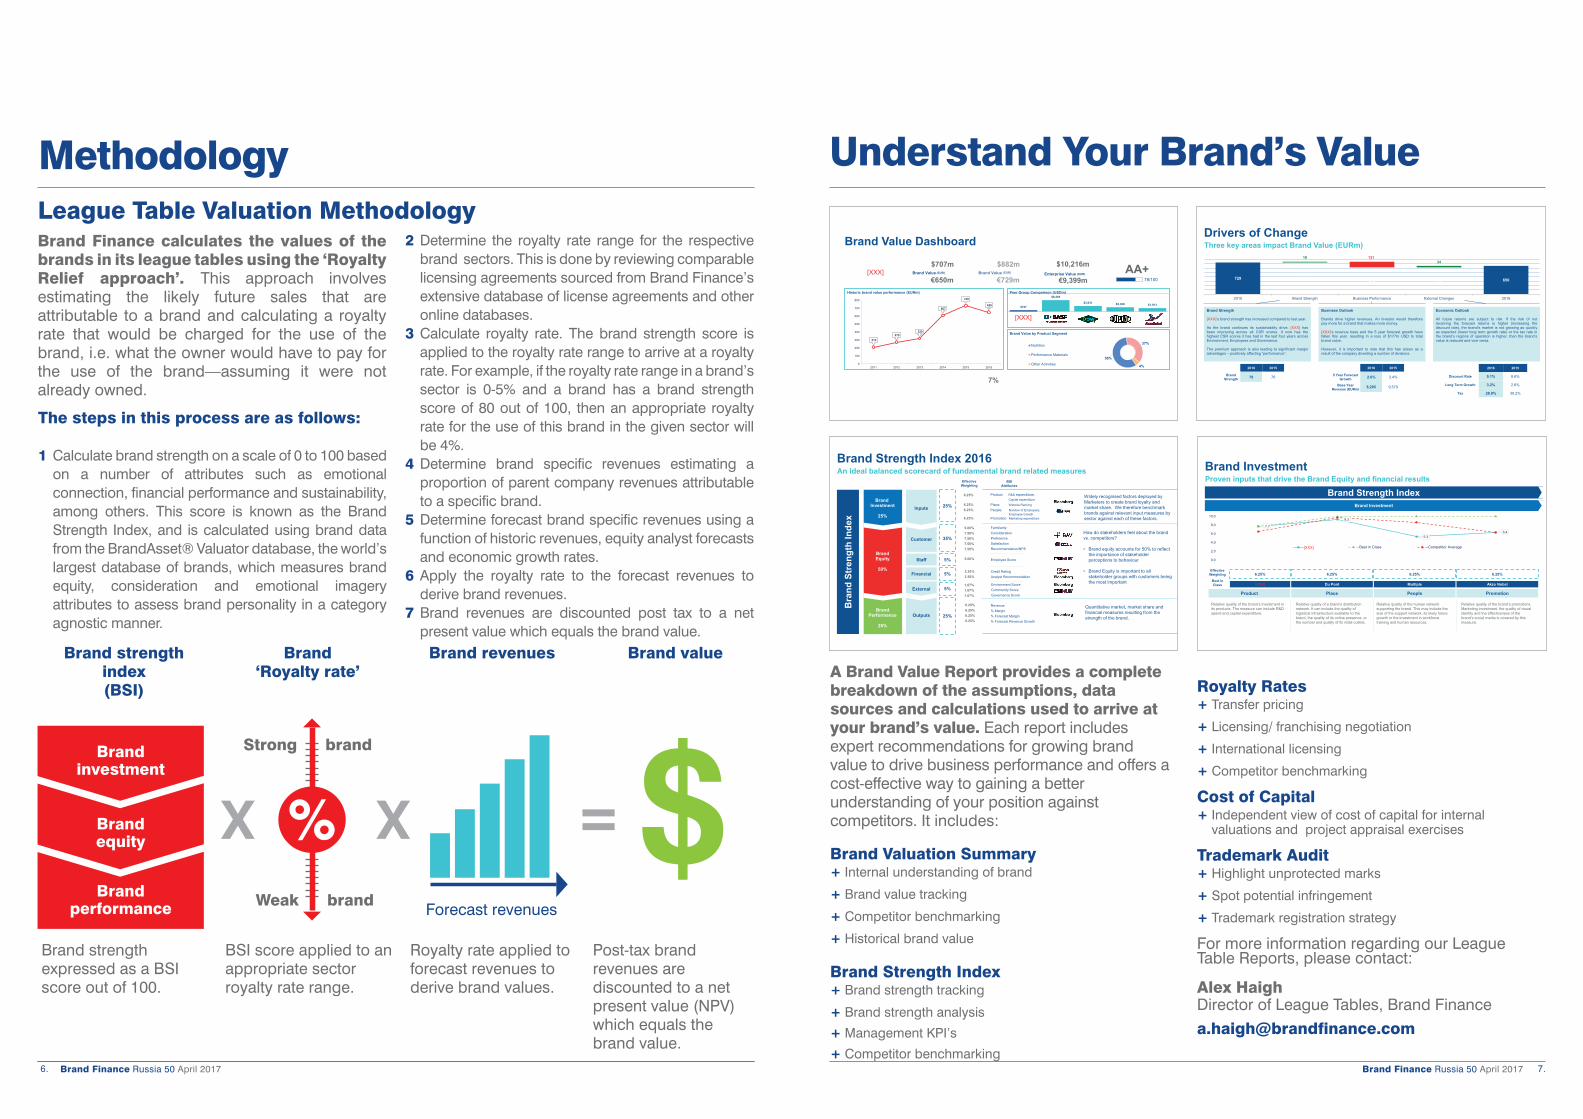
Brand Finance calculates the values of the brands in its league tables using the ‘Royalty Relief approach’. This approach involves estimating the likely future sales that are attributable to a brand and calculating a royalty rate that would be charged for the use of the brand, i.e. what the owner would have to pay for the use of the brand—assuming it were not already owned.
Brand strength expressed as a BSI score out of 100.
BSI score applied to an appropriate sector royalty rate range.
Royalty rate applied to forecast revenues to derive brand values.
Post-tax brand revenues are discounted to a net present value (NPV) which equals the brand value.
The steps in this process are as follows:
1 Calculate brand strength on a scale of 0 to 100 based on a number of attributes such as emotional connection, financial performance and sustainability, among others. This score is known as the Brand Strength Index, and is calculated using brand data from the BrandAsset® Valuator database, the world’s largest database of brands, which measures brand equity, consideration and emotional imagery attributes to assess brand personality in a category agnostic manner.
Strong brand
Weak brand
Brand strength index(BSI)
Brand‘Royalty rate’
Brand revenues Brand value
Forecast revenues
Brand investment
Brand equity
Brand performance
2 Determine the royalty rate range for the respective brand sectors. This is done by reviewing comparable licensing agreements sourced from Brand Finance’s extensive database of license agreements and other online databases.
3 Calculate royalty rate. The brand strength score is applied to the royalty rate range to arrive at a royalty rate. For example, if the royalty rate range in a brand’s sector is 0-5% and a brand has a brand strength score of 80 out of 100, then an appropriate royalty rate for the use of this brand in the given sector will be 4%.
4 Determine brand specific revenues estimating a proportion of parent company revenues attributable to a specific brand.
5 Determine forecast brand specific revenues using a function of historic revenues, equity analyst forecasts and economic growth rates.
6 Apply the royalty rate to the forecast revenues to derive brand revenues.
7 Brand revenues are discounted post tax to a net present value which equals the brand value.
League Table Valuation Methodology
Understand Your Brand’s Value
$707
$6,265
$3,031 $2,328 $1,913
213 275
320
607
729
650
0
100
200
300
400
500
600
700
800
2011 2012 2013 2014 2015 2016
58%
37%
4%
Nutrition
Performance Materials
Other Activities
Brand Value Dashboard
$707m AA+78/100
$10,216m
Peer Group Comparison (USDm)Historic brand value performance
Brand Value by Product Segment
7%
Brand Value
€650mEnterprise Value
€9,399m(EUR) (EUR)
(EURm)
$882mBrand Value
€729m(EUR)[XXX]
[XXX]
A Brand Value Report provides a complete breakdown of the assumptions, data sources and calculations used to arrive at your brand’s value. Each report includes expert recommendations for growing brand value to drive business performance and offers a cost-effective way to gaining a better understanding of your position against competitors. It includes:
Brand Valuation Summary+ Internal understanding of brand
+ Brand value tracking
+ Competitor benchmarking
+ Historical brand value
Brand Strength Index+ Brand strength tracking
+ Brand strength analysis
+ Management KPI’s
+ Competitor benchmarking
Royalty Rates+ Transfer pricing
+ Licensing/ franchising negotiation
+ International licensing
+ Competitor benchmarking
Cost of Capital+ Independent view of cost of capital for internal
valuations and project appraisal exercises
Trademark Audit+ Highlight unprotected marks
+ Spot potential infringement
+ Trademark registration strategy
For more information regarding our League Table Reports, please contact:
Alex HaighDirector of League Tables, Brand Finance
Drivers of ChangeThree key areas impact Brand Value (EURm)
Brand Strength
[XXX]’s brand strength has increased compared to last year.
As the brand continues its sustainability drive, [XXX] hasbeen improving across all CSR scores. It now has thehighest CSR scores it has had in the last four years acrossEnvironment, Employees and Governance.
The premium approach is also leading to significant marginadvantages – positively affecting “performance”.
Business Outlook
Brands drive higher revenues. An investor would thereforepay more for a brand that makes more money.
[XXX]’s revenue base and the 5 year forecast growth havefallen this year, resulting in a loss of $177m USD to totalbrand value.
However, it is important to note that this has arisen as aresult of the company divesting a number of divisions.
Economic Outlook
All future returns are subject to risk. If the risk of notreceiving the forecast returns is higher (increasing thediscount rate), the brand’s market is not growing as quicklyas expected (lower long term growth rate) or the tax rate inthe brand’s regions of operation is higher, then the brand’svalue is reduced and vice versa.
2016 2015
Discount Rate 9.1% 8.6%
Long Term Growth 3.2% 2.6%
Tax 28.9% 30.2%
2016 2015
5 Year Forecast Growth 2.6% 3.4%
Base Year Revenue (EURm) 8,205 9,570
2016 2015
BrandStrength 78 76
729 729 616 616 650
18 13134
2015 Brand Strength Business Performance External Changes 2016
Brand InvestmentProven inputs that drive the Brand Equity and financial results
Relative quality of the brand’s investment in its products. The measure can include R&D spend and capital expenditure.
Relative quality of a brand’s distribution network. It can include the quality of logistical infrastructure available to the brand, the quality of its online presence, or the number and quality of its retail outlets.
Relative quality of the human network supporting the brand. This may include the size of the support network, its likely future growth or the investment in workforce training and human resources.
Relative quality of the brand’s promotions. Marketing investment, the quality of visual identity and the effectiveness of the brand’s social media is covered by this measure.
Product Place People Promotion
Brand Investment
Brand Strength Index
6.25% 6.25% 6.25%
Du Pont Multiple Akzo Nobel
Effective Weighting
Best in Class
6.25%
[XXX]
7.7
9.3
5.36.4
0.0
2.0
4.0
6.0
8.0
10.0
DSM Best in Class Competitor Average[XXX]
Brand Strength Index 2016An ideal balanced scorecard of fundamental brand related measures
Widely recognised factors deployed by Marketers to create brand loyalty and market share. We therefore benchmark brands against relevant input measures by sector against each of these factors.
How do stakeholders feel about the brand vs. competitors?
• Brand equity accounts for 50% to reflect the importance of stakeholder perceptions to behaviour
• Brand Equity is important to all stakeholder groups with customers being the most important
Quantitative market, market share and financial measures resulting from the strength of the brand.
BSI Attributes
Product: R&D expenditure,Capital expenditure
Place: Website Ranking
People: Number of Employees,Employee Growth
Promotion: Marketing expenditure
FamiliarityConsiderationPreferenceSatisfactionRecommendation/NPS
Employee Score
Credit RatingAnalyst Recommendation
Environment ScoreCommunity ScoreGovernance Score
Revenue% Margin% Forecast Margin% Forecast Revenue Growth
Bra
nd S
tren
gth
Inde
x
35%
25%
5%
5%
5%
Effective Weighting
25%Brand
Investment
25%
BrandEquity
50%
BrandPerformance
25%
Customer
Outputs
Inputs
Staff
Financial
External
6.25%
6.25%6.25%
6.25%
5.00%7.50%7.50%7.50%7.50%
5.00%
2.50%2.50%
1.67%1.67%1.67%
6.25% 6.25% 6.25% 6.25%
Brand Finance Russia 50 April 2017 9.Brand Finance Russia 50 April 2017 8.
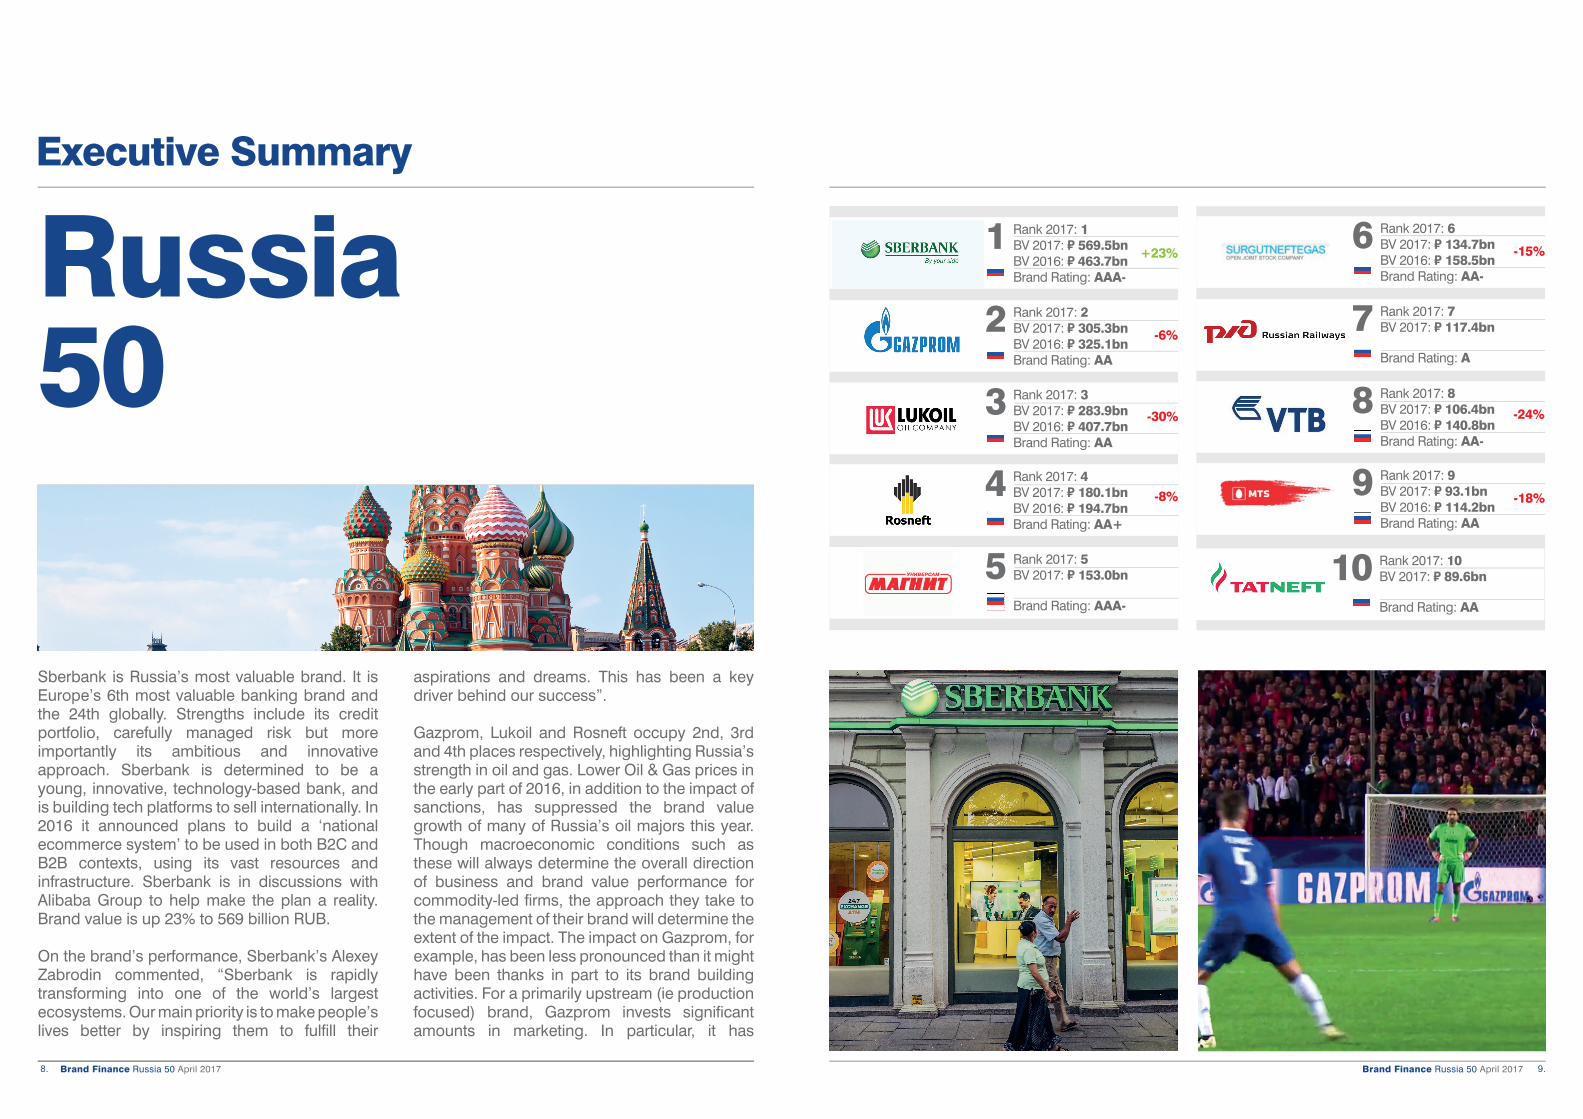
Sberbank is Russia’s most valuable brand. It is Europe’s 6th most valuable banking brand and the 24th globally. Strengths include its credit portfolio, carefully managed risk but more importantly its ambitious and innovative approach. Sberbank is determined to be a young, innovative, technology-based bank, and is building tech platforms to sell internationally. In 2016 it announced plans to build a ‘national ecommerce system’ to be used in both B2C and B2B contexts, using its vast resources and infrastructure. Sberbank is in discussions with Alibaba Group to help make the plan a reality. Brand value is up 23% to 569 billion RUB.
On the brand’s performance, Sberbank’s Alexey Zabrodin commented, “Sberbank is rapidly transforming into one of the world’s largest ecosystems. Our main priority is to make people’s lives better by inspiring them to fulfi ll their
aspirations and dreams. This has been a key driver behind our success”.
Gazprom, Lukoil and Rosneft occupy 2nd, 3rd and 4th places respectively, highlighting Russia’s strength in oil and gas. Lower Oil & Gas prices in the early part of 2016, in addition to the impact of sanctions, has suppressed the brand value growth of many of Russia’s oil majors this year. Though macroeconomic conditions such as these will always determine the overall direction of business and brand value performance for commodity-led fi rms, the approach they take to the management of their brand will determine the extent of the impact. The impact on Gazprom, for example, has been less pronounced than it might have been thanks in part to its brand building activities. For a primarily upstream (ie production focused) brand, Gazprom invests signifi cant amounts in marketing. In particular, it has
Russia 50
Executive Summary
Rank 2017: 1 BV 2017: ₽ 569.5bn BV 2016: ₽ 463.7bnBrand Rating: AAA-
Rank 2017: 2 BV 2017: ₽ 305.3bn BV 2016: ₽ 325.1bnBrand Rating: AA
Rank 2017: 5 BV 2017: ₽ 153.0bn
Brand Rating: AAA-
1
2
5
+23%
-6%
Rank 2017: 6 BV 2017: ₽ 134.7bn BV 2016: ₽ 158.5bnBrand Rating: AA-
Rank 2017: 7 BV 2017: ₽ 117.4bn
Brand Rating: A
Rank 2017: 8 BV 2017: ₽ 106.4bn BV 2016: ₽ 140.8bnBrand Rating: AA-
Rank 2017: 9 BV 2017: ₽ 93.1bn BV 2016: ₽ 114.2bnBrand Rating: AA
6
7
8
9
-15%
-18%
Rank 2017: 3 BV 2017: ₽ 283.9bn BV 2016: ₽ 407.7bnBrand Rating: AA
3
Rank 2017: 4 BV 2017: ₽ 180.1bn BV 2016: ₽ 194.7bnBrand Rating: AA+
4 -8%
Rank 2017: 10 BV 2017: ₽ 89.6bn
Brand Rating: AA
10
-30% -24%
Brand Finance Russia 50 April 2017 11.Brand Finance Russia 50 April 2017 10.
Executive Summary
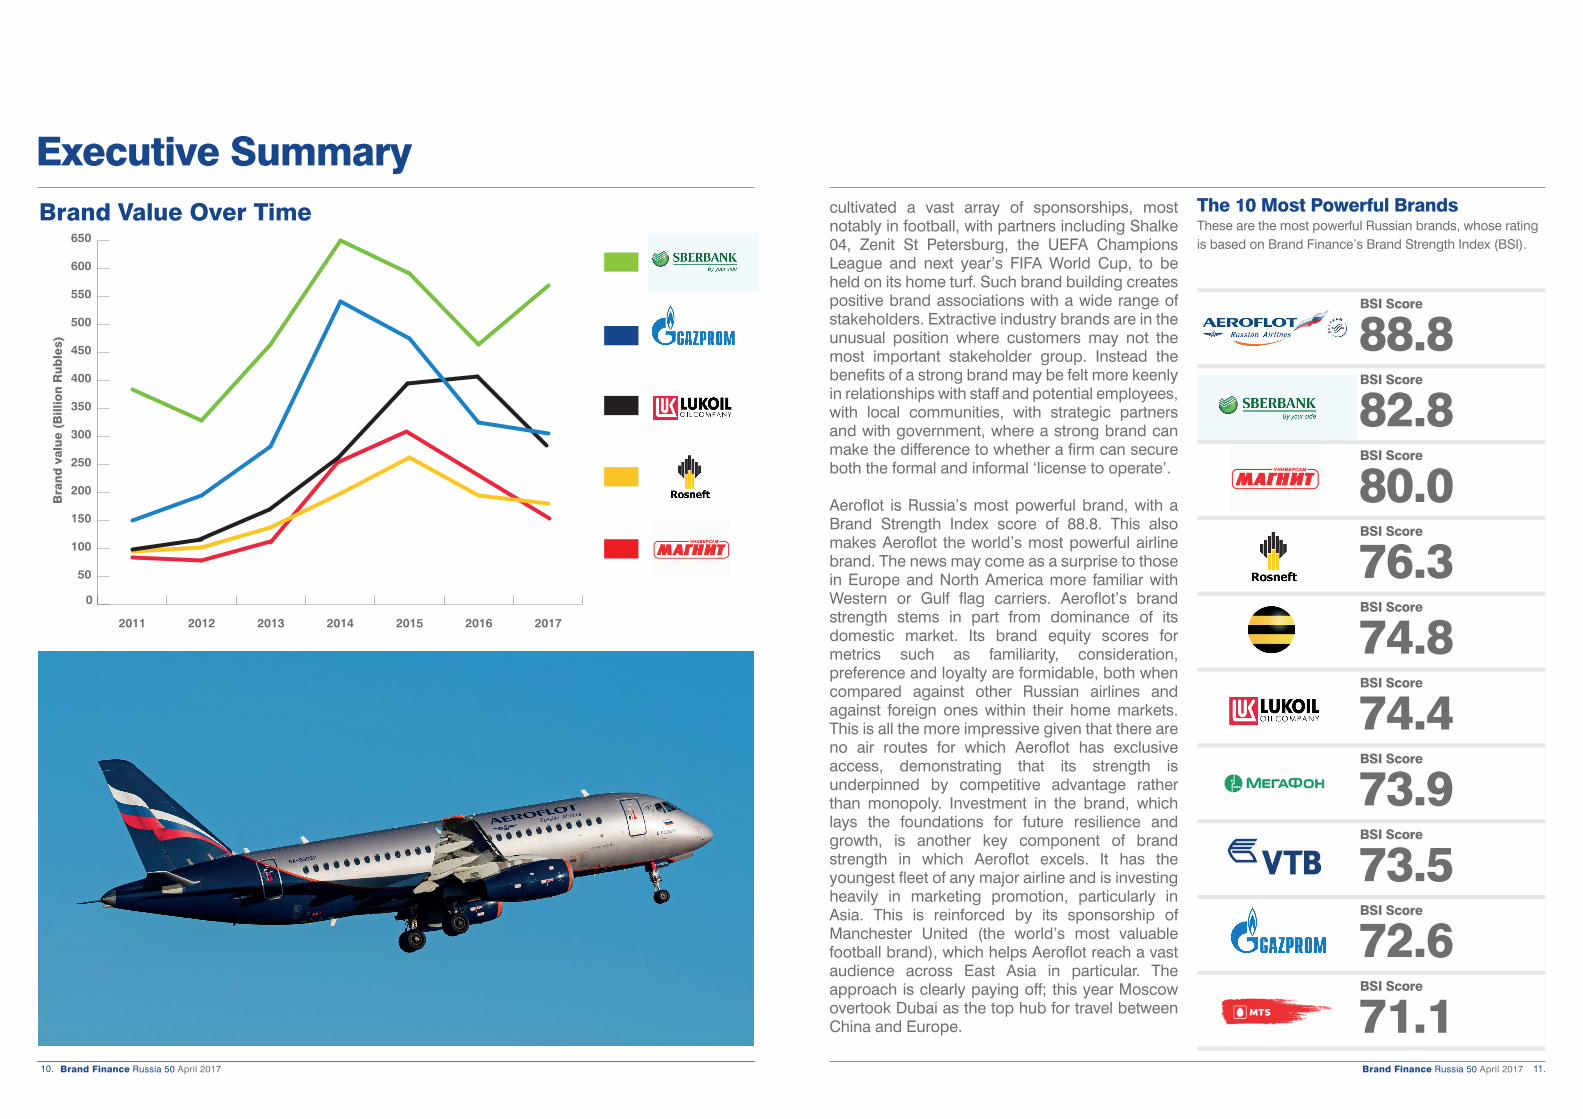
cultivated a vast array of sponsorships, most notably in football, with partners including Shalke 04, Zenit St Petersburg, the UEFA Champions League and next year’s FIFA World Cup, to be held on its home turf. Such brand building creates positive brand associations with a wide range of stakeholders. Extractive industry brands are in the unusual position where customers may not the most important stakeholder group. Instead the benefits of a strong brand may be felt more keenly in relationships with staff and potential employees, with local communities, with strategic partners and with government, where a strong brand can make the difference to whether a firm can secure both the formal and informal ‘license to operate’.
Aeroflot is Russia’s most powerful brand, with a Brand Strength Index score of 88.8. This also makes Aeroflot the world’s most powerful airline brand. The news may come as a surprise to those in Europe and North America more familiar with Western or Gulf flag carriers. Aeroflot’s brand strength stems in part from dominance of its domestic market. Its brand equity scores for metrics such as familiarity, consideration, preference and loyalty are formidable, both when compared against other Russian airlines and against foreign ones within their home markets. This is all the more impressive given that there are no air routes for which Aeroflot has exclusive access, demonstrating that its strength is underpinned by competitive advantage rather than monopoly. Investment in the brand, which lays the foundations for future resilience and growth, is another key component of brand strength in which Aeroflot excels. It has the youngest fleet of any major airline and is investing heavily in marketing promotion, particularly in Asia. This is reinforced by its sponsorship of Manchester United (the world’s most valuable football brand), which helps Aeroflot reach a vast audience across East Asia in particular. The approach is clearly paying off; this year Moscow overtook Dubai as the top hub for travel between China and Europe.
BSI Score
88.8BSI Score
82.8BSI Score
80.0BSI Score
76.3BSI Score
74.8BSI Score
74.4BSI Score
73.9BSI Score
73.5BSI Score
72.6BSI Score
71.1
The 10 Most Powerful BrandsThese are the most powerful Russian brands, whose rating is based on Brand Finance’s Brand Strength Index (BSI).
Brand Value Over Time
0
50
100
150
200
250
300
350
400
450
500
550
600
650
Magnit
Rosneft
Lukoil
Gazprom
Sberbank
2017201620152014201320122011
Bra
nd
val
ue
(Bill
ion
Ru
ble
s)
)
Brand Finance Russia 50 April 2017 13.Brand Finance Russia 50 April 2017 12.
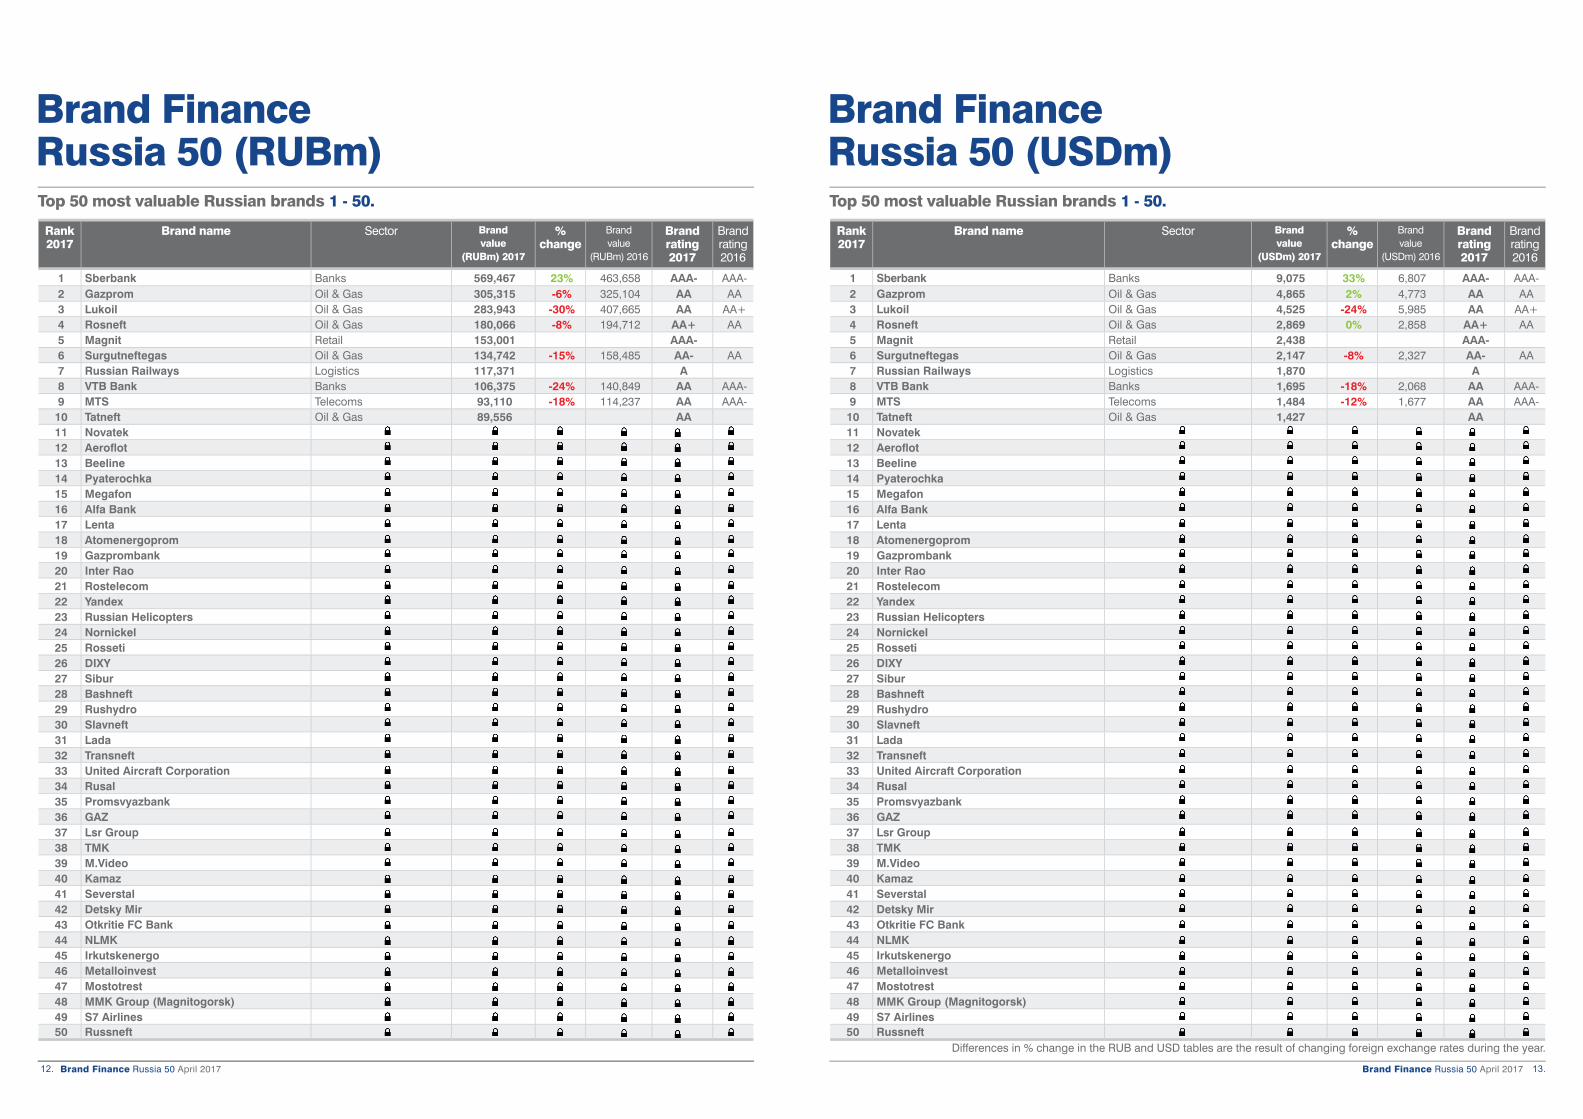
Brand Finance Russia 50 (RUBm)Top 50 most valuable Russian brands 1 - 50.
Rank2017
Brand name Sector Brandvalue
(RUBm) 2017
%change
Brandvalue
(RUBm) 2016
Brandrating2017
Brandrating2016
1 Sberbank Banks 569,467 23% 463,658 AAA- AAA-2 Gazprom Oil & Gas 305,315 -6% 325,104 AA AA3 Lukoil Oil & Gas 283,943 -30% 407,665 AA AA+4 Rosneft Oil & Gas 180,066 -8% 194,712 AA+ AA5 Magnit Retail 153,001 AAA-6 Surgutneftegas Oil & Gas 134,742 -15% 158,485 AA- AA7 Russian Railways Logistics 117,371 A8 VTB Bank Banks 106,375 -24% 140,849 AA AAA-9 MTS Telecoms 93,110 -18% 114,237 AA AAA-
10 Tatneft Oil & Gas 89,556 AA11 Novatek12 Aerofl ot13 Beeline14 Pyaterochka15 Megafon16 Alfa Bank17 Lenta18 Atomenergoprom19 Gazprombank20 Inter Rao21 Rostelecom22 Yandex23 Russian Helicopters24 Nornickel25 Rosseti26 DIXY27 Sibur28 Bashneft29 Rushydro30 Slavneft31 Lada32 Transneft33 United Aircraft Corporation34 Rusal35 Promsvyazbank36 GAZ37 Lsr Group38 TMK39 M.Video40 Kamaz41 Severstal42 Detsky Mir43 Otkritie FC Bank44 NLMK45 Irkutskenergo46 Metalloinvest47 Mostotrest48 MMK Group (Magnitogorsk)49 S7 Airlines50 Russneft
Brand Finance Russia 50 (USDm)Top 50 most valuable Russian brands 1 - 50.
Rank2017
Brand name Sector Brandvalue
(USDm) 2017
%change
Brandvalue
(USDm) 2016
Brandrating2017
Brandrating2016
1 Sberbank Banks 9,075 33% 6,807 AAA- AAA-2 Gazprom Oil & Gas 4,865 2% 4,773 AA AA3 Lukoil Oil & Gas 4,525 -24% 5,985 AA AA+4 Rosneft Oil & Gas 2,869 0% 2,858 AA+ AA5 Magnit Retail 2,438 AAA-6 Surgutneftegas Oil & Gas 2,147 -8% 2,327 AA- AA7 Russian Railways Logistics 1,870 A8 VTB Bank Banks 1,695 -18% 2,068 AA AAA-9 MTS Telecoms 1,484 -12% 1,677 AA AAA-
10 Tatneft Oil & Gas 1,427 AA11 Novatek12 Aerofl ot13 Beeline14 Pyaterochka15 Megafon16 Alfa Bank17 Lenta18 Atomenergoprom19 Gazprombank20 Inter Rao21 Rostelecom22 Yandex23 Russian Helicopters24 Nornickel25 Rosseti26 DIXY27 Sibur28 Bashneft29 Rushydro30 Slavneft31 Lada32 Transneft33 United Aircraft Corporation34 Rusal35 Promsvyazbank36 GAZ37 Lsr Group38 TMK39 M.Video40 Kamaz41 Severstal42 Detsky Mir43 Otkritie FC Bank44 NLMK45 Irkutskenergo46 Metalloinvest47 Mostotrest48 MMK Group (Magnitogorsk)49 S7 Airlines50 Russneft
Differences in % change in the RUB and USD tables are the result of changing foreign exchange rates during the year.
Brand Finance Russia 50 April 2017 15.Brand Finance Russia 50 April 2017 14.
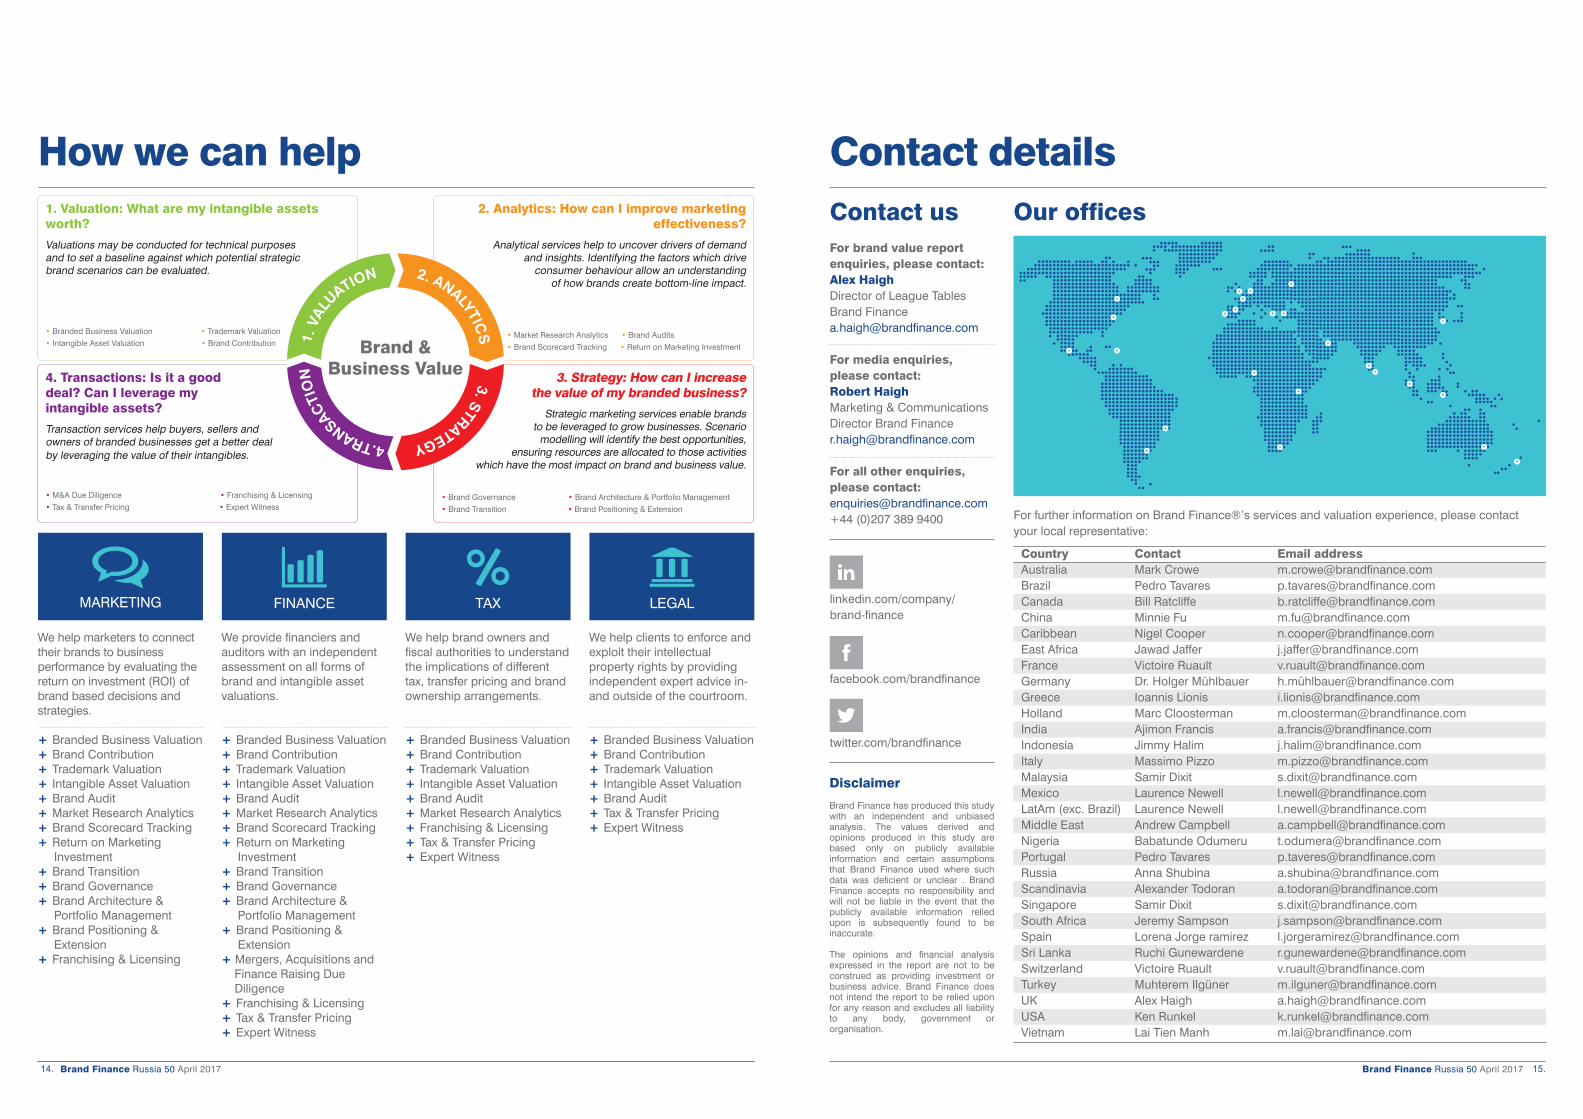
How we can help
MARKETING FINANCE TAX LEGAL
Contact usFor brand value report enquiries, please contact:Alex HaighDirector of League Tables Brand Finance [email protected]
For media enquiries, please contact:Robert HaighMarketing & Communications Director Brand Finance [email protected]
For all other enquiries, please contact:[email protected]+44 (0)207 389 9400
linkedin.com/company/brand-finance
facebook.com/brandfinance
twitter.com/brandfinance
For further information on Brand Finance®’s services and valuation experience, please contact your local representative:
Country Contact Email addressAustralia Mark Crowe [email protected] Pedro Tavares [email protected] Bill Ratcliffe [email protected] Minnie Fu [email protected] Nigel Cooper [email protected] Africa Jawad Jaffer [email protected] Victoire Ruault [email protected] Dr. Holger Mühlbauer h.mü[email protected] Ioannis Lionis [email protected] Marc Cloosterman [email protected] Ajimon Francis [email protected] Jimmy Halim [email protected] Massimo Pizzo [email protected] Samir Dixit [email protected] Laurence Newell [email protected] (exc. Brazil) Laurence Newell [email protected] East Andrew Campbell [email protected] Babatunde Odumeru [email protected] Pedro Tavares [email protected] Anna Shubina [email protected] Alexander Todoran [email protected] Samir Dixit [email protected] Africa Jeremy Sampson [email protected] Lorena Jorge ramirez [email protected] Lanka Ruchi Gunewardene [email protected] Victoire Ruault [email protected] Muhterem Ilgüner [email protected] Alex Haigh [email protected] Ken Runkel [email protected] Lai Tien Manh [email protected]
Contact detailsOur offices
Disclaimer
Brand Finance has produced this study with an independent and unbiased analysis. The values derived and opinions produced in this study are based only on publicly available information and certain assumptions that Brand Finance used where such data was deficient or unclear . Brand Finance accepts no responsibility and will not be liable in the event that the publicly available information relied upon is subsequently found to be inaccurate.
The opinions and financial analysis expressed in the report are not to be construed as providing investment or business advice. Brand Finance does not intend the report to be relied upon for any reason and excludes all liability to any body, government or organisation.
We help marketers to connect their brands to business performance by evaluating the return on investment (ROI) of brand based decisions and strategies.
+ Branded Business Valuation+ Brand Contribution+ Trademark Valuation+ Intangible Asset Valuation+ Brand Audit+ Market Research Analytics+ Brand Scorecard Tracking+ Return on Marketing Investment+ Brand Transition+ Brand Governance+ Brand Architecture & Portfolio Management+ Brand Positioning & Extension+ Franchising & Licensing
We provide financiers and auditors with an independent assessment on all forms of brand and intangible asset valuations.
+ Branded Business Valuation+ Brand Contribution+ Trademark Valuation+ Intangible Asset Valuation+ Brand Audit+ Market Research Analytics+ Brand Scorecard Tracking+ Return on Marketing Investment+ Brand Transition+ Brand Governance+ Brand Architecture & Portfolio Management+ Brand Positioning & Extension+ Mergers, Acquisitions and Finance Raising Due Diligence+ Franchising & Licensing+ Tax & Transfer Pricing+ Expert Witness
We help brand owners and fiscal authorities to understand the implications of different tax, transfer pricing and brand ownership arrangements.
+ Branded Business Valuation+ Brand Contribution+ Trademark Valuation+ Intangible Asset Valuation+ Brand Audit+ Market Research Analytics+ Franchising & Licensing+ Tax & Transfer Pricing+ Expert Witness
We help clients to enforce and exploit their intellectual property rights by providing independent expert advice in- and outside of the courtroom.
+ Branded Business Valuation+ Brand Contribution+ Trademark Valuation+ Intangible Asset Valuation+ Brand Audit+ Tax & Transfer Pricing+ Expert Witness
2. Analytics: How can I improve marketing effectiveness?
Analytical services help to uncover drivers of demand and insights. Identifying the factors which drive
consumer behaviour allow an understanding of how brands create bottom-line impact.
• Market Research Analytics • Brand Audits
• Brand Scorecard Tracking • Return on Marketing Investment
3. Strategy: How can I increase the value of my branded business?
Strategic marketing services enable brands to be leveraged to grow businesses. Scenario
modelling will identify the best opportunities, ensuring resources are allocated to those activities
which have the most impact on brand and business value.
• Brand Governance • Brand Architecture & Portfolio Management
• Brand Transition • Brand Positioning & Extension
4. Transactions: Is it a good deal? Can I leverage my intangible assets?
Transaction services help buyers, sellers and owners of branded businesses get a better deal by leveraging the value of their intangibles.
• M&A Due Diligence • Franchising & Licensing
• Tax & Transfer Pricing • Expert Witness
1. Valuation: What are my intangible assets worth?
Valuations may be conducted for technical purposes and to set a baseline against which potential strategic brand scenarios can be evaluated.
• Branded Business Valuation • Trademark Valuation
• Intangible Asset Valuation • Brand Contribution
2. ANALYTICS
3. STRATEGY 4.TRANSACTI
ON
1. V
ALUATION
Brand & Business Value

Contact us.
The World’s Leading Independent Branded Business Valuation and Strategy ConsultancyT: +44 (0)20 7389 9400E: a.shubina@brandfi nance.com www.brandfi nance.com
Bridging the gap between marketing and fi nance