running head: social validation of services for … 1 complete.doc · web viewstrategies for...
TRANSCRIPT

ISSN 0827 3383
International Journalof
Special EducationVOLUME 24 2009 NUMBER 1
Strategies for Crisis Intervention and Prevention-Revised as a Current Proposal in Care of Individuals with Intellectual Disabilities and Challenging Behaviours
Reflections of Hearing Impaired Students on Daily and Instructional PDA Use
Corrective Feedback of Oral Decoding Errors for Diverse Learners with Reading Disabilities:The Effects of Two Methods on Reading Fluency
Enhancing the Preparation of Special Educators through Service Learning:Evidence from Two Preservice Courses
A Longitudinal Examination of the Remediation of Learning Disabilities:IQ, Age At Diagnosis, School SES And Voluntary Transfer
Admission And Graduation Requirements For Special Education Doctoral Programs At 20 Top American Universities
Mothers’ Hearts Speaking: Education Enlightens, Empowers And Protects Girls With Disabilities
Understanding The Causes Of Intermediate And Middle School Comprehension Problems
Surveys Of The American Deaf Population: A Critical Review Working With Students With Special Educational Needs In Greece:
Teachers’ Stressors And Coping Strategies Teacher Efficacy, Tolerance, Gender, And Years Of Experience And
Special Education Referrals

INTERNATIONAL JOURNAL of SPECIAL EDUCATION Vol 23 No3 2008Character Education- Social Skills ii
International Journal of Special Education
REVISED EDITORIAL POLICY from 2009
The International Journal of Special Education publishes original articles concerning special education. Experimental as well as theoretical articles are sought. Potential contributors are encouraged to submit reviews of research, historical, and philosophical studies, case studies and content analyses in addition to experimental correlation studies, surveys and reports of the effectiveness of innovative programs.
Send your article to [email protected] as attachment by e-mail, in MSWORD for IBM format ONLY .
Articles should be double spaced (including references). Submit one original only. Any tables must be in MS-WORD for IBM Format and in the correct placement within the article. Please include a clear return e-mail address for the electronic return of any material. Published articles remain the property of the Journal.
E-mailed contributions are reviewed by the Editorial Board. Articles are then chosen for publication. Accepted articles may be revised for clarity, organisation and length.
Style: The content, organisation and style of articles should follow the Publication Manual of the American Psychological Association, Fifth Edition. An article written in an obviously deviating style will be returned to the author for revision.
Abstracts: All articles will be preceded by an abstract of 100-200 words. Contributors are referred to the Publication Manual of the American Psychological Association, Fifth Edition for assistance in preparing the abstract.
Responsibility of Authors: Authors are solely responsible for the factual accuracy of their contributions. The author is responsible for obtaining permission to quote lengthy excerpts from previously published material. All figures submitted must be submitted within the document.
JOURNAL LISTINGSAnnotated and Indexed by the ERIC Clearinghouse on Handicapped and Gifted
Children for publication in the monthly print index Current Index to Journals of Special Education (CIJE) and the quarterly index, Exceptional Child Education Resources (ECER).IJSE is also indexed at Education Index (EDI).
The journal appears at the website: www.internationaljournalofspecialeducation.com
The editor can be reached at [email protected]
ii

INTERNATIONAL JOURNAL of SPECIAL EDUCATION Vol 23 No3 2008Character Education- Social Skills iii
VOLUME 24 2009 NUMBER 1I N D E X
Strategies For Crisis Intervention And Prevention-Revised As A Current Proposal In Care Of Individuals With Intellectual Disabilities And Challenging Behaviours …………………….……..…...1
Sara C. West and Przemyslaw Kaniok
Reflections of Hearing Impaired Students on Daily and Instructional PDA Use ……………….…………………..……………..……………………...…….…8
H. Ferhan Odabaşı, Abdullah Kuzu, Cem Girgin, Cem Çuhadar, Mübin Kıyıcı & Tayfun Tanyeri,
Corrective Feedback Of Oral Decoding Errors For Diverse Learners With Reading Disabilities:The Effects Of Two Methods On Reading Fluency ……………….……………..…..….……………..20
Morgan Watson, Cecil Fore III, Richard T. Boon
Enhancing The Preparation Of Special Educators Through Service Learning:Evidence From Two Preservice Courses……………………………….………………………………32
Jeanne Novak, Mary Murray, Amy Scheuermann and Erin Curran
A Longitudinal Examination Of The Remediation Of Learning Disabilities:IQ, Age At Diagnosis, School SES And Voluntary Transfer …… …………….…………………….. 45
Brian Vandenberg And Debra Emery
Admission And Graduation Requirements For Special Education Doctoral ProgramsAt 20 Top American Universities ………………………………………………………….………..…53
Gabriela Walker
Mothers’ Hearts Speaking:Education Enlightens, Empowers And Protects Girls With Disabilities.…………………………………………………………………………...……..64
Siri Wormnæs and Marianne Olsen
Understanding The Causes Of Intermediate And Middle School Comprehension Problems …………75Anthony Palumbo and Vito Loiacono
Surveys Of The American Deaf Population: A Critical Review ……………...…………….......……..82Russell S Rosen
Working With Students With Special Educational Needs In Greece:Teachers’ Stressors And Coping Strategies…………………………………………………………...100
Alexander-Stamatios Antoniou, Fotini Polychroni and Christina Kotroni
Teacher Efficacy, Tolerance, Gender, And Years Of ExperienceAnd Special Education Referrals……………..……………………………………………………….112
Maria Del Carmen Tejeda-Delgado
VOLUME 24 2009 NUMBER 1
iii

INTERNATIONAL JOURNAL OF SPECIAL EDUCATION Vol 24 No 1 2009
STRATEGIES FOR CRISIS INTERVENTION AND PREVENTION-REVISED AS A CURRENT PROPOSAL IN CARE OF INDIVIDUALS WITH INTELLECTUAL
DISABILITIES AND CHALLENGING BEHAVIOURS
Sara C. WestClarkson UniversityPrzemyslaw Kaniok
Opole University
The article relates to the author’s former experiences gained during the work with individuals with developmental disabilities at the Association for the Help of Retarded Children, Nassau Chapter in New York State in the United States (US), as well as with autistic children at the Loddon School in Hampshire County in the United Kingdom (UK). Strategies for Crisis Intervention and Prevention–Revised (SCIP–R) were used in both settings. The history of the Strategies for Crisis Intervention and Prevention (SCIP) training program began in the US in the 1980s and was connected with some of the most difficult turning points in the US social care system. For many years, one of the most disturbing issues in providing professional care to individuals with challenging behaviors was to find an appropriate approach to them, especially during their aggressive and self–injurious incidents. SCIP–R is one of the proposals of contemporary solutions to aggressive and challenging behavior of developmentally disabled individuals in care facilities. Its content refers to programs for individuals with other disabilities, as well. SCIP–R is addressed to staff members with direct care responsibilities. The general idea of this comparatively new training program is to prepare employees for prevention crisis and to effectively intervene when behavioral crisis occurs.
IntroductionThere are various ways in which social workers recognize the needs of developmentally disabled individuals and in which they get them meet. The most common reactions of individuals with challenging behaviors to their unmet needs are frustration, aggression, crying, and self–injurious behaviors. One of the significant, relatively new in Europe, sets of numerous techniques which help to resolve dangerous situations caused by their unmet needs is SCIP-R. Because of the fact that there is little literature regarding SCIP–R in Europe, this article is one of the first publications that offers an overview of the topic.
The development of the SCIP-R originated from the New York State care system and the New York State Office of Mental Retardation and Developmental Disabilities (Cornick, 2004). In the mid–1960s, the movement known as deinstitutionalization initiated the removal of people with mental illnesses from state run institutions (O’Connor, 1998). Due to drastic cuts in New York State financing of governmental institutions in the late 1960s, many of the disabled residents were forced to live in appalling squalor and virtually unattended. The poor conditions in the governmental facilities determined action of residents’ families and American society. A key turning point was the Willowbrook case. Willowbrook State School was established in the 1930s as a state-supported institution for mentally retarded children located in central Staten Island in New York City. In the mid–1960s, the compilation of budget cuts, arrogance, and indifference created dangerous conditions for residents at the Willowbrook School. The residents were abused in various ways by the staff, with the use of physical restraint and violence. Willowbrook finally closed its doors in 1987 (Rothman & Rothman, 2005). The history of the Willowbrook State School had a great impact on providing future professional services to mentally disabled individuals and preparing special programs for them. The Willowbrook case led New York State to adopt sweeping changes . The changes had started even before the school was closed. In 1978, the New York State Department of Mental Hygiene, which primarily was responsible for provision of services including care, treatment, habilitation, and rehabilitation of their citizens with mental retardation, was separated into three offices, including the
1

INTERNATIONAL JOURNAL OF SPECIAL EDUCATION Vol 24 No 1 2009
Office of Mental Retardation and Developmental Disabilities (OMRDD). One of the priorities of the OMRDD’s mission statement was the development of comprehensive, integrated system of services which promotes independence, inclusion, individuality, and productivity for people with mental retardation and developmental disabilities (SCIP-R, Participant Guide, 1998). In 1980, according to the above-mentioned issue, the OMRDD prepared one of its programs, called Behavior Management for the Aggressive Client (B–MAC) training program, to manage violent and aggressive behavior of mentally disabled individuals using humane and compassionate methods. In 1988, the B–MAC was replaced by the SCIP training program to provide better help to all staff members working in various New York State facilities for intellectually disabled people; and to manage their aggressive, violent and self-injurious behavior during a crisis episode. In 1998, the OMRDD introduced an extensively revised SCIP training program. The revised material emphasizes positive approaches to behavior control that prevents incidents from escalating to the point where hands-on approaches become necessary. All the changes and improvements firstly to the B–MAC and then to the SCIP–R are not the result of any direct research on their effectiveness but come as a consequence of collaboration, discussion and practical experiences of Developmental Disabilities Service Offices and nonprofit providers.
While trying to place the SCIP-R training among other solutions to aggressive and self-injurious behaviors of intellectually disabled individuals it needs to be outlined that the above program is one of the approaches currently in use in the world. Due to the complexity, diversity and little research on various methods and techniques being used as physical interventions while responding to challenging behaviors of individuals with intellectual disabilities it is difficult to estimate precisely their complete number and to describe them all. Allen (2001) reviewed worldwide research in approaches regarding physical interventions and reported that the evidence base for behavior management training was extremely poor methodologically. However with the SCIP-R program there can be distinguished, as examples, a few, the most common training organizations and approaches: Control and Restraint (C&R), Care and Responsibility, Studio III , Non-Abusive Psychological and Physical Interventions (NAPPI), Timian training, Team Teach and many others. Control and Restrain (C&R) is the best well known approach in the United Kingdom. Starting from the mid-1980’s, many British professionals who worked with intellectually disabled individuals were offered training in Control and Restraint originally developed in prison service (Murphy et al. 2003, p. 116). C&R techniques allow staff to work quietly and professionally in teams, and to safely include such incidents. Control of the incident is assumed by the leader of this team, and the patient is quickly immobilised and prevented from causing further harm. The team has the option of restraining the patient standing, on the ground, or of moving them to another suitable room or location, to minimise further stimuli. Care and Responsibility is defined as a method of training staff in techniques to provide them with skills to manage and deal with aggression and/or physical violence. It also provides staff with information about triggers for aggression and violence, which gives them an understanding and knowledge allowing them to defuse and de-escalate potentially dangerous situations before they become physical. Physical intervention should always be a last resort. Studio III consists of three individual UK companies, which promote the ideals, philosophies and benefits of non-aversive behavior management. They further provide a fusion of skills drawn from academic researchers, applied clinicians, psychologists (educational and clinical), speech and language therapists, doctors, teachers, movement skills trainers as well as nurses. Non-Abusive Psychological and Physical Interventions (NAPPI) was established in the United States in 1977. It was developed in a health care setting as a result of litigation directed against a facility in Maine that cared for residents with severe Learning Disabilities. NAPPI teaches three levels of prevention strategies: long-term, relationship-building strategies that reduce the likelihood of escalating situations; intermediate strategies that redirect potentially physical situations; and emergency skills that help defuse violent reactions. Timian training, established in 1994 in the United Kingdom, is a system of conflict management and physical interventions which were appropriate to the client groups with challenging behaviors. Crisis Aggression Limitation and Management (CALM), was developed with the aim of producing an effective, criteria and evidence based system of training in aggression management, to help protect both staff and service users from abuse and injury. Team Teach is the largest provider of training for mainstream, special, child and increasingly adult services in the UK. The training has evolved from a residential care, education and health background working with service users with a variety of emotional, social, behavioral, learning, communication and medical needs. The recalled examples of the best practices in coping with challenging behaviors of intellectually disabled individuals are very differential relating to their various aspects. Despite many
2

INTERNATIONAL JOURNAL OF SPECIAL EDUCATION Vol 24 No 1 2009
differences between the above approaches and many others, which cannot be precisely characterized in this paper, the one common aim of them all is a principle that physical intervention should always be applied as a last resort.
In The evidence base for the management of imminent violence in learning disability settings, prepared by the Royal College of Psychiatrists, it was showed that there is little research on any aspect of the SCIP–R, including its effectiveness (Deb & Roberts, 2005). The only one instance which was cited in that document was a study on staff confidence in their ability to prevent and respond to crisis situations before participation in the SCIP–R training and three months later (Baker & Bissmire, 2000). In the study participated all care staff in an independent residential service (n=17) for people with learning disabilities and challenging behavior. The study revealed that after the SCIP–R training the staff felt more confident in the management of crisis and more supported by their organization. There was an increasing tendency to use physical interventions relative to other methods following the training. The other study, entitled as Physical Interventions with People with Intellectual Disabilities: Staff Training and Policy Frameworks, was focused on the extent to which staff (n=341) were trained in the use of physical interventions or restraint (Murphy et al, 2003). According to one of the parts of the study called Comparison of methods of physical interventions used in participants’ own services it was revealed that the SCIP–R is very often used by staff right after the Control & Restraint method. In the research, the SCIP–R was used by 75 staff members and Control & Restraint by 97. In the conclusion of the study, it was outlined that the C&R and the SCIP-R appear to be market leaders in intellectual disability services. However, whether this is because they are actually more effective or whether it is merely historical accident is not known.
SCIP – R in Theory and Practice The most important aspect of SCIP-R is awareness that physical intervention must be used minimally when there is a crisis episode. This particular program was developed to: decrease the number of injuries to everyone, improve reactions of care providers when responding to challenging behavior, decrease incidents of abuse through increasing awareness of the definitions and causes of abuse, establish an effective and humane training program that focuses on proactive and least restrictive approach, and increase awareness of the effects of institutionalization. The SCIP–R training program, defined by the OMRDD, is designed to present staff with a comprehensive approach in dealing with aggressive, violent, and self-injurious behavior which may occur during a crisis episode. The main goal of the program is to give staff the knowledge and necessary skills to anticipate and avoid crisis episodes of aggressive and/or acting out behavior while assisting program participants to maintain self control using positive approaches to support positive behaviors (SCIP-R, Participant Guide, 1998). A term, defined in the OMRDD Regulations and Client Protection, which influences the use of SCIP–R is abuse. The term abuse is needed not only while using SCIP–R, but also to identify its premises in everyday work with intellectually disabled individuals. According to Part 624 of OMRDD’s Regulations, abuse is defined as the mistreatment or mishandling of a person receiving services which could endanger the physical or emotional well–being of the person through the action or inaction on the part of any individual, including an employee, volunteer, consultant, contractor, visitor or other persons, whether or not the person receiving services is or appears to be injured or harmed (SCIP-R, Participant Guide, 1998). The failure to exercise one’s duty to intercede on behalf of a person receiving services also constitutes abuse. Therefore every time SCIP–R is used one of the most important principles obeyed by staff is to avoid any abusive actions against individuals.
Relating to a crisis episode caused by aggressive, violent, self–injurious or challenging behavior of intellectually disabled individuals there are five functional reasons, called STEAM, which may lead them to exhibit challenging behaviors such as Self-stimulatory or sensory, Tangibles, Escape, Attention and Medical (AHRC’s Behavior Management/Positive Approaches Training Curriculum, 1998). Self-stimulatory or sensory reason for behavior provides input into one or more sensory–perceptual pathways. Examples are looks, sounds, feelings, smells, tastes. Tangible reason is when an individual wants or takes an item, service, food, or activity; for example, when a child in supermarket picks up a piece of candy before their parent has purchased it. Escape occurs when an inappropriate behavior can be reinforced by the escape or avoidance of a demand, task, or activity; for instance when a person does not perform a task because he or she perceives the task to be too difficult. Attention relates to a situation when a person can engage in an inappropriate behavior to get another person to attend to or spend time with him or her, such as a child in a classroom who makes snide remarks during class while the teacher responds in a socially disapproving manner. The medical reason is associated with an inappropriate behavior caused by a medical condition or medical problem.
3

INTERNATIONAL JOURNAL OF SPECIAL EDUCATION Vol 24 No 1 2009
The escalation process of behavior consists of four phases which are 1) setting events, 2) early warnings, 3) crisis, and 4) recovery. The SCIP–R training program includes three strategies - early intervention, calming techniques, and physical intervention (SCIP-R, Participant Guide, 1998). These strategies are dependent on the phase of behavior exhibited by the individual. Early intervention is recognition and responding to warning signs so a violent or aggressive episode can be avoided. These behavioral clues may include increased tension, agitation, verbal outbursts, threatening looks. In order to recognize and assess early behavioral warning signs, it is important to know a variety of information about the program participant.
When early intervention fails, calming techniques are used. The first type of calming techniques are non–verbal techniques such as ignoring the behavior, making eye contact, close proximity to an individual may serve as a deterrent, placing one’s hand on the individual’s hand may control the behavior, limitation of space (removing the individual or other program participants at the first warning signs of aggression), body posture (staff member must appear comfortable and relaxed), redirection to another activity, facial expressions. The next type of the calming techniques are verbal techniques such as allowing the individual to say anything they want, distraction (changing subject of conversation), reassurance (letting other staff members know about crisis situation), understanding (letting the individual know that the caregiver understands the reason for agitation), modeling the caregiver’s voice to calm the individual, humor, one-on-one work with the individual. When using verbal techniques, it is important to avoid telling the individual suggestions for their misbehavior, threatening consequences of a misbehavior, presenting commands in the form of a question, having more than one staff member give directions to the program participant at one time, restarting confrontation by immediately demanding an emotionally difficult action, rehashing the incident in front of the program participant.
In order to ensure effective calming techniques, there is a six-step sequence (Cornick et al, 1996). The first step, called identify, recognizes the program participant’s feelings. The program participant may appear angry but is primarily fearful and his fear has converted to anger. Step two, entitled reflect, means that it is very important to tell the individual the name of their emotion. This helps the individual differentiate and understand how they are feeling. Empathy is the third step of the calming techniques in which the caregiver is providing a concrete example from his own life that proves that he understands what the individual is feeling. This keeps the person from feeling alone with the problem and helps them understand that the caregiver has feelings, as well. Letting the individual know that the caregiver is ready to help him is the fourth step called reassure. The program participant must know that the problem is under control. The fifth step, redirect, refers to getting a person physically involved in a different activity so he or she cannot dwell on the problem. The last step, praise, is rewarding the individual when he or she complies with the redirection activity.
Physical interventions are used when calming techniques fail. It is important to remember that they are one element of a whole program. If the caregiver wants to aid the individual in gaining control over his or her behavior, he uses gradient control, which means that only the least amount of force should be used to get the situation under control. Restrictive techniques are allowed only as a last resort (Harris et al, 1996). They can be applied only if other approaches, such as early intervention and calming techniques fail. One of the most important things while applying physical intervention is to stop as soon as the individual has gained control of their behavior. It is also important to use reverse gradient control and move backward from a restrictive technique toward maintaining some amount of touch control, offering continued verbal empathy or support. After the individual has gained control of their behavior it is necessary to redirect them towards a relaxing activity. Continued use of force when it is no longer necessary is considered abuse. Physical intervention includes dozens of techniques such as: touch, one-person escort, two-person escort, one-person escort (seated), two-person escort (seated), one-person arm control, two-person arm control, seated wrap, standing wrap, one-person warp with removal, bite release, one arm release - same arm, one arm release – opposite arm, two arm release, two arm release – both wrists, front deflection, front arm catch, front choke release, front choke windmill release, back choke arm catch release, front hair pull stabilization and release, back hair pull stabilization and release. Other restrictive techniques include: two-person removal, two- person take down, two- or three-person supine control (SCIP-R, Participant Guide, 1998).
Prior to SCIP–R interventions the caregiver must be aware of any medical precautions for the individual (Cornick et al, 1996). There are four physical areas, known as BANC, which the caregiver
4
INTERNATIONAL JOURNAL OF SPECIAL EDUCATION Vol 24 No 1 2009
must be conscious of when performing physical interventions. BANC stands for Breathing, Ability to move, Noise or sound, and Color of facial skin. All SCIP–R trained staff should be aware that the medical conditions of certain individuals such as cardiac conditions, respiratory conditions, gastrointestinal conditions, hemophilia, history of injuries to muscles or bones, recent surgery, severe scoliosis, and others may effect and preclude the use of physical interventions. This should be reviewed with medical personnel before SCIP–R interventions are used. There are special precautions for individuals with Down’s Syndrome. Relating to their particular physiognomy there are a potential risks when using SCIP–R interventions. Persons with this congenital disability typically have broad, flat faces and noses and short necks with smaller oral cavities, yet larger tongues. This may result in a compromised air exchange, interfere with oxygen intake, and enhance the possibility of asphyxia, if such individuals are held face down. Respiratory difficulties can be further accentuated if the person is agitated and struggling. Another known abnormal feature of Down’s Syndrome is the increased potential for dislocation of the first cervical vertebrae, which is near the respiratory control center. Excessive pressure applied to the region of neck could result in the dislocation of the vertebrae and inhibit breathing. During the SCIP–R intervention, there has to be remedial action if the following signs or symptoms are observed: cyanosis (blue color of a body part), mottling (paleness, yellow color of any body part), hyperventilation (rapid breathing), hypoventilation (decreased breathing), vomiting, broken bones, unresponsiveness and/or a seizure. SCIP–R requires that the caregiver be knowledgeable of typical behavior responses of the individual in various situations, his or her physical conditions, problems and significant reinforcers.
It is very important to use less restrictive interventions such as verbal calming, humor, redirection, whenever possible. If there is a need for physical interventions, because of the individual’s dangerous and maladaptive behavior, there should be an attempt to lessen the potential for injury. Therefore assistance is required to move all uninvolved individuals away from the immediate area as well as move the involved person toward areas where there are fewer hard surfaces or edges. During implementation of physical interventions, it is required to monitor person’s respiration and general physical well being at all times, remembering BANC. If he or she becomes calm it is the caregiver’s duty to release the person from the restrictive hold. The restrictive techniques should always be used as a last resort. If maintained beyond 10 minutes, the supervisor or psychologist needs to be notified. The caregiver must be calm throughout the whole crisis episode as the intent of SCIP–R interventions is to reduce the potential for injury and to help the person to regain control of his or her behavior. As the individual regains composure, gradually decrease the amount of restriction placed on them. When using SCIP–R interventions, it is necessary not to use them in order to punish the individual who misbehaves; not to overreact to behavior problems; not to turn your back on a person who is agitated; not to use soft furniture or beds as surfaces for restrictive techniques; not to place your weight on individual’s back, chest or neck; not to get involved in a power play; not to personalize the situation; and not to block the individual’s punches or slaps with your hands (use your forearm).
Based on experiences and consequences of the SCIP–R interventions; there are staff safety guidelines developed that include important principles: 1) keeping a safe distance from the individual who is agitated and not putting one’s face near her or his hands and feet, 2) keeping caregiver’s arms and hands away from person’s mouth in order to avoid being bitten, 3) protecting other staff members who may be assisting the caregiver with the intervention and remember not to release a person without first communicating with the other staff members, 4) uninvolved staff and individuals should be asked to leave the area.
The group of strategies being used after a crisis has occurred includes medical examination of the individual, checking their basic physical needs such as thirstiness, need of going to bathroom, etc. The other strategy includes reassuring the caregiver and others. The above group includes strategies which are characterized by single words such as isolate, explore, share, connect, alternatives, plan and enter. Isolate means encouraging a person to leave the problem situation in order to decrease the amount of stimulation, distraction or stress. Explore the person’s point of view including their concerns in the situation. The cargiver shares his views after the individual shares his or her opinions. Connect the individual’s behavior and the problem with exhibiting that behavior to fulfill certain feelings or needs (such as frustration, disappointment, being hurt or loneliness). Develop alternative behaviors and a trial plan as well as helping the person to think of different choices they could have made. Plan, on how and when the person will demonstrate the desired behavior. Enter the person back to the place where the crisis occurred and prepare them to deal with any consequences of the crisis.
5

INTERNATIONAL JOURNAL OF SPECIAL EDUCATION Vol 24 No 1 2009
When a crisis episode has finished, there should be documentation of the SCIP–R techniques noting antecedents, any injuries or suspected injuries, and ultimate outcomes. There are three important principles which have to be taken under consideration while filling out documentation. The first principle indicates that the report has to be written right after the incident occurs. The next rule underlines that documentation should include what interventions were tried during the crisis and what their effectiveness was. The third principle was designed to document exactly what kind of interventions and strategies were used, including a list of early intervention approaches, list of used calming techniques, list of used intervention techniques and indication of staff involved in the crisis. The Association for the Help of Retarded Children, Nassau Chapter in New York State utilizes the ABC Sheet for reporting a crisis. This document contains the name and date of birth of an individual, name of staff member responsible for a person, target behavior to be observed, date of incident, time of incident, antecedent, description of behavior, staff response, and client response.
An Example of Implementing the SCIP–R Perspectives in the UKDespite its widespread practice in New York State residential facilities, the SCIP–R Program is not well known in European countries. The UK is the second country utilizing the SCIP–R. Today’s care services in the UK provide various solutions and programs whose content is aimed at giving intellectually disabled individuals an enhanced quality of life. One of the numerous programs is the PROACT SCIPr UK® designed by the Loddon School in Hampshire County. The PROACT SCIPr UK®, based on the American SCIP–R, stands for Positive Range of Options to Avoid Crisis and use Therapy, Strategies for Crisis Intervention and Prevention revised for the UK with trademark of Marion Cornick – former principal of the Loddon School. The PROACT SCIPr UK® program supports the Loddon School philosophy based on positive programming. The SCIPr strategies provide an alternative to other methods available in England. The Loddon School was established in 1988 by Marion and Tim Cornick. There were no other specialized provisions in the south of England for children with serious disabilities associated with autism. The Loddon School is a home and school for 27 pupils who have severe and complex learning difficulties. Many pupils have additional disabilities such as epilepsy, blindness, brain damage, extreme hyperactivity. Most of them pose challenging behaviors, including violence to others, self–injury, damage to the environment, extreme disruption, severe stereotyped behaviors, social unawareness and communication difficulties. It is the intent of the PROACT SCIPr UK® to minimise the use of physical interventions and to emphasize sound behavioral support strategies based upon an individual’s needs, characteristics, and preferences. The SCIPr UK® is ‘a whole approach’ designed to help pupils and service users by providing positive behavior supports. The underpinning philosophy of the PROACT SCIPr UK® is based on the following principle, developed by the New York State OMRDD: The purpose of our behavior is to get our needs met (People do Matter. There is no Excuse for Abuse) (Cornick, 2005). The Loddon School provides training to all caregivers through three courses (introductory course, foundation course, and instructor course) accredited by the BILD (British Institute of Learning Disabilities) Code of Practice for Trainers in the Use of Physical Interventions. Marion Cornick and Janet Bromley from the Loddon School are master trainers for the PROACT SCIPr UK® training in the UK. One of the main goals of the PROACT SCIPr UK® training is to improve the quality of life for the individual by providing staff with the necessary skills and information to provide a therapeutic environment. The other goals are to increase the competences and confidence of all those who manage crisis situations as well as to develop a proactive approach to the management of a crisis. The basis of the PROACT SCIPr UK® is very similar to the SCIP–R developed in America. Because of the fact that PROACT SCIPr UK® is a continuously evolving program, there are some differences between the above programs. However they do not cause significant changes in the overall perception of the whole SCIP concept.
ConclusionIt seems that about one-third of the UK organizations do not have written policies for the use of physical intervention (Murphy et al, 2003). Due to such worrying fact the above paper provides an opportunity for all social workers to get acquainted with one of the methods of coping with challenging behaviors, which has been accredited by the British Institute of Learning Disabilities. The reason for writing this paper was to present one of the numerous, current proposals in the system of care of individuals with intellectual disabilities and challenging behaviors as well as the preferred method of using physical intervention as a last resort. The paper outlines only the most significant key points of the SCIP–R intervention-related to provide an overview for the reader. Thus, it does not exhaust or describe all intervention details.
6

INTERNATIONAL JOURNAL OF SPECIAL EDUCATION Vol 24 No 1 2009
ReferencesAHRC’s Bahaviour Management/Positive Approaches Training Curriculum (1998) New York.Allen, D. (2001) Training Carers in Physical Interventions: Research Towards Evidence-Based Practice. BILD Publications, Kidderminster. Baker, P., Bissmire, D. (2000) A pilot study of the use of physical intervention in the crisis management of people with intellectual disabilities who present challenging behavior, Journal of Applied Research in Intellectual Disabilities, 13. Cornick, M. (2004) Physical interventions?, The BATOD Association Magazine, p. 19-20.Cornick, M. (2005), Induction Standard 4. Maintain Safety at Work, in Cornick, M. and Wake, J. (eds), Staff Handbook, The Loddon School. Cornick, M., Holt, L., Bromley, J. (1996) Strategies for Crisis Intervention and Prevention SCIPr – UK, New York, Office of Mental Retardation and Developmental Disabilities.Deb, S., Roberts, K. (2005) The evidence base for the management of imminent violence in learning disability settings, Royal College of Psychiatrists, London. Harris, J., Allen, D., Cornick, M., Jefferson, A., Mills, R. (1996) Physical Interventions: A Policy Framework, Kidderminster, BILD Publications. Murphy, G., Kelly-Pike, A., McGill, P., Jones, S., Byatt, J. (2003) Physical Interventions with People with Intellectual Disabilities: Staff Training and Policy Frameworks, Journal of Applied Research in Intellectual Disabilities, p. 115-125. O’Connor, P. (1998) The History of Institutionalization and the National Deinstitutionalization Movement in America (with special Focus on Willowbrook State School). Master Thesis. The College of Staten Island/ CUNY. Rothman, D. J., Rothman, S. M. (2005) The Willowbrook Wars: Bringing the Mentally Disabled into the Community. New Brunswick, NJ, Aldine Transaction.Strategies for Crisis Intervention and Prevention – Revised. Participant Guide (1998), Nassau County Association for the Help of Retarded Children, New York.
7

INTERNATIONAL JOURNAL OF SPECIAL EDUCATION Vol 24 No 1 2009
REFLECTIONS OF HEARING IMPAIRED STUDENTS ON DAILY AND INSTRUCTIONAL PDA USE
H. Ferhan OdabaşıAbdullah Kuzu
Cem GirginCem ÇuhadarMübin Kıyıcı
Tayfun TanyeriAnadolu University
IntroductionRapidly increasing educational needs of the information society individuals make it necessary and commonplace to use information and communication technologies for instructional purposes. These technologies regulate, direct and shape individuals’ social interactions, and help individuals participate in processes and activities which are relatively difficult to participate in (Englert, Margaret, & Young, 2004). Thus, information and communication technologies have become frequently used devices in modern instructional settings by both students and teachers not only because they provide plenty of interaction opportunities, but also they allow participants to access a plethora of information sources and instructional contents regardless of the time and place they are used.
Instructional use of information and communication technologies carries a peculiar importance as they also facilitate meeting the instructional needs of special students who cannot follow the requirements of normal educational processes. These individuals are different in comparison to their peers regarding their individual characteristics and educational proficiencies. Thus, implementing the same instructional methods and contents might not lead to ideal learning outcomes. In order to provide these individuals with a quality education along with chances to pursue an independent life, the instructional processes should be followed with a greater care (Eripek, 2002). The same motto is valid for both partially and completely hearing impaired children as well. Salubrious use of information and communication technologies for these special individuals might lead to better instructional outcomes and quality learning. Burgstahler (2003) lists the benefits of implementing these technologies for special students as follows. He maintains that using these technologies;
- Maximizes independence in academic and employment tasks,- Increases participation in classroom discussions,- Helps students gain access to peers, mentors and role models,- Helps them self-advocate,- Provides them with access to the full range of educational options,- Helps them participate in different experiences not otherwise possible,- Provides them with the opportunity to succeed in work-based learning experiences,- Secures high levels of independent living,- Prepares them for transitions to college and careers,- Gives them the opportunity to work side-by-side with peers,- Helps them enter high-tech career fields,- Encourages them to participate in community and recreational activities.
In the present study, researchers considered above assumptions plausible and tried to investigate the instructional and daily use of PDA’s by the students with hearing impairment. In this respect, the following parts focus on the education of students with hearing impairment in Turkey, investigate the instructional uses of mobile technologies, and questions the ways to integrate mobile technologies into hearing impaired students’ daily lives and instructional experiences.
Education of the Hearing Impaired in Turkey
8

INTERNATIONAL JOURNAL OF SPECIAL EDUCATION Vol 24 No 1 2009
Even though the language development of hearing impaired students is different from that of their normal peers, they have only two educational options in Turkey. First, they can pursue an education in special mainstream classrooms in normal schools with both hearing and hearing impaired peers. Second, they can go to special schools for the hearing impaired (Girgin, 1999). They can follow their education as either day students or boarding students in all levels of their education except for the pre-school education. When they graduate from the schools for the hearing impaired or from mainstream classrooms, they have the opportunity to enroll in vocational high schools for the hearing impaired or special mainstream classrooms of other vocational high schools without meeting an entrance requirement (MEB, 2006).
When hearing impaired students graduate from special vocational highs schools or mainstreaming, they again have two options of higher education in Turkey. They can either enter the student selection exam (ÖSS) to enroll in a higher education institution according to their scores on the exam, or they can enroll in the Bachelor of Science or two-year degree programs of the School for the Handicapped at Anadolu University based on special ability tests. Anadolu University School for the Handicapped is the only institution in Turkey which provides hearing impaired students with a bachelor degree. In order to provide special students with an education which is appropriate for the type and degree of their impairment, several programs are simultaneously offered in the institution including graphic arts, ceramic arts, architectural drafting and computer operating training. (Girgin, 2006):
Use of Mobile Technologies for the Education of the Hearing ImpairedAksan (1980) defines communication as the transmission of information, ideas, emotions and intentions from one place to another or from one person to another through primitive or mature indicators. In order to transfer a message through a person or place, it is necessary to transform the message to mutual codes or systematic symbols. Bloom and Lahey (1978) call this coding system language, and define it as a group of symbolic relations which are organized through a mutual consensus among individuals in order to sustain the fluency of the communication and describe the experiences in societies.
The basic function of the language is to sustain communication among individuals; however, it also has another crucial function which is to transfer the culture from individuals through individuals. Hearing impaired children with serious hearing problems have difficulty in developing their listening skills since they cannot receive acoustic stimuli appropriately. Some might be as efficient as intact children in speech because of both effective instruction and slight deficiencies in aural organs; however, others have serious speech problems stemming from deficiencies in grammar and phonetics. These individuals either develop insufficient speech skills or utter completely unintelligible patterns which are not accepted by the society (Abberton, Hazan, & Fourcin, 1990). However, diagnosing these students at an early age, exposing them to appropriate instructional settings and providing them with appropriate hearing devices have a considerably positive effect on their acquisition of the language (Clark, 1985; Wood, 1984).
Speaking and listening not only affects children’s language acquisition positively, but also serve as basic means of learning both at school and outside the school (Browne, 1996). Tucker (1998) found out that children who did not have a trace of the hearing residual at the first audiologic tests might have better reception of acoustic signals, better differentiation, definition, and comprehension skills, and a better level of language acquisition if they are given proper hearing devices and exposed to appropriate education.
Hearing impaired children follow the same processes followed by their hearing peers during learning. However, because of their impairment, their language acquisition, reading comprehension, and written production are later realized in comparison to their intact peers (İçden, 2003). Thus, instructional settings prepared for the hearing impaired might be different from those of hearing children. Supporting the skills and knowledge instruction through visuals, accommodating instructional settings for the use of visuals, and sustaining peer interaction particularly carry importance. In addition, considering the importance of learning by experience on the sustainability of knowledge, it is utmost important to sustain active learning which is based on active participation of learners and application of theoretical information on real-life practices (Aile Eğitim Seti, [Family Education Set], 1997).
Technological developments facilitated the interaction of hearing impaired individuals with the world. These developments serve to hearing impaired children under two headings, namely, supportive
9

INTERNATIONAL JOURNAL OF SPECIAL EDUCATION Vol 24 No 1 2009
technologies and instructional technologies (Akçamete, 2003). Electronic hearing devices, warning sets, specially-designed telephones, televisions and tele-text applications facilitate hearing impaired individuals’ interaction with the individuals surrounding them. On the other hand, mobile technologies can be considered as an indispensable alternative for hearing impaired individuals as they facilitate their interaction with the society, and meet their daily and instructional needs.
The term mobile technologies is used to indicate portable information-technology devices and technologies such as cellular phones, personal digital assistants, and GPRS (Çuhadar & Odabaşı, 2004). The rapid increase in individuals’ need to access information whenever and wherever it is needed, made mobile technologies an important instructional device. With the developments in mobile technological devices, the rise of the term mobile learning occurs. Several definitions were provided in the literature regarding this new notion of m-learning. Quinn (2000) defines m-learning as e-learning through mobile computational devices. Fagerberg, Rekkedal and Russell (2002) define it as the use of mobile technologies in education. Georgiev, Georgieva and Smrikarov (2004) claim that m-learning is not a new concept which is different from existing e-learning or distance learning applications; rather it should be considered as a new form of these applications. One concept is common in all these definitions, that is, learning content is delivered to learners through wireless networks and mobile computational devices. When instructional endeavors realized through mobile technologies are examined, two types of applications seem to be the most commonplace (Çuhadar & Odabaşı, 2004):
1. Transmission of content to students through portable computers and wireless networks which allows realization of e-learning applications without depending on time and place,
2. Transmission of electronic course materials, sustaining collaboration and communication among students in traditional instructional settings.
Enriching instructional settings through mobile technologies provide both learners and teachers with important advantages. Sharples, Corlett, and Westmancott (2004) mention some of these advantages as follows. Mobile technologies;
can be used whenever there is a need for learning, support individual learning, provide collaboration and communication everywhere, accommodate to individuals’ particular knowledge and skill level, sustain uninterrupted access to information resources, accommodate to daily communication needs.
M-learning realized through the use of mobile information and communication technologies has some additional advantages (Smith and Kent, 2003). M-learning
provides a motivational stimulus, offers ease of storage and portability, contributes to improved written work, makes it easier to produce written work, increases knowledge of computers, offers a range of useful functions, is readily available at all times.
Mobile information and communication technologies constitute the core of m-learning applications. Handheld computational devices known as personal digital assistants (PDA) are among the most popular of these technologies. These devices process through specially configured operating systems such as PalmOs, Symbian, and Windows. They have the capacity to run frequently used programs such as Ms Word, Excel, PowerPoint and Adobe Acrobat. It is easy to carry these devices everywhere since they are very small. They have touchpad screens or special pens to operate the device. They allow learners to access Internet and other mobile and non-mobile devices regardless of the place and time they are used, since they have the capacity to use the wireless networks.
Through instructional use of PDAs, students can reach electronic materials and online course contents outside the classroom, and enrich their communication with their teachers and peers. PDAs have two basic purposes in mobile learning (Power & Thomas, 2006):
10

INTERNATIONAL JOURNAL OF SPECIAL EDUCATION Vol 24 No 1 2009
- to provide sustained personal access to ICT, through which teachers might develop familiarity with relevant concepts and practices,- to provide access to the projects and professional development materials.
Rios-Gutiérrez and Alba-Flores (2003) maintain that these handheld devices provide access to course contents and laboratory devices which made the learning process more dynamic and interactive. Wireless networks used by these devices support the instructional settings and learning through several ways:
The interaction among learners and instructors is empowered particularly in large classrooms, Interaction outside the classroom is encouraged, Student can develop their own software through handheld devices, Data collection and archiving become easier, Evaluation and data collection become easier through the use of electronic exams and
questionnaires, Collaborative and interactive learning environments are empowered through increased
participation of students.
Purpose of the StudyThe purpose of the study is to determine the ways to integrate mobile technology products into the instructional processes of hearing impaired individuals. Within this framework, following research questions will be addressed:
1. How do hearing impaired children use their PDAs for instruction and for daily purposes?2. Which features of the PDAs attract the hearing impaired students most?3. Which features of the PDAs are ignored by the hearing impaired students?
Importance of the StudyInvestigating the ways to integrate mobile technology devices into the instructional processes of hearing impaired students facilitates designing rich learning environments for these individuals. Since using mobile technology devices require higher levels of technology literacy, the current study aims to design a mobile learning setting for undergraduate hearing impaired students. The only undergraduate institution in Turkey is the School for the Handicapped at Anadolu University where the current research has been conducted. The study is considered important for it constitutes a sample for future researches in Turkey.
MethodData Collection InstrumentThe current study seeks to determine the ways to integrate mobile technology devices into the instructional processes of hearing impaired individuals. In order to serve this purpose, semi-structured interview questions were developed first. Draft questions were examined by an expert panel, revised by experts and shaped according to their comments. Semi-structured interview questions can be listed as follows:
1. What did you do in your daily life and in your Art History Course through your PDA?2. Do you think that your PDA has helped you in learning the contents of your Art History
Course?3. Which features of the PDA did you like most?4. Which features of the PDA did you dislike most?
ProcedureAt the beginning of the research process, researchers obtained five Palm Tungsten W PDAs along with their setup CDs. The PDAs had 16MB hard disk and a peculiar operating system called Palm OS. They could open MS Office documents along with PDF files. They had integrated wireless cellular modems. They could be used as cellular phones which included several features such as SMS, POP3, call waiting, speed dialing, and GSM 900/1800/1900.
Before the research procedures started, each participant was provided training about the technical specifications of the PDAs along with the ways to use the device effectively. Two sessions were administered each of which lasted 90 minutes. During the sessions, students were informed about several applications and were allowed to try those applications on their own as well. After the training sessions, students were given the PDAs, the setup CDs, and the standard user manual along with a
11
INTERNATIONAL JOURNAL OF SPECIAL EDUCATION Vol 24 No 1 2009
special user manual prepared by the researchers. Students were asked to contact with the technical staff whenever they had a problem with the device. Sample pages of the special user manual are given in Figure 1. In the special user manual and during the training sessions, students were trained on how to use the PDAs rather than on basic computer knowledge. That is because the standard information and communication technology courses already cover sufficient information on basic computer skills.
Figure 1. Sample pages from the special user manual of Palm Tungsten WThe special user manual included useful information regarding the PDAs each supported with relevant illustrations such as the specifications of devices, connecting the device to personal computers, turning on and using the Stylus, using the thumb-pad, using the phone, sending and receiving short messages, adjusting GPRS, e-mail adjustments, and surfing the web. In order for students to get used to the technical features of the devices, they were given three weeks. During this time, several meetings were organized where they could ask their questions regarding the use of their PDAs.
Figure 2. A screenshot from the website designed for PDAs
12

INTERNATIONAL JOURNAL OF SPECIAL EDUCATION Vol 24 No 1 2009
As the research topic, Anatolian Civilizations unit of the General Art History Course was selected which lasted three weeks. While the course instructor covered the relevant units during the allotted time, the research group supported the course content through a website where supplementary materials, additional resources and a short exam were included. Participants were asked to use their PDAs within and outside the classroom during this time.The website consisted of four basic elements. The first part provided the introduction, objectives and supplementary materials. The second part transmitted some subjects to students. Students were free to answer a test after each subject. The third part included several web resources. The last part was the contact section through which the technical staff and course instructor could be accessed. Students were informed that they could contact the course instructor and the technical staff whenever they had problems. During the research process, students contacted with the technical staff several times. Each problem was solved by the technical staff. Students mostly had problems in connecting to Internet, reading their e-mails, installing and uninstalling programs, and using Stylus.
Participants Qualitative studies involve in-depth analysis of limited number of participants. Because of the work load of in-depth analysis, qualitative studies can only cope with a limited number of participants in comparison to quantitative studies dealing with a relatively larger amount of participants. The purpose in qualitative studies is to gather as much information as possible through using as many instruments as possible. Some qualitative studies include only one participant. The study is conducted with five hearing impaired undergraduate students from the School for the Handicapped at Anadolu University. Characteristics of the participants are provided below:
1st participant (SK): The first participant is a 22-year-old female. She completed her elementary degree at a school for the hearing impaired and her secondary degree at a vocational high school. She did not know how to use a computer when she started her bachelor degree. Her father has passed away and her mother is a housewife. Her hearing loss is 105 dBHL at the right ear and 107 dBHL at the left ear, that is, she has serious hearing loss. Her general point average (GPA) was 3.16 (out of 4) when she participated in the study.
2nd participant (BB): The second participant is a 21-year-old male. He completed both his elementary and secondary degrees at schools for the hearing impaired. He knew how to use a computer when he started his bachelor degree. His father is a faculty member at a university and his mother is a teacher. His hearing loss is 98 dBHL at the right ear and 95 dBHL at the left ear, that is, he has a serious hearing loss as well. His GPA was 3.61 when he participated in the study.
3rd participant (AS): The third participant is a 23-year-old male. He completed both his elementary and secondary degrees at schools for the hearing impaired. He knew how to use a computer when he started his bachelor degree. He reported that he learnt how to use a computer on his own. His father is a computer technician and his mother is a housewife. His hearing loss is 100 dBHL at the right ear and 90 dBHL at the left ear, that is, his hearing loss is serious. His GPA was 3.45 when he participated in the study.
4th participant (ME): The fourth participant is a 21-year-old female. She completed both her elementary and secondary degrees with normal hearing peers at mainstream classrooms. She knew how to use a computer when she started her bachelor degree. She reported that she learnt how to use a computer at a computer school. Her father is retired and her mother is a housewife. Her hearing loss is 92 dBHL at the right ear and 87 dBHL at the left ear, that is, her hearing loss is serious as well. Her GPA was 3.42 when she participated in the study.
5th participant (MO): The fifth participant is a 20-year-old female. She completed both her elementary and secondary degrees at schools for the hearing impaired. She knew how to use a computer when she started her bachelor degree. She reported that she learnt how to use a computer on her own. Her father is a teacher and her mother is a housewife. Her hearing loss is 107 dBHL at the right ear and 107 dBHL at the left ear, that is, her hearing loss is serious. Her GPA was 3.47 when she participated in the study.
Data Analysis and Interpretation Content analysis was used in order to analyze the data. Content analysis is mostly used whenever the theoretical and conceptual framework is ambiguous. The first step is to code the data. The researcher
13

INTERNATIONAL JOURNAL OF SPECIAL EDUCATION Vol 24 No 1 2009
categorizes the data into meaningful patterns and tries to find out what they conceptually means. Then, these codes are used to attain more meaningful themes. Data is reorganized in accordance with these themes, which leads to a robust definition and interpretation of the dataset. Finally, findings are interpreted and results are put forward by the researcher (Yıldırım & Şimşek, 2005):
Validity and Reliability of the DataGuba and Lincoln (1981) propose four criteria for evaluating qualitative findings and enhancing trustworthiness which are credibility, transferability, dependability and confirmability. In order to incorporate these criteria into the current research design, several strategies are adapted as suggested by Yıldırım and Şimşek (2005), such as extended interaction with the participants, in-depth data collection, triangulation, expert opinion, in-depth description and purposeful sampling.
ResultsFindings and Interpretation The data addressing the first research question, which interrogates whether participants used the PDAs in their daily lives and in their Art History Course, revealed that students neither used their PDAs for instructional purposes nor for daily use. Themes addressing the first research question are summarized in Table 1 below:
Table 1.Reasons for not using PDAs for daily and instructional purposes
Internet connection problems Insufficient time to get used to the PDAs Preferring computers over PDAs Fear of breaking PDAs
Of participating students, SK and ME reported technical problems during Internet connection which prevented them from using their PDAs. Besides, they reported that they could not deal with the problems because they did not have enough technical knowledge. Moreover, they did not ask for the help of technical staff who are from another faculty, since they did not have enough time to deal with the problem. Their opinions are provided below:
The PDA could not connect to Internet. I could not go to the Faculty of Education within the week, because I did not have time. I was in trouble. Since it did not connect to Internet, I always had to go to the Internet café. (SK)
However, I could not use the PDA since there were problems with the Internet connection. I could not fix it or have someone fix it. (ME)
Another reason for not using PDAs for daily and instructional purposes is insufficient time to get used to the PDAs. Students mostly reported that they were unfamiliar with the PDA technology and they did not have enough time to deal with the device because of their assignments. Three students out of five reported this way:
I did not deal with that after the teacher assigned us to do so. Because I had a lot of assignments, thus I did not deal with that. (SK)
At the last days, I never used the PDA. It was hard to spare time for this device along with all those assignments. (ME)
I wanted to learn everything about the PDA, but since we did not have enough time, I did not do so. (MO)
Another reason explaining why students did not use or did not want to use the PDAs is a preference for personal computers over PDAs. Of participating students, BB, AS and MO reported that they did not like the PDAs and they got bored after a short span of use:
… I got bored. […] However, I am not happy with the PDA. It is not necessary for me. (BB)
14

INTERNATIONAL JOURNAL OF SPECIAL EDUCATION Vol 24 No 1 2009
Sorry, but I did not use the PDA and got bored in a short span of time […] I did not use the PDA a lot because it did not attract me, I did not like it. (AS)
I was not happy with that. (MO)
Of participating students, ME reported that the device did not attract her since the language of the device is English. Besides, she reported that since PDAs were not popular, she could not find answer to the technical problems. Thus, she preferred her personal computer over the PDA:
Besides, the palm PC was in English, very few people used it, thus it did not attract me. By few people, I mean, most people do not know about it. So, I cannot ask anybody about my problems. So, I did not use it very much. (ME)
AS reported that he did not see any difference between the PDA and his personal computer. He thought that both did the same stuff; however, he preferred the personal computer over the PDA. MO reported in a similar way while she was answering the fourth interview question:
There is no difference between the PDA and the computer. Computer has the e-mail, PDA has it as well. […] Besides, computer is more beautiful than the PDA. (AS)
As I said, I did not like the PDA, since I did not or I could not use the PDA. Anyways, we always have to use computers because of assignments. Easy way is the short way, thus PDA did not help me at all. (MO)
Fear of breaking PDAs was another theme which was put forward as a reason for not using PDAs. PDAs are expensive devices. Students hesitate using these devices since the devices did not belong to them. AS and MO put it as follows:
I would like to learn how to use PDAs, but I could not completely learn because there might be a problem or an error. (AS)
I would like to search everything about the PDA but […], I was afraid to break it . (MO)
Even though participants reported that they mostly abstained from using the PDAs, they stated that they used the PDAs for some daily and instructional purposes. Regarding the question which interrogates what types of daily and instructional activities they realized through PDAs, the following themes are summarized from the dataset:
Table 2.Hearing Impaired Students’ Preferences of PDA Use
Types of Instructional PDA Use Types of Daily PDA Use Sending and receiving e-mail Surfing the web Note-taking Playing games Interaction with the course material Telephone Summarizing SMS
Sending and receiving e-mail
When Table 2 is examined, it is observed that one of the activities done by students is to send and receive e-mails. Of participating students, BB reports as follows:
I learnt how to send e-mails to the instructor, but it did not show whether it sent the message or not. I wondered. I immediately checked Internet on my personal computer. I had sent. I sent the message again. I was confused. (BB)
Above expression of BB reveals that since the student was not sure whether the message was received by his correspondent, he preferred to check the same procedure through the personal computer. This expression also shows that students do prefer personal computers over the PDAs.
Another theme regarding the instructional use of PDAs is note-taking which is illustrated through MO’s answer below:
15

INTERNATIONAL JOURNAL OF SPECIAL EDUCATION Vol 24 No 1 2009
I saved important things and the things the teacher wrote on board to the ‘notes’ part of the PDA in the Art History Course. Then I transferred them to a paper at home. (MO)
In terms of the instructional use of PDAs, MO stated that she searched relevant supplementary materials for the course, accessed course materials, read and summarized them, and tried to send some materials to her instructor through the PDA. However, because of the technical problems, she then used her personal computer, summarized the course materials and send them to the instructor through the PC. Her opinions regarding this issue are provided below:
… I did research regarding the first assignment the teacher gave, I read it and summarized it through the PDA; however, I had problems in sending this material to the instructor. […] However, I read the information regarding Art History in the ‘Resources’ section. I summarized the info and sent it to the instructor through my personal computer. (MO)
When the PDAs daily use is considered, it is observed that they are mostly used for accessing and surfing Internet. Some of the student responses are provided below:
I checked the Internet the most. (BB)I accessed Internet through the PDA. (BB)When I use the PDA, I mostly surf the web. (AS)In my daily life, I accessed the Net and looked at some pictures, but not so much.
(MO)
Another activity done through the PDAs outside the classroom is gaming. BB, AS and ME reported that they played games with the PDAs:
I played games through the PDA. (BB)When I used the PDA, I mostly accessed the Internet, read the messages and
played games. (AS)When I got bored, I played games.(ME)
Since the PDAs could be used as cellular phones as well, students might have preferred to use them. However, the only student who mentioned this reason, MO said I used the PDA since I do not have a cell phone. This statement reveals that she used the PDA not because she liked using it, but she had to use it as she did not have a cell phone. She also mentioned that she did not like the cell phone of the PDA, but she used it to send short messages to her family:
… I send messages and called my family and friends (You were not happy with the PDA.) (MO)
ME mentioned that the cell phone of the PDA is much more complicated than normal cell phones, thus she preferred not to use this specification of the device:
The cell phone was somewhat complicated. I did the same thing more practically through my own cell phone. (ME)
Messaging is another way of using the PDAs for daily purposes. AS’s response below can be given as an example of this:
When I used the PDA, I mostly accessed the Internet, read messages and played games. (AS)
ME reported that she did not have enough time to deal with the PDA because of her assignments; however, she used the device for e-mailing for a couple of times:
It was hard to deal with this device along with all our assignments. I could just send a couple of e-mails. (ME)
16

INTERNATIONAL JOURNAL OF SPECIAL EDUCATION Vol 24 No 1 2009
The research question addressing the most interesting features of PDAs revealed two themes which are given below:
Table 3.Hearing Impaired Students’ Most Favorite uses of the PDAs
Gaming Sending and receiving short messages
Four out of five participants mentioned that they liked the game feature of the PDAs most. SK also mentioned that she liked sending short messages along with gaming. Some participant responses are provided below:
I liked the game feature.(BB)I just liked sending short messages and playing games. (SK)
ME reported that the PDA was not technically attractive and interesting. She stated that she would prefer a more advanced and user friendly device than the PDA:
The PDA was not technically attractive to me. It did not attract me. I could have liked it, if it would have been a more advanced and user friendly device. (ME)
The final research question addressing the disliked features of the PDAs revealed six themes which are provided in Table 4 below:
Table 4. Hearing Impaired Students’ Least Favorites about the PDAs
Connecting to the Internet Sending short messages Using the device as a cell phone Sending and receiving e-mails Watching, downloading and sending pictures The operating system
Some of the participant responses regarding the least favorites are provided below: I did not like the Internet feature, sending and receiving messages through the phone, sending e-mails, picture feature and the operating system. (BB)
What I disliked most about the PDA is e-mailing, picture features and the operating system. (AS)
MO reported that she was not happy with the devise, since it took too much time to access the Internet and turn on the cell phone of the device:
I certainly disliked the Internet and the cell phone features, because it takes too much time to turn these on, sometimes having problems in switching on. I did not like the other features anyway. (MO)
Conclusions and Suggestions for Further ResearchHearing impaired individuals constitute an important part of the society. They have the same cognitive abilities as hearing individuals; however, it is harder for them to interact with the society because of their impairment. Thus, it carries utmost importance to integrate information and communication technologies into instructional endeavors with the hearing impaired. Findings of the current study which focused on the ways to integrate information and communication technologies into lives of the hearing impaired students can be rephrased and interpreted as follows.
The PDAs used during the study involves an operating system (PALM OS) which is quite unfamiliar to the hearing impaired students. Different features provided by the operating system decrease the students’ likelihood of using the PDAs for daily and instructional purposes. In order to facilitate the use of PDAs by students, it might be plausible to use PDAs which can operate through mobile versions of Windows students are more familiar with. In addition, students mentioned that they had several technical problems which prevented them from using the PDAs properly. Constant and on-time technical support along with practical information to help students solve the problems on their own
17

INTERNATIONAL JOURNAL OF SPECIAL EDUCATION Vol 24 No 1 2009
might be quite beneficial in this respect. Technical staff that is always available should be hired for such problems as well. Moreover, the time span to get used to the PDAs should be longer during which students will be able to learn to use the device comfortably. Along with the technical support which should be provided to students in order to increase the productivity, it is crucial to conduct similar studies to integrate these devices into other courses. Such an attitude will help students get used to the devices better and use them effectively in several courses. Expanding the approach in the current study to other courses will also help students develop positive attitudes towards these devices.
In comparison to desktop computers, PDAs mostly have the ability to use the wireless networks; however, their specifications are generally more limited. Regarding the limited specifications of these devices, making use of their advantages to a higher extent, integrating quality visuals to course contents, and sustaining constructive communication and collaboration through the PDAs can motive hearing impaired students towards the course and the PDA use.
ReferencesAbberton, E. V., Hazan., & Fourcin., A. (1990). The development of contrastivenees in profoundly deaf children speech. Clinical Linguistics and Phonetics, 4(3), 209.Aile Eğitim Seti (Family Education Set) (1997). İşitme engelli çocuklar: Ankara: TC Başbakanlık Özürlüler İdaresi Bilgi İşlem Dairesi Başkanlığı. Web adresi: http://orgm.meb.gov.tr/yayinlar/isitmeengelliler/01kapak.htmAkçamete, G. (2003). Özel gereksinimli çocuklar ve özel eğitime giriş. In A. Ataman (Ed.), İşitme Yetersizliği Olan Çocuklar (pp. 311–357). Ankara: Gündüz Eğitim ve Yayıncılık.Aksan, D., (1980). Her yönü ile dil. Ankara: T.D:K. Yayınları.Bloom, L., & Lahey, M. (1978). Language development and language disorders. New York: J. Wiley and Sons Browne, A. (1996). Developing language and literacy 3–8. London: Paul Chapman Publishing Ltd. Burgstahler, S., (2003). The Role Of Technology In Preparing Youth With Disabilities For Postsecondary Education And Employment. Journal of Special Education Technology. 18(4). Retrieved February 02, 2007, http://jset.unlv.edu/18.4/issuemenu.html Clark, M., (1985). Developing the spoken language skills of impaired children: 1 laying the foundations. M.U.T.V,. 10. disabled and nondisabled children. American Annals of the Deaf, 133(1), 43-50. Çuhadar, C. ve Odabaşı, F. (2004). Mobil Teknolojilerin Eğitimde Kullanımı. 2. Uluslararası Balkan Eğitim Bilimleri Kongresi Bildirileri Kitabı: 317-321. Edirne: Trakya Üniversitesi. 09/10/2004.Englert, C. S., Margaret M. & Yong Z. (2004). I Can Do It Better on the Computer: The Effects of Technology-enabled Scaffolding on Young Writers' Composition. Journal of Special Education Technology. 19(1). Retrieved February 02, 2007, http://jset.unlv.edu/19.1/englert/first.html Eripek, S. (2002). Özel eğitim. In S. Eripek (Ed.). Özel gereksinimi olan çocuklar ve özel eğitim (pp. 1-14). Eskişehir: Anadolu Üniversitesi Yayınları.Fagerberg, T. Rekkedal, T. ve Russell, J. (2002). Designing and Trying Out a Learning Environment for Mobile Learners and Teachers. Retrieved February 21,2005 From http://www.nettskolen.com/pub/artikkel.xsql?artid=115Georgiev, T., Georgieva, E. ve Smrikarov, A. (2004). M-Learning – a New Stage of E-Learning. International Conference on Computer Systems and Technologies . Retrieved January 04,2005 from http://ecet.ecs.ru.acad.bg/cst04/ Docs/sIV/428.pdfGirgin, Cem. (2006, July) History of Higher Education Provision for the Deaf in Turkey and Current Applications At The Anadolu Unıversıty. The Turkish Online Journal of Educational Technology - TOJET Volume 5, Issue 3, Article 2. Retrieved . February 02,2007 from http://www.tojet.net/articles/532.htmGirgin, Ümit. (1999). Eskişehir İli İlkokulları 4. ve 5. Sınıf İşitme Engelli Öğrencilerinin Okumayı Öğrenme Durumlarının Çözümleme ve Anlama Düzeylerine Göre Değerlendirilmesi. Eskişehir: T.C. Anadolu Üniversitesi Yayınları: No:1168 Eğitim Fakültesi Yayınları No: 62, .Guba, E.G., & Lincoln, Y. S. (1981) Effective evaluation: Improving the usefulness ofevaluation results through responsive and naturalistic approaches. San Francisco, CA:Jossey-Bass.MEB. (2006). Ülkemizde İşitme Engellerin Eğitimi, Özel Eğitim Rehberlik ve Danışma Hizmetleri Genel Müdürlüğü, Retrieved January 16,2007 http://orgm.meb.gov.tr/OzelEgitim/isitme_dosyalar/turkiyedeisitmeengegitimi.htmMiles, Matthew B. ve A. Michael Huberman.(1994). Qualitative Data Analysis: An Expanded Sourcebook. Second Edition. California: Sage Publications,
18

INTERNATIONAL JOURNAL OF SPECIAL EDUCATION Vol 24 No 1 2009
Quinn, C. (2000). mLearning: Mobile, Wireless, In-Your-Pocket Learning. 2000 Line Zine. Retrieved February 21,2005 from http://www.linezine.com/ 2.1 /features/cqmmwiyp.htmPower, T., & Thomas, R. (2006). M-Learning: The classroom in your pocket? Research Group on International Development in Teacher Education across Societies and Cultures (RITES). Open University, UK. Retrieved February 10, 2007 from http://www.open.ac.uk/deep/Public/web/publications/pdfs/TPowerRThomas2006-BERA.pdfRios-Gutiérrez, Fernando & Rocio Alba-Flores. (2003). Handheld Computer as a Tool for Interactive Learning in Engineering Courses. International Conference on Engineering Education. 21- 25 July 2003. Retrieved February 28,2007 from http://www.ineer.org/Events/icee2003/proceedings/pdf/3237.pdfSharples, M., Corlett, D. ve Westmancott, O. (2004). The Design and Implementation of a Mobile Learning Resource. Retrieved February 05,2005 From http://www.eee.bham.ac.uk/sharplem/Papers/mobile%20learning% 20 puc.pdfSmith, C. S., & Kent, P. (2003). The use of palmtop computers for learning: A review of literature. Learning and Skills Development Agency. Retrieved February 15, 2007 from http://www.m-learning.org/archive/docs/the_use_of_palmtop_computers_for_ learnin g_sept03.pdfTucker, B. P., (1998). Cochlear implants: A handbook. McFarland & Company, Inc.Wood, D., J. (1984). Aspects of the linguistic competence of deaf children. British Journal of Audiology. (18), 27.Yıldırım, A. ve Şimşek, H. (2005). Sosyal Bilimlerde Nitel Araştırma Yöntemleri. Ankara: Seçkin Yayıncılık.
19
INTERNATIONAL JOURNAL OF SPECIAL EDUCATION Vol 24 No 1 2009
CORRECTIVE FEEDBACK OF ORAL DECODING ERRORS FOR DIVERSE LEARNERS WITH READING DISABILITIES:
THE EFFECTS OF TWO METHODS ON READING FLUENCY
Morgan WatsonCecil Fore III
Richard T. BoonThe University of Georgia
The purpose of this study was to compare the effects of two corrective feedback methods, word-supply and phonics-based, on the oral reading fluency of students with mild disabilities. The participants included three students in the fourth grade who were diagnosed with a Specific Learning Disability (SLD) or Emotional and/or Behavioral Disorder (EBD). A single subject modified parallel treatments design (Alberto & Troutman, 2008) was used to evaluate the effectiveness of the two types of feedback methods (e.g., word-supply and phonics-based) on the students oral reading fluency skills. In the word-supply condition, students were provided the whole word upon a miscue, while in the phonics-based condition students were provided the word phoneme-by-phoneme in a sounded-out fashion. Feedback procedures were implemented upon the occurrence of word miscues during the oral reading. Dependent measures included the number of correct words per minute, recorded as a rate on individual passages taken from leveled readers. Results of the fluency data collected on the errors corrected using either the word-supply or phonics-based feedback method revealed that the word-supply feedback condition was slightly superior for two of the three students.
Reading achievement has long been an issue of high priority in American schools for students with and without disabilities. Students must learn to read fluently to obtain meaning from written text in order to succeed in comprehending a variety of content areas in school and in their professional and social lives beyond school (Mastropieri, Scruggs, & Graetz, 2003; Therrien, 2004). For students with specific learning disabilities (SLD), mild intellectual disabilities (MID), and emotional and/or behavioral disorders (EBD), the task of learning to read is an exceptionally pressing concern. More than 80% of students with SLD have some sort of reading difficulty (Gersten, Fuchs, Williams, & Baker, 2001) and have reading objectives identified for instructional focus in their Individual Education Plans (IEPs) more than any other academic skill (Bos & Vaughn, 2008). Similarly, according to Vaughn, Levy, Coleman, & Box (2002) many students with emotional and/or behavioral disorders (EBD) often have reading skill deficits and function one or more years below grade level in reading, math, writing, and spelling (Spencer, Scruggs, & Mastropieri, 2003) and show underachievement in reading when compared with their intellectual capabilities. Epstein, Kinder, & Barsuck (1989) reported that students with EBD have more difficulty in reading and mathematics instruction than other students of the same age and these students were more likely to fail courses than students without disabilities (Wagner, Blackorby & Hebbeler, 1993).
Imperative to the ultimate goal of reading comprehension is the skill of fluency, or reading with both accuracy and speed. Though there are a variety of reasons students with disabilities may have difficulty achieving reading comprehension commensurate with their grade level peers, studies have linked improved reading fluency with improved reading comprehension (Chard, Vaughn, & Tyler, 2002; Fuchs, Fuchs, Hosp, & Jenkins, 2001; Mastropieri & Scruggs, 1997; Mastropieri, Leinart, & Scruggs, 1999; Reutzel & Hollingsworth, 1993). Students who read slowly and/or inaccurately often expend too much cognitive effort in the decoding process to allow for comprehension to take place (see Gersten, Fuchs, Williams, & Baker, 2001; Mastropieri, Scruggs, Bakken, & Whedon, 1996; Talbott, Llyoyd, & Tankersely, 1994, for reviews).
20

INTERNATIONAL JOURNAL OF SPECIAL EDUCATION Vol 24 No 1 2009
Fortunately, there is the potential for reading fluency to be developed using several evidence-based methods, such as repeated readings, taped readings, and choral reading, but only individual student oral reading allows teachers to provide feedback to students on their errors and assess specific areas of skill deficit on which to focus for each student (Heubusch & Lloyd, 1998). Thus, it is imperative that word identification errors, or miscues, made during oral reading be corrected with the most effective method available. For that reason, the purpose of this study is to determine the most effective means of providing feedback of miscues during oral reading for elementary students with high-incidence disabilities.
A major tenet of special education reading instruction guiding this study is the direct instruction model set forth by Carnine, Silbert, and Kame’enui (1997) in Direct Instruction Reading. Here, it is proposed that struggling readers, who cannot afford to risk practicing miscues, be given explicit, code-based instruction that includes modeling, or word-supply immediately following the student’s oral reading miscue. The Corrective Reading Program (Engelmann et al., 1999) is based on the direct instruction model of Carnine et al. (1997). The scripted reading program instructs teachers to stop students immediately upon miscue, provide the word (the word is_____), prompt the student to say the word (what word?) and then prompt the student to reread the sentence.
Recent studies on oral reading feedback methods have targeted their effects on varying components of students’ overall reading ability. Results have strongly favored corrective feedback, in which some decoding strategy or the actual word is given, to either general feedback, in which students are simply told to try again, or receive no feedback. However, results have been mixed as to which type of corrective feedback is superior for improving reading fluency. Types of corrective error feedback studied have included meaning-based, in which the student is prompted in various ways to think about whether the miscued word makes sense in the context of the sentence, phonics-based, in which the student is prompted to sound-out or otherwise analyze the miscued word, and modeling, or word-supply feedback, in which the word is simply supplied after a designated amount of time following the miscue.
In the first study, Pany and McCoy (1988) compared the effects of two feedback methods- total feedback and meaning change feedback with a control group of a no feedback condition with 16 third graders with LD. In the total and meaning change conditions, the feedback was held constant and utilized a succession of prompts that ranged from asking the student to try again to providing phonemic cues to supplying the word. The independent variable was the selection of miscued words chosen to receive feedback rather than the type of feedback. In the total feedback condition, all miscues were followed by the succession of feedback prompts, whereas, in the meaning change feedback condition, only those miscues that affected the meaning of the passage were followed by the succession of prompts. Each student read a different one of three passages under each treatment condition in a varying pattern of passage-to-intervention. Following each passage reading session, comprehension and word recognition was measured by a passage-based assessment including a story retell, comprehension questions, word list reading, and delayed word list reading. Results indicated the total feedback condition showed results that were significantly superior to both the meaning change condition and the no feedback condition on all measures of word recognition and comprehension. There were no pretest scores to determine overall reading improvement as a result of the interventions.
In the second study, using a pretest/posttest multiple treatment design, Perkins (1988) compared four feedback treatments on 48 elementary boys with LD, who were in the acquisition stage of learning. He concluded that word-supply feedback was superior to two other forms of feedback and to no feedback on word recognition of ten CVC nonsense words, or trigrams. Students were pretested on a transfer list of ten words that were comparable to the experimental word list. The treatment conditions included: (a) general feedback, in which the experimenter responded to errors by simply prompting the student to try again; (b) modeling feedback, in which the experimenter supplied the word; and (c) phonics-based feedback, in which the experimenter prompted the student to sound-out the word, paying particular attention to the beginning, middle, and/or ending sound, depending on the location(s) of the error. The fourth condition was a no-feedback condition. A posttest of the transfer word list was given immediately following treatment and one week later to test for maintenance effects. A comparison of mean posttest scores reflecting the number of words read correctly for each treatment group revealed the modeling condition to be superior to all other conditions on the immediate posttest. However, the modeling treatment also showed the sharpest decline in reading scores on the delayed posttest, suggesting that modeling, or word-supply feedback may not be the most effective feedback method for promoting maintenance of word recognition skills. The study has limited utility in analyzing feedback
21
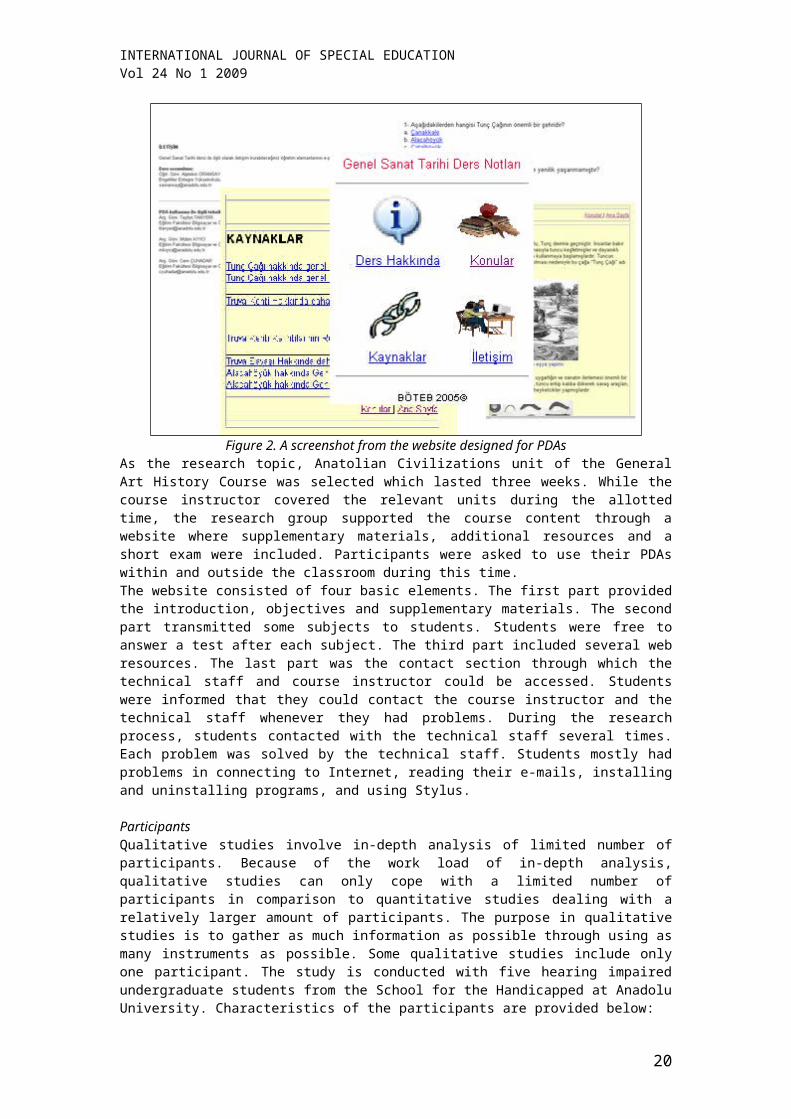
INTERNATIONAL JOURNAL OF SPECIAL EDUCATION Vol 24 No 1 2009
effects on oral reading fluency, however, because, as in the Spaai et al. (1991) study, the dependant variable only included the reading of words in isolation with no timed measure, and the ability to decode words in isolation does not necessarily transfer to passage reading fluency.
In the third study, Spaai, Ellermann, and Reitsma (1991), compared the effects of word-supply feedback to segmented feedback on first grade average readers’ single word reading accuracy and time. The study utilized a pretest/posttest multiple treatment design with 66 first grade boys and girls from average reading classrooms. The students’ reading accuracy and time was compared as measured by posttest scores on isolated word lists. The students were divided into 3 groups: (a) a whole word-supply group, in which the whole word was provided to the student upon miscue; (b) a segmented word-supply group, in which the individual phonemes of the word were provided upon miscue; and (c) a control group, in which no feedback was given upon miscue. In all conditions, the words were presented individually on a computer screen, and feedback was given via a digitized voice presentation of either the segmented phonemes or the whole word. Results showed the whole word condition to be favorable to both the segmented word and no feedback conditions on measures of accuracy and speed of decoding. Because the word reading accuracy score was derived from the percentage of words read correctly from the entire list, whereas the time score was derived from averaging the time to read each word, the reader cannot glean information as to the effects of the feedback methods on the fluency of the participants.
In the fourth study, Crowe (2003), 12 students, ages 8 to 11 years-old in third, fourth, and fifth grades with various language learning disabilities were compared for reading improvements following either one of two interventions (treatment groups) or no intervention (control group). The students were divided into three groups of four students each. The first group (Group 1) received “traditional” decoding feedback during oral reading. Traditional feedback was defined by the following criteria for interventionist’s prompts: sounding out the word, rereading the word dividing the word into smaller segments, providing phonemic cues, and providing the word. Conversely, the second group (Group 2) received meaning-based feedback, referred to as Communicative Reading Strategies (CRS), in which the interventionist provided preparatory sets, prompted students to summarize, explained word usage, and provided pronoun referencing and cohesive ties, while (Group 3) served as the control group and received no intervention. Pretest and posttest scores were compared from two standardized measures of reading ability including: (a) the Gray Oral Reading Test-Revised (GORT-R); and (b) the Comprehensive Receptive and Expressive Vocabulary Test (CREVT, Form A), including measures of reading comprehension, passage reading (fluency), overall oral reading, receptive vocabulary, expressive vocabulary, and general vocabulary. Results revealed that Group 2 showed significantly higher gain scores than the Group 1 and the control group in all areas except receptive and general vocabulary. Because the values for the independent variables were so broad (each treatment group had multiple defining criteria), it is difficult to discern whether one or more values for each variable was responsible for each treatment’s success or failure. Additionally, the Group 1 intervention features appeared to focus on feedback after miscues, whereas the Group 2 intervention features focused on prompting before the occurrence of miscues.
Finally, in the fifth study, Crowe (2005) examined the effects of two types of oral reading feedback strategies with 8 third, fourth, and fifth grade students with low reading abilities and reading comprehension skills. The study used a pretest/posttest treatment comparison design to compare the effectiveness of the two oral reading feedback techniques, which lasted in duration from one hour of intervention twice a week over a period of 5 weeks. The students were divided into one of two groups, either the (Intervention 1) group, which used a traditional decoding type feedback procedure or the (Intervention 2) group, which employed Communicative Reading Strategies (CRS) or a meaning-based feedback approach. Pretest and posttest scores were compared from three standardized measures of reading ability: (a) the Gray Oral Reading Test-Revised (GORT-R); (b) the Comprehensive Receptive and Expressive Vocabulary Test (CREVT, Form A), including measures of reading comprehension, passage reading (fluency), overall oral reading, receptive vocabulary, expressive vocabulary, and general vocabulary; and (c) a subtest of the Assessment of Sound Awareness and Production. Results indicated that the students in the Communicative Reading Strategies (CRS) condition or meaning-based feedback approach was more effective and showed significantly greater gains on posttest measures than the traditional decoding approach to facilitating the students oral reading comprehension skills, as measured by formal assessment measures of reading comprehension and story-related comprehension questions.
22

INTERNATIONAL JOURNAL OF SPECIAL EDUCATION Vol 24 No 1 2009
Each of the studies reviewed used varying operational definitions for its feedback conditions, making comparisons across studies is somewhat difficult. For example, in the Crowe (2003) and Hernandez (1989) studies, the traditional feedback condition included both word-supply and the prompt to sound-out the word, whereas the Rose et al. (1982), Perkins (1988), and Spaai et al. (1991) studies defined word-supply and phonemic segmentation as two separate conditions. Additionally, studies that have measured the decoding of words in isolation provide limited information as to the effectiveness of each feedback intervention on passage reading fluency.
Given the importance of learning to read words in the context of whole passages, or texts, and the established connection between oral reading passage fluency and comprehension, this study sought to compare the effectiveness of two feedback conditions: (a) words-supply and (b) phonics-based, during passage reading on the oral reading fluency of fourth grade students with specific learning disabilities and emotional and/or behavioral disorders. This study, then, sought to answer the following two research questions:
1. Are the word-supply and phonics-based feedback methods effective at increasing the oral reading fluency (ORF) of students with disabilities?
2. Is one method, word-supply or phonics-based, superior to the other in its ability to increase the oral reading fluency of students with disabilities?
For the purpose of measurement, oral reading fluency (ORF) was defined in this study as the number of correct words per minute (CWPM) during passage reading under each treatment condition.
MethodParticipantsThe study involved three students in the fourth grade from one elementary school in the southeastern United States in a middle class urban neighborhood. The students were identified at the time of the study for Special Education services based on state eligibility requirements and all had reading objectives stipulated on their current Individualized Education Plans. All three students were receiving reading instruction from the investigator/ teacher during the same 45 minute class period, an interrelated resource class designed to serve students with high-incidence disabilities. All participants had previous experience with the word-supply feedback method and at least one component of the phonics-based feedback method (either they have been prompted to sound-out miscued words, or a teacher has modeled the segmented sounds of miscued words).
Prerequisite skills necessary for inclusion in the study were hearing and vision within normal limits with or without the aid of corrective devices, the ability to decode at least 40 words in a passage of at least first grade level, to comprehend and verbally respond to verbal feedback, to comprehend and follow multi-step instructions, to have shown previous positive response to reinforcement systems, and to have shown sufficient levels of motivation to participate. All students had been previously assessed for and had been found to possess the prerequisite skills based on daily observations during the preceding one month period that the investigator was the reading instructor for the participants, or based upon IEP reports stating such criteria had been met. Of the 7 students available to the investigator at the start of the study, 4 students were excluded; one was excluded for irregular school attendance; two were excluded based on behavioral observations indicating insufficient motivation and/or inconsistent response to reinforcement systems; and one was excluded because of inability to read at least 40 words at the first grade reading level. Therefore, three students were chosen to participate in the study.
Tiara is a 10 year, 7 month-old, fourth grade female of low SES served for an Emotional and/or Behavioral Disorder. She also received services for a Language Impairment in the area of receptive language comprehension. Her General Cognitive Ability, as measured by the Stanford-Binet intelligence test is SS 102. Overall Achievement score (Total Test on the PIAT-R was SS 87. Specific scores in the area of reading include: KABC Reading- SS 72. She has been in special education for 2 years, 6 months).
Samantha is an 11 year, 3 month-old, fourth grade Hispanic female of low SES served for a Specific Learning Disability in the areas of reading and written expression. She also receives services for a Speech and Language Impairment in the area of an articulation disorder. Her General Cognitive Ability, as measured by the Differential Ability Scale (DAS) is SS 91. Her overall achievement score (Total Test) on the PIAT-R was SS 90. Specific scores in the area of reading include: PIAT-R- Reading
23

INTERNATIONAL JOURNAL OF SPECIAL EDUCATION Vol 24 No 1 2009
Recognition SS 69; Reading Comprehension SS 71; DAS Word Reading- SS 55. She has been in special education for 4 years, 8 months.
Alana is an 11 year, 5 month-old, fourth grade African American female of medium SES served for an Emotional and/or Behavioral Disorder. Her general cognitive ability, as measured by the Reynolds Intellectual Ability Scale (RIAS) is 87. Overall achievement scores include: Peabody Individual Achievement Test-Revised (PIAT-R) - Total Test SS 80; Specific scores in the area of reading include: Wide Range Achievement Test, Third Edition (WRAT-3) Reading- SS 71; Reading Recognition- SS 67; Reading Comprehension- SS 79. She has been in special education for 3 years, 1 month.
Table 1Students’ Demographic Data
Setting and ArrangementsInstruction was conducted in the participants’ existing interrelated resource classroom, a 15’ x 30’ trailer placed just outside the school building of a small urban public elementary school for pre-kindergarten through fifth grade. Instruction was conducted by the students’ resource teacher, who was also the investigator for this study. During each session with an individual participant, the two other participants were present in the room and were assigned independent work activities or participated in direct instruction with either the teacher’s assigned paraprofessional or a practicum student assigned to the teacher during the investigation period. Sessions were conducted in a 1:1 arrangement, with the student and investigator seated facing from each other at the investigator’s desk placed at one end of the classroom. Reading materials were placed on a 12” x 18” pull-out desk section between the participant and the investigator.
MaterialsEach participant was instructed in reading 4 reading passages. Each reading passage consisted of just over 100 words typed in 12 point black Arial font and double spaced on standard white paper. Reading passages were selected from leveled readers not currently used in the classroom to reduce the possibility of prior experience with the passage. Reinforcement materials included red tickets typical of the type used in movie theaters and carnivals which are ripped from perforated rolls. The students earned a ticket for appropriate participation after each session and were given the opportunity to exchange them for various reinforcers such as pencils, notepads, erasers, puzzles, and small toys when they had accumulated 10 tickets. Passage reading was timed using a digital timer.
24

INTERNATIONAL JOURNAL OF SPECIAL EDUCATION Vol 24 No 1 2009
ProceduresScreening Procedure. Participants were screened during 6 sessions across 6 consecutive days to determine which reading passages they were able to read below instructional level. Instructional reading level is defined as that level of difficulty at which the student can successfully read a passage with teacher support. Typically, instructional level is determined by the reading level at which the student can identify words within the passage with 94-96% accuracy (Bos & Vaughn, 2008). Based on data already collected during instructional time which provided evidence as to each student’s instructional reading level, the investigator began presenting passages to each student at his or her instructional level, increasing the level of difficulty of passages presented until the investigator identified 4 passages which the student was able to read at 80-85% accuracy. This accuracy level was set at a level commonly considered frustrational level to allow for the measurement of feedback affects. During the screening sessions, each student worked individually with the investigator. Passages were presented one at time, with the instruction to do your best reading. The student read from one copy of the passage, while the investigator marked miscues on an identical copy. The investigator positioned the recording copy of the passage out of the line of sight of the student, taking care to avoid allowing the student to see marks in order to avoid distraction or feedback affects. Words that were omitted after 3 seconds, mispronounced, or substituted were marked as miscues, and the investigator placed a slash mark through that word. No feedback was given during the screening phase with the exception of general praise following the reading of each passage along with any necessary behavioral corrections. If the student paused or struggled for more than 3 seconds over a word, however, the investigator said skip it, prompting the student to move on.
Response Definitions and Data Collection. During all sessions, oral reading fluency, defined as the number of correct words read per minute, was tallied and recorded as the number of correct words per minute (CWPM). An error, or miscue, was defined as any word that was omitted after 3 seconds, substituted with another word or form of the word, or mispronounced. Any error in word pronunciation that was deemed to be due to an articulation problem (e.g. difficulty pronouncing r’s) or due to the participant’s dialectical patterns (he walk, rather than he walks) were not counted as a miscue if the response is known to be a reflection of the student’s typical oral language patterns. All miscues were recorded as a slash mark on the investigator’s copy through the word read incorrectly or not read. Miscues were tallied to arrive at a reading rate, which were then recorded on a graph for that session. The same recording procedure was used for all phases of the experiment.
General Procedures. The 4 reading passages selected during the screening phase were matched by similar baseline fluency scores and assigned one of the two treatment conditions, with 2 passages being taught in the word-supply condition and 2 passages taught in the phonics-based condition. One passage was taught during each treatment condition, with two treatments conducted simultaneously during one phase. Two sessions were conducted per day, one in the morning and one in the afternoon, with treatment conditions alternating and counterbalanced between morning and afternoon sessions to control for order or time of day affects. In one session, word-supply feedback was used, and in the other session, phonics-based feedback was used. A total of 10 sessions were conducted per intervention phase including 5 word-supply sessions and 5 phonics-based sessions for each participant. Maximum session length for treatment conditions was 3 minutes per session. During the first session of each condition, participants were told, I am timing your reading to see how many words you can read correctly in one minute. Students were then prompted to sit up straight and focus on the material, and they were told that when they finish reading for one minute with focused attention on the passage, they would receive one ticket to be exchanged for a prize when 10 tickets are earned. Reminders to this affect were made periodically throughout the study, with equal prompting time given to each intervention. During each session, the selected passage was placed in front of the student, and the title of the passage was read to the student. The investigator then gave the instruction to do your best reading. You may start now. The investigator began timing at the moment the student began the first word, and stopped timing after one minute. During all sessions, if a student lost her place, the investigator pointed to the word from which the student should continue reading. During error correction for both treatments, the investigator stopped the timer when a correction was initiated by the investigator, and the stopwatch was restarted when the participant began reading again. At the end of each session, the total number of errors and total number of words read correctly were tallied and recorded. All errors, or miscues, were coded in the same manner across all conditions. Total number of words read correctly constituted the reading rate, since a one minute time period was used. When a student read the passage in less that one minute, the timer was stopped and the accuracy score was multiplied by 60 seconds and divided by the total seconds to arrive at a reading rate. The method of
25

INTERNATIONAL JOURNAL OF SPECIAL EDUCATION Vol 24 No 1 2009
reinforcement was the same across conditions. The student was given verbal praise, one ticket for appropriate behavior, and was shown progress in the number of words the student was able to read compared to the last session, immediately following each session. In response to inappropriate behavior during the passage reading (e.g. teeth-sucking, heavy sigh upon error correction) no ticket was given and a simple statement of the appropriate behavioral expectation was given. In this case, the student still received the reinforcers of simple verbal praise (good reading) and progress shown on words read. All procedures were held constant across all probe and treatment conditions, with the exception of the method of correcting miscues.
Before beginning the first intervention condition, a probe phase was undertaken to obtain a baseline ORF score for each of the 4 reading passages. The first baseline probe phase (P1) was conducted over 3 consecutive sessions. The first treatment condition (T1) followed the first probe, during which both treatments were implemented simultaneously on the first set of reading passages (one passage per treatment) and continued for 5 consecutive sessions. A second probe phase (P2) followed T1 and again included all 4 reading passages over 3 consecutive sessions. The second treatment condition (T2) followed the P2, during which both treatments were implemented simultaneously on the second set of reading passages. Finally, a third probe phase (P3) was implemented on all 4 passages.
Probe Procedures. A probe condition was implemented prior to the introduction of the first treatment condition and following each intervention phase. During the probe conditions, all 4 passages were tested to depict the difference between passages learned and passages not learned. Probe conditions were implemented in a 1:1 student/teacher arrangement with one 1-minute trial per reading passage. As in the screening phase, no feedback was given upon miscues, with the exception of the prompt to skip it after a 3 second hesitation or stumble. Students were given the same instructions as in all other conditions to sit up, pay attention, etc., and were given the same reinforcers of general praise, ticket, and showing of progress.
Word-Supply Procedures. In the word-supply treatment, the correct word for each miscue was supplied by the investigator, either immediately interrupting to correct if the participant continued reading without hesitation or after a 3-second wait if the student paused or made an attempt at the word. During the 3-seconds from the time the participant first attempted a word, self-corrections, or the student’s own correction of the error to the correct pronunciation of the word, were counted as correct. If the student did not read the word correctly within a 3-second time period, the investigator stated the word, prompted the student to repeat the word, and then instructed the student to begin again at the exact point where the error first occurred. E.g.: The word is ________. What word? Read again starting here (point to miscued word). To correct miscues for which the student did not pause and continued reading, the investigator immediately said, Stop, pointed to the miscued word, provided the word, and prompted for correction in the same manner as the 3-second pause error. (The word is ____. What word. Read again starting here [point].)
Phonics-Based Procedures. In the phonics-based treatment, the investigator prompted participants to sound-out any word in which a miscue was made, either immediately interrupting to correct if the participant continued reading without hesitation, or after a 3-second wait if the student pauses or makes an attempt at the word. During the 3-seconds from the time the participant first attempted a word, self-corrections, or the student’s own correction of the error to the correct pronunciation of the word, were counted as correct. If the student did not read the word correctly within a 3-second time period, the investigator prompted the participant to sound-out the word, paying attention to the beginning, middle, and/or end of the word depending on where the error(s) occurred: Sound it out-look at the beginning of that word. To correct miscues for which the student did not pause and continued reading, the investigator immediately said, Stop, pointed to the miscued word, and then continued with same instructions to sound out the word. For any type of error, if the student did not read the word correctly after initial instruction to sound it out, the investigator secured attention and modeled the sounds of the word, then prompted the student to say the word: Listen. /k/…/l/…/a/…/p/. What word? If the student did not read this word correctly after phonetic modeling, the investigator provided the word and prompted the student to begin reading exactly where he or she left off. It was only necessary to provide the word after phonetic cuing on two occasions for the same word Carter, a man’s name which proved difficult to pronounce for one participant. In both treatments, the oral reading fluency score was based on the original student miscue, regardless of whether the student made the correction after the investigator’s prompt. At the beginning of each session, students were told to sit up and do their best reading. Reinforcement schedules remained constant across conditions as verbal praise, one ticket
26

INTERNATIONAL JOURNAL OF SPECIAL EDUCATION Vol 24 No 1 2009
following appropriate behavior during passage reading, and progress shown. A probe phase followed each treatment condition, in which all 4 passages were probed.
Experimental Design and Dependent MeasuresA single subject parallel treatments design (Alberto & Troutman, 2008) was implemented in a modified format to test and compare the effectiveness of two feedback methods of error correction following oral reading miscues. Gast and Wolery (1988) define the design as a nested single subject experimental design that is a combination of two concurrently implemented multiple probe designs (1988, p. 270). The design evaluates experimental control by testing the two procedures on similar stimuli in a time-lagged fashion to show intervention affects across 2 different points in time. Each subject was taught 4 reading passages, 2 of which were assigned to each procedure. The experimental phases were presented in the following sequence: probe phase on all 4 passages; treatment phase to teach the first 2 passages (one taught with word-supply, one with phonics-based correction procedures); probe phase on all 4 passages after 5 sessions of each treatment condition; repeat sequence until all 4 passages were taught (2 repetitions of treatment phases and 3 probe phases). The current study was modified from Gast and Wolery’s (1988) description of the parallel treatments design in that this study is designed to include 2 intervention phases compared to the original 3 phases.
Reliability ProceduresInter-observer reliability for the oral reading fluency measures was collected by a practicum student who was assigned to the investigator’s classroom during the time of the study. The practicum student/observer was trained in the miscue coding system and was instructed to mark and tally errors of a passage on a separate copy of the reading passage at the same time the investigator was listening to the passage. While listening to the session, the observer recorded errors, took a total error tally, and calculated and recorded the student’s CWPM. The observer’s copy was the same as the investigator’s copy except for the addition of a specified area for the observer to calculate the reading rate and for the investigator to calculate the inter-observer agreement. Data collected by the investigator and observer for the sessions were compared specifically on the number of errors emitted using the point-by point method, whereby the number of agreements between errors recorded by the investigator and errors recorded by the observer were divided by the total number of agreements and disagreements, then multiplied by 100 to arrive at a percent of agreement between investigator and observer (Alberto & Troutman, 2008). Inter-observer reliability data was collected one time for each condition (one probe, one word-supply, and one phonics-based observation) across subjects. Inter-observer reliability scores ranged from 89% to 99% agreement with a mean of 96%.
Procedural reliability data was collected during one session per intervention condition (one word-supply session and one phonics-based session) by the same practicum student/ independent observer. The observer was provided with a checklist of investigator procedures that were expected to be followed and checked the occurrence or non-occurrence of the procedure while observing in the room during the intervention session. Procedures implemented correctly were tallied as occurrence, and any procedures implemented incorrectly or not implemented were tallied as non-occurrence on the checklist provided. Correctly implemented procedures were checked under a YES column, while incorrect or improperly implemented procedures were checked under a NO column for each procedure. Procedural reliability data was determined by dividing the number of procedures implemented correctly by the total number of procedures to be implemented and multiplied by 100 to arrive at a percentage of procedures correctly implemented by the investigator (Billingsley, White, & Munson, 1980). The percentage of agreement between observed procedures and expected procedures is reported for each intervention.
ResultsThe purpose of this study was to investigate whether the word-supply or phonics-based methods of error correction would increase the oral reading fluency of students with reading disabilities and whether one of these methods can be shown to be superior to the other in its effects on reading fluency. The sequence of conditions and the number of correct words read per minute for Tiara, Samantha, and Alana are shown in Figures 1, 2, and 3, respectively. The effectiveness of two interventions, word-supply and phonics-based were analyzed in two different ways. In the first comparison, mean scores of each treatment phase were subtracted by mean scores of the probe phase immediately preceding the treatment to show effects of the treatment when compared to the probe.
27

INTERNATIONAL JOURNAL OF SPECIAL EDUCATION Vol 24 No 1 2009
For the word-supply method, effect sizes for Tiara, Samantha, and Alana were 15.5, 24.5, and 23 CWPM, while in the phonics-based method, effect sizes for the three students’ fluency scores were 21, 4.5, and 16 CWPM, respectively. Tiara made a greater increase in fluency during the phonics-based feedback, while Samantha and Alana made greater gains during the word-supply feedback. The total across-phases gain for all word-supply interventions taught across students was 125 CWPM compared to 83 CWPM for the total phonics gains. It was noted that among all 12 passages taught across the three students, greater probe-to-intervention fluency gains occurred during in the first intervention phase for both phonics and word-supply methods, with the exception of Samantha, who made slightly greater fluency gains during the second phonics intervention phase (mean gain- 6 CWPM) than in the first phonics phase (mean gain-3 CWPM). One possible reason for this pattern may be that at approximately the same time that the study was entering the second intervention phase, the paraprofessional previously assigned to the reading class was reassigned to another class, which caused some change to the daily routine. This may have presented a distraction that resulted in lesser gains across both treatments and across students.
The second comparison of fluency scores was a within-treatments analysis. In this comparison, the fluency score obtained during the first session was subtracted from the fluency score of the last session in each intervention phase, resulting in a within-treatments gain score. Tiara showed superior gains during the phonics intervention for the first pair of reading passages (Word-Supply- 22 CWPM gain; Phonics-Based - 32 CWPM gain), but she showed superior gains during the word-supply intervention in the second pair (Word-Supply- 18 CWPM gain; Phonics-Based - 9 CWPM gain). Samantha and Alana showed superior gains during the word-supply interventions for both pairs of passages. Word-supply gains were 8 CWPM and 55 CWPM for pair 1 and 14 CWPM and 21 CWPM for pair 2 for Samantha and Alana respectively, while phonics gains were 5 CWPM and 30 CWPM for pair 1 and 8 CWPM and 14 CWPM, respectively. The total fluency gain score within all word-supply treatment phases taught across students was 138 CWPM, while the total within-treatment phonics gain was 100 CWPM. For Samantha and Alana, gain scores from both comparisons showed slightly higher scores for the word-supply treatment across pairs than for the phonics treatment. Results were mixed for Tiara, with higher phonics gains in pair 1 and higher word-supply gains in pair 2.
Figure 1Number of correct words per minute for Tiara across pairs of reading passages taught and word-
supply and phonics-based feedback
28

INTERNATIONAL JOURNAL OF SPECIAL EDUCATION Vol 24 No 1 2009
Figure 2Number of correct words per minute for Samantha across pairs of reading passages taught and
word-supply and phonics-based feedback
Figure 3Number of correct words per minute for Alana across pairs of reading passages taught and
word-supply and phonics-based feedback
DiscussionFindings from this study contribute to the limited body of evidence for the best method of correcting student miscues made during oral passage reading. Because oral reading is a common practice in classrooms for both instructional, assessment, and diagnostic purposes and because previous studies
29

INTERNATIONAL JOURNAL OF SPECIAL EDUCATION Vol 24 No 1 2009
have linked the ability to read fluently with the ability to comprehend what is read, it is imperative for teachers to utilize the most effective feedback procedure available for promoting reading fluency.
Results indicated that both the word-supply feedback and the phonics-based feedback methods of correcting errors during oral reading improve the reading rate for students with reading disabilities. However, the effects are minimal and appear to be difficult to distinguish from the affects that occurred during the probe sessions. When analyzing trend lines between probe phases and intervention phases, it was evident that fluency increases were occurring that were similar to the treatment effects. A possible reason is that the students were repeatedly reading the same passage, which may have served as an intervention in itself during the probe phases. Recent studies have shown repeated reading of the same passage has the potential to increase student’s oral reading fluency, even when used with no other feedback (O’Shea, Sindelar & O’Shea, 1985; Sindelar, Monda & O’Shea, 1990; Homan, Klesius, & Hite, 1993; Stoddard, Valcante, Sindelar, O’Shea & Algozzine, 1993; Strong, Wehby, Falk, & Lane, 2004; Valleley & Shriver, 2003; Vandenberg, Boon, Fore, & Bender, 2008).
Therefore, future studies of the effects of feedback methods on oral reading fluency might benefit from a design which incorporates the use of separate but equally difficult passages. Overall, findings suggest that while both the word-supply and phonics-based procedures showed increases in oral reading fluency, the word-supply method is slightly superior to the phonics-based approach.
LimitationsA major limitation to the study is the fact that only two feedback methods were employed. The study did not include a treatment condition designed to study the effects of meaning-based feedback, or feedback that prompts students to pay attention to how the word fits into the context of the sentence, on fluency. Nor did this study attempt to differentiate the type of feedback based on the type of error. All errors in this study were corrected, whether they changed the meaning of the passage or not and regardless of whether the miscue appeared to be phonemic, contextual, or visual in nature.
Future ResearchFurther research questions for feedback effects on oral reading fluency of students with disabilities should include the following:
1. Are meaning-based feedback procedures more effective than either word-supply or phonics-based feedback procedures for improving oral reading fluency?
2. Are certain feedback methods more effective at improving fluency than other methods for each specific type of error made during oral passage reading? Would it be better to utilize a range of feedback procedures, depending on the type of error made?
Considering the prevalence and necessity of oral reading for students with reading disabilities, these research questions are imperative for laying a broader empirical basis of procedures for correcting students’ errors toward promoting the essential skill of reading fluency.
ReferencesAlberto, P. A., & Troutman, A. C. (2008). Applied behavior analysis for teachers (8th ed.). Upper Saddle River, NJ: Pearson Education, Inc.Bos, C. S., & Vaughn, S. (2008). Strategies for teaching students with learning and behavioral problems (7th ed.). Boston: Allyn & Bacon.Billingsley, F., White, O.R., & Munson, R. (1980). Procedural reliability: A rationale and an example. Behavioral Assessment, 2, 229-241.Carnine, D., Silbert, J., & Kame'enui, E.J. (1997). Direct instruction reading (3rd ed.). Columbus, OH: Merrill.Chard, D.J., Vaughn, S, & Tyler, B. (2002). A synthesis of research on effective interventions for building reading fluency with elementary students with learning disabilities. Journal of Learning Disabilities, 35(5), 386-406.Crowe, L.K. (2003). Comparison of two reading feedback strategies in improving the oral and written language performance of children with language-learning disabilities. American Journal of Speech-Language Pathology, 12, 16-27.Crowe, L.K. (2005). Comparison of two oral reading feedback strategies in improving reading comprehension of school-age children with low reading ability. Remedial and Special Education, 26(1), 32-42.Engelmann, S., Meyer, L., Carnine, L., Becker, W., Eisele, J., & Johnson, G. (1999). Corrective reading program. Columbus, OH: SRA/McGraw-Hill.
30

INTERNATIONAL JOURNAL OF SPECIAL EDUCATION Vol 24 No 1 2009
Epstein, M. H., Kinder, D., & Barsuck, B. (1989). The academic status of adolescents with behavioral disorders. Behavioral Disorders, 14(3), 157-165.Fuchs, L.S., Fuchs, D., Hosp, M.K., & Jenkins, J.R., (2001). Oral reading fluency as an indicator of reading competence: A theoretical, empirical, and historical analysis. Scientific Studies Reading, 5(3), 239-256.Gast, D.L., and Wolery, M. (1988). Parallel treatments design: A nested single subject design for comparing instructional procedures. Education and Treatment of Children, 11(3), 270-285.Gersten, R., Fuchs, L.S., Williams, J.P., & Baker, S. (2001). Teaching reading comprehension strategies to students with learning disabilities: A review of research. Review of Educational Research, 71, 279-320.Hernandez, S.N. (1989). Effects of communicative reading strategies on the literacy behaviors of third grade poor readers. Unpublished doctoral dissertation, Louisiana State University, Baton Rouge.Heubusch, J.D., & Lloyd, J.W. (1998). Corrective feedback in oral reading. Journal of Behavioral Education, 8(1), 63-79.O’Shea, L. J., Sindelar, P. T., & O’Shea, D. J. (1985). The effects of repeated readings and attentional cues on reading fluency and comprehension. Journal of Reading Behavior, 17(2), 129-142.Mastropieri, M.A., & Scruggs, T. E. (1997). Best practices in promoting reading comprehension in students with learning disabilities. Remedial and Special Education, 18(4), 197-213.Mastropieri, M. A., Scruggs, T. E., Bakken, J. P., & Whedon, C. (1996). Reading comprehension: A synthesis of research in learning disabilities. In T. E. Scruggs & M. A. Mastropieri (Eds.), Advances in learning and behavioral disabilities: Intervention research (vol. 10, Part B, pp. 201-227). Greenwich, CT: JAI.Mastropieri, M., Scruggs, T., & Graetz, J. (2003). Reading comprehension instruction for secondary students: Challenges for struggling students and teachers. Learning Disability Quarterly, 26, 103-116.Mastropieri, M.A., Leinart, A., & Scruggs, T.E. (1999). Strategies to increase reading fluency. Intervention in School and Clinic, 34(5), 278-284.Pany, D., & McCoy, K.M. (1988). Effects of corrective feedback on word accuracy and reading comprehension of readers with learning disabilities. Journal of Learning Disabilities, 21(9), 546-550.Perkins, V.L., (1988). Feedback effects on oral reading errors of children with learning disabilities. Journal of Learning Disabilities, 21(4), 244-248.Reutzel, D.L., & Hollingsworth, P.M. (1993). Effects of fluency training on second graders’ reading comprehension. Journal of Educational Research, 86(6), 325-331.Rose, T.L., McEntire, E., & Dowdy, C. (1982). Effects of two error-correction procedures on oral reading. Learning Disability Quarterly, 5, 100-105.Sindelar, P. T., Monda, L. E., & O’Shea, L. J. (1990). Effects of repeated readings on instructional and mastery-level readers. Journal of Educational Research, 83(4), 220-226.Stoddard, K., Valcante, G., Sindelar, P., O’Shea, L., & Algozzine, B. (1993). Increasing reading rate and comprehension: The effects of repeated readings, sentence segmentation, and intonation training. Reading Research and Instruction, 32(4), 53-65.Strong, A., Wehby, J., Falk, K., & Lane, K. (2004). The impact of a structured reading curriculum and repeated reading on the performance of junior high students with emotional and behavioral disorders. School Psychology Review, 33(4), 561-581.Spaai, G. W., Ellermann, H. H., & Reitsma, P. (1991). Effects of segmented and whole-word sound feedback on learning to read single words. Journal of Educational Research, 84(4), 204-213.Talbott, E., Lloyd, J.W., & Tankersley, M. (1994). Effects of reading comprehension interventions with students with learning disabilities. Learning Disability Quarterly, 17, 223-232.Therrien, W. (2004). Fluency and comprehension gains as a result of repeated reading: A meta-analysis. Remedial and Special Education, 25(4), 252-261.Valleley, R. & Shriver, M. (2003). An examination of the effects of repeated readings with secondary students. Journal of Behavioral Education, 12(1), 55-76.Vandenberg, A., Boon, R., Fore, C., & Bender, W. (2008). The effects of repeated readings on the fluency and comprehension for high school students with learning disabilities. Learning Disabilities: A Multidisciplinary Journal, 15(1), 11-20.Vaughn, S., Levi, S., Coleman, M., & Bos, C.S. (2002). Reading instruction for students with LD and EBD: A synthesis of observation studies. Journal of Special Education, 36(4), 2-14.Wagner, M., Blackorby, J., & Hebbeler, K. (1993). Beyond the report card: The multiple dimensions of secondary school performance for students with disabilities. Menlo Park, CA:
31
INTERNATIONAL JOURNAL OF SPECIAL EDUCATION Vol 24 No 1 2009
ENHANCING THE PREPARATION OF SPECIAL EDUCATORS THROUGH SERVICE LEARNING:
EVIDENCE FROM TWO PRESERVICE COURSES
Jeanne NovakMary Murray
andAmy Scheuermann
Bowling Green State University
Erin CurranUniversity of St. Thomas
A challenge for teacher educators in special education is to impact the beliefs and attitudes of preservice teachers in ways that cultivate or strengthen dispositions and inform practice. This study investigated the impact of service-learning experiences on the development of professional dispositions by undergraduate students in two preservice special education courses. A constant comparative analysis of student focus-group transcripts and reflective journal entries uncovered two convergent themes. First, students in both courses developed a sense of professional efficacy. Secondly, students developed positive regard for the abilities of students with disabilities and the contributions of parents as partners in their children’s education. Recommendations are provided for designing service-learning experiences in ways that maximize the impact of the experiences on preservice teachers’ perceptions and attitudes toward working with students with disabilities and their families.
Historically, student teaching provided the sole opportunity for preservice candidates to practice and demonstrate teaching skills. Over the last 20 years, teacher educators have increasingly sought to enhance the learning of teacher candidates through multiple opportunities to apply what they have learned in real-world contexts. Today, preservice candidates can expect to have numerous field experiences prior to student teaching (Prater & Sileo, 2004).
A body of research evidence supports the benefits of field experiences in teacher preparation programs (Aiken & Day, 1999; McLoughlin & Maslak, 2003; Whitney, Golez, Nagel, & Nieto, 2002). For example, practicing skills learned in the classroom in relevant situations has been shown to increase the confidence of preservice teachers (Darling-Hammond, Chung, & Frelow, 2002). In addition, working directly with students gives preservice teachers an appreciation of student differences and diversity (McLoughlin & Maslak, 2003). In a survey study conducted by Washburn-Moses (2005), teachers of students with learning disabilities identified field experiences as the best way to prepare individuals to become special education teachers. Respondents both in the Washburn-Moses study and in another study of practicing teachers (Prater & Sileo, 2004) recommended that preservice special educators be given additional opportunities to apply firsthand what they learn in their university coursework.
A pedagogical approach touted to provide the benefits of traditional field experiences, plus added benefits such as increasing student social responsibility and addressing human and community needs, is service learning (Mayhew & Welch, 2001). The application of service learning has gained increasing momentum in higher education (Astin, Vogelgesang, Ikeda, & Yee, 2000; Eyler, Giles, & Braxton, 1997) and teacher preparation (Billig, 2000; Wade, 1995). Citing Boyer’s (1994) call for higher education to reestablish its commitment to service, Mayhew and Welch advocate the implementation and evaluation of service learning in special educator preparation programs. The authors draw a distinction between traditional field experiences and service learning. They contend that the focus of traditional field experiences is on the teacher candidate, who is closely supervised by an expert teacher as he or she practices the skills of the teaching profession. For the most part, the teacher candidate is perceived as the recipient of knowledge and skills and is the only beneficiary of the interaction. In
32

INTERNATIONAL JOURNAL OF SPECIAL EDUCATION Vol 24 No 1 2009
contrast, the focus of service learning is to provide reciprocal benefit to the teacher candidate and a community partner (Jacoby, 2003).
Research examining the application of service learning within special education teacher preparation programs is limited (Mayhew & Welch, 2001). A recent study conducted by Gonsier-Gerdin and Royce-Davis (2005) examined the development of advocacy and leadership skills by 15 preservice special educators participating in courses that included service-learning projects. Data were collected from field notes, written reflections, artifacts, course evaluations, follow-up interviews, and surveys. This data indicated that service learning influenced students’ awareness of social justice issues, confidence in leadership skills, commitment to advocacy and leadership roles, and professionalism.
In another study, Kamens, Dolyniuk, and Dinardo (2003) examined prospective teachers’ attitudes toward and knowledge of individuals with disabilities in a service-learning program in which 26 university students coached 17 high-school students with disabilities performing various jobs on campus. Several themes emerged from university student journals, instructor field notes, questionnaires, and course assignments. Students demonstrated an increased awareness of the public’s attitude toward and treatment of individuals with disabilities, an appreciation of the benefits of firsthand experiences, and awareness of the capabilities of individuals with disabilities as well as effective ways to teach and work with them. Kamens et al. summarized the impact of the service-learning project by stating, We discovered that integrating experience and service into a teacher preparation course enhanced reflection and the construction of new knowledge (pp. 116-117).
While varying definitions of service learning are currently found within the literature, Bringle and Hatcher's (1995) definition has been adopted by our university and will be applied in this article. They define service learning as follows:
[Service learning is] a credit-bearing educational experience in which students (a) participate in an organized service activity that meets identified community needs and (b) reflect on the service activity as a means of gaining a deeper understanding of course content, a broader appreciation of the discipline, and an enhanced sense of civic responsibility. (p. 112)
Regardless of the definition used, three common characteristics describe an authentic service-learning experience. First, the experience involves a reciprocal relationship that meets an identified need within the community. Secondly, academic content is integrated into the service experience. Finally, participants are encouraged to reflect and connect the experience and content to their personal perspectives.
The present study builds on past research by exploring the impact of incorporating service-learning experiences within two special education courses in a teacher preparation program at a mid-sized midwestern university. The two courses, Collaboration and Consultation with Colleagues and Families and Supported Employment, had previously followed a traditional lecture-and-discussion format with minimal interaction between university students and individuals with disabilities or their families. The three characteristics of service learning were integral to the redesign of both courses. These characteristics became objectives for course development. The first objective (establishing mutually beneficial partnerships) was met by collaborating with community agencies in the development and implementation of the service-learning experiences to ensure that both parties benefitted equally from the partnership. To effectively achieve the second objective (meaningfully connecting service-learning experiences to course goals), prospective teachers engaged in experiential learning closely tied to the subject matter of the courses (Munby & Hutchinson, 1998). The third objective (reflection and connection to personal perspectives) focused on the impact of the service-learning experience on the development of students’ professional dispositions when working with individuals with disabilities and their families.
Service learning as pedagogy offers the potential to affect the beliefs and attitudes of preservice special educators. Service learning has been linked to the development of several key dispositions among professional educators, including commitment to teaching, democratic values, caring, and sensitivity to student differences (American Association on Colleges for Teacher Education, 2002). Renzaglia, Hutchins, and Lee (1997) assert that it is teacher candidates’ beliefs and attitudes that will serve to inform professional practice and decision-making throughout their careers (p. 361). They go on to state, We, as teacher educators, have not been very successful in affecting preservice teachers’ beliefs and attitudes that establish dispositions and inform practice (p. 361).
33

INTERNATIONAL JOURNAL OF SPECIAL EDUCATION Vol 24 No 1 2009
In this study, we explored the impact of service-learning experiences on candidate dispositions. Multiple data sources (focus-group transcripts, written journal reflections, and course evaluations) were used to assess the role of service-learning experiences in cultivating students’ beliefs and attitudes toward individuals with disabilities and their parents. The remainder of this article will: (a) describe the service-learning courses, (b) detail the study method, (c) present the shared themes that emerged related to the development of professional dispositions, and (d) discuss common features of the courses that facilitated the preparation of preservice professionals.
Service-Learning Course DescriptionsEDIS 424: Collaboration and Consultation (Parent-Professional Partnerships)EDIS 424: Collaboration and Consultation is a one-semester course required by the university for undergraduate students seeking licensure in K-12 special education. Students typically take the course in their third year of the special education program just prior to taking education methods courses and student teaching. Because effective partnerships between parents and professionals can result in improved outcomes and enhanced quality of life for children with disabilities (Forlin & Hopewell, 2006), the main objective of the course is to equip preservice candidates with effective strategies for working with families and colleagues.
Preservice educators often express feeling ill-equipped to partner effectively with parents (Murray, Curran, & Zellers, 2008). This feeling may be due, in part, to the structure of traditional preservice education programs, which limits the interaction between students and parents to a one-time parent guest speaker or parent story (Epstein, 2005). However, recent research indicates that ongoing interactions with families over time improves the likelihood that preservice educators will develop family-centered dispositions and have positive interactions with parents in the future (Murray & Mandell, 2004).
A service-learning component (i.e., Parent-Professional Partnerships) was added to the Collaboration and Consultation course to benefit our preservice teachers as well as a community partner, a large urban developmental disabilities agency. The community partner identified a need for opportunities to train parents of children with disabilities at the same time our special education program was looking for ways to teach students strategies to effectively partner with parents of children with disabilities. It was determined that both the needs of our preservice teachers and the community partner could be addressed by training parents and preservice special educators together.
Seven parents of children with diverse disabilities and ethnicities were recruited to participate in the course. The parents agreed to attend all 16 three-hour class sessions held at the university. They were not, however, asked to complete the course assignments. Parents received a stipend for their weekly attendance and participation in classes to help defray transportation and childcare costs, but they did not receive credit for the class. One of the parents, a father of a child with a disability, agreed to co-facilitate the course with the university instructor in order to model effective parent-professional partnerships for students and parents.
Prior to the start of the course, the instructor met with the parent co-facilitator and the parent participants to orient them to the university. The parents provided input into the development of the course content and thus the development of the syllabus. The parent co-facilitator met with the university instructor weekly to plan the class content, activities, discussions, and assessments. During the weekly three-hour class periods, the co-facilitators led discussions on the content as it applied to case studies, student experiences, and parents’ real-life situations. The class was dynamic in nature with content changes made periodically throughout the semester in response to the co-facilitators’ reflections as well as input from the parents and students in the class.
There were two major assignments in this course that utilized service learning to assist in the development of partnership skills between students and parents. The first assignment, Virtual Family, was a longitudinal case study in which teams of five students and one parent birthed or adopted a virtual child with a given disability. The parent assigned to each group used his or her own child as the subject for the group’s virtual family project. Moreover, it was the parents who identified the topics and issues that the students would explore and respond to throughout the semester. These were the exact issues that the parents had encountered as their child aged. As the virtual child aged throughout the semester, each student was required to individually research the issues presented (e.g., medical, educational, and recreational) and develop an extensive plan for their child and family. The students
34

INTERNATIONAL JOURNAL OF SPECIAL EDUCATION Vol 24 No 1 2009
shared their plans with their team members, and then each team presented a compilation plan to the entire class. The parents shared their real-life experiences with their team members as well as with the full class throughout the virtual family project. Students and parents experienced partnerships firsthand by working together to raise their virtual child.
The second assignment, the Community Teaming Project, was a 30-minute small-group presentation conducted in a community setting for parents and professionals working with families of children with disabilities. The presentation topics were selected by student groups from a list of current and relevant information needs generated through a survey of parents and professionals in the community. The primary objective of these community training projects was to serve as a vehicle to help students learn the teaming process; secondarily, these projects were intended to provide needed training and information to families of children with disabilities and professionals in the local community. The community presentation projects were semi-structured and required students and parents to collaborate; share ideas, resources, and strategies; and meet both in class and outside of class throughout the semester.
The two assignments provided students and parents with opportunities to learn together, develop relationships, and experience parent-professional partnerships through class discussions as well as through the formal and informal group meetings required to complete assignments. The specific student competencies addressed in the service-learning experiences were as follows:
1. Understand family systems, family stress and coping, and social support.2. Be aware of the social, emotional, and economic issues facing family members when one
member of the family has a disability and how these issues change over the course of development (child and family).
3. Understand the influences of culture and diversity on families with children who have disabilities.
4. Understand the process of collaboration between professionals and families of individuals with disabilities.
In the end, the developmental disability agency met its goal of providing intensive training to seven parents of children with disabilities, and the university succeeded in giving preservice special educators authentic parent-professional partnership experiences.
EDIS 485: Supported Employment (Campus Works)EDIS 485: Supported Employment is a course designed to introduce students to the transition of youths with significant disabilities from school to the competitive workforce. University students enrolled in the semester-long course were primarily preservice educators or other students preparing for or considering careers in the disability field. Secondary special educators nationally report receiving little training on how to develop and implement vocational programs (Wolfe, Boone, & Blanchett, 1998), and they are often poorly prepared to deliver transition services (Knott & Asselin, 1999). Thus, a critical need for preservice teachers is to learn to implement work-based and other community-based transition programs (Anderson, et al., 2003; Johnson, Stodden, Emanuel, Luecking, & Mack, 2002).
Campus Works, the service-learning component of the course, is a partnership established between the university and a career-technical center serving high-school students from five surrounding counties. The partnership was developed to provide community-based training for youth with multiple disabilities while at the same time preparing preservice special educators and rehabilitation professionals to provide this training. Program activities were linked to learning outcomes for both the secondary and postsecondary students.
University students enrolled in the Supported Employment course served as job coaches to the high-school students at customized work experience sites on the university campus. The high-school students (hereafter referred to as trainees in order to distinguish them from the university students) worked two mornings per week for two-and-a-half hours in various departments across campus. The career interests and goals of each student trainee drove the selection of training sites. For example, a young man with a strong interest in art worked as a gallery assistant in the Fine Arts Center Galleries, where he prepared materials for art exhibitions. Another trainee with plans to pursue a career in law enforcement worked in the Parking and Traffic Office. Other campus worksites included the Student Recreation Center, the Office of Residence Life, and a residence hall.
35
INTERNATIONAL JOURNAL OF SPECIAL EDUCATION Vol 24 No 1 2009
The course consisted of two phases. The first phase was ten weeks of in-class instruction and learning activities intended to provide students with an overview of the conceptual, philosophical, and instructional foundations of supported employment and school-to-work transition. During this phase, students read the relevant literature, participated in discussions focused on current issues in the field, and were evaluated on their mastery of course content. The second phase of the course consisted of a five-week job-coaching component (i.e., service-learning experience). The job-coaching component of the course allowed students the opportunity to observe real-world practices, apply the skills and competencies gained through class lecture and discussion, and implement best practices in transition and supported employment. Specifically, students were required to demonstrate the following skills:
1. Apply person-centered career assessment and planning techniques.2. Analyze job requirements and develop appropriate workplace accommodations.3. Provide job skills instruction and social skills training.4. Develop and apply positive behavior supports.5. Identify and facilitate the use of environmental and coworker/employer supports occurring
naturally in the workplace.6. Display appropriate public relationships and create and maintain a positive rapport with
student trainees and worksite personnel.
University students worked in pairs to provide job coaching and support to trainees. Each student coached one morning per week, which required the two coaches to coordinate their schedules and share information about trainee progress. Each day a coach was present at the training site, he or she completed: (a) an objective daily progress log, (b) a reflective journal entry, (c) a task analysis data recording form, and (d) a work-related competencies evaluation form. Student pairs worked together to complete a job analysis and summative work experience report that synthesized assessment data collected on a trainee over the course of the work experience.
An essential component of the course was the connections students made between their job-coaching experiences and the academic content of the course. These connections were established through reflective journaling as well as in-class and online group discussions about job-coaching experiences. Students submitted a weekly journal of job-coaching activities and learning experiences. During class discussion, students often presented examples from their job-coaching experiences to illustrate or clarify points made in the readings or to seek assistance in resolving a training issue they experienced at the jobsite.
In sum, Campus Works was designed to meet the needs of all program partners and participants—the university students, the high-school student trainees, and the campus community. University students gained practical job-coaching experience. High-school trainees received training in employability skills and specific job skills, and they gained authentic work experience to assist them in making informed decisions regarding future career paths. Finally, the campus community benefited from exposure to, and interaction with, youths with disabilities performing meaningful work roles. A banquet held at the conclusion of the work experience recognized the contributions of worksite supervisors and celebrated the successes of the participating students.
MethodParticipantsStudy participants were drawn from the 25 students enrolled in the Collaboration and Consultation course and the 15 students enrolled in the Supported Employment course. All students in the Collaboration and Consultation course were preservice teachers while the Supported Employment course consisted of six preservice teachers, five preservice rehabilitation professionals, three psychology students, and one business student. The Collaboration and Consultation instructor requested the participation of students who felt they could commit to both pre- and post-intervention discussions; nine students volunteered. Participants in both courses reported having limited experiences working with individuals with disabilities and their parents. The majority of study participants were female (87.5%) and Caucasian (87.5%). A small number of participants comprised the following ethnicities: Hispanic (4.2%), African American (4.2%), and Asian/Pacific Islander (4.2%). All participants were between the ages of 19 and 25, and all were in the last two years of their programs.
Research DesignThis qualitative study employed a phenomenological research design in order to understand the meaning students made of their experiential service-learning opportunities in two special education
36

INTERNATIONAL JOURNAL OF SPECIAL EDUCATION Vol 24 No 1 2009
courses. Specifically, we examined the impact of the students’ experiences on their beliefs and attitudes toward individuals with intellectual disabilities and their families. Data collection methods included focus-group dialogue and student-composed reflective journals.
Data CollectionFor the Collaboration and Consultation course, focus groups were conducted during the first and last weeks of the semester to solicit students’ perspectives about how embedding parents in the course impacted their competencies and dispositions regarding parent-professional partnerships. The first focus-group discussion lasted one and one half hours, and the second lasted two hours. A qualitative researcher unassociated with the course led both focus-group discussions; the professor who taught the course was not present at either focus group. Pre-intervention focus-group questions included the following:
1. Do you think there are differences in the expectations of parents and professionals in parent-professional partnerships?
2. Can you identify (and discuss) one positive experience you’ve had working with parents of children with special needs?
3. Can you identify (and discuss) one negative experience you’ve had working with parents of children with special needs?
Questions utilized in the post-intervention focus group included the following: 1. Before this class, how did you feel about working with parents and families of children with
special needs? 2. Was there a specific time or incident when you could tell that your views about working with
parents and families had changed? 3. Overall, what are you going to take from this class?
Focus-group discussions were transcribed from audio recordings to facilitate the reliability and validity of data analysis and interpretation.
For the Supported Employment course, students were required to prepare weekly journals reflecting on their job-coaching experiences. Students were instructed to include in each journal entry a discussion of their student trainee’s progress, a description of experiences viewed as successful and unsuccessful, reflections about what they observed, and questions for the instructor. At the end of the semester, students were asked to provide their overall reflections on the course, particularly their reflections related to the service-learning component of the course. Two questions guided student reflections:
1. What aspects of the course or work experience did you find most useful?2. What changes would you suggest be made to the course or Campus Works?
All journal entries were submitted to the instructor through the Blackboard online course management system. In total, 62 journal entries were posted, with an average post length of one-half page. Entries were later downloaded into a word-processing program in order to be analyzed.
Data AnalysisThe data analyzed for this study were the pre- and post-intervention focus-group transcripts from the Collaboration and Consultation course and the weekly reflective journals from students in the Supported Employment course. Content analysis was employed with the data from both courses, allowing researchers to examine the development of professional dispositions by students working with individuals with disabilities and their parents. For both courses, the primary research question was as follows: What impact do service-learning experiences (e.g., parent partnerships and job coaching) have upon the development of professional dispositions by preservice special educators?
Systematic data analysis followed a constant comparative analysis procedure (Corbin & Stauss, 2008). To establish a general sense of the data, transcripts of the focus-group discussions and the reflective journals were separately read multiple times by the authors. A researcher unassociated with data collection then read both data sets. The researchers independently generated codes to unitize and categorize the data. The independent analyses were then shared and discussed by all readers, who together then identified shared similarities and differences in coding and categorization (Patton, 1990). From the shared categories, patterns related to student development of professional dispositions were identified, and overall assertions that tied together the patterns found in the data were developed. The patterns, categories, and assertions generated from each focus group and the reflective journals were then compared to identify changes in student dispositions from before to after the service-learning experiences.Results
37

INTERNATIONAL JOURNAL OF SPECIAL EDUCATION Vol 24 No 1 2009
Two emergent themes were particularly strong and consistent across both courses. Both service-learning experiences imparted to preservice teachers (a) a greater sense of professional efficacy and (b) positive regard for the abilities of students with disabilities and the contributions of parents as partners in their children’s education.
Theme 1: Professional Preparedness and EfficacyParent-Professional Partnerships: From judgment to empathy. During the pre-intervention focus group, preservice teachers in the Collaboration and Consultation course reported that they had minimal experience working with parents of children with disabilities predominately through volunteerism or work with summer camps and day-care facilities for children and adults with significant disabilities. Even though they had few experiences upon which to base their beliefs and dispositions, students initially appeared to hold pessimistic and often contradictory attitudes toward families of children with disabilities. On the one hand, students indicated that parents were uninvolved and uncaring. One student stated, There were parents who you could tell did not care. Another student echoed this sentiment: There were a lot of parents who weren’t involved at all, that I never saw. And I know, talking to the teacher, they have a lot of problems with parent involvement. A final student went on to say, They [parents] make excuses and place blame somewhere else.
On the other hand, several students indicated that parents can be overly involved, almost enabling, in the care of their children. One student stated, Parents don’t know when to step back. They don’t know when to let go. Another student affirmed, The parents treat them [children with disabilities] like babies from the time they’re born until the time they’re done raising them. These children are treated like everything is done for them.
The contradictions found within the discussion from the first focus group indicate that while students were not certain whether parents of children with disabilities are over-involved or under-involved in their children’s education, they perceived parental involvement negatively. Either way, the actions of parents were interpreted by the preservice educators as barriers to the education and development of their children.
Student comments during the post-intervention focus group signified an empathic shift in students’ interpretations of parental roles and responsibilities in the partnership dynamic. One student stated, I didn’t feel like I was insensitive before the class started, but I feel like the class has made me more sensitive. Another student echoed this statement by saying; It just made me more sensitive to the fact that I’m going to be dealing with parents. I needed to be thinking about this in a more professional sense. Analogous comments by focus-group participants underscored the difficulties parents face: That [an individualized education plan meeting with professionals] is terrifying, probably, for a parent, and then they’re not going to be able to think of anything at the time because they feel so intimidated and I know I’m not going to judge families anymore.
Through the development of empathy for the parents of children with disabilities, students began to understand the dynamic and didactic nature of parent-professional partnerships. Many students came to the realization that their own attitudes, beliefs, and practices play a critical role in forging effective partnerships. One student disclosed, This is the first time that I’ve sat down with multiple parents to see their frustration working with teachers. I actually get to see both sides of the story now that I’ve had this class. Yet another student learned what it is like to walk in the shoes of a parent of a child with a disability. She stated:
You have to be sensitive to the fact that, if this did happen to me and I did have a child with a disability, I would want the teacher of my son or daughter to put as much effort as they could into it. I think it [this class] just gave me a new view of how to approach things as a teacher.
Campus Works: From apprehensiveness to confidence. Despite ten weeks of classroom instruction on supported employment and strategies for supporting individuals with disabilities in community jobs, students in the Supported Employment course voiced apprehension about their ability to provide one-on-one support to high-school trainees with multiple disabilities at their campus work experience sites. What if? questions became more frequent as the first day of job coaching approached. Students wanted to be prepared for every possible contingency. By the end of the semester, students’ initial lack of confidence was replaced by a real sense of efficacy regarding their ability to provide effective instruction and support to the high-school students. For example, one student stated,
38

INTERNATIONAL JOURNAL OF SPECIAL EDUCATION Vol 24 No 1 2009
At first I was very nervous and extremely afraid that I would not be useful because I did not have any experience or that I would be uncomfortable in the situation. To my surprise, neither predicament came true! … Before I was actually on the site, I thought that I would treat [the student trainee] differently by trying to not treat her differently. This did not happen either; I treated her as a person.
For another student, recognizing that the high-school trainee was likely experiencing similar feelings of apprehension helped her overcome her own nervousness. Following the first day of job coaching, she made the following journal entry: I was really nervous about starting job coaching. Once I met [the student trainee], I calmed a little. He was really friendly. He seemed a little shy or nervous too.
Students indicated that they intended to apply the knowledge and skills they gained through the job-coaching experience to their future career roles. A preservice teacher reflected on several ways in which the course helped her prepare to become a special educator:
It has giving [sic] me a chance to collaborate and network with peers and the community. It made me think! This experience made me use the knowledge that I have gained through other classes…. Most importantly, it gave me a chance to work with people with disabilities.
Another student shared,The actual hands-on experience of the class is definitely something that puts it one step ahead of most other college courses. It was great to learn about a job and then actually be able to apply all that was learned within the same semester.
Such comments illustrate students’ recognition of the value of service-learning experiences in preparing them to work with students with disabilities.
The hands-on application enriched the learning experience not only of students pursuing careers in special education but also of students preparing for careers in general education. The reflections of a preservice general education teacher highlight the impact that even a brief service-learning experience can have on educators who will likely have students with disabilities in their classrooms someday:
This course has been especially beneficial to me, as an education major and future teacher, because it has provided me with the only real opportunity I’ve ever had to interact with, teach, and learn from individuals with disabilities…. I wasn’t entirely sure how I would feel working with someone with a disability, if I was prepared enough, or if I would know how to approach the situation in the best possible way. Now, because of the experience component of job coaching I know that when I have a student with a disability in my own classroom someday, I won’t be afraid to learn from them and to teach them.
Theme 2: Positive Regard and High ExpectationsParent-Professional Partnerships: From service recipients to partners. Students in the pre-intervention focus group perceived parents as subordinate in a hierarchical relationship with teachers. One student stated, I think sometimes parents just need to stop and listen to the teacher a little bit more. This quotation reinforces the notion that teachers know best and that parents should defer to the expertise of teachers. The students in the pre-intervention focus group perceived parents as having other priorities that superseded their concern for their children’s education. One student stated, I have a parent who is more concerned with her daughter’s clothes being dirty than with meeting the [IEP] goals. Yet another student described parents’ interest in their children’s educational progress this way: I don’t want to say they don’t care, but it seems like they are so nonchalant about it. It is not their top priority. This preservice teacher did not understand that parents set their priorities based on a number of factors that may not involve school or the child’s education. Another student described a family as not wanting to help their child. This again indicates difficulty assimilating another individual’s perspective and determining why parents may appear to be unable or unwilling to help their children. Post-focus-group comments indicated that students came to see parents as competent members of the partnership. Parents went from being viewed as simply recipients of services to contributing members of the educational team. In contrast to the pre-focus group when students stated that parents were uninterested, a student in the post-focus group stated, I think sometimes that parents just want what’s best for their kids. They want the best of the best of the best. Another student realized through the class that they [parents] know a lot, while another student was surprised that they [parents] do research too. Students’ views had changed. Parents were now looked at as caring, competent individuals, and many students no longer felt that they were the professionals in a hierarchical relationship with parents.
39

INTERNATIONAL JOURNAL OF SPECIAL EDUCATION Vol 24 No 1 2009
The concept of a partnership was evident when one student stated, Nobody knows their child better than the parent. Another student felt that having the parents’ perspectives in class helped them see parents as partners. This student stated, I actually get to see both sides of the story now that I’ve had this class. Another student’s eyes were opened to the importance of working with parents: I think I just realized how much more important working with parents is. Trust and honesty, tenants of an effective partnership, were realized by one student, who said, It was good to realize that the more honest you are between teacher and parent, or vice versa, either way, the more trustworthy everyone’s going to be towards you.
Students mentioned equality or parity, a critical component of an effective relationship. Comments included, During this class, we learned mostly to listen to what the parents want to say about their kids and pretty much to be equal with other professionals and You just have to make yourself an equal. Another student clearly defined the partnership by stating, It’s like you both have to lean on each other a little bit. This statement indicates that the student sees parents as a contributing member of the team. There is both a give and take to the parent-professional relationship; for many students, this relationship was no longer one-sided but now a partnership.
Campus Works: From disabled to able. The Campus Works service-learning experience gave university students in the Supported Employment course a window into the lives of persons with significant disabilities that is seldom afforded in lecture courses. It enabled them to see beyond the trainees’ labels and functional limitations to see their strengths, individuality, and personhood. Although students acknowledged the functional limitations and support needs of the high-school trainees, their descriptions of the trainees were framed predominantly in terms of personal strengths, interests, and abilities.
All of the high-school trainees had multiple disabilities. The list of their disability labels read much like the table of contents in an introductory special education textbook: mental retardation, physical disabilities, emotional and behavioral disorders, attention-deficit/hyperactivity disorder, autism, Tourette’s syndrome, and Down syndrome. Despite this fact, university students did not use disability labels when discussing the trainees with whom they worked. Instead, they described trainees as perceptive and imaginative; very smart; kind and upbeat; able to adjust to problems; self-aware; and not afraid to ask questions, learn something new, or to talk with people.
Students may have focused on the positive attributes of trainees, in part, because the attributes they observed at the job sites stood in stark contrast to their initial expectations of the trainees’ abilities. Over the course of the semester, students learned that the trainees were more capable than they had initially expected. This newfound confidence in trainees’ abilities manifested itself in higher expectations of the trainees’ future careers and quality-of-life potential. In support of this interpretation are comments such as, I now know that [the student trainee] is capable of much more than I expected and I know they have more capabilities and should have more opportunities than the average citizen thinks is possible. Further support is provided by an entry in the journal of a third student:
She even talked to me today about her disability. She said that sometimes people couldn’t understand her because she mumbles her words. She seems to be very self-aware and knows her limitations yet push herself all the way to those limits. I become more confident that [the student trainee] will make it on her own with every day I spend with her.
Two other students discussed the importance of maintaining high expectations. Observing youth with significant disabilities performing valuable work roles led one student who worked in a group home to reexamine his expectations regarding the abilities of the individuals with whom he worked in the group home. He described the impact of the service-learning experience this way:
I found it very informative to work with the same population in a different setting. I know a lot of the time at the home we try to do a lot of things for them, but this program made me realize that people with disabilities are a lot more independent than what I originally thought. I think this course would be a great learning experience for anyone who is thinking about working with people with disabilities.
Another student entered these concluding remarks in her journal:I believe I learned a lot this semester, and I know [the student trainee] taught me a lot about putting faith into what people are capable of. I hope that [she] learned a lot also and that I had something to do with that.
40

INTERNATIONAL JOURNAL OF SPECIAL EDUCATION Vol 24 No 1 2009
This student’s reflections typify the essence of the mutually beneficial relationships that Campus Works was designed to create.
Discussion and ImplicationsDespite independent design, implementation, and evaluation of the service-learning experiences in the two courses, the resulting changes in the perceptions and attitudes of preservice teachers bore striking similarities. Several common aspects of the service-learning experiences contributed directly to students’ development of a sense of professional efficacy and positive regard for the abilities of students with disabilities and the contributions of their parents. The keys to the development of professional dispositions and other course features central to the success of the projects are discussed in the paragraphs that follow. These include addressing student misconceptions; promoting active student participation; matching program participants; and providing opportunities for collaboration, first-hand experience, and reflection.
Identifying and Challenging Student MisconceptionsPrior to the service-learning experiences, students in both courses had misconceptions about working with individuals with disabilities and their parents. Misconceptions included the idea that parents of children with disabilities do not care about their children or their children’s outcomes and the idea that individuals with disabilities are not capable of successfully working within the community. In designing the courses, the instructors recognized these potential misconceptions and designed the service-learning activities to challenge them. Following the service-learning experiences, students no longer voiced their initial misconceptions. And, in fact, rather than saying that parents were uncaring, students in the Collaboration and Consultation course recognized that parents had priorities that were different from their own as instructors. Similarly, students in the Supported Employment course indicated that the high-school trainees with multiple disabilities were far more capable than they had originally anticipated. This suggests that students, through interactions with individuals with disabilities and their parents, discovered that their initial perceptions of these two groups were inaccurate.
Student Control of the Service-learning ExperienceSeifer and Connors (2007) have indicated that students are more likely to achieve the learning goals of a service-learning course if they have substantial input into the design and implementation of their service-learning experiences. When students are in charge of their own learning experiences, they gain a sense of empowerment that often translates into more significant changes in attitudes and perceptions. At the beginning of the semester, instructors of both courses provided students with a working syllabus that laid out the basic service-learning activities planned for the semester. These syllabi were, however, dynamic documents that evolved as the courses unfolded.
When determining topics for the community presentations, groups in the Collaboration and Consultation course were encouraged to choose topics that utilized the unique expertise of individual parents (e.g., person-centered planning, fetal alcohol syndrome). In the Supported Employment course, both high school and university students had input into the selection of job coach-student trainee pairs. Additionally, students shared primary responsibility for developing worksite training plans, building the agenda for the Campus Works orientation meetings, and planning the semester-end banquet.
Matching Program Participants for Maximum Mutual BenefitCareful consideration was given to matching students with members of the community in ways that were intended to provide members of both groups with opportunities to develop meaningful, mutually beneficial relationships. In assigning the parent-professional partnerships, instructors took into account students’ ages, races and ethnicities, geographic locations, and prior experiences with individuals with disabilities. For example, a student who had a sibling with autism was paired with a parent who had a child with autism. Similarly, effort was made to pair students with a parent of the same ethnicity.
In Campus Works, job coaches were matched with student trainees based upon the rapport observed during an initial icebreaker activity. Students with similar hobbies, interests, and interaction styles tended to show genuine interest in getting to know one another. Following the icebreaker, all participants were asked to list those with whom they wished to work. Stated preferences were given considerable weight in the matching process as were the past experiences and skill sets of individual participants. For example, a young man from the career-technical center who loved sports completed his work experience at the student recreation center. Speech impairments made it difficult for others to
41

INTERNATIONAL JOURNAL OF SPECIAL EDUCATION Vol 24 No 1 2009
understand the student’s speech upon initially meeting him, and he was very quiet around new people and in new situations. One of the student’s IEP goals was to initiate conversations. He was paired with a job coach who was a member of the university football team. Within a short time, and with a little encouragement from his job coach, the student began discussing the latest sporting events with employees and patrons of the recreation center.
Opportunities for Collaboration and Teaming Effective special educators exhibit a high level of skill in collaboration and teaming (Friend & Cook, 2007). The service-learning experiences embedded into the Collaboration and Consultation and Supported Employment courses afforded students ongoing opportunities to practice these essential skills. Students in the Collaboration and Consultation course teamed with a parent and several other preservice teachers to prepare their community presentations. They also worked closely with community agencies to organize and publicize the symposium. Collaboration between parents and professionals is a win-win situation for educators, children, and families alike (Epstein & Sanders, 2006).
Students in the Supported Employment course were required to work closely with student trainees and to collaborate effectively with other job coaches to monitor trainee progress. In addition, expectations for developing and maintaining positive relationships with worksite personnel were reinforced through course readings and class discussion. The research evidence supports the powerful effects on learning that result from processing the service-learning experiences with others (Astin et al., 2000).
Firsthand Experience with Students with Disabilities and Their ParentsIn both service-learning projects, students had opportunities to interact in meaningful ways with individuals with disabilities or their parents. This interaction instilled in students a deeper understanding and more positive outlook about working with individuals with disabilities and their families. In the Collaboration and Consultation course, students initially voiced a lack of confidence in their abilities to work with parents of children with disabilities, often stating, I’m not sure. At the end of the service-learning experience, students exuded a newfound confidence in themselves and in their abilities to effectively collaborate with families of children with disabilities. Students indicated that this confidence was due to their multiple opportunities to interact with parents throughout the course. Students in the Supported Employment course echoed this increase in skills, knowledge, and confidence. These students also began with a feeling of uneasiness and a lack of confidence about working with individuals with intellectual disabilities. However, through their extended interactions with the trainees at their campus worksites, students grew personally and professionally.
Student Reflection on PracticeBoth courses utilized reflection as a central component of the service-learning experience. This focus is consistent with research evidence demonstrating the power of reflection to connect service experiences to the academic content of a course (Astin et al., 2000; Eyler & Giles, 1999). In the Collaboration and Consultation course, at least 20 minutes of each class period were devoted to discussing issues and processing course content together with parents. Case studies and journaling were also utilized as methods for encouraging reflection on practice. In the Supported Employment course, the challenges of providing effective supports in real-world settings were discussed in class and through online journaling. Having students work in job-coach pairs allowed structured opportunities for students to reflect together upon the perceptions of worksite personnel and on the progress of individual student trainees.
ConclusionsThe purpose of this study was to examine the impact of service-learning experiences in two preservice special education courses on the development of professional dispositions by preservice teachers. The positive learning outcomes achieved by students in both courses attest to the value of incorporating service-learning experiences into teacher education programs. While this study provides insight into the value of implementing service-learning activities within special education programs, several limitations must be mentioned. This study is limited by its reliance on self-report data (e.g., focus groups and journals) as well as it small sample size. Therefore, caution must be used when generalizing the results beyond the particular courses, instructors, and students involved in the service-learning projects presented. Follow-up studies with additional preservice students in other teacher education programs are warranted.
42

INTERNATIONAL JOURNAL OF SPECIAL EDUCATION Vol 24 No 1 2009
As recommended by Mayhew and Welch (2001), the evaluation of service-learning courses should involve multiple measures of effectiveness. While this study evaluated the impact of service-learning activities on dispositions, the researchers did not directly assess students’ development of the knowledge and skills required of professional educators. To thoroughly investigate the impact of service-learning experiences on the knowledge and skills of preservice special educators, additional studies involving multiple data sources need to be undertaken. Additionally, this study was conducted in individual classes over the course of a single semester. The efficacy of service-learning experiences would be further illuminated by longitudinal studies of student dispositions throughout their preservice program as well as following their entry into the teaching profession.
The findings of this study are consistent with those reported in the service-learning literature (Astin et al., 2000) and provide additional insights into the value and process of incorporating service-learning experiences into preservice special educator programs. As seen in this study, service-learning experiences serve as rich opportunities through which teacher candidates can develop a sense of professional efficacy and a focus on the abilities of students with disabilities and the positive contributions of their parents.
References Aiken, I. P., & Day, B. D. (1999). Early field experiences in preservice teacher education: Research and student perspectives. Action in Teacher Education, 21(3), 7-12.American Association of Colleges of Teacher Education (AACTE). (2002). Second in a series of professional issues briefs: Meeting NCATE standards through service-learning: Dispositions. Washington, DC: Author. Anderson, D., Kleinhammer-Tramill, P. J., Morningstar, M. E., Lehman, J., Bassett, D., Kohler, P., et al. (2003). What’s happening in personnel preparation in transition? A national survey. Career Development for Exceptional Individuals, 26, 145-160.Astin, A. W., Vogelgesang, L. J., Ikeda, E. K., & Yee, J. A. (2000). How service learning affects students: Executive summary. Los Angeles, CA: Higher Education Research Institute, UCLA. Retrieved January 24, 2008, from http://www.gseis.ucla.edu/heri/pdfs/rhowas.pdfBillig, S. H. (2000). The effects of service learning. The School Administrator, 57(7), 14-18.Boyer, E. L. (1994, March 9). Creating the new American college. The Chronicle of Higher Education, A48.Bringle, R. G., & Hatcher, J. A. (1995). A service-learning curriculum for faculty. Michigan Journal of Community Service Learning, 2, 112-122.Corbin, J., & Strauss, A. (2008). Basics of qualitative research. Thousand Oaks, CA: Sage.Darling-Hammond, L., Chung, R., & Frelow, F. (2002). Variation in teacher preparation: How well do different pathways prepare teachers to teach? Journal of Teacher Education, 53, 286-302.Epstein, J. L. (2005). Links in a professional development chain: Preservice and inservice education for effective programs of school, family, and community partnerships. The New Educator, 1(2), 124-141.Epstein, J. L., & Sanders, M. G., (2006). Prospects for change: Preparing educators for school, family, and community partnerships. Peabody Journal of Education, 81(2), 81-120.Eyler, J., & D. E. Giles, J. (1999). Where's the learning in service-learning? San Francisco: Jossey-Bass.Eyler, J., Giles, D. E., Jr., & Braxton, J. (1997). The impact of service-learning on college students. Michigan Journal of Community Service-Learning. 4, 5-15.Fiske, E. B. (2001). Learning in deed. The power of service-learning for American schools. Battle Creek, MI: W.K. Kellogg Foundation. (ERIC Document Reproduction Service No. ED465829)Forlin, C., & Hopewell, T. (2006). Inclusion – the heart of the matter: Trainee teachers’ perceptions of a parent’s journey. British Journal of Special Education, 33(2), 55-61.Friend, M., & Cook, L. (2007). Interactions: Collaboration skills for school professionals (5th ed.). Boston: Allyn and Bacon.Gonsier-Gerdin, J., & Royce-Davis, J. (2005). Developing advocates and leaders through service-learning in preservice and inservice special education programs. In S. Root, J. Callahan, & S. H. Billig (Eds.), Improving service-learning practice: Research on models to enhance impacts (pp. 37-57). Greenwich, CT: Information Age Publishing.Jacoby, B. & Associates (2003). Fundamentals of service-learning partnerships. In B. Jacoby & Associates (Eds.), Building partnerships for service-learning (pp. 1-19). San Francisco: Jossey–Bass.Johnson, D. R., Stodden, R. A., Emanuel, E. J., Luecking, R., & Mack, M. (2002). Current challenges facing secondary education and transition services: What research tells us. Exceptional Children, 68, 519-531.
43
INTERNATIONAL JOURNAL OF SPECIAL EDUCATION Vol 24 No 1 2009
Knott, L., & Asselin, S. B. (1999). Transition competencies: Perception of secondary special education teachers. Teacher Education and Special Education, 22, 55-65.Kamens, M.W., Dolyniuk, C. A., & Dinardo, P. (2003). Preparing teachers for the transition of students with disabilities through community-based instruction. Career Development for Exceptional Individuals, 26, 99-118.Mayhew, J., & Welch, M. (2001). A call to service: Service-learning as a pedagogy in special education programs. Teacher Education and Special Education, 24, 208-219.McLoughlin, A. S., & Maslak, M. A. (2003). Prospective teachers' perspectives of development during fieldwork. Tutoring as a vehicle for professional growth. The Teacher Educator, 38, 267-284.Munby, H., & Hutchinson, N. (1998). Using experience to prepare teachers for inclusive classrooms: Teacher education and the epistemology of practice. Teacher Education and Special Education, 21(2), 75-82.Murray, M., Curran, E. & Zellers, D. (2008). Building parent/professional partnerships: An innovative approach for teacher education. The Teacher Educator, 43(2), 87-108. Murray, M. M. & Mandell, C. J. (2004). Evaluation of a family-centered early childhood special education preservice model by program graduates. Topics in Early Childhood Special Education, 24(4), 238-249. Patton, M. Q. (1990). Qualitative evaluation and research methods. Thousand Oaks, CA: Sage.Prater, M. A., & Sileo, T. W. (2004). Fieldwork requirements in special education preparation: A national study. Teacher Education and Special Education, 27, 251-263.Renzaglia, A., Hutchins, M., & Lee, S. (1997). The impact of teacher education on the beliefs, attitudes, and dispositions of preservice special educators. Teacher Education and Special Education, 20(4), 360-377.Seifer, S. D., & Connors K. (Eds.). (2007). Community campus partnerships for health: Faculty toolkit for service-learning in higher education. Scotts Valley, CA: National Service-Learning Clearinghouse.Wade, R. (1995). Developing active citizens: Community service learning in social studies teacher education. Social Studies, 86, 122-128.Washburn-Moses, L. (2005). Preparing special educators for secondary positions. Action in Teacher Education, 27(3), 26-39. Whitney, L., Golez, F., Nagel, G., & Nieto, C. (2002). Listening to the voices of practicing teachers to examine the effectiveness of a teacher education program. Action in Teacher Education, 23(4), 69-76. Wolfe, P. S., Boone, R. S., & Blanchett, W. J. (1998). Regular and special educators’ perceptions of transition competencies. Career Development for Exceptional Individuals, 21, 87-106
44

INTERNATIONAL JOURNAL OF SPECIAL EDUCATION Vol 24 No 1 2009
A LONGITUDINAL EXAMINATION OF THE REMEDIATION OF LEARNING DISABILITIES:
IQ, AGE AT DIAGNOSIS, SCHOOL SES AND VOLUNTARY TRANSFER
Brian Vandenbergand
Debra EmeryUniversity of Missouri – St. Louis
This three year longitudinal study examined the effects of IQ, age of diagnosis, school socioeconomic status (SES) and participation in desegregation programs on the remediation of learning disabilities. Participants included 176 children who were diagnosed with a learning disability, 44 of whom were participants in a voluntary transfer program. Baseline discrepancies between standardized cognitive and achievement scores were obtained at the time of the initial learning disability diagnosis. The effect of remediation was measured at a three-year re-evaluation period. Results indicated that IQ and age at diagnosis were significant predictors of remedial success, while school SES and transfer status were not. Students with higher IQ scores, who were identified at an earlier age, showed greater remedial gains. The results underscore the importance of early identification and suggest more intensive services and follow-up be given to children with lower IQ.
The remediation of learning disabilities (LD) is a large scale, national undertaking aimed at improving the educational opportunities of millions of children. Identifying factors associated with remediation outcome, then, is of utmost importance. Most research examining this issue consists of controlled studies of specific treatments, conducted within a single school or district, with children who reside in the district, and outcomes are assessed after a relatively a short period of time. This study, in contrast, examined the role of individual factors, school district resources, and student transfer status in a three year longitudinal follow-up, and remediation outcome was assessed within the real world context of the children’s school.
Children with learning disabilities are an at-risk population; they are more likely to experience lower self-esteem, make fewer friends, and are one and one half times more likely to drop out of school than non-disabled children, and adults with LD are more apt to experience unemployment difficulties (American Psychiatric Association, 2000). Not all individuals with learning disabilities, however, suffer such adverse outcomes, as some graduate from high school and college and establish successful careers (Osborne, Schulte & McKinney, 1991; Raskind et al., 1999). The magnitude of the efforts, the enormity of the expense, and the potential impact on individuals’ future has prompted considerable research examining the factors related to treatment of LD (Swanson, Hoskyn & Lee, 1999). Despite these efforts, gaps remain in our understanding.
One important factor that may be related to remediation, which has been relatively overlooked until recently, is IQ-intelligence. Research with non-LD children has consistently demonstrated IQ to strongly predict academic performance, school success and occupational status (Gofffredson, 2002; McCall, 1977; Schmidt & Hunter, 2004; Sternberg, Grigorenko & Bundy, 2001). As IQ is closely associated with school-related skills and activities, it would be expected that for children with LD, higher IQ would be associated with greater gains from remediation. Indeed, research across differing types of interventions, from preschool to grade school, supports this conclusion (Beringer, et al., 1999; Foorman, et al., 1998; Hatcher & Hulme, 1999; O’Connor et al., 1993; Torgensen et al., 2001; Wise, Ring & Olson, 1999). The evidence, however, is not universal, as some studies have failed to find a relation (O’Shaughnessy & Swanson, 2000; Schneider et al., 1999; Vadasy et al., 1997; Vellutino, Scanlon & Lyon, 2000). Fuchs and Young (2006) suggest the reason for this discrepancy is that the studies reporting negative findings involved younger children and did not use standardized IQ tests.
45

INTERNATIONAL JOURNAL OF SPECIAL EDUCATION Vol 24 No 1 2009
Generalization from this body of research, however, requires caution. Almost all the studies examined interventions that lasted weeks or months, not the prolonged exposure typical for children with learning disabilities. Furthermore, interventions were conducted within a single school or school district and usually closely monitored. While this allows for tighter experimental control, it is unclear whether the conclusions apply to large scale, real world school contexts, across multiple school districts. Examination of multiple school districts across a longer intervention time span would augment and inform existing research. Such efforts, however, are not only difficult to conduct, but these less controlled settings introduce considerable error variance. Nevertheless, these limitations should not deter trying, for they may detect a signal amidst the noise that affords greater confidence in generalizing to real world contexts.
Although IQ may be a potentially valuable predictor of treatment outcome for LD, it is also entangled in fundamental debates about its utility for defining and treating LD. LD has been defined as a discrepancy in IQ-achievement scores, but many consider the conceptual distinction between IQ and achievement to be problematic and, thus, so too, the validity of LD based on a discrepancy (Fletcher, et al., 2002; Siegel, 1989; 1999). Furthermore, many now advocate for a definition of LD tied to response-to-intervention (RTI), not IQ-discrepancy scores (Grimes, 2002; Lyon et al., 2001; Fuchs, Fuchs & Compton, 2004). However, despite these telling and controversial critiques, DSM IV, as well as many states and school districts, continue to use the IQ discrepancy model for placement and treatment. The question of whether IQ is related to treatment outcome, then, still has important practical utility.
Age at time of diagnosis is another variable that may be related to remediation of LD. For many childhood disorders, early detection and treatment are critical for improving the course and outcome of children’s lives (Ramey & Ramey, 1998). This may also apply to LD (Lyon 1996). Research by Francis et al. (1996) indicates that rates of reading improvement for eight year old students with LD was greater than non learning disabled students, while a plateau in reading abilities among both groups was reached by 15 years of age. This suggests there may be a sensitive period for maximal remedial gains. Younger children would, thus, be expected to benefit more from intervention. Few studies, however, have directly examined the relation between age and treatment effects, a significant oversight with important practical implications.
Socioeconomic status (SES) is another potential variable that may influence treatment outcomes for LD students. Lower SES is associated with higher rates of LD (Barona & Fayku, 1992), and those from lower SES environments also experience more negative consequences than high SES individuals, including lower high school and college graduation rates and greater unemployment (O’Connor & Spreen, 1998). While this provides evidence for the differential effects of SES on students’ with LD subsequent academic success, the results may be due to greater opportunities, social support or other factors related to SES, not the remediation of LD.
SES is typically measured via individual family economic parameters, such as household income, parental education, and occupation. When viewed from a broader sociological perspective, school SES may provide important assessment of educational resources. Schools are the point of contact between child and remediation interventions, and children spend much of their in this setting. Furthermore, low SES schools have been found to have fewer materials and resources (Cooper & Speece, 1990; Esposito, 1999; Reynolds, 1991), and the general literature indicates that high SES schools are positively correlated with academic achievement (Greenwood, et al., 1994). The effects of school SES on the remediation of LD remains to be investigated.
The SES of neighborhood schools is frequently equivalent to the SES of the resident population. Not all school placements, however, are as clear-cut. Each year, thousands of students participate in desegregation programs where children, often from lower income neighborhoods, are transferred to different school environments. Research indicates that transfer students attending higher SES schools demonstrate greater academic gains (Kaufman & Rosenbaum, 1992; Longshore & Prager, 1985; McIntire et al., 1982; Thrup, 1997). No research, however, has addressed whether remediation efforts for children with LD are as effective for transfer students as their nontransfer peers, or whether school SES differentially effects remediation for transfer LD students. Transfer students must cope with stresses that nontransfer students do not have to face, so remediation may be less effective for them. Additionally, students transferred to higher SES schools would presumably benefit from the enriched
46

INTERNATIONAL JOURNAL OF SPECIAL EDUCATION Vol 24 No 1 2009
environment and therefore demonstrate greater remediation than those transferred to lower SES schools.
This study examined the remediation of LD in resident and voluntary transfer students from 18 school districts of varying SES in a large midwestern metropolitan area. Students in all these districts are under the administrative umbrella of a single, Special School District that is responsible for the staff, policies and procedures concerning handicapped and disabled students. Thus, while the school districts varied in SES, the assessment and treatment of all LD students was organized and administered by the Special School District, ensuring uniformity and continuity across a large and diverse population. Students were assessed when they were first diagnosed and placed in a remediation program and then reassessed three years later. It was hypothesized that higher IQ, earlier age of diagnosis, higher school SES, and nontransfer status would be related to greater remediation. It was also hypothesized that transfer students in higher SES schools would evince greater gains than those in lower SES placements.
MethodParticipantsParticipants were 176 children who were diagnosed with a learning disability between 1984 and 2000. The group consisted of 111 males and 65 females, of which 110 were Caucasian and 66 were African American with a mean age of 9.5 years (SD = 2.6) at the time of initial diagnosis. The non-transfer group consisted of 132 children who were educated in their resident neighborhood public schools. This group included 82 males and 50 females; 107 were Caucasian and 25 were African American (see Table 1). The transfer group included 44 children who participated in a state voluntary transfer program and consisted of 29 males and 15 females, all of whom were African American. All students attended schools from 18 school districts that are within the umbrella of a countywide Special School District, which is responsible for identifying and providing educational services for all handicapped and disabled students.
Table 1Participant Demographics
__________________________________________________________________________________Variable Transfer Non-transfer
Group Group Total n=44 n=132 n=17______________
African-American 44 (100%) 25 (19%) 69 (39%)Caucasian 0 107 (81%) 107 (61%)Female 15 (34%) 50 (38%) 65 (37%)Male 29 (66%) 82 (62%) 111 (63%)Age at Time 1
Mean 10.2 9.3 9.5SD 2.6 2.5 2.6
Several criteria were used to determine participant eligibility in the study. Each qualified student had a learning disability that was initially diagnosed (Time 1) between 1984 and 2000 according to the state guidelines that defined LD using IQ-discrepancy criteria. Students also needed to have had a comprehensive re-evaluation (Time 2) three years from the time of their initial diagnosis. The re-evaluation included the use of a standardized cognitive test and the same achievement test that was given at the initial diagnostic evaluation. To adequately assess the effect of school SES on remediation, the student also had to have received special education services within the same school district from Time 1 to Time 2.
Measures Cognitive measures General cognitive functioning was assessed through the following standardized measures: WISC-R (Wechsler, 1974), WISC-III (Wechsler, 1991), WAIS-R (Wechsler, 1981), Stanford-Binet Fourth Edition (Thorndike, Hagen & Sattler, 1986), K-ABC (Kaufman & Kaufman, 1983), and K-BIT (Kaufman & Kaufman, 1990). Each of these measures is well normed and validated, and was commonly used in the practice of assessing intellectual ability between 1984 and 2000. While each of the above-mentioned cognitive measures has a mean score of 100, differences do exist between the tests’ standard deviations. Thus, all test scores were converted to standard z-scores, allowing for interchangeable use and comparison between tests.
47

INTERNATIONAL JOURNAL OF SPECIAL EDUCATION Vol 24 No 1 2009
In the present study, intellectual functioning was measured for each student through one of the above-mentioned standardized measures. Not all students received the same measure, nor did they receive the same test at the re-evaluation period (Time 2) that was administered at the initial evaluation period (Time 1). While the use of different cognitive tests across time is common in clinical practice, this creates certain challenges in research due to differences in the tests’ standard deviations. These differences are, in part, accounted for through the use of standard z scores, and allow adequate comparisons between IQ scores from different tests.
Achievement measures Academic achievement was assessed through the use of one of the following tests: Woodcock-Johnson Psycho-Educational Battery (Woodcock & Johnson, 1977), The Woodcock-Johnson Psycho-Educational Battery - Revised (Woodcock & Johnson, 1989), or the Wechsler Individual Achievement Test (The Psychological Corporation, 1992). From the period of 1984 to 2000, these tests represented some of the most widely used standardized measures of achievement.
Each student took one of the three achievement measures. The achievement test that was administered at Time 1 was also administered again at Time 2. Therefore, while there were differences in achievement tests used across students, there was consistency in the achievement measures that each individual student received. The lowest achievement subtest score at Time 1 was selected for comparison with the IQ score. At Time 2, the new score from the same achievement subtest selected at Time 1 was used for comparisons with the Time 2 IQ score. All achievement scores were converted to z scores, allowing for the consistent assessment of achievement gains or losses over time.
Discrepancy scoresAchievement z scores were used in conjunction with cognitive z scores to evaluate students’ remediation. Time 1 discrepancy scores were calculated by subtracting achievement z score from the cognitive z score at Time 1 for each student. Likewise, the Time 2 discrepancy scores were calculated by subtracting students’ Time 2 achievement z score from their Time 2 cognitive z score.
Change in Discrepancy scoresThe discrepancy change score was the variable used to assess the remediation of learning disabilities. The change in the discrepancy score was selected as a measure of remediation because it most closely reflects changes in academic achievement based on traditional diagnostic criteria. It is reasonable to presume that as a child is remediated, there will be a consequent narrowing of the gap between their cognitive ability and academic achievement scores. The effect of remediation, or discrepancy change score, was calculated by subtracting the Time 1 discrepancy score from the Time 2 discrepancy score. Thus, greater positive values reflect greater remedial gains and greater negative values indicate remedial loss.
Socioeconomic statusSchool socioeconomic status was determined using the amount of spending per student. The mean school district expenditure was $7252 per pupil (SD=1305), and the range was from $5,400 to $11,627 per pupil. This measure has been used in other research studies to examine the effects of school SES and academic achievement in non-learning disabled populations (e.g., Miller-Whitehead, 2001; Miller-Whitehead & Achilles, 2003; Sutton & Soderstrom, 2001). ResultsIt was hypothesized that IQ, age at diagnosis, school SES and student transfer status would be significantly related to the remediation of learning disabilities as measured by changes in the cognitive-achievement discrepancy over time. To correct for violations of normality, school SES was transformed through an inverse transformation, and the discrepancy change score was transformed using a square root transformation. The hypotheses were tested using a hierarchical multiple regressions, with IQ scores, age at diagnosis, school SES and student transfer status entered in the first block. The two-way interactions of the independent variables were entered into the second block. The results for the overall regression model was significant, R2 = .10, F (10,175) = 1.94, p < .05 (see Table 2-next page). The first step in the model was significant, R2 = .07, F (4,171) = 3.27, p < .01. Specifically, the relationship between IQ at Time 1and discrepancy change scores was significant; β = -0.18, p < 0.05; students with higher cognitive scores tended to show greater improvement. Age at diagnosis was also significantly related to discrepancy change scores, β = 0.16, p < 0.05; greater remedial gains were observed in children that began treatment at younger ages. The results for the
48

INTERNATIONAL JOURNAL OF SPECIAL EDUCATION Vol 24 No 1 2009
main effects of SES and of student transfer status, however, were not significant nor were any of the interactions.
As IQ and age at diagnosis were significant, and transfer status was not, a follow-up analysis was conducted to examine whether transfer students differed from resident students on these two variables. T-tests indicated that the voluntary transfer students had significantly lower cognitive scores (as measured in z scores; M = -0.39 versus M = 0.11) and were older at time of diagnosis (M = 10.3 versus M = 9.3). The mean difference in school SES, however, was not significant. This suggests that voluntary transfer students are an at-risk population, not because of their voluntary transfer status per se, but because of their overall lower cognitive scores and later identification.
Table 2Prediction of Discrepancy Change Scores from Student Transfer Status and School SES
Predictor variables β R2Δ F (df) R2Δ Step 1: Main effects 0.07 3.27 (4,171)**
IQ Z score at T1 -0.18*Age at diagnosis 0.16*School SES 0.04Student Transfer status 0.03
Step 2: Interaction effects 0.03 1.94 (6,165)IQ x Student Transfer StatusIQ x AgeIQ x School SESAge x Student Transfer StatusAge x School SESStudent Transfer Status x School SES
Full Model 0.10 1.94 (10, 175)*___________________________________________________________________________________
*p<0.05, **p<0.01DiscussionThe deleterious effects of LD on children’s academic and occupational future has prompted large scale, government mandated remediation programs. This study sought to augment existing research on factors related to treatment outcome through a longitudinal examination of children in a number of school districts, which included a large number of voluntary transfer students. This study is unique in several regards: The sample was taken from a real world context; the three year time span is longer, and the number of school districts is greater, than most studies; it affords the possibility to confirm the generalizability of prior research on IQ and remediation outcome; and it examines age at identification, school SES, and voluntary transfer status, which have received little prior attention.
The results indicate that IQ was significantly related to remediation, as higher IQ was associated with greater improvement. This is congruent with prior research, conducted in more controlled settings, utilizing standardized tests with older children, suggesting that these findings may generalize to typical school populations where treatment is influenced by pragmatic concerns, not research protocols. Indeed, given the noise in this system, the detection of a significant and confirming relationship is noteworthy. IQ has consistently been found to be related to school performance and academic skills, and the results of this and other studies may reflect that children with higher IQs more effectively utilize and benefit from academic tutorial.
IQ is, of course, controversial, especially in regard to both the definition and treatment of LD. Some argue that it is a flawed basis for determining LD, and that remediation should be prompted by a failure to respond to intervention. The results of this study do not support, or refute, the arguments about the merits of the IQ-discrepancy score or the RTI controversy. Rather, they suggest that when the IQ-discrepancy definition is used for placement, which continues to be the approach in many school districts, IQ may be related to treatment outcome. Furthermore, the results could be used to argue for more intensive services and closer follow-up and follow-through for children with lower IQ.
Age at identification was also found to be related to treatment outcome; early identification, greater remediation. Age at identification has been recognized as an important variable and, indeed, is one
49

INTERNATIONAL JOURNAL OF SPECIAL EDUCATION Vol 24 No 1 2009
aspect of the RTI critique against using discrepancy scores to define LD. That is, the discrepancy definition results in a waiting to fail rather than a proactive, early identification and remediation (Fuchs & Young, 2006). The findings of this study suggest that such concern is well-founded—early identification matters. These results also underscore the urgency and importance of making every effort at early detection.
The results for school SES and transfer status were not significant, nor was the hypothesized interaction. Few studies have examined these factors, and the failure to find significant differences does not mean that future research is unwarranted. Rather, there is good theoretical reason to suspect that these factors might be important to remediation outcome. Furthermore, these variables are linked to broader sociological issues and public policies, which impact millions of students, and needs to be informed by empirical research. The paucity of research is disproportionately small in comparison to the magnitude of the public policy issues engendered by these variables. The follow-up analyses, which indicated that voluntary transfer students evinced lower IQ and later identification, suggest that they are an at-risk population for remediation of LD. There are, of course, a number of limitations to this study. Because this was a relatively large-scale field study examining children across a number of school districts over a considerable time span, consistency was not possible. Different measures of IQ and achievement were used across students, and sometimes different IQ measures were used for the same student between time 1 and time 2. Although z scores were used to standardize comparisons between tests, the differing norms, populations, and emphases of these tests not only introduces measurement error, but raise questions about the assumptions that the tests can be considered statistically interchangeable. Furthermore, the sample spans a 16-year period, where policies, procedures and practices likely changed, which undercuts presumptions of assessment homogeneity and treatment fidelity.
The flaws and problems, significant as they are, are unavoidable consequences of the nature of this study that also affords a unique and potentially important approach; a large scale, three year longitudinal assessment of factors influencing the remediation of LD in a real world setting. The limitations of this study prevent confident conclusions and certainly don’t trump research findings in more controlled contexts. The study does, however, offer complementary findings that are worthy of consideration: That in real world settings, IQ and age of identification may play a role in remediation that, consequently, entail important practical implications. This study also addressed the relation of school SES and transfer status, which have received little prior attention. Although the results were not significant, the practical, political, and societal implications of these factors on public policy decisions demand that they be more systematically investigated under more rigorous experimental conditions.
ReferencesAmerican Psychiatric Association. (2000). Diagnostic and statistical manual of mental disorders (text ed.). Washington, DC: AuthorBarona, A., & Faykus, S. P. (1992). Differential effects of sociocultural variables on special education eligibility categories. Psychology in the Schools, 29, 313-320.Beringer, V.W., Abbott, R.D., Zook, D., Ogier, S., Lemos-Britton, Z., & Brooksher, R. (1999). Early intervention for reading disabilities: Teaching the alphabet principle in a connectionist framework. Journal of Learning Disabilities, 32, 491-503.Cooper, D. H. & Speece, D. L. (1990). Instructional correlates of students’ academic responses: Comparisons between at risk and control students. Early Education and Development, 1, 279-300.Esposito, C. (1999). Learning in urban blight: School climate and its effect on the school performance of urban, minority, low-income children. School Psychology Review, 28, 365-377.Fletcher, J. M., Lyon, G. R., Barnes, M., Stuebing, K. K., Francis, D. J., Olson, R. K, et al. (2002). Classification of learning disabilities: An evidence-based evaluation. In R. Bradley, I. Danielson, & D. P. Hallahan (Eds.). Identification of learning disabilities: Research to practice (pp. 185-250). Mahwah, NJ: Erlbaum.Foorman, B.R., Francis, D.J., Fletcher, J.M., Schatschneider, C., & Mehta, P. (1998). The role of instruction in learning to read: Preventing reading failure in at-risk children. Journal of Educational Psychology, 90, 37-55.Francis, D. J., Shaywitz, S. E., Stuebing, K. K., Shaywitz, B. A., and Fletcher, J. M. (1996). Developmental lag versus deficit models of reading disability: A longitudinal, individual growth curves analysis. Journal of Educational Psychology, 88, 3-17.
50

INTERNATIONAL JOURNAL OF SPECIAL EDUCATION Vol 24 No 1 2009
Fuchs, D., Fuchs, L. S., & Compton, D. L. (2004). Identifying reading disability by responsiveness-to-instruction: Specifying measures and criteria. Learning DisabilityQuarterly, 27(4), 216-227.Fuchs, D., & Young C. L. (2006). On the irrelevance of intelligence in predicting responsiveness to reading instruction. Exceptional Children, 73, 8-30.Gottfredson, L.S. (2002). Highly general and highly practical. In R.J. Sternberg & E.L. Grigorenko (Eds.), The general factor of intelligence: How general is it? (pp. 331-380). Mahwah, NJ: Erlbaum.Greenwood, C. R., Hart, B., Walker, D., & Risley, T. R. (1994). The opportunity to respond and academic performance revisited: A behavioral theory of developmental retardation and its prevention. In R. Gardner, T. Heron, W. Heward, & D. Sainato (Eds.), Behavior analysis in education: Focus on measurably superior instruction. Belmont, CA: Brooks/Cole.Grimes, J. (2002, July). Responsiveness to interventions: The next step in special education identification, service, and exiting decision making. Revision of paper written for the Office of Special Education Programs, U.S. Department of Education, and presented at the OSEP's LD Summit Conference. Washington, DC.Hatcher, P.J., & Hulme, C. (1999). Phonemes, rhymes, and IQ as predictors of children’s responsiveness to remedial reading instruction: Evidence from a longitudinal study. Journal of Experimental Child Psychology, 72, 130-153.Kaufman, A. S., & Kaufman, N. L., (1983). K-ABC: Kaufman Assessment Battery for Children. Circle Pines, MN: American Guidance Service.Kaufman, A. S., & Kaufman, N. L., (1990). Kaufman Brief Intelligence Test. Circle Pines, MN: American Guidance Service.Kaufman, J. E., & Rosenbaum, J. (1992). The education and employment of low-income black youth in white suburbs. Education Evaluation and Policy Analysis, 14, 229-240.Longshore, D. & Prager, J. (1985). The impact of school desegregation: A situational analysis. Annual Review of Sociology, 11, 75-91.Lyon, G. R. (1996). Learning Disabilities. The Future of Children, 6, 54-76.Lyon, G. R., Fletcher, J. M., Shaywitz, S. E., Shaywitz, B. A., Torgesen, J. K., Wood, E B., et al. (2001). Rethinking learning disabilities. In C. E. Finn, Jr., R. A. J., Rotherham, & C. R. McCall, R.B. (1977). Childhood IQs as a predictor of adult educational and occupational status. Science, 197, 482-483.McIntire, R. G., Hughes, L. W., Say, M. W. (1982). Houston’s successful desegregation plan. Phi Delta Kappan, 63, 536-538.Miller-Whitehead, M. (2001). Science achievement, class size, and demographics: The debate continues. Research in the Schools, 8, 33-44.Miller-Whitehead, M., & Achilles, C. (2003). Education report cards: A comparison of city and county school districts. Research in the Schools, 10, 21-31.O’Connor, R.E., Jenkins, J., Leicester, N. & Slocum, T. (1993). Teaching phonological awareness to young children with learning disabilities. Exceptional Children, 59, 532-546.O’Connor, S. C., & Spreen, O. (1988). The relationship between parents’ socioeconomic status and education level, and adult occupational and educational achievement of children with learning disabilities. Journal of Learning Disabilities, 21, 148-153.Osborne, S. S., Schulte, A. C., & McKinney, J. D. (1991). A longitudinal study of students with learning disabilities in mainstream and resource programs. Exceptionality, 2, 81-95.O’Shaughnessy, T.E., & Swanson, H.L. (2000). A comparison of two reading interventions for children with reading disabilities. Journal of Learning Disabilities, 33, 257-277.Ramey, C. T., & Ramey, S. L. (2004). Early learning and school readiness: Can early intervention make a difference? Merrill-Palmer Quarterly, 50, 471-491.Raskind, M. H., Goldberg, R. J., Higgins, E. L., & Herman, K. L. (1999). Patterns of change and predictors of success in individuals with learning disabilities: Results from a twenty-year longitudinal study. Learning Disabilities Research & Practice, 14, 35-49.Reynolds, A. J. (1991). Early schooling of children at risk. American Educational Research Journal, 28, 392-442.Schmidt, E.L., & Hunter, J. (2004). General mental ability in the world of work: Occupational attainment and job performance. Journal of Personality and Social Psychology, 86, 162-173.Schneider, W., Ennemoser, M., Roth, E., & Kuspert, P. (1999). Kindergarten prevention of dyslexia: Does training in phonological awareness work for everybody? Journal of Learning Disabilities, 32, 429-436.Siegel, L. S. (1989). IQ is irrelevant to the definition of learning disabilities. Journal of Learning Disabilities, 22, 469-478, 486.
51

INTERNATIONAL JOURNAL OF SPECIAL EDUCATION Vol 24 No 1 2009
Siegel, L. S. (1999). Issues in the definition and diagnosis of learning disabilities: A perspective on Guckenberger v. Boston University. Journal of Learning Disabilities, 32, 304-319.Sternberg, R.J., Grigorenko, E.L. & Bundy, D.A. (2001). The predictive value of IQ. Merrill Palmer Quarterly, 47, 1-41.Sutton, A., & Soderstrom, I. (2001). Predicting elementary and secondary school achievement with school-related and demographic factors. The Journal of Educational Research, 92, 330-338.Swanson, H. L., & Hoskyn, M., & Lee, C. (1999). Interventions for students with learning disabilities: A meta-analysis of treatment outcomes. New York: Guilford.The Psychological Corporation. (1992). Wechsler Individual Achievement Test. San Antonio, TX: Author.Thorndike, R. L., Hagen, E. P., & Sattler, J. M. (1986). Stanford-Binet Intelligence Scale – Fourth Edition. Chicago, IL: RiversideThrup, M. (1997). How school mix shapes school processes: A comparative study of New Zealand schools. New Zealand Journal of Educational Studies, 32, 53-82. Torgesen, J. K., Alexander, A. W., Wagner, R. K., Rashotte, C. A., Voeller, K. K. S., Conway, T. (2001). Intensive remedial instruction for children with severe reading disabilities: Immediate and long-term outcomes from two instructional approaches. Journal of Learning Disabilities, 34, 33-58.Vadasy, P.F., Jenkins, J.R., Antil, L.R., Wayne, S.K., & O’Connor, R.E. (1997). Community-based early reading interventions for at-risk first graders. Learning Disabilities Resarch and Practice, 12, 29-39.Vellutino, F.R., Scanlon, D.M., & Lyon, G.R. (2000). Differentiating between difficult-to-remediate and readily remediated poor readers: More evidence against the IQ-achievement discrepancy definition of reading disability. Journal of Learning Disabilities, 33, 223-238. Wechsler, D. (1974). Wechsler Intelligence Scale for Children – Revised. San Antonio, TX: The Psychological Corporation.Wechsler, D. (1981). Wechsler Adult Intelligence Scale – Revised. San Antonio, TX: The Psychological Corporation. Wechsler, D. (1991). Wechsler Intelligence Scale for Children – Third Edition. San Antonio, TX: The Psychological Corporation.Wise, B.W., Ring, J., & Olson, R.K. (1999). Training phonological awareness with and without explicit attention to articulation. Journal of Educational Psychology, 72, 271-304.Woodcock, R. W., & Johnson, M. B. (1977). Woodcock-Johnson Psycho-Educational Battery. Itasca, IL: Riverside Publishing.Woodcock, R. W., & Johnson, M. B. (1989). Woodcock-Johnson Psycho-Educational Battery-Revised. Itasca, IL: Riverside Publishing.
52

INTERNATIONAL JOURNAL OF SPECIAL EDUCATION Vol 24 No 1 2009
ADMISSION AND GRADUATION REQUIREMENTS FOR SPECIAL EDUCATION DOCTORAL PROGRAMS
AT 20 TOP AMERICAN UNIVERSITIES
Gabriela WalkerUniversity of Georgia
A quantitative analysis of the admissions and graduation requirements guidelines of the special education doctoral programs at 20 top American universities was conducted. Admission requirements typically include an application fee, previous coursework GPA, previous field experience, GRE scores, TOEFL scores, professional writing sample(s), and enrollment. Graduation requirements may include continuous enrollment, completion of courses, yearly progress reviews, doctoral products, a qualifying examination, dissertation completion, and final defense. Results indicate that the quality of the instruction is comparable to that of the top 20 universities around the world, of the top 20 universities in the U.S., and of the top 20 graduate education programs in the U.S.
IntroductionSpecial education is currently a field with growing employment needs in order to develop and provide better services and opportunities for individuals with disabilities. Based on data collected during the 2000 census, approximately 19% of the individuals in the U.S. population have one of these conditions: (1) they are 5 years or older and have a sensory, physical, mental, or self-care disability; (2) they are 16 years or older and have difficulty when going outside their home; or (3) they are 16 to 64 years old and have an employment disability (U.S. Census Bureau, 2006). The same source also reports that of the 19%, 7% of boys and 4% of girls aged 5 to 15 have disabilities, and 20% of men and 18% of women aged 16 to 64 have disabilities. Some jobs that involve research or administration require persons with doctorate level training to maximize continued progress in this area of education.
Many of the top special education graduate programs are offered at American universities. In one of the few rankings available on the World Wide Web of best universities in the world, Shanghai Jiao Tong University’s Web site (2006) ranks 17 U.S. universities among the best 20 on the globe (also see India Education.Net, 2006; MSNBC, 2006; National University of Singapore, 2006). Eleven of the best universities from the Jiao Tong University’s Web site are also listed in a U.S. News & World Report ranking (2006b) of the best 20 universities in the U.S.A. Of the American universities with the best graduate programs in education according to the US News & World Report assessment (2006c), six are among the best 20 universities in the world, and five are among the best 20 universities in the U.S.A. Of the universities that offer the best special education graduate programs in the U.S., 11 are among the universities with the best graduate programs in education in the U.S., and three are considered to be among the best universities in the world according to the U.S. News & World Report ranking (2006d).
Educational attainment may be an important income predictor, one would conclude that opportunities to earn a higher salary should increase with the number or the level of degrees that one attains. A table compiled by the U.S. Census Bureau and entitled Earnings by Occupation and Education, United States, Both Sexes (2005), summarizes data from the 2000 census and suggests that people with an advanced degree (defined as higher than a bachelor’s degree) earned, on average, 2.02 times more than high school graduates. Furthermore, the table shows that people with high school diplomas were earning incomes which had increased 1.5-fold by the end of their employment career, whereas people with advanced degrees were earning incomes that had increased 2.2-fold by the end of their careers. According to the 2000 census, 15.54% of the American workforce had earned a bachelor's degree, and 8.86% had earned a graduate degree (Free Demographics.Com, 2005). Two of the highest graduate degrees are Doctor of Philosophy (Ph. D. - Philosophiæ Doctor) and Doctor of Education (Ed. D. or D. Ed. – Doctor Educationis). While a Ph. D. program typically prepares students for research positions, an Ed. D. degree may prepare individuals for research, teaching, or administration positions in colleges and universities. Both degrees may lead to leadership positions in various educational agencies.
53

INTERNATIONAL JOURNAL OF SPECIAL EDUCATION Vol 24 No 1 2009
The purpose of this survey is to provide prospective candidates to special education doctoral programs with an up-dated guideline as to the quality, admission requirements, program completion guidelines, and geographical setting of 20 of the best academic programs in the U.S. In addition, the survey may provide parents and practitioners with information about the top 20 special education doctoral preparation programs in the country. Hopefully, this survey will also encourage more individuals to choose to study special education and pursue higher degrees in order to contribute to the improvement of services for people with disabilities and to extend the body of research in the area of special education. A statistical analysis may provide the administration personnel of various colleges and universities with a consistent report about other universities’ requirements and may assist in developing a more homogeneous collection of requirements variables. No similar surveys were found in a literature search.
MethodSince the creation of the ARPA-net (Advanced Research Projects Agency) in 1969 (Hafner & Lyon, 1996; Naughton, 2000; Webopedia, 2006), the Internet has undergone an explosion of growth. In 2003, 62% of American households owned one or more computers (Cheeseman Day, Janus, & Davis, 2005). Currently, the United States accounts for 19.1% of the Internet users in the world, followed by China, with 11.3 % users (Internet World Stats, 2006). Uses of the Internet and the World Wide Web currently include: (1) rapid retrieval of information; (2) dissemination of audio, video, or written information; (3) communication and interconnection; (4) searching for data and services; (5) distance learning; (6) numerous uses in the classroom; and (7) interdisciplinary resource use (Everett, 2002; Isaacson, 2002).
The Internet was used to obtain information on top-ranked U.S. universities, which offered doctoral level programs in special education, and the entrance requirements for those universities and programs, and other topics related to the focus of this survey. Web searches were initially conducted using well-known search engines (Google, Yahoo, and MSN) and keywords such as top universities; world rank universities, and rank colleges in order to obtain a ranking of top universities around the world and within the U.S. A search of the universities’ Web sites was subsequently conducted using any keyword which constituted a variable targeted in this survey, such as special; education; disability(ies); doctoral program; admission; application; GRE; fee; and combinations of these. A third search was conducted on the official Web site of the U.S. News and World Report, where a subscription to the Premium Online edition provided a comprehensive list of universities with the top-rated programs in the United States. When the information from these main sources was insufficient or unclear, an e-mail message or a phone call was necessary to obtain the needed information. The criteria for inclusion of the first-ranked 20 special education programs in the U.S. were that: (1) the university had to offer special education specialization; (2) the university had to offer a Ph. D. or Ed. D. in special education; (3) the special education program had to be ranked among the top 20 in the U.S.; (4) the university had to be accredited; and (5) the university had to have a Web site.
ResultsThe search revealed several rankings of American universities at the U.S. News & World Report Web site (2006a; 2006b; 2006c; 2006d) and at other Web sites which cited the U.S. News & World Report ranking. Additionally, the search produced information about minimum admission and graduation requirements in education and special education programs in the 20 top universities in the U.S. for 2006 (Tables 1 and 2). The ranking from the U.S. News & World Report was accepted for the purposes of this survey because (1) this ranking was cited at all other visited Web sites that provided a university ranking, (2) this publication has journalistic prestige (U.S. News & World Report, 2006f), and (3) the company’s staff conducted a stringent and thorough analysis of information in order to come to their conclusions. [For more information about how the school rankings were made, see U.S. News & World Report (2006a), and for details about accreditation of schools, refer to the Graduate Guide (2006)].
Admission RequirementsThe mean GRE scores obtained in 2005 by the students accepted in doctoral education programs (534.4 for Verbal Reasoning and 615.1 for Quantitative Reasoning) is close to the mean GRE scores obtained by students accepted in special education graduate programs in the same year (510.5 for Verbal Reasoning and 595.8 for Quantitative Reasoning). By comparing these two means, one would conclude that the expectance of academic performance in special education graduate programs is as high as the expectance in doctoral education programs (Tables 1 and 2). For a candidate to be considered for admission into a special education doctoral program at any of the 20 top special education doctoral programs investigated, the following items must be submitted: (1) an application and processing fee;
54

INTERNATIONAL JOURNAL OF SPECIAL EDUCATION Vol 24 No 1 2009
(2) a letter of intent (sometimes referred to as a letter of aspiration or statement of goals); (3) two official transcripts of all previous college work (i.e., bachelor’s and master’s level coursework at accredited colleges or universities in the U.S. or at equivalent foreign institutions); (4) three to five letters of reference; (5) official scores from the Graduate Record Examination (GRE); (7) a minimum Grade Point Average (GPA) report; and (6) official scores from the Test of English as a Foreign Language (TOEFL), if applicable (Table 3). All documents must be submitted by the admission/application deadlines, typically approximately six months prior to the semester for which the candidate wishes to be accepted. Some colleges also ask for a curriculum vita and/or an interview, tape, or for a video recording with answers to questions selected by the admission committee. Some programs require an additional scholarly written sample.
Application fees for the 20 programs listed in Table 1 range from nothing to $70, with an average of $50.5 ± 15.5. Some special education doctoral programs require a master’s degree, while others require only a bachelor’s degree. The minimum acceptable GPA earned in previous college coursework ranges from 3.0 to 3.5, with a mean of 3.16 ± 0.20. Forty five percent of the investigated special education programs ask for some experience in the field prior to admission (range of 1 to 3 years, with a mean of 2.0 years ± 0.9). The GRE and TOEFL scores must be less than 5 and 2 years old, respectively. Of the 20 programs, 50% reported a minimum acceptable score, 35% did not have a cut-off score but expressed a preference, and 15% did not require a GRE score. The minimum GRE mean reported is 1,018.8 ± 54.4, with a range from 900 to 1100. Even if the department does not require a certain GRE score, the prospective students are reminded that the admission is competitive and that a GRE score report may be helpful in evaluating their overall abilities, and especially in considering allocation of financial aid. The minimum TOEFL mean score required for admission is 538.4 ± 117.9 for the Paper-Based Test, or 223 ± 19.8 for the Computer-Based Test. The student enrollment fees vary from $125 to $2,202, with a mean of $1,018.6 ± 599.5. The mean cost of full-time in-state tuition, consisting generally of an enrollment of 9 credit hours of graduate courses, is $6,775.4 ± 3,076.0, with the costs ranging from $1,818 to $12,518. From a mean of 372.2 applications that the 20 investigated programs received in 2005, on average only 81 students were accepted into the reviewed special education doctoral programs (Table 3).
International applicants who are not native English speakers are required to submit their scores from the TOEFL exam. Typically, international students are also required to submit an additional writing sample or an essay as proof of their competence in English. Furthermore, international students who have qualified for admission may be required to provide an official statement of financial resources which may be used to support their education for the first semester or year of graduate school. The official letter of admission is usually accompanied by a packet of information and an I-20 form with which international students obtain a U.S. Visa.
All colleges reviewed herein strongly recommend online application, which provides several advantages: (1) the application fee may be waived, (2) the application can be saved in an electronic form that can later be re-accessed for revisions if necessary, (3) the possibility to check on the status of applications to see which items have been received and processed, and (4) the speed of electronic application versus regular mail. Admission guidelines for all colleges generally state that attainment of minimum examination scores and timely submission of all required materials do not guarantee admission and/or financial aid because several other factors need to be taken into consideration. These include: (1) strength of the letter of introduction; (2) strengths of the letters of recommendation; (3) quality of the writing sample; (4) quality of previous experience and background in special education or a related field; (5) match of the applicant’s and department’s goals; (6) availability of a professor with a vacancy in the targeted specialty, and (7) availability of funds.
The recommendation decision (admit/do not admit) is usually made by an admission committee from the department that offers special education course from each university. An official notification of admission is sent to the applicant via mail or email from the appropriate department or from the Graduate School. It is therefore important to provide the university with a current e-mail and/or postal address, since the notification will also include further procedural instructions and contact information for the applicant.
Graduation RequirementsOnce admitted into a doctoral program, the status of doctoral student is granted and should be maintained through: (1) continuous registration; (2) enrollment and successful graduation of
55

INTERNATIONAL JOURNAL OF SPECIAL EDUCATION Vol 24 No 1 2009
recommended course work hours, including research tools (courses in areas related to research design, methodology, and statistical analysis); (3) yearly student progress review determined by the department’s faculty and/or student’s committee members; and (4) professional products. Successful performance in a course is defined as earning a grade of B or higher in the course. The doctoral committee is typically composed of three to five members from within and outside of the department, including one or two committee chairs. Depending on the program and the student’s personal goals, doctoral program duties or products may include: (1) teaching an internship or a practicum; (2) student supervision; (3) teaching a college course; (4) professional presentations outside the department (e.g., state, national, or international conferences); and (5) writing or contributing to grant proposals.
Because the doctoral programs are so uniquely tailored to the needs of the individual/student, the number of hours of minimum research and graduate credit hours vary, and they may exceed the core program, especially because the number of dissertation hours can vary from 3 to 27 credit hours. A number or a guideline from which an approximate number of minimum coursework credit hours could be calculated was reported inconsistently throughout the revised programs. From the 20 programs, 15 reported a minimum requirement of coursework with a mean of 64.1 ± 23.3 credit hours, and 13 reported a minimum requirement of research methodology credit hours with a mean of 13.6 ± 5.0 (Table 4). A commitment of three to four years of full-time doctoral work or the equivalent is required by all of the 20 special education programs. In general, upon completion of course requirements except for the dissertation, there will be a general qualifying examination (oral and/or written). If this is passed, the student officially becomes a doctoral candidate. The candidate is then given the opportunity to work on his/her dissertation proposal. Once the proposal is approved by the committee members, the doctoral candidate conducts research for, writes, and defends his/her dissertation in the context of the final (oral) examination. Dissertations generally consist of (1) a comprehensive literature review, (2) a description of the methodology used, and (3) several chapters of scientific and philosophical analysis. The time line in which a student is expected to finish his/her studies varies from four to five years. From the 20 programs investigated, only 8 have reported a time limit for graduation, with a mean of approximately 10 years from admission, given that the student has the special approval of the doctoral committee and the Graduate School to delay his/her defense no later than four to six years from promotion to candidacy.
Conclusion and DiscussionResults indicate that the quality of the instruction offered by the top 20 special education doctoral programs in the U.S. is comparable in quality to the instruction offered by the top 20 universities around the world, by the top 20 universities from the U.S., and by the top 20 graduate education programs in the U.S. For admission into one of the top 20 special education doctoral programs in the U.S., a candidate needs, at minimum, to write a letter of aspiration, to send official transcripts of all previous coursework that show a minimum GPA of 3.0, to provide three to five letters of recommendation, to obtain approximately 1,019 points for GRE and 538 for TOEFL (if applicable), to pay for the processing fee, and, if admitted, to pay the student enrollment and tuition fees. In order to graduate, an individual needs to maintain continuous registration, work with an adviser, assemble a doctoral committee consisting of three to five members, complete all of the courses recommended with an acceptable grade, successfully pass the yearly review, complete the doctoral products, pass the general qualifying examination, and complete and defend the dissertation. All these graduation requirements should be completed on an average within three to five years.
RecommendationsSimilar analyses, which would focus on various fields of study emphasizing both admission and graduation requirements for undergraduate and graduate levels, would be useful additions to the existent statistical data about the quality of the colleges and universities in the U.S. and around the world. Such studies may motivate prospective students to make informed decisions about their future careers. It is recommended that official Web sites of various colleges and universities should report information about admission and graduation in a more detailed and consistent fashion. Universities’ Web sites could also provide statistics about the employment success rate upon graduation, on the number of graduates and employed graduates per year, and the satisfaction of the employees with their job.
56

INTERNATIONAL JOURNAL OF SPECIAL EDUCATION Vol 24 No 1 2009
ReferencesCheeseman Day, J. Janus, A. & .Davis, J. (2005). Computer and Internet use in United States: 2003.
Retrieved October 16, 2006 from: http://www.census.gov/prod/2005pubs/p23-208.pdfDeNavas-Walt, C., Proctor, B. D., Hill Lee, C. (2006). Income, poverty, and health insurance coverage
in the United States: 2005. Retrieved October 14, 2006 from http://www.census.gov/prod/2006pubs/p60-231.pdf
Everett, Donna R. (2002).Technology and Effective Communication. National business education yearbook , 40, p. 227-44.
Free Demographics.Com, SRC (2005). A free and unlimited use: Demographic market analysis Web site. Retrieved October 17, 2006 from http://www.freedemographics.com/ AllocateOnline.srct
Graduate Guide (2006). Accreditation. Is it important? Retrieved October 17, 2006 from: http://www.graduateguide.com/article.asp?pageid=91
Hafner, K. & Lyon, M. (1996). Where wizards stay up late: The origins of the Internet. New York: Simon & Schuster.
India Education.Net (2006). Study abroad: The world’s top 200 universities. Retrieved October 27, 2006 from: http://www.indiaeducation.info/studyabroad/Best-Universities/World-Universities.asp
Indiana University, Bloomington (2005). Retrieved October 4, 2006, from the Indiana University's School of Education Web site: http://education.indiana.edu/
Internet World Stats (2006). Usage and population statistics. Retrieved Oct 14, 2006 from: vhttp://www.Internetworldstats.com/top20.htm
Isaacson, David (2002). Instant information gratification. American Libraries, 33 (2). p. 39.Michigan State University (2006). Retrieved October 4, 2006, from the Michigan State University
College of Education Web site: http://www.educ.msu.edu/ MSNBC (2006). Newsletter international week - The complete list: The top 100 global universities.
Retrieved October 27, 2006 from: http://www.msnbc.msn.com/id/ 14321230/site/newsweek/ Naughton, J. (2000). A Brief History of the Future. Woodstock & New York: The Overlook Press. National University of Singapore (2006). NUS in top quartile of world’s best 100 universities.
Retrieved October 27, 2006 from: http://newshub.nus.edu.sg/headlines/0511/ ranking_nov05.htm
Ohio State University (2006). Retrieved October 4, 2006, from the Ohio State University's College of Education site: http://www.coe.ohio-state.edu
Pennsylvania State University, University Park (2006). Retrieved October 4, 2006, from the Pennsylvania State University's College of Education Web site: http://www.ed.psu.edu
Shanghai Jiao Tong University (2006). Academic ranking of world universities – 2006. Retrieved October 4, 2006, from the Shanghai Jiao Tong University’s Web site: http://ed.sjtu.edu.cn/ranking.htm
Syracuse University (2006). Retrieved October 4, 2006, from the Syracuse University’s School of Education Web site: http://soeweb.syr.edu
Teachers College, Columbia University (2004). Retrieved October 4, 2006, from the Teachers College, Columbia University Web site: http://www.tc.columbia.edu/
University of California, Santa Barbara, Gevirtz (2006). Retrieved October 4, 2006, from the University of California Gervirtz Graduate School of Education Web site: http://www.education.ucsb.edu/
University of Florida (2006). Retrieved October 4, 2006, from the University of Florida College of Education Web site: http://www.coe.ufl.edu/
University of Georgia (2006). Retrieved October 4, 2006, from the University of Georgia College of Education Web site: http://www.coe.uga.edu/
University of Illinois, Urbana-Champaign (2005). Retrieved October 4, 2006, from the University of Illinois College of Education Web site: http://www.ed.uiuc.edu/
University of Kansas (2006). Retrieved October 4, 2006, from the Kansas University School of Education Web site: http://www.soe.ku.edu/
University of Maryland, College Park (2006). Retrieved October 4, 2006, from the University of Maryland College of Education Web site: http://www.education.umd.edu
University of Minnesota, Twin Cities (2006). Retrieved October 4, 2006, from the University of Minnesota College of Education and Human Development Web site: http://education.umn.edu/
University of North Carolina, Chapel Hill (2006). Retrieved October 4, 2006, from the University of North Carolina School of Education Web site: http://soe.unc.edu/
57

INTERNATIONAL JOURNAL OF SPECIAL EDUCATION Vol 24 No 1 2009
University of Oregon (2006). Retrieved October 4, 2006, from the University of Oregon College of Education Web site http://education.uoregon.edu/path.htm?setpath=19
University of Texas, Austin (2005). Retrieved October 4, 2006, from the University of Texas College of Education Web site: http://www.edb.utexas.edu/education/
University of Virginia, Curry (2006). Retrieved October 4, 2006, from the Vanderbilt University's College of Education and Human Development Web site: http://curry.edschool.virginia.edu/
University of Washington (2004). Retrieved October 4, 2006, from the University of Washington College of Education Web site: http://depts.washington.edu/coe/
University of Wisconsin, Madison (2006). Retrieved October 4, 2006, from the University of Wisconsin School of Education Web site: http://www.education.wisc.edu/
U.S. Census Bureau (2005).Earnings by occupation and education, United States, both sexes. Retrieved October 14, 2006 from: http://www.census.gov/hhes/www/income/ earnings/call1usboth.html
U.S. Census Bureau (2006). Newsroom: Facts for features - Anniversary of Americans with Disabilities Act (July 26). Retrieved Oct 14, 2006 from: http://www.census.gov/Press-Release/www/releases/archives/facts_for_features_special_editions/001823.html
U.S. News & World Report (2006a). About the rankings. Retrieved October 16, 2006, from: http://www.usnews.com/usnews/edu/college/rankings/about/index_brief.php
U.S. News & World Report (2006b). America’s best colleges 2007. Retrieved October 16, 2006 from: http://www.usnews.com/usnews/edu/college/rankings/brief/t1natudoc_brief.php
U.S. News & World Report (2006c). America’s best graduate schools 2007: Top education programs. Retrieved October 4, 2006, from: http://www.usnews.com/usnews/edu/grad/rankings/edu/brief/edurank_brief.php
U.S. News & World Report (2006d). America’s best graduate schools 2007: Education specialties: special education. Retrieved October 4, 2006, from: http://www.usnews.com/usnews/edu/grad/rankings/edu/brief/ edusp07_brief.php
U.S. News & World Report (2006e). Home. Retrieved October 4, 2006, from: http://www.usnews.com/usnews/home.htm
U.S. News & World Report (2006f). U.S. News history. Retrieved October 17, 2006, from http://www.usnews.com/usnews/usinfo/history.htm
Vanderbilt University, Peabody (2006). Retrieved October 4, 2006, from the Vanderbilt University's College of Education and Human Development Web site: http://peabody.vanderbilt.edu/
Webopedia (2006). The birth of the Internet. Retrieved October 15, 2006, from the Webopedia Web site: http://www.webopedia.com/DidYouKnow/Internet/2002/BirthoftheInternet.asp
58

INTERNATIONAL JOURNAL OF SPECIAL EDUCATION Vol 23 No 3 2008
Table 1. Comparison of Rankings of World and USA Universities
Rank Best World Universities (2006) Best USA Universities (2007) Best USA Education Graduate Programs (2007)1. Harvard University (USA) Princeton University (NJ) Harvard University (MA)2. University of Cambridge (UK) Harvard University (MA) Teachers College, Columbia University (NY)3. Stanford University (USA) Yale University (CT) University of California–Los Angeles 4. University of California - Berkeley (USA) California Institute of Technology Stanford University (CA)5. Massachusetts Inst Tech (MIT) (USA) Stanford University Vanderbilt University (Peabody) (TN)6. California Inst Tech (USA) Massachusetts Inst. of Technology University of California–Berkeley 7. Columbia University (USA) University of Pennsylvania University of Pennsylvania 8. Princeton University (USA) Duke University (NC) University of Wisconsin–Madison 9. University of Chicago (USA) Dartmouth College (NH) University of Michigan–Ann Arbor 10. University of Oxford (UK) Columbia University (NY) Northwestern University (IL)11. Yale University (USA) University of Chicago New York University (Steinhardt)12. Cornell University (USA) Cornell University (NY) University of Minnesota–Twin Cities 13. University of California - San Diego (USA) Washington University in St. Louis University of Washington 14. University of California - Los Angeles (USA) Northwestern University (IL) Michigan State University 15. University of Pennsylvania (USA) Brown University (RI) University of Oregon 16. University of Wisconsin - Madison (USA) Johns Hopkins University (MD) University of Texas–Austin 17. University of Washington - Seattle (USA) Rice University (TX) Indiana University–Bloomington 18. University of California - San Francisco (USA) Vanderbilt University (TN) University of Illinois–Urbana-Champaign 19. Tokyo University (Japan) Emory University (GA) Boston College (Lynch)20. Johns Hopkins University (USA) University of Notre Dame (IN) Universi ty of Virginia (Curry) Source Shanghai Jiao Tong University (2006) US News & World Report (2006b) US News & World Report (2006c)Web Site http://ed.sjtu.edu.cn/ranking.htm http://www.usnews.com/usnews/edu/
college/rankings/brief/t1natudoc_brief.php
http://www.usnews.com/usnews/edu/grad/rankings/edu/brief/edurank_brief.php
59

INTERNATIONAL JOURNAL OF SPECIAL EDUCATION Vol 23 No 3 2008
Table 2. Top 20 U.S. Special Education Programs and Mean GRE Scores
Sp. Ed. Grad.
Programs Ranking
Education Grad.
Programs Ranking
University2005 Mean GRE Scores of
Students Accepted in Doctoral Education Programs
2005 Mean GRE Scores of Students Accepted in Special
Education Graduate ProgramsVerbal Quantitative Verbal Quantitative
1. 5. Vanderbilt University (Peabody) 629 708 551 6412. 24. University of Kansas 500 550 490 5503. 15. University of Oregon 482 586 482 5514. 19. University of Virginia (Curry) 548 617 539 6155. 18. University of Illinois–Urbana-Champaign 563 681 N/A N/A6. 11. University of Minnesota–Twin Cities 523 610 509 5957. 24. University of Maryland–College Park 525 603 508 6008. 15. University of Texas–Austin 531 594 525 6039. 35. University of Florida 554 660 510 61010. 7. University of Wisconsin–Madison 533 619 514 61311. 11. University of Washington 531 577 531 57712. 2. Teachers College, Columbia University 567 640 553 63812. 49. Syracuse University 551 621 477 57512. 24. Ohio State University 485 599 484 58212. 17. Indiana University–Bloomington 542 650 511 60416. 29. University of North Carolina–Chapel Hill 532 570 N/A N/A16. 21. University of Georgia 528 617 495 57616. 52. University of California–Santa Barbara (Gevirtz) 509 583 492 56419. 14. Michigan State University 538 630 537 62920. 29. Pennsylvania State University–University Park 518 588 481 601GRE Range 482-629 550-708 477-551 550-641GRE Mean ± SD 534.4±31.9 615.1±38.6 510.5+-24.4 595.8+-27.1
60

INTERNATIONAL JOURNAL OF SPECIAL EDUCATION Vol 23 No 3 2008
Table 3. Doctoral Admission Requirements and Admission Guidelines in the Top 20 U.S. Special Education Programs
No. University Appl. FeeUSD
Min. Prev. GPA
Min.Exp.
(yrs.)
Min. GRE(V&Q)
TOEFLProf.
Writing Sample
FeesUSD
Full-time In-state Tuition
Doc. Appl. Received
2005
Doc. Accept.
2005(%)
Doc.Enteri
ng Stud.
PBT CBT
1. Vanderbilt University (Peabody)
0 3.4 NCO 1100 550 213 1 2,202 11,547* 664 12.5 47
2. University of Kansas
N/A 3.5 NCO 1000 570 230 1 441* 1,818* 225 44.9 N/A
3. University of Oregon
50 3.0 1 1000 500 173 1 1,449 9,099 213 14.6 27
4. University of Virginia (Curry)
60 NCO NCO 1000 600 250 N/A 1,588 8,222 270 50.4 72
5. University of Illinois–Urbana-Champaign
50 3.0 2 Not Required
613 257 N/A 1,772 7,160 304 41.1 87
6. University of Minnesota–Twin Cities
55 3.0 NCO NCO(~ 900)
550 213 1 1,641 8,748 450 49.1 137
7. University of Maryland–College Park
60 3.5 2 NCO(~ 1000)
575 233 1 917 3,537* 446 36.1 91
8. University of Texas–Austin
50 3.0 NCO NCO(~ 1000)
550 213 1 N/A 7,174 580 38.6 163
9. University of Florida
30 3.0 2 1000 550 213 2 207* 3,120* 158 44.9 32
10. University of Wisconsin–Madison
45 3.0 2 Not Required
580 237 1 N/A 8,738 344 38.7 57
11. University of Washington
45 3.0 0 NCO(~ 1000)
580 237 2 125 8,507 190 42.1 63
12. Teachers College, Columbia University
65 3.0 NCO Not Required
600 250 1 480 8,415* 1,236 25.8 160
61

INTERNATIONAL JOURNAL OF SPECIAL EDUCATION Vol 23 No 3 2008
Fig 3: Cont’d
No. University Appl. FeeUSD
Min. Prev. GPA
Exp.(yrs.)
Min. GRE
(V &Q)
TOEFLProf.
Writing Sample(Y/N)
FeesUSD
Full-time In-state Tuition
Doc. Appl.
Received 2005
Doc. Accept.
2005(%)
Doc.Enter
ing Stud.
PBT CBT
12. Syracuse University
65 3.5 3 1100 600 250 1 872 7,830* 88 40.9 27
12. Ohio State University
40 3.0 3 1000 550 213 1 465 8,259 210 39.0 43
12. Indiana University–Bloomington
55 3.0 2 1100 550 213 1 821 2,043* 399 43.6 95
16. University of North Carolina–Chapel Hill
70 3.0 NCO NCO(~ 1000)
550 213 1 1,401 3,613 205 51.7 58
16. University of Georgia
50 3.5 NCO 1000 550 213 1 990 4,368 495 38.0 133
16. University of California–Santa Barbara (Gevirtz)
60 3.0 NCO NCO 550 213 1 1,598 7,525 368 29.9 47
19. Michigan State University
50 NCO NCO NCO(~1000)
550 213 1 882 3,267* 306 48.0 100
20. Pennsylvania State University–Univ. Park
60 3.5 3 1100 550 213 1 484 12,518 293 38.9 99
Range 0-70
3.0-3.5
1-3
900-1100
500-613
173-257
1-2
125 -2,202
1,818-12,518
88 - 1,236
12.5 - 51.7
27 -163
Mean ± SD 50.5±15.5
3.16±0.2
2±0.9
1,018.8±54.4
538.4±117.9
223±19.8
- 1,018.6±599.5
6,775.4±3,076.0
372.2±250.2
38.4 ±10.6
80.9 ±43.0
Legend (in order): Appl. Fee = Application Fee; Prev. = Previous; GPA = Grade Point Average; Exp. = Professional Experience Required; GRE = Graduate Record Examination; V&Q = Verbal and Quantitative Reasoning GRE scores; TOEFL = Test of English as a Foreign Language; PBT = Paper-Based Test; CBT = Computer-Based Test; Comm. = Minimum Years of Commitment Required; USD = United States Dollars; Doc. Appl. Received 2005 = Number of Doctoral Applications Received in 2005; Doc. Accept. Rate 2005 = Acceptance Rate in Doctoral Educational Programs in 2005; Doc. Entering Stud. = Number of Entering Students in Doctoral Education Programs; N/A = Not Available; NCO = No Cut-Off; ~ = approximately; * = the prices with an asterix were calculated given the credit hour rate multiplied by 9, which is the number of credit hours considered minimum for full-time enrollment.
62

INTERNATIONAL JOURNAL OF SPECIAL EDUCATION Vol 23 No 3 2008
Table 4. Graduation requirements in the Top 20 U.S. Special Education Programs
No.University
Min. Hrs. of Grad.
Work
Research Hours
No.University
Min. Hrs. of Grad.
Work
Research Hours
1. Vanderbilt University (Peabody)
72 N/A 11. University of Washington
N/A 12
2. University of Kansas N/A N/A 12. Teachers College, Columbia University
42 9
3. University of Oregon 90 12. Syracuse University 90 94. Univ. of Virginia
(Curry)36 21 12. Ohio State University N/A N/A
5. University of Illinois–Urbana-Champaign
36 12 12. Indiana University–Bloomington
90 15
6. University of Minnesota–Twin Cities
75 18 16. University of North Carolina–Chapel Hill
N/A N/A
7. University of Maryland–College Park
90 N/A 16. University of Georgia 39 6
8. University of Texas–Austin
72 15 16. University of California–Santa Barbara (Gevirtz)
N/A N/A
9. University of Florida 26 12 19. Michigan State University
66 12
10. University of Wisconsin–Madison
54 12 20. Pennsylvania State University–Univ. Park
84 24
Total Range 26 - 90 6 - 24Total Mean ±SD 64.1 ± 23.3 13.6 ± 5.0
63

INTERNATIONAL JOURNAL OF SPECIAL EDUCATION Vol 24 No 1 2009
MOTHERS’ HEARTS SPEAKING:EDUCATION ENLIGHTENS, EMPOWERS AND PROTECTS GIRLS WITH DISABILITIES
Siri WormnæsUniversity of Oslo
andMarianne OlsenOslo, Norway
This small-scale phenomenological interview study explored how seven poor, illiterate mothers in five different slum areas in a bigger city in the Punjab province of Pakistan, viewed the significance of education for their daughters with disabilities. The mothers’ views were influenced by cultural aspects and behaviour patterns in the families’ context, as well as by individual interpretations of religious and social values. Their views were coloured by previous experiences with an educational system and by their assumptions about the girls’ situation when the parents are no longer there. The categories enlightenment, empowerment and protection emerged from the data as perspectives that contributed to an understanding of the mothers’ views. In a process of change from a traditional to a more modern society, mothers’ feelings of security and trust towards the world out there will influence their views and efforts regarding education for their daughters with disability. Mothers may need support and help in their encounters with the educational system. Although mothers have a central role, there is a need to bear in mind the complete family and the context when planning and implementing educational programs for girls with disabilities.
IntroductionIt is not only your child with a disability who has problems. Your other children may have as extensive needs. So what can you do? You are the mother of five children, one of whom has a disability. Should you leave your work as sweeper to look after this child? Then you lose your income and perhaps your shelter. Perhaps you have to sacrifice this child in order to prevent the other four from dying from starvation. If this child is a girl, that it may be difficult to get her married, and she will be an economic burden to the family.
This is a field note from a meeting that the second author had with a CBR (Community Based Rehabilitation) worker in a slum area in a bigger city in the Punjab province of Pakistan. The field note illustrates the multifaceted and complex life experienced by families who have daughters with disabilities. In spite of their challenging situation, some families in the slum areas had invested substantial economic and human resources in giving their daughters with disabilities education. This observation motivated a study of how mothers viewed the significance of education for their daughters with disabilities, and of conditions that influenced their views.
Until the end of the 1960s, the possibilities for education for people with disabilities in Pakistan represented an area, which was not attended to by any agency either on government or non-government level (Shazadi, 1999, p. 32). Lari (1996) characterizes the educational situation for children with special needs as neglect and apathy and as one of the most unsatisfactory features of the educational system in Pakistan (p. 344). The situation for girls can be expected to be more critical, since fewer girls than boys have been enrolled in school in Pakistan (Haq, 2000; UNESCO, 2008). Girls’ education is especially sensitive to poverty (Jilani, 2001) and they have been the first to be taken out of school if the family needs some of their children to work. In situations of extreme poverty, people with disabilities are particularly vulnerable (Ingstad & Whyte, 1995, p. 18). The Western world has presented and sustained the misconception that people with disabilities in developing countries are neglected and isolated to avoid stigmatizing their family members. However, a family’s care or lack of care may be a function of household resources rather than a function of attitudes towards disabled family members (Ingstad & Whyte, 1995).
64
INTERNATIONAL JOURNAL OF SPECIAL EDUCATION Vol 24 No 1 2009
Expectations for behaviour, skills and roles in society define what is considered normal and what is considered a disability. To be able to fulfil family roles and duties, to behave and show respect towards guests, to build affectionate relationships were among the parameters of normality found in a study about mental retardation in Bengali families (Rao, 2006).
Studies of parents’ and siblings’ attitudes towards children with intellectual impairments in Pakistan during the 1990s have found an increase of families in support of education rather than medical treatment. Education may be regarded as a means of empowering the children to become more independent, learn practical skills and general knowledge (Shazadi, 2000; Sulman & Zaidi, 1999).
To understand culture and societal changesThe Pakistani society is primarily characterized by gender complimentarily, meaning that men and women have different roles that are clearly defined and strictly followed (Stang Dahl, 1997; Gilani, 2001). Women are expected to move into the husband’s family and take responsibility for the home, care and upbringing of children as well as for the care of the parents-in-law and other family members (Maqbool, 2000). In Pakistani society, large sections are functionally segregated according to gender (purdah). Purdah consists of three elements: seclusion of women, the separation of sexes and the veiling of women in public (Klein & Nestvogel, 1992, 37). Papanek (1973) has emphasized that purdah , as it has been practised in South Asia among Muslims, Hindus and Christians for centuries, manifests itself as a symbolic shelter as well as gender-separate worlds. The concept symbolic shelter is based on the notion that someone needs protection, due to lack of maharam, which means that the relationship is not through blood, milk or marriage (Mirza, 2002) and evolves from a basic understanding of sexual tension between women and men that are not maharam (Papanek, 1973).
The present study was conducted among Christians, a religious minority group in Pakistan. They interact at various levels with the mainstream culture. It is, however, an oversimplification to talk about a Pakistani culture (Miles, 1992). Within an historical and sociocultural context, each individual’s pattern of behaviour is unique. Each individual interprets and relates to an environment as a positioned subject and observes with a particular angle of vision (Ingstad, 1995, p. 247). Life experiences both enable and inhibit particular kinds of insight (ibid, p. 247).
One may find different combinations of traditional and modern life styles and understandings in a single society. Traditional habits and customs may be valued as a continuation of previous generations’ experiences, and as a means of placing an activity in the continuity from the past, through the present, towards the future (Giddens, 1990). Giddens’ (1990) theories about the consequences of modernity and his discussion of individuals’ experience of trust, risk and fear when meeting the advanced world out there may contribute to an understanding of the transition from more traditional towards more modern societies. Abstract expert systems, such as for example a modern school system, a new economic system and professional medical services, undermine pre-existing forms of local control. Giddens (1991) describes them as disembedding processes and processes of loss (p. 138) that influence individuals and groups’ feelings of security in daily social activity. Attitudes of trust, in relation to specific situations, persons or systems, and on a more generalised level, are directly connected to the psychological security of individuals and groups. (p. 19). Parents’ perspectives on the importance of education for persons with disabilities must be expected to be influenced by such processes of change and by multiple cultural discourses in a society (Ghai, 2002).
The study A small-scale phenomenological interview study was conducted with the purpose to understand how mothers view the significance of enrolling their daughters with disabilities in educational programs, and of factors that influence their views.
A qualitative design was chosen in order to investigate the phenomenon personal meanings that mothers of girls with disabilities had concerning the significance of education for their daughters and to identify conditions that influenced their views. The research approach was guided by a hermeneutic phenomenological framework (Gall, Gall & Borg 2003). In this perspective, reality is an individual’s interpretation of what is perceived as a reality. To study what something means is to study what it implies to those who understand it (Shweder, 1984, p. 2). In attempting to grasp the mothers’ meaning as a whole through examples of their meanings about specific issues, and in order to understand the significance of each specific example in light of the ascribed meaning as a whole, the individual’s decisions and priorities were interpreted in relation to the sociocultural context.
65

INTERNATIONAL JOURNAL OF SPECIAL EDUCATION Vol 24 No 1 2009
Identifying issues and preparing for data collection Over a period of four months, daily visits to the various education programs in five different slum areas in a bigger city in the Punjab province of Pakistan were carried out. Ten employees in a CBR programme for children with disabilities were interviewed in order to identify issues and problems that the employees, the girls themselves and their families were concerned about and in order to decide criteria for the sample of informants.
This preparatory phase also facilitated the interviewer’s inner dialogue of preconceived ideas, prejudices and emotional reactions to the field of study, an aspect of a hermeneutic approach (Gadamer, 1960). It became clear that one would have to deal with a close confrontation with substantial poverty and with situations illustrating basic injustice concerning access to resources. Feelings of guilt when confronting one’s own affluence with others’ acute material situations were also to be expected.
The interviewer became aware of issues that might be highly sensitive among the informants and gained experience about how to talk about these issues in an interview situation. The interviewer prepared mentally for possible negative reactions from parents who, in spite of having given their consent to participate, might feel that a foreigner had no reason to look into their family’s priorities.
The mothersThe phenomenon was investigated through studies of seven mothers’ meanings. The mothers were selected from approximately one hundred Christian families with children with disabilities in different slum areas in a bigger city in the Punjab province, in areas where the inhabitants were very poor and men and women worked mainly sweeping roads, cleaning public buildings and private homes and in other low status jobs.
There were four criteria for the selection of the mothers. 1). The mothers and their husbands were to be illiterate and not having attended school. 2). They were to have daughters with various disabilities who were enrolled in different educational programs, such as special schools and CBR programmes. 3). The daughter’s age should be in the range between eight and sixteen. During this age span, girls and boys start to be segregated and must live in separate worlds (Papanek, 1973, p. 292). Some girls start to cover their bodies when they are outside their home; their freedom of movement becomes restricted and this may interfere with their access to school sites. 4). Some mothers should also have sons with disabilities.
Interview issuesEach mother was asked to describe her experiences of having a daughter with a disability. The issues covered the support they received, their awareness of educational programs, their views about their daughters’ educational and developmental potentials, their views about the purpose of education for children in general and for their daughters with disabilities and the experiences they had with attitudes towards disabilities within their extended families and in their community. The two mothers who also had sons with disabilities were asked about how expectations towards and possibilities for education were the same or differed according to gender. Furthermore, all the mothers were asked to describe experiences relating to the care of their children in general and of their daughters with disabilities. They were asked about their thoughts about the future for their children, across gender and ability/disability.
The daughtersShakila had a hearing impairment. She went to a governmental special school. One of her brothers also had a hearing impairment. Nusrat also had a hearing impairment. She participated in a CBR educational programme. The family had just decided not to accept enrolment in a private special school. Angela had a visual impairment. She went to a governmental special school. She had a younger brother with the same impairment. Saba had a physical impairment that restricted her mobility. She participated in a basic education group in her local environment and in the CBR educational programme. Mariam had an intellectual impairment. She participated in the same programmes as Saba did. Gulnaz had mobility impairment. It was unclear whether she also had an intellectual impairment. She participated in the CBR educational programme. Anila had unusual facial features. It was unclear whether she also had an intellectual impairment. At the time of the first interview, Anila stayed at home; half a year later she attended a private school.
66
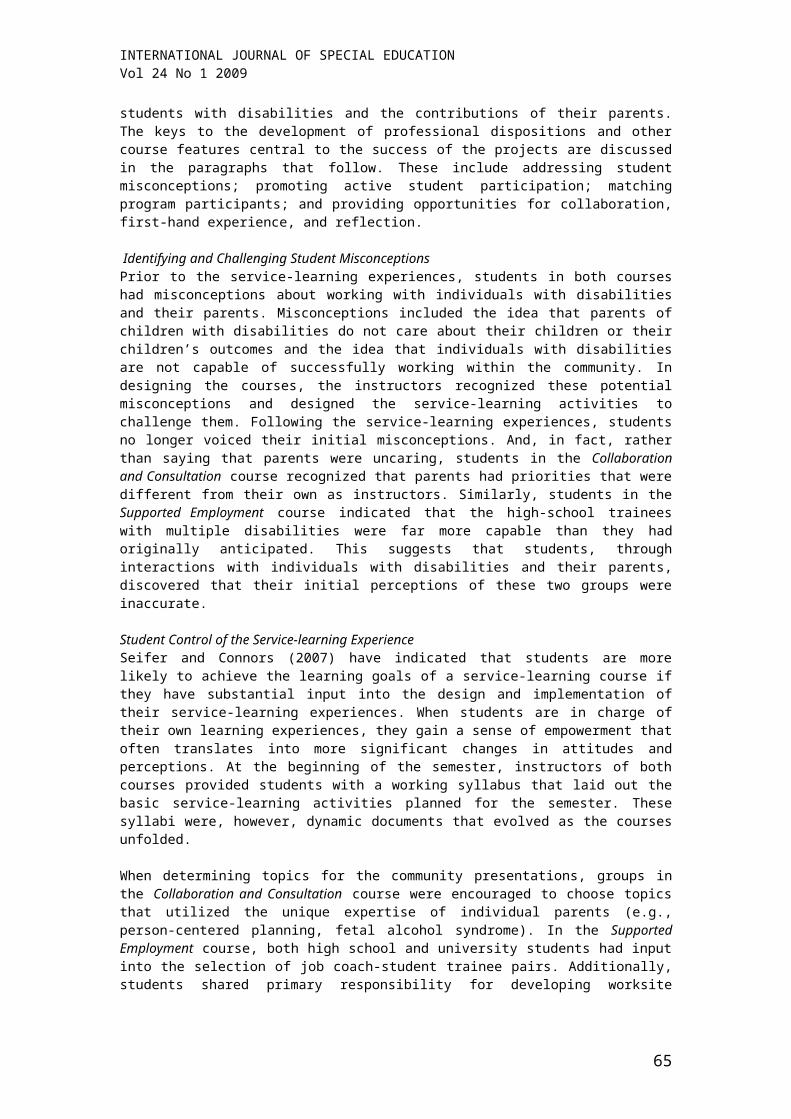
INTERNATIONAL JOURNAL OF SPECIAL EDUCATION Vol 24 No 1 2009
Data collection The second author carried out two in-depth interviews with each of the seven mothers in 2001 and 2002, as part of her Master’s thesis at the Department of Special Needs Education at the University of Oslo, Norway (Olsen, 2004). In order for the informants to be at ease, the interviews were conducted in the families’ homes whenever possible. During the interview sessions, guests sometimes arrived and siblings were often present. Care was taken to treat all with respect and attend to the usual rules of hospitality while at the same time making arrangements that enabled completion of the interviews and secured sufficient confidentiality.
The interviewer had sufficient competence in Urdu for everyday purposes. Nevertheless, a female Urdu-speaking CBR worker with good competence in English served as an interpreter for all interview sessions. Soon it became clear that the majority of mothers preferred to use their mother tongue, Punjabi. So, two additional female CBR workers who were fluent in both Punjabi and Urdu were included as interpreters. All the interpreters were familiar with the issues in focus, since they had sons with disabilities. The interpreters were repeatedly reminded that their role was to translate exactly what the informants said, so the interviewer could discover whatever needed to be clarified. The interpreters sometimes contributed to further clarification and to casting light on certain aspects of the issues under scrutiny.
Translation and transcriptionThe interviews were audio taped, translated orally from Urdu or Punjabi to English, and then transcribed in English. In order to strengthen the validity of the study, all translations were done by a professor in Urdu, whose mother tongue was Punjabi. The interviewer and translator together studied and interpreted every interview, sentence by sentence. The translator elaborated and explained connotations.
AnalysisThe analytical process was inspired by the grounded theory (Strauss & Corbin, 1998). During the interview sessions, ad hoc interpretations of the informants’ expressions and views were made and an attempt was made to verify them by reading them back to the informants during the first or the second interview. The challenge was to continue to have an open mind for alternative interpretations, as described by Miles and Huberman, (1984, p. 26) by first holding conclusions lightly, maintaining openness and scepticism and by making them increasingly explicit and grounded. After transcription, the material was broken down according to themes and sub themes, sorted and regrouped. By toying with words, phrases, sentences, paragraphs and segments, the material gradually developed into interpretations of meaning.
Credibility of the study The second author’s frequent and long-lasting contact with inhabitants in the area where the study was conducted helped to create an atmosphere of trust and confidence during data collection. It also added to an understanding of the sociocultural context and in doing so, to the credibility of the analysis.
Nevertheless, being a well educated, and in this context, resourceful foreigner may have influenced the informants to present views that they assumed the interviewer would appreciate. This may especially be the case in a society where it is considered important to show respect and be polite towards guests.
Two of the interpreters were involved in the CBR program. This may have influenced some informants to not share views that could be interpreted as criticism of CBR workers. On the other hand, the informants may have felt free to express their views in the presence of a person they knew and who already knew everything about them, as one mother expressed it.
The data collection phase lasted for one and a half years. The interviewer met the informants informally several times between the two interview sessions, using the opportunities to check the interpretation of what the mothers had said.
Ethical reflectionsPrior to data collection there was serious consideration as to whether participation in the study could be expected to have a negative influence on the life situation of the informants and their families. These families had already experienced humiliation through poverty, illiteracy, low-status work and poor housing conditions. All mothers were given information orally about the project. Respect for the
67

INTERNATIONAL JOURNAL OF SPECIAL EDUCATION Vol 24 No 1 2009
families’ struggles and appreciation for how they mastered their situation in vulnerable and difficult circumstances was communicated during the interview. Furthermore, this respect has served to guide the analysis. Through the translation and transcription process, no hurtful or derogatory comments were discovered in the interviews. At the time of data collection, there was no reason to fear sanctions towards the families due to the mothers’ meetings with a foreigner from a Western country.
FindingsThrough examples, metaphors and life stories, the mothers described why and how they considered education to be valuable for their daughters with disabilities. The three categories enlightenment, empowerment and protection emerged as perspectives that contributed to an understanding of their views on the significance of education for their daughters. Certain contextual factors in a society in transition also emerged as descriptions of conditions that influenced their views and decisions about their daughters’ education.
Knowledge EnlightensA new light is shining now, - the light of knowledge (Gulnaz’s mother)The seven mothers emphasized that their positive attitudes towards education for children with or without disabilities, were influenced by a development that had taken place in their society, especially in more urban districts, during the past ten to fifteen years. Gulnaz’s mother said, A new light is shining now. We look at the world” said Mariam’s mother, and absorb this idea that children should go to school. Angela’s mother explained that a majority of parents now send their sons and daughters to school and that people would talk if their children did not attend school. Shakila’s mother claimed that the general development in their society gives their children more inspiration to go to school.
If all mothers in the world sent their daughters with disabilities to school, they could live a better life. (Shakila’s mother) The mothers believed that knowledge would enlighten their daughters and have an impact on their quality of life.
She herself feels so depressed because of her blindness. (…) I send her to school with the hope of giving her a better life in the future. And do not think that I will send her to the countryside to plough the fields. (Angela’s mother)
Some mothers expressed a hope that their daughters would get a job, while others had no such expectations. Knowledge, and especially to learn to read and write, is a good idea, said Saba’s mother, because then Saba will at least live an enlightened life. The mother used the verb sawerna that comes from the word sawera that means dawn. They wanted their daughters’ lives to be roshen hona, which literally means enlightened.
Knowledge empowers The mothers were more worried about the future lives of their daughters with disabilities than about the future of their sons with disabilities after the parents had passed away. The mothers wanted to empower their daughters as preparation to meet the fate only God knows, whether it would be as married women, as mothers, as unmarried sisters or as daughters-in-law living on charity in another family.
Education is for Shakila’s own good, since one day she will no longer be ours. (Shakila’s mother)Those mothers, who hoped to arrange marriage for a daughter, were worried about how she would be treated by her future family-in-law. When daughters get married and move in with strangers in the next house, parents cannot help or intervene. We pray: Oh God, give her a good fate (naseeb). Because we never know if we will get a good or bad marriage proposal for our daughters, said a resource person in the CBR programme. Education was considered the best dowry, especially for their daughters with disabilities.
Education is much more important for girls than for boys. Because knowledge will strengthen girls’ position in a marriage and they will more likely listen to her and show her respect. (Anila’s mother)
Respect was a word often used by the mothers when they described the importance of education and knowledge.
Through knowledge Shakila will be better at keeping her household, she will know how to behave in all situations and for this she will be met with respect in her family-in-law. And what is more important than respect? (Shakila’s mother)
68

INTERNATIONAL JOURNAL OF SPECIAL EDUCATION Vol 24 No 1 2009
The mothers hoped that if their daughters acquired more knowledge, they would be better equipped when they entered the next door. Competence in arithmetic could help a married daughter to be able to keep a household account. Then the family-in-law cannot accuse you of having put aside money for your own family. (Saba’s mother)
Nusrat’s and Shakila’s mothers, whose daughters primarily communicated with signs, emphasized the importance of learning to write as a way to communicate with their future family members who could not be expected to master sign language. All the mothers emphasized the importance of being able to write letters back home when their daughters had moved to a family-in-law.
Then they can tell us how they are doing. (Anila’s mother)
When we are dust, she can manage her life alone and not be a burden to others. (Saba’s mother)The mothers believed that, through negotiations in their extended families, they would find a wife for their sons with severe disabilities, since their wives would move to join the family of their husband. Angela’s mother, for example, expected it to be difficult, but not impossible, to find a wife for her son who was blind. For her daughter who was blind, it is up to God to decide. Physical and intellectual disabilities were especially disabling for women in their traditional roles. Which mothers-in-law would get up early and serve a daughter-in-law breakfast in bed? one of the CBR workers asked when she explained the limited possibility for marriage for girls with substantial physical disabilities. Regarding the role of a woman, a girl with hearing impairments like Nusrat would be able to adapt to the expectations and demands in the environment and in the family. Nusrat can wash, sweep, iron clothes and she can care for herself. […] She can let others understand what she wishes from them and she is very clever with house work. She fetches water for tea, cleans the kettle and makes tea for us. There are no problems, no burden for us. (Nusrat’s mother)Mothers who expected it to be difficult or impossible to arrange marriage for their daughters wanted them to acquire skills that enabled them to support themselves. For what can Gulnaz otherwise do when she gets older? […] We want her to learn sewing and handicraft in the CBR group. Mariam’s mother taught her daughter simple housework skills, since Mariam will have to spend much time indoors.
We will not be able to arrange a marriage for Saba because she cannot cater for a household and therefore nobody in our family would like to marry her. She cannot live together with her brothers either. So, she needs to learn something. I wish that she would learn to sew. Because she could sit here at home and sew. (Saba’s mother)
Many of the informants feared that their unmarried daughters would be a burden on their family members, all of whom had few economic and material resources.
If Anila must leave her family-in-law, she will manage better on her own if she has some education. (Anila’s mother)
… She can read about one hundred ways of doing things. (Shakila’s mother)While Nusrat’s mother wanted to take over the training of Nusrat and her older sister herself, primarily wanting them to learn sewing and house work, Shakila’s mother wanted her daughter also to learn from others.
I have not gone to school. I teach my children through being a model. I wash the pots and tell them to do the same. If a girl is educated, however, she can read about one hundred ways of doing things. I myself can only show her one way. (Shakila’s mother)
Knowledge ProtectsThese Christian families observed purdah just as the Muslim families in the area did. They referred to purdah as their Punjabi tradition rather than a Muslim tradition. We live our lives according to purdah, said a CBR worker. The mothers claimed that knowledge could contribute to giving their daughters protection, just as purdah does. Girls with knowledge about what is right and wrong would be able to take better care of themselves and avoid being abused. Such girls know how to behave in order not to bring shame upon themselves and us, said Miriam’s mother.
Education motivates more education Mothers in families that had prioritized education for all their children (Mariam’s, Angela’s Shakila’s and Gulnaz’s) referred proudly to educated female family members who were educated and had jobs.
69

INTERNATIONAL JOURNAL OF SPECIAL EDUCATION Vol 24 No 1 2009
I become so inspired when I see the interest and enthusiasm my husband’s eldest brother and his family demonstrate when it comes to education even for the girls. (Mariam’s mother)
In the families where children without disabilities attended school for fewer years, where the mothers emphasized the importance of acquiring practical skills like sewing, housework and handicraft, plus Biblical knowledge, there were fewer educated role models (Saba’s and Nusrat’s).
Mothers need their families’ support It was often the family’s oldest member, the father-in-law or the eldest brother, who made the decisions about the enrolment of female family members in school. It was probably Nusrat’s grandfather (the father’s father) who finally decided that Nusrat should not attend the special school that had accepted her for enrolment. The CBR employees later realized that they had made a mistake in not involving the grandfather in the discussion.
Anila’s and Saba’s mothers experienced their husbands as less concerned about their daughters’ situations. During the last interview session, Saba’s mother whispered, my husband does not know how much I do for this daughter of mine. For her I am the only one who breathes. Several mothers had argued with their husbands about their daughters’ education. It is to throw money out of the window, Anila’s father had said. She will not learn anything this time either. Her mother had insisted that Anila was able to learn. Later the father admitted that the mother was right. It looks good, he said. Shakila’s mother emphasized that the entire family had supported her daughter’s participation in an educational programme. We quarrelled a lot, Shakila’s mother said, but then he [the husband] joined me to visit the CBR group and watched the work they did with our children and since then he has supported me one hundred per cent.
Mothers’ care and fearGulnaz’s mother expressed a fear that all the mothers and other family members seemed to have.
My husband could say: You are at home all the time and still you cannot control Gulnaz? Why are mothers at home? It is to look after and watch their daughters. (Gulnaz’s mother).
Saba’s mother said that all families lived in fear of what could happen to their daughters. Saba’s and Nusrat’s older sisters, who were in puberty, mainly stayed indoors in their homes. Although these mothers were Christian, not Muslim, they referred to purdah and izzat (honour). They said This is our Pakistani culture or Punjabi culture or just our traditions.
Nusrat’s parents withdrew her from a school for girls with hearing impairments because no one could accompany her to and from school.
Because we do not have an older family member who can accompany girls to and from school. And suppose the school bus did not come to take her one-day. Then she would be left to herself on the road. And something could happen to her out there. (Nusrat’s mother)
When Saba’s sister reached puberty, she could no longer accompany Saba to the CBR group a few hundred meters from their home. Her nine-year-old brother and some female CBR workers stepped in.
In our Pakistani culture it is inappropriate that a man who is not a family member comes to fetch a girl for school or here to the group. He cannot hold her hand or lift her in and out of a bus. (CBR worker)
Angela’s mother explained that presently her oldest daughter was Angela’s right hand, giving her practical help, indoors and outdoors. Family members or neighbours that the family trusted accompanied Angela to and from the school bus. When my oldest daughter gets married and moves away from home, Angela will probably be much more isolated. Soon Mariam would not be allowed to move around in the local area, and this would be an obstacle to her continued education. Mariam’s mother considered her daughter to be not so clever and she expected the knowledge she acquired not to be sufficiently protective, not a good enough shield.
Proactive facilitators The mothers had no knowledge about existing CBR or educational programs for children with disabilities, until CBR workers in the slum area where they lived contacted them. A woman came, said Gulnaz’s mother and she said let your daughter come to us and we will educate her.
70
INTERNATIONAL JOURNAL OF SPECIAL EDUCATION Vol 24 No 1 2009
When she was a child, I often thought about what would happen. If she would ever learn anything. But Mariam has, with God’s help, grown up, started to talk and later to walk. And with the help of the CBR workers and ourselves, she behaves very well. (Mariam’s mother)
Resource persons from the CBR project had also helped the parents of Shakila, Angela and Nusrat to apply for enrolment in special schools. They had accompanied the parents to their first meetings with the educational system, and continued to give those who needed it help with homework and financial support for prostheses, glasses and hearing aids.
DiscussionThe mothers’ views about the importance of education for their daughters with disabilities were related to the aspects enlightenment, empowerment and protection. Each mother’s decision in relation to each of these aspects was influenced by the nature of the daughter’s impairment, by the need for ensuring the girl’s protection and by the support received from the extended family. Moreover, aspects related to mothers’ risk-taking in meeting the outside world also influenced their views.
Important aspects of enlightenment, empowerment and protection The mothers in the present study valued several aspects of enlightenment, empowerment and protection through education. Aspects of enlightenment included acquiring general knowledge, being able to read and write, increasing the prospects of getting a job and having a better life.
Aspects of empowerment included being better equipped for a future life either as wives in another family, as divorced or as unmarried sisters. As in a study by Weiss (2001), this study found that many mothers regarded education to be the most important dowry for their daughters. In-laws in the case of divorce cannot take knowledge, as opposed to for example gold, TV sets and furniture, away. The mothers hoped that educated daughters would be met with more respect in a family-in-law, that literacy, numeracy and writing would enable them to communicate with their own family and manage their household economy in their new family, that skills in sewing and other handicrafts would lessen the burden of having them in a household. The protecting aspect included reducing the chance that a daughter could bring shame upon herself and her family and preventing her from being abused.
Some impairments are more disabling than othersWhether impairment represents a substantial disability for an individual depends on a complex relation between the individual’s impairment and the needs and expectations of the family, neighbourhood and society. An intelligent and resourceful girl like Saba could be considered seriously disabled even if she only had lame legs, as they phrased it, while a girl like Nusrat who has a hearing impairment was expected to be perfectly capable of taking care of a household.
This study has shown that in a society with extensive gender segregation, escort to and from school plus a need for practical help and support represent special challenges for girls with movement and visual impairments or with intellectual impairments. Practical support has to be given by people that the families trust or by family members. Otherwise, access to education after puberty would be difficult or impossible.
Hiding or caring?Several researchers have drawn attention to the stigma and feelings of shame that families with daughters with disabilities may experience. Stigma may lead to isolation of girls in the family’s home (Miles & Miles, 1993; Maqbool, 2000; Shazadi, 1999, 2000). However, as also observed by Ingstad (1995), the isolation or segregation may be interpreted as concern and care. Unmarried women, with or without disabilities, are vulnerable in public in the geographical area of the present study. Girls with developmental disabilities were especially vulnerable. Mothers could not accept practical support from a non-maharam male. Miles also notes that many families of girls with developmental disabilities in Pakistan expressed anxiety that their daughter could cause shame on the family’s honour, especially when izzat (honour) is bound up with the sexual innocence of daughters (1992, 247).
An issue for the extended familyAs in Crabtree’s study from UAE (2007) and Cavkaytar, Batu, & Cetin’s study from Turkey (2008), the mothers had an important task in making their husbands and their families accept the child with a disability. At the same time the mothers had to show due respect to their own roles as females in the families. Grandparents or other heads of the families had to agree and cooperate about necessary
71
INTERNATIONAL JOURNAL OF SPECIAL EDUCATION Vol 24 No 1 2009
economic and practical priorities. Haq claims that in South Asia it often seems that the interaction between, on one hand, religious and cultural beliefs and practices (“tradition”) and on the other, contemporary, globalized social and economic forces (“modernity”), occurs in such a way that structures of patriarchy are reinforced (2000, 30). Based on experience from research and daily life, Weiss claims that there is one domain where men wield power over women within a family: in their absolute control over women’s mobility and that men have stopped girls from going to school, from applying for jobs, from travelling, or when to enter purdah (2001, 68). The findings in the present study show that mothers’ positive attitudes were important, but insufficient, for ensuring that a family decided to have a girl with a disability enrolled in an educational programme.
Taking the risk The educational system in Pakistan has neglected children with special needs (Lari, 1996). When the mothers in this study prioritized education for their daughters with disabilities, they were not supported by tradition. The mothers showed varying degrees of reluctance, skepticism and trust towards modern life styles. Parents’ perspectives on the importance of education for persons with disabilities are influenced by processes of change and by multiple cultural discourses in a society (Ghai, 2002).
The mothers who prioritized education for their children with disabilities expressed more trust and faith in what one mother called the world out there than the other mothers did. They were less concerned with tradition as the main guide for making decisions about education for their children. They had tried to influence their husbands to have more positive views on education also for their daughters with disabilities.
The mothers that expressed more scepticism, invested in fewer years of education for all their children and they arranged for earlier marriages. The mothers viewed an exposure to the public outside the slum area as risky. Only when they had confidence and trust in the expert system did they choose to take the risk anyway. According to Giddens (1990), trust as a form of confidence, or confidence in something, has a certain pragmatic character, and this is illustrated in the present study.
Research from Arab societies has also shown that women are especially vulnerable in processes of change in societies (Ibrahim & Hopkins, 1977). They live closest to value conflicts and tensions that result from such processes. They are often given the role of managing values and perceptions linked to tradition and at the same time are expected to adapt to changes where old and new values are in conflict (Ibrahim & Hopkins, 1977).
As found in recent studies from South India (Jacob, 2005) and from the UK (Cole, 2005), the mothers in the present study were concerned that their daughters were cared for, treated well and respected within the educational system and by their neighbours on their way to and from school. Another concern was whether the results were worth the risk, meaning that the education was of relevance for their daughters’ future life. This study showed that family members, and particularly mothers, need sufficient support and help in their encounters with the expert systems of modernity.
Giddens (1990) describes access points as points of connections between lay individuals and representatives of abstract systems. The CBR program functioned as an access point for these families. CBR employees, teachers, administrative personnel and school bus drivers were especially important. The CBR workers’ facilitation helped the mothers to take the risk, to establish trust and open the path towards educational programmes for the girls with disabilities.
ConclusionThe study illustrates the interaction between, on one hand, cultural aspects and behaviour patterns in their context, and on the other hand individually positioned actors within this context, as described by Ingstad & Whyte (1995). The complexity of values, attitudes and choice that was found within a single neighbourhood, illustrates this. Weiss’s (2001) studies of society and gender in Pakistan, especially in Punjab, support these findings of diversity in family interpretations of religious and social values, own preferences and traditions – factors that affect, for example, whether or not daughters are sent to school. The mothers who already had children in school were most eager to get their daughters with disabilities into school. They had already met the school system, and this may have reduced the feeling of risk and fear that Giddens (1990, 1991) describes, and may have contributed to building some trust in meeting the outside world and letting someone outside their family take care of their daughters. Some had also experienced that a modern school system may contribute to more knowledge than one
72

INTERNATIONAL JOURNAL OF SPECIAL EDUCATION Vol 24 No 1 2009
mother may, or to read about one hundred ways as one mother in this study phrased it. In a process of change from traditional to more modern societies, mothers’ feelings of security and trust towards professionals and the school system will influence their views and efforts regarding education for a daughter with a disability. Some mothers will need assistance from proactive facilitators, such as CBR workers in this study had done.
The mothers’ views about the value of education, as enlightening, empowering or protecting, were influenced by their assumptions regarding the future roles of their daughters. All mothers hoped that education would protect and empower their daughters when the parents are dust. They were concerned that the girls would learn something that would enable them to either support themselves or contribute in a future extended family or family-in-law, whether they would stay unmarried, would marry or become divorced. A hearing impairment was expected not to interfere with the ability to do housework and with the possibility of being married, while a visual impairment or mobility impairment would. Some mothers emphasized the value of being able to read and write letters as a means for a married daughter to keep in touch with her family and for a girl who is deaf to communicate with family members. The mothers expected an educated girl to be met with more respect in a family-in-law.
The consequences of a specific kind of impairment may differ depending on contextual factors. In order to protect a girl’s and family’s honour, transportation or escort to and from school may be needed for girls who cannot walk alone or who, for example due to an intellectual impairment, do not know how to behave in a way considered acceptable in that specific socio-cultural context. The transport or escort must be given by a family member or by another person that the family trusts.
Strategies and programmes aiming at achieving Education for All, Allall, must ensure that girls with disabilities are targeted. Mothers’ voices should be listened to, as they have a central role concerning their children’s education. Unless mothers experience that education meets real needs of their daughters with disabilities and unless they trust that their daughters with disabilities will be protected and be met with respect in school, families may not prioritize education for their daughters with disabilities.
ReferencesCavkaytar, A., Batu, S. & Cetin, O. B. (2008). Perspectives of Turkish mothers on having a child with developmental disabilities. International Journal of Special Education, 23(2), 102-109.Crabtree, S. A. (2007). Family responses to the social inclusion of children with developmental disabilities in the United Arab Emirates. Disability & Society, 22(1), 49-62.Gadamer, H. G. (1960). Truth and method. London: Sheed & Ward.Gall, M. D., Gall, J.P. & Borg, W.R. (2003). Educational research: An introduction. New York: Longman.Ghai, A. (2002). Disability in the Indian context: post-colonial perspectives. In M. Corker & T. Shakespeare (Eds.), Disability/postmodernity: embodying disability theory (pp. 88-100). London: Continuum.Giddens, A. (1990). The consequences of modernity. Cambridge: Polity Press.Giddens, A. (1991). Modernity and self-identity: Self and society in the late modern age. Cambridge: Polity Press.Gilani, S.Z. (2001). Personal and social power in Pakistan. In A. M. Weiss & S.Z Gilani (Eds.), Power and civil society in Pakistan (pp. 49-65). Karachi: Oxford University Press.Haq, M. u. (2000). Human Development in South Asia 2000: The gender question. Karachi: Oxford University Press.Ibrahim S. E. & Hopkins, N. S. (Eds.). (1977). Arab society in transition. A reader. Cairo: American University in Cairo.Ingstad, B. (1995). Mpho ya Modimo - A gift from God. Perspectives on "attitudes" toward disabled persons. In B. Ingstad, S.R. Whyte (Eds.), Disability and culture (pp. 246-263). Los Angeles: University of California.Ingstad, B. & Whyte, S. R. (1995). Disability and culture: An overview. In B. Ingstad & S. R. Whyte (Eds.), Disability and culture (pp. 3-32). Los Angeles: University of California.Jacob, N. (2005). Educating children with visual impairments in rural South India: examining maternal belief profiles. Disability & Society, 20(3), 277-291.Jilani, A. (Ed.). (2001). The state of Pakistan’s children 2001. Islamabad: The Scholarly Publishing & Academic Resources Coalition.Klein, H. G. & Nestvogel, R. (1992). Women in Pakistan. Lahore: Vanguard Books.
73

INTERNATIONAL JOURNAL OF SPECIAL EDUCATION Vol 24 No 1 2009
Lari, S. Z. (1996). Country briefing. Special education in Pakistan. European Journal of Special Needs Education, 11 (3), 337-351.Maqbool, S. (2000). Situation of disabled women in South Asia. Pakistan Special, 5, 56-57.Miles, C. & Miles, M. (1993). Education and disability in cross-cultural perspective: Pakistan. In S. Peters (Ed.), Education and disability in cross-cultural perspective (pp.167-235). New York: Garland.Miles, M. (1992). Concepts of mental retardation in Pakistan: toward cross-cultural and historical perspectives. Disability, Handicap & Society, 7(3), 235-255.Miles, M. B. & Huberman, A.M. (1984). Drawing valid meaning from qualitative data: Toward a shared craft. Educational researcher, 13(5), 20-30.Mirza, J. (2002). Between chaddor and the market. Female office workers in Lahore. Karachi: Oxford University Press.Olsen, M. (2004). ‘Det er et morshjerte som taler.’ Om kunnskapens berikelse, bestyrkelse og beskyttelse for jenter med funksjonsnedsettelser. [‘A mother’s heart is speaking.’ Enrichment, empowerment and protection through education for girls with disabilities]. Oslo: University of Oslo: A Master’s thesis.Papanek, H. (1973). Purdah: Separate worlds and symbolic shelter. Comparative studies in society and history, 15(3), 289-325.Rao, S. (2006). Parameters of normality and cultural constructions of ‘mental retardation’: perspectives of Bengali families. Disability & Society, 2(2), 159-178.Shahzadi, S. (1999). Disability in Pakistan. An historical perspective: the status of disabled women. International Journal of Special Education 14(2), 31-35.Shahzadi, S. (2000). Aspiration of parents and siblings of mentally retarded children. Pakistan special, 5(6), 22-24.Shweder, R. A. (1984). A colloquy of culture theorists. In R. A. Shweder & R.A. LeVine (Eds.), Culture theory. Essays on mind, self, and emotion (pp. 1-27). Cambridge: Cambridge University Press.Stang Dahl, T. (1997). The Muslim family: a study of women’s rights in Islam. Oslo: Scandinavian University Press.Strauss, A. & Corbin, J. (1998). Basics of qualitative research. Second edition. London: Sage.Sulman, N. (1999). Comparative study of the parents’ attitudes towards their mentally retarded children. Pakistan Journal of Special Education (2), 21-34.UNESCO (2004). EFA Global Monitoring Report. The quality imperative. Paris: UNESCO.UNESCO (2008). EFA Global Monitoring Report. Education for all by 2015: Will we make it? Paris: UNESCO.Weiss, A. M. (2001). Gendered power relations: perpetuation and renegotiation. In A. M. Weiss & S.Z. Gilani (Eds.), Power and civil society in Pakistan (pp. 65-93).
74

INTERNATIONAL JOURNAL OF SPECIAL EDUCATION Vol 24 No 1 2009
UNDERSTANDING THE CAUSESOF INTERMEDIATE AND MIDDLE SCHOOL COMPREHENSION PROBLEMS
Anthony Palumboand
Vito LoiaconoLong Island University
Special education teachers working in intermediate grades and in middle school grades face many challenges as they teach both developmental reading skills and subject matter material. Not only must they deal with the increased vocabulary and domain demands of teaching informational text, they must also handle the needs of students who have not yet mastered basic reading skills. The complexity of this task is reflected in recent NAEP fourth-grade reading scores that show approximately 30 percent of fourth-grade students reading at a proficient level or higher in the United States. While increased attention to vocabulary growth and exposure to informational text in primary grades may eventually ameliorate this problem in fourth-grade and beyond, currently intermediate and middle school teachers need instructional strategies they can use to foster reading skills, develop vocabulary, and teach subject matter comprehension to all students. We believe that current technology offers both special and general education teachers teaching at these levels the opportunity to use instructional cloze to improve students’ reading ability and enhance subject matter knowledge.
Scope of the problemThe percentage of American students who have difficulty with reading comprehension in fourth-grade and beyond remains high even though there has been a recent emphasis on comprehension research and teaching (Pressley, 2004). Data from the National Assessment of Educational Progress (NAEP) show that from 1992 and 2005 approximately 30 percent of fourth-grade students in the United States read at a proficient level or higher and approximately 36 percent of fourth-grade students read below the basic .students performing at or above basic level decreased from 80 percent in 1992 to 73 percent in 2005. Twelfth-grade students scoring at or above the proficient level declined from 40 percent to 35 percent. According to a Carnegie Report, nearly half of all 17-year-olds read at or below a ninth-grade level (de Leon, 2002).
Durkin’s (1978/1979) finding that comprehension in grades three through six is often assessed but seldom taught casts a long shadow over American reading instruction. Teachers in her fourth grade sub-study spent less than one percent of their time teaching comprehension and more than 17 percent assessing it. More than twenty years after Durkin’s study, Pressley (2001) noted little had changed. He observed considerably less comprehension instruction than comprehension assessment in classrooms. Shanahan (2007) notes: Given our horrifying literacy statistics (e.g., only 8% of African American boys can read proficiently at 8th grade, the lowest NAEP 12th grade scores in more than 15 years, terrible high school completion rates for Hispanic youth, and the lowest amount of self-selected reading among young adults ever), we shouldn’t be afraid to challenge the status quo—since what we have been doing clearly isn’t working for the kids. (p. 19).
Context and schema and vocabulary need to be interrelated to aid in comprehension Children need to be taught comprehension skills and strategies, but as important as these abilities are, they may not, by themselves, improve comprehension scores for struggling students or disabled readers. Improving student comprehension also requires improving decoding ability, vocabulary knowledge, fluency, world knowledge, and subject knowledge (Pressley, 2004). To understand how
75

INTERNATIONAL JOURNAL OF SPECIAL EDUCATION Vol 24 No 1 2009
this knowledge of schema and vocabulary reinforces and supports comprehension, consider this expansion of a concept made by Hirsch (2006). Many readers would associate the sentence Abraham was told to sacrifice Isaac with a biblical context. But if readers found that sentence on the sports page of a newspaper, the meaning of the words, though not the words themselves, would change for someone familiar with the specialized metaphors of baseball. But placing the sentence in its correct context still does not promote comprehension for a reader who lacks knowledge of baseball and its specialized vocabulary. Context is something, but it is not everything. The special meaning of the word sacrifice (advancing a base runner while making an out) may be too difficult to understand without background knowledge and familiarity with baseball terms.
The comprehension of subject matter material, the material of fourth-grade and beyond, presents a similar challenge for many students. Like our sports page readers, some students lack specific vocabulary knowledge, background knowledge, or an understanding of a subject’s metaphors (Hirsch, 2003). Obviously, a student’s being able to recognize most or all of the words in informational text may not guarantee comprehension of the material. Gregg and Sekeres (2006) point out that students do not necessarily understand the meaning of words they are able to pronounce. Nor do students somehow learn to comprehend complex text as they move through the grades (de Leon, 2002).
Pressley (2000) regards comprehension as a developmental, multicomponential process. To comprehend informational text, students need to be familiar with both the content of the material and possess a general and specific knowledge of the subject and its vocabulary (Hirsch, 2003; Neufeld, 2005/2006). In addition to vocabulary instruction, teachers need to instruct students in the background knowledge of the subject they are reading (Brown, 2007; Hirsch, 2000; Neufeld, 2005/2006; Neuman, 2001). Students who are familiar with a subject learn new material in that subject more quickly than students who do not possess the same depth of knowledge and background understanding. This is the rich getting richer–the other side of the Matthews effect. Researchers focusing on comprehension problems, especially on students who begin having comprehension problems after primary education, think many of these students lack sufficient subject-matter vocabulary and domain knowledge to deal with the demands of expository text (Chall, 2000; Chall, Jacobs, & Baldwin, 1990; Hirsch, 2003).
School organizing patterns influence curriculum, student comprehension, and teachingAmerican students are diverse and begin school with different backgrounds. Some students begin school with vocabulary knowledge of a few thousand words; others have vocabulary two or three times larger than that (Hart & Risley, 1995; Weizman & Snow, 2001). Trying to compensate for these differences, beginning reading instruction uses narrative materials and a vocabulary basic to all students. This approach seems logical, but without informational text as a significant part of the primary grade curriculum, vocabulary and reading skills are decontextualized (Damico, 2005), and not grounded in subject matter learning (Hirsch, 2003). When social studies, science, and math begin to be factored more heavily into the curriculum around grade four, even some primary grade students who read narrative material fluently have difficulty reading and comprehending subject material (Chall, 2000). These organizational problems affect all students, but since the majority of learning disabilities manifest as reading problems, special education students are especially impacted.
Yet we know that children entering school can handle both informational and narrative text. In Pappas’ (1991) study, kindergarten children retold narrative and informational text equally well. Pressley (2001) indicated that comprehension teaching in the primary grades makes an impact on student learning. Reutzel and Cooter (2004) note that both Vygotsky and Piaget posit the interrelationship between cognitive development and language development. Cunningham and Stanovich (1998) have shown that first-grade vocabulary knowledge predicts approximately 30 percent of 11 th-grade comprehension.
This argues for teaching more vocabulary and introducing informational text in the primary grades. Many reading authorities now believe that beginning readers should be taught comprehension skills at the start of their academic careers (Reutzel & Cooter, 2004). Publishers are beginning to respond to this insight by including informational text in their instructional programs as early as first-grade (Kurkjian & Livingston, 2005). Yet, although informational texts help students develop background knowledge and conceptual data, Yopp’s (2006) findings point out that a very small proportion of read-alouds in primary grades involve subject-matter material. Unfortunately, the narrative emphasis found in elementary grades lessens the opportunities for some students to acquire needed subject knowledge that will help their future learning.
76

INTERNATIONAL JOURNAL OF SPECIAL EDUCATION Vol 24 No 1 2009
Challenges for teachersDealing with these subject-matter/comprehension problems becomes a challenge for intermediate grade teachers because they must also deal with students of different reading skills and ability. For example, students in a fourth-grade class can have reading levels that range from grade one to grade seven (Harris & Sipay, 1985). Although primary-grade teachers can differentiate text to meet individual needs, teachers who teach higher grades have a more complex problem. They have to deal with subject matter instruction, developmental reading needs, and with students who have disabilities and who have not yet acquired sufficient reading skills or vocabulary knowledge to handle informational text. As primary teachers do, these teachers can also differentiate text and instruction, but this differentiation must eventually lead to students’ ability to read grade level material. Failure to do so means students will fall further behind grade level as subject demands created by the specialized vocabulary and the conceptual nature of informational text combine to produce still more difficult text and material for students to deal with. Unless struggling readers receive help, they tend to remain poor readers throughout their school career (Juel, 1988).
Although some primary students require more instructional time, more cross genre reading opportunities (Neuman, 2001; Sanacore, 2002), more vocabulary instruction (Chall, 1967; McIntyre et al., 2005), and more opportunities to use vocabulary knowledge in conversation (Miller & Gildea, 1987; Weizman & Snow, 2001), many are at grade level or near grade level readers in third-grade, only to begin to fall behind beginning in intermediate grades, accelerating a downward spiral that increases in middle school and beyond (Chall et al., 1990). What we know about vocabulary, reading volume, and cognitive development (Cunningham & Stanovich, 1998; Stanovich & Cunningham, 1993) argues in the direction of introducing subject matter concepts and subject matter vocabulary earlier than we presently do (Biemiller, 2001; Moss, 2005). Basic subject concepts learned in the primary grades help students deal with enlarged, more sophisticated, but similar concepts presented in the intermediate grades and beyond. Conceptual, articulated curriculum like this works well, especially when an entire school dedicates itself to wide-ranging, developmental subject matter and literacy instruction (Lipson, Mosenthal, Mekkelsen, & Russ, 2004). Intermediate grade teachers meet the complex task of teaching reading skills, comprehension strategies, vocabulary, and the multifaceted problems of subject matter text by using a variety of activities, supports, and scaffolds. One of our favorites is instructional cloze.
Instructional cloze revisitedInstructional cloze offers teachers a number of benefits and can help them meet many of their classroom goals: cloze can engage students in subject matter knowledge, help with word recognition problems, teach subject vocabulary, and improve reading skills. Although instructional cloze has a successful history (Jongsma, 1980), it is often overlooked because cloze exercises were difficult for teachers to create and modify in the past. Recently, though, the Internet and the proliferation of word processing programs have created instructional opportunities for using cloze in classrooms. Used with other strategies, instructional cloze now meets many teachers’ needs. Cloze creates excellent summaries and reviews, engages students with text, focuses vocabulary instruction (Curtis & Longo, 2001), allows teachers to use vocabulary learning to foster word recognition development, can convert subject matter text to narrative text, can simplify complex concepts, and can be used for different types of re-reading exercises. And all of these activities have an additional advantage; they can be grounded in subject matter learning.
Taylor introduced cloze in the early 1950s to validate the readability of prose passages (Grant, 1979). His landmark study showed that exact replacement words ranked text in the same order as the Dale-Chall and Flesch readability formulas (Dale, 1999). Cloze mirrors readability because the reader must draw upon three informational sources at the same time–graphophonic, syntactic, and semantic. These skills are regarded as the most proficient processing strategies a reader can use (Thomas, 1978), and their use makes cloze an excellent support system for developmental reading instruction, for supporting comprehension strategies, and for teaching vocabulary and providing background information.
When using cloze as a test for readability, every fifth word is usually deleted, but for instructional purposes Schell (1972) believed that selective deletion worked better. Thomas (1978) also used selective deletion for instructional purposes in exercises of General Context Clues. Sampson, Valmont and Van Allen (1982) successfully used cloze in a third grade setting to increase reading comprehension scores. Jongsma (1980) in a review of cloze instructional research wrote: In summary, it appears that selective deletion systems aimed at particular
77

INTERNATIONAL JOURNAL OF SPECIAL EDUCATION Vol 24 No 1 2009
contextual relationships are more effective instructionally than semi-random deletion systems such as every-nth word or every-nth noun-verb. (p. 17).
How to use Cloze to improve subject matter comprehensionSince technology has made the use of cloze more convenient, teachers can use it for social studies, science, literature, or math. Free downloads are available on the Internet for these subjects, or teachers can use software that helps them create their own exercises. For example, consider how the following social studies cloze exercise [Table 1] created from materials summarized from Barnet Schecter’s book (2002), The Battle For New York, [Table 2] captures the highlights and helps students understand the beginning of the battle, the longest running battle of the American Revolution. This cloze exercise engages students and allows the teacher instructional options to deal with subject matter and reading skills while at the same time providing the teacher with the options of creating a review or a summary. The teacher first taught vocabulary (mostly place names, using structural analysis where needed to improve word recognition skills), used maps and timelines, modeled reading and thinking-aloud. Students read from their text silently in small groups, wrote and asked group questions, and then read orally in their groups to answer teacher created questions. Finally, the teacher used cloze as both a summary review (with a word bank) and then at a later date as a quiz (without the word bank). Students kept the cloze exercises for use as review sheets.
Cloze deletions were aimed at engaging students in subject matter knowledge. Before students attempted the cloze exercise, the teacher made sure students could pronounce the words in the word bank. The students answered as many of the cloze questions as they could from memory, and then they looked back at the story for help. While dealing with subject matter, the teacher handled many reading needs in the classroom—decoding, word recognition, fluency and vocabulary development, and comprehension skills.
Table IInstructional Cloze based on the reading
After the Battle of (__________) British soldiers started landing on (____________________) July 3, 1776, one day before the (________________ ____________________) was signed. Since Washington did not have a (__________), he had to guess where the British would decide to fight, on the Brooklyn part of (___________) Island or on (____________) Island. He decided to (_________) his army and place soldiers on both (___________) Island and (__________) Island.The British commander, (_____________), landed his troops in Brooklyn. Washington decided to defend hills still called (___________ __________). The British soldiers captured a poorly defended road and got (___________) the American soldiers. Washington retreated across the (____________________) to (___________) Island. The American army escaped up a main road that today is called (______________). They won a battle at (____________ ____________).Finally, Washington withdrew across the Hudson River and began a (_____________) across (___________ ____________). On Christmas Eve, 1776, Washington crossed the (______________ _________) to attack and defeat the British at (____________).
WORD BANK – (Some words may be used more than once): East River, behind, Manhattan, Broadway, Boston, Trenton, retreat, Staten Island, Long, New Jersey, split, General Howe, Harlem Heights, Declaration of Independence, Delaware River, Brooklyn Heights, navy.
78
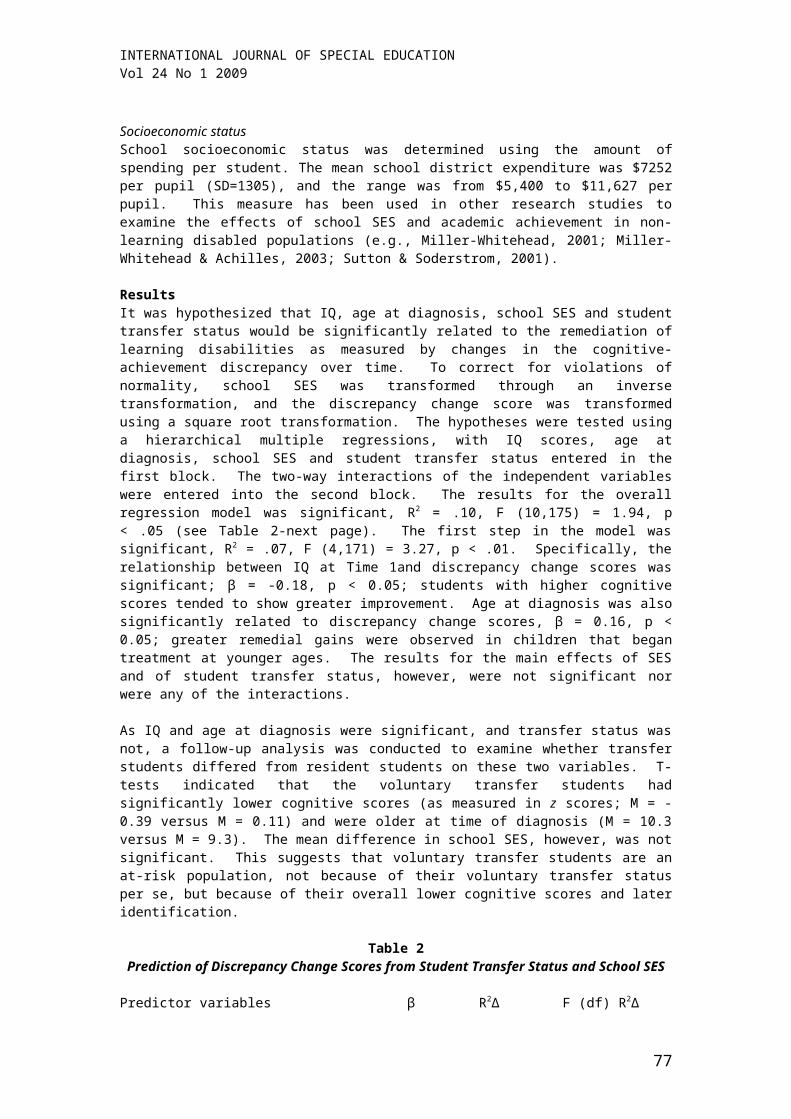
INTERNATIONAL JOURNAL OF SPECIAL EDUCATION Vol 24 No 1 2009
Final ThoughtsIn summary, we believe cloze exercises provide teachers with a flexible instructional device that gives them the ability to control readability, provide a review of material, scaffold and support subject matter learning, and engage students both contextually and semantically. Used with graphic organizers and comprehension strategies, cloze is a useful strategy that helps students conceptualize subject matter, and contextualize vocabulary and developmental reading skills. In addition, by students keeping and then referring to the different cloze reviews used in class, they build cumulative subject knowledge because the cloze exercises function as mini-review texts, and are easier and quicker to refer to than the class text.
Teachers can also use cloze to enhance fluency by combining it with subject matter Readers Theatre. This use of Readers Theatre allows students to rehearse and present social studies, math, science, or language arts scripts in a mix of choral readings, combining whole group, small group, and individual performances. Instead of memorizing lines, students read aloud from their scripts (Graves, Juel, & Graves, 2008). Scenes are not staged and there is little costuming. The focus remains the spoken word, though presentations may be enhanced by the use of music or sound effects. As an extension of the above exercise, parts of the Battle for New York, the Battle of Harlem Heights, Washington crossing the Delaware, or the American victory at Trenton could be researched and scripted by students, or a social studies script dealing with events from the American Revolution could be downloaded from the Internet, practiced, presented, then modified as cloze and used for review and vocabulary development. These coordinating activities succeed in uniting subject knowledge and literacy learning.
References Biemiller, A. (2001). Teaching vocabulary: Early, direct and sequential. The American Educator, Spring. Retrieved March 4, 2007, from http://www.aft.org/pubs_report/American_educator/spring2001/vocab.htmlBrown, C. (2007). Supporting English language learners in content reading. Reading Improvement, 44, 32-39.Chall, J. (1967). Learning to read: The great debate. McGraw Hill.Chall, J. (2000). The academic achievement challenge: What really works in the classroom. New York: Guilford. Chall, J., Jacobs, V., & Baldwin, L. (1990). The reading crisis: Why poor children fall behind. Cambridge, MA: Harvard University Press.
Table 2Subject matter reading
After the Battle of Boston, Lord Howe, the British general, landed troops on Staten Island July 3, 1776. The next day, July 4, the Declaration of Independence was signed. In the next six weeks, the British landed 30,000 more soldiers.General Washington had no navy. He could only watch as the British had control of the sea. They could land men on Manhattan or on Long Island. Washington split his army. He left soldiers on Manhattan. He sent other soldiers to Brooklyn on Long Island. This weakened his army.On August 22, the British landed troops on Long Island. Washington dug in around a group of small hills called Brooklyn Heights. The hills had four roads through them. One road, far from the fighting, had only a few soldiers to defend it.On August 26th, Howe’s troops captured that road and made their way behind the American lines. They also attacked and forced the American troops back. But the British did not follow up their attack. If they had, they might have won the war then.Washington retreated across the East River the night of August 30. The next day the British found that the American army had left.Again Lord Howe did not follow-up his attack. Washington moved his army north. On September 13, Howe attacked across the East River. He just failed to trap Washington’s army. The two armies fought a brief battle at Harlem Heights and the British retreated.In November 1776, Washington withdrew across the Hudson River to New Jersey, stopping at a site close to today’s George Washington Bridge. From there he began a slow retreat across New Jersey before turning and crossing the Delaware River on Christmas Eve, 1776, to attack and defeat the British at Trenton.
79
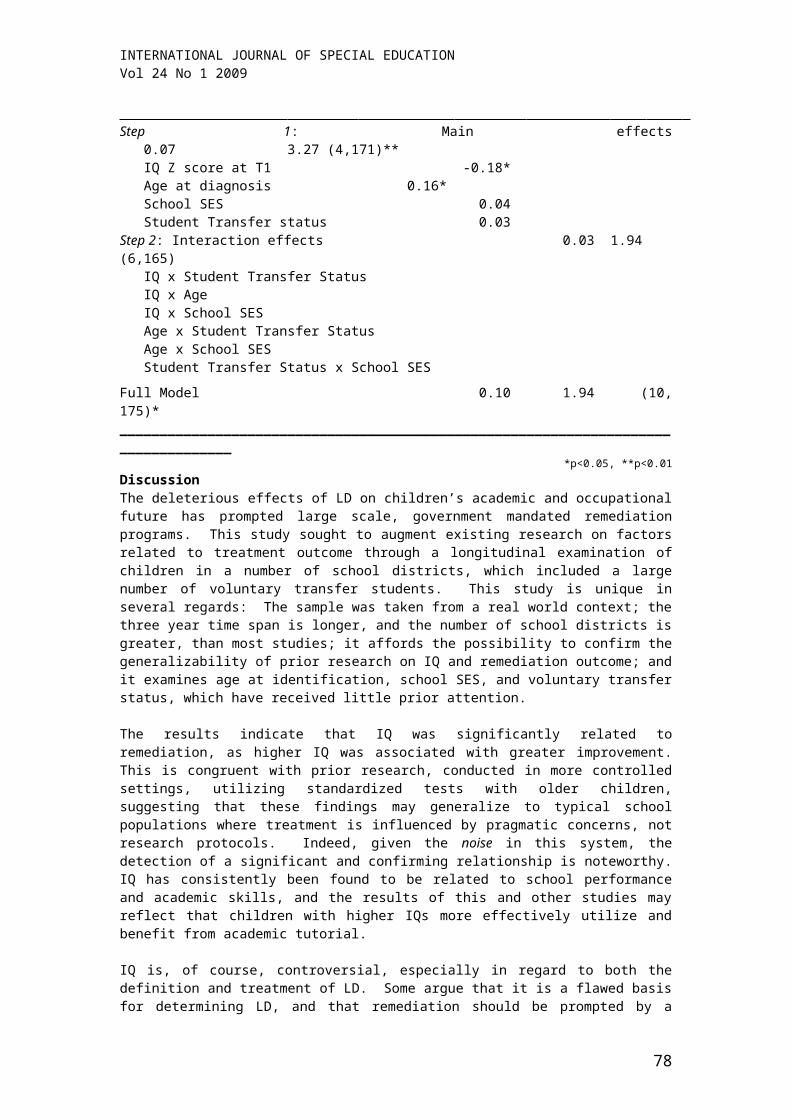
INTERNATIONAL JOURNAL OF SPECIAL EDUCATION Vol 24 No 1 2009
Cunningham, A., & Stanovich, K. (1998). What reading does for the mind. The American Educator, Spring/Summer, 8-15.Curtis, M., & Longo, A. (2001). Teaching vocabulary to adolescents to improve comprehension. Reading Online, 5 (4). Available: http://www.readingonline.org/articles/art_index.asp?HREF=curtis/index.htmlDale, N. (1999). A pilot study using the cloze technique for constructing test questions. The Journal of Computers in Mathematics and Science Teaching, 18, 317-330.Damico, J. (2005). Multiple dimensions of literacy and conceptions of readers: Toward a more expansive view of accountability. The Reading Teacher, 58, 644-652.de Leon, A. (2002). Moving beyond storybooks: Teaching our children to read to learn. Retrieved February 25, 2007, from http://www.carnegie.org/reporter/05/learning/index1.htmlDurkin, D. (1978/1979). What classroom observation reveals about reading comprehension instruction. Reading Research Quarterly, 14, 481-533.Grant, P. (1979). Using the cloze procedure as an instructional device: What the literature says. Paper presented at the Annual Meeting of the International Reading Association (23 rd, Houston, Texas, May, 1978). Graves, M., Juel, C., & Graves, B. (2008). Teaching reading in the 21st Century. Boston, MA: Pearson Education.Gregg, M., & Sekeres, D. (2006). Supporting children’s reading of expository text in the geography classroom. The Reading Teacher, 60, 102-109.Harris, A., & Sipay, E. (1985). How to increase reading ability: A guide to developmental and remedial methods. New York: Longman.Hart, B., & Risley, T. (1995). Meaningful differences in the everyday experiences of young American children. Baltimore, MD: Brookes.Hirsch, E. Jr. (2000). You can always look it up … or can you? The American Educator, Spring, 1-5.Hirsch, E. Jr. (2003). Reading comprehension requires knowledge—of words and the world. The American Educator, Spring, 9-29.Hirsch, E. Jr. (2006). Building knowledge. The American Educator, Spring, 9-24.Jongsma, E. (1980). Cloze instructional research: A second look. Newark, DE: International Reading Association.Juel, C. (1988). Learning to read and write: A longitudinal study of 54 children from first through fourth grade. Journal of Educational Psychology, 80, 437-447.Kurkjian, C., & Livingston, N. (2005). Learning to read and reading to learn: Informational series books. The Reading Teacher, 58, 592-600. Lipson, M., Mosenthal, J., Mekkelsen, J., & Russ, B. (2004). Building knowledge and fashioning success one school at a time. The Reading Teacher, 57, 534-542.McIntyre, E., Jones, Powers, Newsome, Petrosko, Powell, & Bright. (2005). Supplemental instruction in early reading: Does it matter for struggling readers? The Journal of Educational Research, 99, 99-107.Miller, G. & Gildea, P. (1987). How children learn words. Scientific American, 257, 94- 99.Moss, B. (2005). Making a case and a place for effective content area literacy instruction in the elementary grades. The Reading Teacher, 59, 46-55.National Assessment of Educational Progress [NAEP]. (2005). Retrieved February 25, 2007, from http://nces.ed.gov/nationsreportcard/nrc/reading_math_2005/s0005.asp?printver=Neufeld, P. (2005/2006). Comprehension instruction in content area classes. The Reading Teacher, 59, 302-313.Neuman, S. (2001). The role of knowledge in early literacy. Reading Research Quarterly, 36, 468-475.Pappas, C. (1991). Fostering full access to literacy by including information books.Language Arts, 68, 449-462.Pressley, M. (2000). Handbook of Reading Research. In M. Kamil, P. Mosenthal, P. Pearson, & R. Barr (Eds). What should comprehension instruction be the instruction of? (pp.545-561). New Jersey: Lawrence Erlbaum Associates.Pressley, M. (2001, September). Comprehension Instruction: What makes sense now:What might make sense soon. Reading Online, 5(2). Available: http://www.readingonline.org/articles/art_index.asp?Pressley, M. (2004). Comprehension strategies instruction: A turn-of-the-century status Report. Printed in: Issues and Trends in Literacy Education. 3rd edition. Robinson, R., McKenna, M., & Wedman, J. Pearson.Reutzel, D., & Cooter, R. (2004). Teaching children to read: Putting the pieces together. Pearson.
80

INTERNATIONAL JOURNAL OF SPECIAL EDUCATION Vol 24 No 1 2009
Sanacore, J. (2002). Struggling literacy learners’ benefit from lifetime literacy efforts. Reading Psychology: An International Quarterly, 23, 67-85.Sampson, M., Valmont, W., & Van Allen, R. (1982). The effect of instructional cloze on the comprehension, vocabulary, and divergent production of third-grade students. Reading Research Quarterly, 17, 389-399.Schecter, B. (2002). The battle for New York. New York: Walker and Co.Schell, L. (1972). Promising possibilities for improving comprehension. Journal of Reading, March, 415-424.Shanahan, T. (2007). Shanahan responds. Reading Today, 24, 19.Stanovich, K., & Cunningham, A. (1993). Where does knowledge come from? Specific associations between print exposure and information acquisition. Journal of Educational Psychology, 85, 211-229.Thomas, K. (1978). Instructional applications of the cloze technique. Reading World, 18,1-12.Weizman, Z., & Snow, C. (2001). Lexical input as related to children’s vocabulary acquisition: Effects of sophisticated exposure and support for meaning. Developmental Psychology, 37, 265-279.Yopp, R. (2006). Informational text as read-alouds at school and home. Journal of Literacy Research. Retrieved April 3, 2007, from http://www.findarticles.com/p/articles/mi_qa3785/is_200601/ai_n16452268/print
81

INTERNATIONAL JOURNAL OF SPECIAL EDUCATION Vol 24 No 1 2009
SURVEYS OF THE AMERICAN DEAF POPULATION:A CRITICAL REVIEW
Russell S RosenColumbia University
This is a critical review of surveys conducted on the American deaf population since 1990. There is no agreement among the surveys on the number of deaf and hard of hearing individuals in the US. This behooves us to study the question: Why the lack of agreement in estimates and prevalence rates of the American general deaf and the deaf child population across the surveys? Prior studies explained the discrepancies in terms of sampling and probability errors, different survey methodologies, federal mandates, changing medical conditions and fluctuations in prevalence rates. It is proposed here that the estimates are delimited by the mandates, purposes, survey questions, definitions of population cohorts and survey methodologies devised by the surveying institutions
Since 1990 there are different surveying institutions that conducted surveys of the American deaf population, both the general deaf and the deaf child population. They provided definitions of individuals with deafness, estimates and prevalence rates of the total deaf population. Below are two set of tables showing the cohorts, estimates and prevalence rates for the deaf population in the US since 1990 from different surveys. One set of tables, Tables 1 to 7, covers the adult deaf population and another set of tables, Tables 8 and 9, covers the child deaf population.
Adult Surveys: Population Estimates and Prevalence Rates by Demographic SurveysTable 1
Decennial Census—Content Reinterview SurveySURVEY DATES DEFINITIONS POPULATION SIZE PREVALENCE RATES
19901
Covered persons aged 16 and over
Difficulty in hearing what is said in normal conversation 10879622
1 per 25 = 4% of general population
5.82% of total disabled population
Unable to hear what is said in normal conversation 917605
1 per 250 = 0.4% of general population
0.49% of total disabled
populationSource:1-US Bureau of the Census. (2002).
The tables show that different surveys produced different population estimates and prevalence rates. When population estimates for a particular year are compared across surveys, no similarities are seen. For the year of 1991 SIPP counted almost 11 million individuals who have hearing difficulties and NHIS counted about 21 million individuals with hearing impairments. In addition, the surveys do not cover individuals of the same age range. For example, the 1997 SIPP counted about 8.3 million individuals with all ranges of hearing difficulties for six year olds and over and the 1997 NHIS counted close to 35 million individuals aged 18 years and over with hearing trouble. In addition, there are two surveying institutions that counted deaf children and they do not agree on estimates for the same year. The discrepancies between the Child Counts and the Annual Surveys estimates are also found for other years. For the academic year of 2000-2001, for example, the Child Counts counted about 71,000 deaf children and the Annual Survey counted about 43,000 children. For 2003-2004 the Child Counts counted 72,000 children while the Annual Surveys counted about 38,000.
82
INTERNATIONAL JOURNAL OF SPECIAL EDUCATION Vol 24 No 1 2009
Table 2Survey of Income and Program Participation
SURVEY DATES DEFINITIONS POPULATION SIZE PREVALENCE RATES
1991-19921
Covered persons aged 15 and over
Difficulty hearing normal conversation 10928000 5.6% of general population
aged 15 and over
Is unable to hear normal conversation 924000 0.5% of general population
aged 15 and over
1994-19952
Covered persons aged 6 and over
Difficulty hearing normal conversation 10110000 4.3% of general population
aged 6 and over
Unable to hear normal conversation 977000 0.4% of general population
aged 6 and over
1996-19973
Had difficulty hearing conversationAges 6-14
234000 0.7% of general population aged 6-14
Not severe difficulty hearing conversationAges 6-14
177000 0.5% of general population aged 6-14
Had severe difficulty hearing normal conversationAges 6-14
57000 0.2% of general population aged 6-14
Had difficulty hearing conversationAges 15 and over
7966000 3.8% of general population aged 15 years and over
Not severe difficulty hearing conversationAges 15 and over
7134000 3.4% of general population aged 15 years and over
Had difficulty hearing normal conversationAges 15 and over
832000 0.4% of general population aged 15 years and over
2001-20024
Had difficulty hearing conversationAges 6-14
203000 0.5% of general population aged 6-14
Not severe difficulty hearing conversationAges 6-14
164000 0.4% of general population aged 6-14
Had severe difficulty hearing normal conversationAges 6-14
39000 0.1% of general population aged 6-14
Had difficulty hearing conversationAges 15 and over
7830000 3.5% of general population aged 15 years and over
Not severe difficulty hearing conversationAges 15 and over
6859000 3.1% of general population aged 15 years and over
Had severe difficulty hearing normal conversationAges 15 and over
972000 0.4% of general population aged 15 years and over
Sources:1-McNeil, J.M. (1994). 2-McNeil, J.M. (1997). 3-McNeil, J.M. (2001).4- Steinmetz, E. (2004).
83

INTERNATIONAL JOURNAL OF SPECIAL EDUCATION Vol 24 No 1 2009
Table 3National Health Interview Survey
SURVEY DATES DEFINITIONS POPULATION SIZE PREVALENCE RATES
19911
Covered allpersons
Hearing impairments 20295000 8.6% of general population
Deafness 1350000 0.57% of general population19932
Covered allpersons
Hearing impairments 24160000 N/A
19943
Covered allpersons
Hearing impairments 22400000 N/A
19964
Covered allpersons
Hearing impairments N/A 83.4% per 1,000 persons in the general population
19975
Covered persons aged 18 and over
A little trouble hearing 28789000 14.8% of general population
aged 18 years and over
A lot of trouble hearing or deaf 5963000 3.1% of general population
aged 18 years and over
20016
Covered persons aged 18 and over
A little trouble hearing 28411000 14.0% of general population
aged 18 years and over
A lot of trouble hearing or deaf 6998000 3.4% of general population
aged 18 years and over
20037
Covered persons aged 18 and over
Hearing trouble 32533000 15% of general population aged 18 years and over
20048
Covered persons aged 18 and over
Hearing trouble 35135000 16.3% of general population aged 18 years and over
20069
Covered persons aged 18 and over
Hearing trouble 37215000 16.9% of general population aged 18 years and over
Sources:1-Reis, P.W. (1994). 2-Benson, V., & Marano, M.A. (1995). 3-Adams, P.F., & Marano, M.A (19954-Adams, R.F., G.E. Hendershot, & Marano, M.A (1999). 5-Blackwell, D.L., Collins, J.G., & Coles, R. (2002). 6- Lucas, J.W., Schiller, J.S., & Benson, V. (2004).7-Lethbridge-Cejku, M., & Vickerie, J. (2005).8- Lethbridge-Çejku M, Rose D, & Vickerie J. (2006).9- Pleis JR, Lethbridge-Çejku M. (2007).
Table 4National Postsecondary Student Aid Survey (NPSAS)
SURVEY DATES DEFINITIONS POPULATION SIZE PREVALENCE RATES
1989-19901 Hearing impaired or deaf UG6 N/A 1.6% of UG
students
84

INTERNATIONAL JOURNAL OF SPECIAL EDUCATION Vol 24 No 1 2009
Hearing impaired or deaf GIP7 N/A 1.2% of GIP
students
1992-19932
Hearing impaired or deaf UG N/A 1% of UG
studentsHearing impaired or deaf GIP N/A 0.8% of GIP
students
1995-19963
Hearing impaired or deaf UG N/A 0.7% of UG
studentsHearing impaired or deaf GIP N/A 0.5% of GIP
students
1999-20004
Hearing impaired or deaf UG N/A 0.7% of UG
studentsHearing impaired or deaf GIP N/A 0.5% of GIP
students
2003-20045Services needed: sign language or oral interpreters
N/A 0.1% of GIP students
Sources: 1-U.S Department of Education, National Center for Education Statistics. (1991) 2-U.S Department of Education, National Center for Education Statistics. (1994) 3-U.S Department of Education, National Center for Education Statistics. (1997). 4-U.S Department of Education, National Center for Education Statistics. (2001). 5-U.S Department of Education, National Center for Education Statistics. (2005).Notes:6-UG = undergraduates7-GIP = graduates and first-professional
Table 5Beginning Postsecondary Students Longitudinal Study (BPS)
SURVEY DATES DEFINITIONS POPULATION SIZE PREVALENCE RATES
1989-19901 Hearing impairment or deaf N/A19.8% of beginning postsecondary students with disabilities (based on NPSAS:90)
1992-19932 Hearing impairment or deaf N/A15.3% of beginning postsecondary students with disabilities (based on NPSAS:90)
1993-19943Hearing impaired postsecondary students
N/A 0.3 % of postsecondary students (based on NPSAS:96)
1995-19964Hearing impaired postsecondary students
N/A 0.6% of postsecondary students (based on NPSAS:96)
2003-20045 Service needed: Sign language or oral interpreters N/A 0.1% in 4-year institutions
of higher education
Sources1-U.S Department of Education, National Center for Education Statistics. (1995a). 2-U.S Department of Education, National Center for Education Statistics. (1995b). 3-U.S Department of Education, National Center for Education Statistics. (1995c). 4-U.S Department of Education, National Center for Education Statistics. (2002a). 5-U.S Department of Education, National Center for Education Statistics. (2007).
Table 6Baccalaureate and Beyond Longitudinal Study (B&B)
85

INTERNATIONAL JOURNAL OF SPECIAL EDUCATION Vol 24 No 1 2009
SURVEY DATES DEFINITIONS POPULATION SIZE PREVALENCE RATES
1993-19941Service needed: Sign language or oral interpreters
N/A0.6% of postsecondary students (based on NPSAS:93)
1999-20002Service needed: Sign language or oral interpreters
N/A0.5% of postsecondary students (based on NPSAS:2000)
Sources: 1-U.S Department of Education, National Center for Education Statistics. (1998). 2-U.S Department of Education, National Center for Education Statistics. (2002b).
Table 7
Survey on Deaf and Hard of Hearing Postsecondary StudentsSURVEY DATES DEFINITIONS POPULATION SIZE PREVALENCE RATES
1989-19901
Hard of hearingpostsecondary
students5950 N/A
Deaf postsecondarystudents 3610 N/A
Did not distinguish between deaf and hard of hearing 7470 N/A
1990-19912
Hard of hearingpostsecondary
students6740 N/A
Deaf postsecondarystudents 3750 N/A
Did not distinguish between deaf and hard of hearing 7860 N/A
1991-19923
Hard of hearingpostsecondary
students7500 N/A
Deaf postsecondarystudents 4220 N/A
Did not distinguish between deaf and hard of hearing 7730 N/A
1992-19934
Hard of hearingpostsecondary
students7770 N/A
Deaf postsecondarystudents 4520 N/A
Did not distinguish between deaf and hard of hearing 7750 N/A
Sources:1- Lewis, L., & Farris, E. (1994).2- Lewis, L., & Farris, E. (1994).3- Lewis, L., & Farris, E. (1994).4- Lewis, L., & Farris, E. (1994).
Child Surveys: Population Estimates and Prevalence Rates by Demographic Surveys Table 8
Child CountsSURVEYDATES
DEFINITIONS POPULATIONSIZE
PREVALENCERATES
1990-19911 Children with hearing 60145 1.2% of disabled
86

INTERNATIONAL JOURNAL OF SPECIAL EDUCATION Vol 24 No 1 2009
impairments= Children aged 6 to 21 years old who are diagnosed as deaf and hard of hearing and who
receive IEP.
student population
1991-19922 60727 1.2% of disabled student population
1992-19933 60616 1.2% of disabled student population
1993-19944 64665 1.2% of disabled student population
1994-19955 65204 1.2% of disabled student population
1995-19966Children with hearing
impairments= Children aged 6 to 21 years old who are diagnosed as deaf and hard of hearing and who
receive IEP.
68039 1.2% of disabled student population
1996-19977 68773 1.2% of disabled student population
1997-19988 69783 1.2% of disabled student population
1998-19999 70786 1.2% of disabled student population
1999-200010
Children aged 3 to 5 years old 7751 1.3% of disabled
student population
Children aged 6 to 21 years old 70810 1.1% of disabled
student population
2000-200111
Children aged 3 to 5 years old 7240 1.2% of disabled
student populationChildren aged 6 to 21 years
old 71225 1.2% of disabled student population
2001-200212
Children aged 3 to 5 years old 7237 1.1% of disabled
student populationChildren aged 6 to 21 years
old 71962 1.2% of disabled student population
2002-200313
Children aged 3 to 5 years old 7496 1.1% of disabled
student populationChildren aged 6 to 21 years
old 72023 1.2% of disabled student population
2003-200414Children aged 3 to 5 years
old 7824 1.1% of disabled student population
Children aged 6 to 21 years old 72626 1.2% of disabled
student population
2004-200515
Children aged 3 to 5 years old 7846 1.1% of disabled
student populationChildren aged 6 to 21 years
old 72387 1.2% of disabled student population
2005-200616
Children aged 3 to 5 years old 8208 1.1% of disabled
student populationChildren aged 6 to 21 years
old 72559 1.2% of disabled student population
Sources:1-16 Office of Special Education Programs. (1992-2007).
Table 9Annual Survey of Deaf and Hard of Hearing Children
SURVEY DATES DEFINITIONS POPULATION SIZE
1989-19901 Hearing impaired children 46666
87

INTERNATIONAL JOURNAL OF SPECIAL EDUCATION Vol 24 No 1 2009
Receiving primary orsecondary special educational
services
1991-19922 47822
1993-19944 47014
1994-19953All deaf and hard of hearing children
receiving special educational services
47616
1996-19974
Deaf children in all schools 50629
Deaf who received special education services 43267
1999-20005 Deaf who received special education services 43861
2000-20016 Deaf who received special education services 43416
2001-20027 Deaf who received special education services 42361
2002-20038 Deaf who received special education services 39493
2003-20049 Deaf who received special education services 38177
2004-200510 Deaf who received special education services 37500
2006-200711 Deaf who received special education services 37352
No information is available for the year of 2005-2006. Sources:1- Schildroth, A.N., & S.A. Hotto. (1991).2- Schildroth, A.N., & S.A. Hotto. (1993).3-Schildroth, A.N., & S.A. Hotto. (1996). 4-Holden-Pitt, L,. & J.A. Diaz. (1998). 5-Gallaudet Research Institute. (2001). 6-Gallaudet Research Institute. (2002). 7-Gallaudet Research Institute. (2003a). 8-Gallaudet Research Institute. (2003b). 9-Gallaudet Research Institute. (2005a). 10- Gallaudet Research Institute. (2005b).11- Gallaudet Research Institute. (2006).
As seen in the tables above, most surveys included prevalence rates that were calculated as the number of individuals with deafness divided by the total general population, both deaf and hearing. This suggests that the surveys see the estimates to represent the total deaf population in the US. However, there are differences across surveys in prevalence rates and the age groups they covered for the same year. In the 1991 SIPP the prevalence rate was 6.14% of the general population of 15 year old and over and in the 1991 NHIS it was 9.17% of the total general population. In the 1997 SIPP the rate was 4.5% of the population of 6 year old and over and in the 1997 NHIS it was 18% of the population of 18 year old and over. Furthermore, as indicated in the table, the prevalence rates in Child Counts and Annual Surveys are not comparable. The prevalence rates in Child Counts are calculated as the number ofchildren with deafness, divided by the total population of children with disabilities. The Annual Surveys did not provide the prevalence rates.
The tables behoove us to study the question: Why the divergences in estimates and prevalence rates of the American general deaf and the deaf child population across the surveys?
Various demographers offered several explanations for the variations in population estimates across surveying institutions. Demographers who studied American deaf population surveys such as Reis (1994) and Schein (1996) explained that the population estimates have in-built sampling and probability errors. Sampling errors occur as a result of misclassifications of individuals into population cohorts whereby some are counted and others are overlooked. Probability errors are caused by
88
INTERNATIONAL JOURNAL OF SPECIAL EDUCATION Vol 24 No 1 2009
miscalculations in population estimates. Schein (1996) added that sampling errors and fluctuations in prevalence rates in the US over time caused variations in population estimates. Schildroth and Hotto (1996) and Holden-Pitt and Diaz (1998) saw that population estimates are impacted by changing medical conditions and federal mandates on education that affected the size and distribution of children in schools and programs for the deaf. One demographer, Reis (1994), proposed that different survey methodologies and population cohorts create variations in estimates across different surveys in the US. For these demographers sampling and probability errors, different survey methodologies, federal mandates, changing medical conditions and fluctuations in prevalence rates over a number of years are the causes for the differences in population estimates across surveys.
However, an investigation of survey reports reveals that the reasons for the differences in population estimates across surveys conducted by different surveying institutions go beyond those that are proposed in the demography literature. In the ensuing discussion this researcher proposes an alternative explanation for the differences in population estimates. In order to understand divergences in population estimates produced by different surveying institutions, this researcher utilizes a critical demography model.
A recent paradigm in population studies, critical demography examines the relationship between population estimates and the social systems of the surveying institutions (Horton, 1999). Scherper-Hughes (1997) and (Horton, 1999) argued that the agendas, or policies and practices, of the surveying institutions conceptualize a population cohort, structure the questions asked, enumerate individuals into certain cohorts, often to the exclusion of others, and shape the findings. Critical demography also holds that population estimates are delimited to certain population cohorts that respond to survey questions that are constructed in accordance with the agendas of the surveying institutions (Hammel & Howell, 1987; Demeny, 1988; Greenhalgh, 1996; Scherper-Hughes, 1997; Riley, 1997, 1999; Black, Gates, Sanders, & Taylor, 2000). In addition, the surveys are not initiated without purpose and funding by individuals, organizations and constituencies that establish the agenda, design and conduct the surveys, and use survey data to assess and legitimatize their agendas, programs and services. In order to understand the lack of agreement in population estimates across surveys, one needs to understand that the different estimates are the result of the different needs and purposes, survey questions and methodologies and definitions of population cohorts of the surveying institutions.
In this review of surveys this researcher argues that each survey of the American deaf population has different purposes, surveying methodologies, definitions of deafness and population cohorts that effect on population estimates and prevalence rates, and that the different purposes, methodologies and definitions of population cohorts across surveys create for differences in population estimates and rates. The purpose of this review is to examine the ways in which the mandates and purposes of the surveying institutions determine the way survey questions are framed, cohort definitions are constructed, methods of enumeration are formulated and estimates are calculated. This researcher will show how different surveying institutions created different estimates because they have different mandates, agendas, survey methods and definitions of population cohorts.
A Critical Review of SurveysSurvey mandatesAll surveys were mandated and funded by the US Congress. Since the mandates for all surveys originated from one authorizing source, it is anticipated that all surveys share the same mandates, survey methodologies, population cohorts and population estimates. However, it is not so. While all surveys, with the exception of the Annual Survey of Deaf and Hard of Hearing Children, were mandated and funded by the US Congress, not one surveying institution compiled demographic figures for the entire American deaf population. Each survey has a different history, was complied by different and competing constellations of federal, public and private service agencies and was mandated by different acts of Congress. Congress provided funding and support to the US Department of Commerce, the US Department of Health and Human Services, the US Department of Education, and Gallaudet University to conduct the surveys. The US Department of Commerce, through its Office of the Bureau of the Census, conducted two surveys of the general American deaf population. They are the Content Reinterview Survey (CRS) and the Survey of Income and Program Participation (SIPP). An Act of Congress established the annual census in the 19 th century. The SIPP was mandated in Title 13, USC Section 182 of ADA in 1990. The Department of Health and Human Services performed the
89
INTERNATIONAL JOURNAL OF SPECIAL EDUCATION Vol 24 No 1 2009
National Health Interview Survey (NHIS). The NHIS is a result of congressional reorganization of the Census Bureau and the creation of the Center of Disease Control in mid-1950.
The US Department of Education conducted several surveys through its centers, programs and offices. The Postsecondary Education Program of the Center for Education Statistics (NCES) of the US Department of Education performed several surveys on adults attending postsecondary education. The NCES surveys that contain information on deafness are the National Postsecondary Student Aid Survey (NPSAS), the Beginning Postsecondary Students Survey (BPS), and the Baccalaureate and Beyond Longitudinal Survey (B&B).what is this? (This is the acronym used to refer to the survey, e.g. B&B: 97.) The NCES is established by congressional action, with NPSAS formed since mid-1980s, the BPS is mandated by PL103-382, and the B&B followed the NPSAS survey of 1990. The Office of Special Education and Rehabilitation Services (OSERS) of the US Department of Education conducted three surveys of American deaf student population. Its Office of Special Education Programs (OSEP) compiled the Survey on Deaf and Hard of Hearing Students in Postsecondary Education and the annual Child Counts. The Survey on Deaf and Hard of Hearing Students in Postsecondary Education was requested by OSEP in 1993. The Child Counts Survey was mandated in IDEA of 1990, PL101-476, which is a result of a succession of laws promoting special education starting from PL89-313 in 1968, to PL94-142 for EACHA in 1974, and PL99-457 in the EHA in 1986. The OSERS, in contract with the Research Institute of Gallaudet University, also performed another annual survey, the Annual Survey of Deaf and Hard of Hearing Children. A contract between the old Bureau of the Education of the Handicapped of the old US Department of Health, Education, and Welfare and Gallaudet University in 1968 initiated the Annual Surveys.
Needs and purposes of surveying institutionsThe surveying institutions differed in the congressional mandates for conducting their surveys of the deaf population. The different mandates for the surveys arose because of different needs and functions of the surveying institutions. The different functions and needs of the surveying institutions have generated different purposes for the surveys. The surveying institutions conduct surveys largely for the purpose of gathering information on the appropriation and effectiveness of the missions, programs and services of the surveying institutions. Each survey focuses on different aspects of deafness that are integral to the missions, programs and services of the surveying institutions, which reflect different juxtapositions between deafness and society.
The US Department of Commerce has several functions. One is to monitor demographic trends in the US population. It needs information on the characteristics, size, dispersion and trends in the number of individuals who experience hearing difficulties. It conducts CRS surveys for the purpose of gathering information on the American deaf population aged 16 and over in their abilities to use hearing in order to participate in society, to perform societal tasks, and to live independently (US Census Bureau, 1997). With this information the Commerce Department makes policy and appropriations for public and private programs and services for individuals with hearing difficulties (US Census Bureau, 1997).
Another function of the Commerce Department is to monitor labor and employment patterns in the general deaf and hard of hearing population. It needs information on the employment of deaf people, and conducts SIPP surveys for the purpose of collecting information on persons and households with hearing disability conditions and its relationship with employment, self-help, and participation in labor force and in federal and state government subsistence programs (McNeil, 1994, 1997, 2000, 2001). With this information the Commerce Department identifies gaps in program needs and program participation, make appropriations of funds, and establish programs and services (McNeil, 1994, 1997, 2000, 2001).
The US Department of Health and Human Services has the function to monitor the health and general well being of deaf people. It needs information on the health and general well being of deaf people, and conducts NHIS surveys to find information on hearing ability as an aspect of personal health and societal functioning. With the information the Health Department can assess public health programs and services and determine allocation of resources (Reis, 1994; Benson & Marano, 1995; Adams & Marano, 1995; Blackwell, Collins, & Coles, 2002).
The US Department of Education has several responsibilities for monitoring the participation, services, and programs in education institutions by individuals with deafness. One responsibility is to monitor postsecondary education of deaf and hard of hearing individuals. The Education Department needs
90

INTERNATIONAL JOURNAL OF SPECIAL EDUCATION Vol 24 No 1 2009
information on participation, services, and programs in postsecondary education and on financial support for deaf and hard of hearing postsecondary students. It conducted the Survey on Deaf and Hard of Hearing Students in Postsecondary Education to study of deaf and hard of hearing students who attend postsecondary institutions other than Gallaudet University and National Technical Institute for the Deaf, which are two federally funded national collegiate programs for deaf and hard of hearing students (Lewis & Ferris, 1994). With this information the Education Department can determine the types of postsecondary institutions other than these two federally funded national programs, the number of deaf and hard of hearing students enrolled at these institutions and the extent of the support services provided to these students by the institutions.
The Education Department also has the responsibility to provide financial assistance to postsecondary students who attend college. It needs information on how undergraduate, graduate and first-professional deaf and hard of hearing students and their families pay for postsecondary education and the demographic and other characteristics of those enrolled (Horn & Berktold, 1999). It conducted several surveys. The National Postsecondary Student Aid Study (NPSAS) is a comprehensive nationwide survey of postsecondary students including those with deafness. Starting in 1990 there are two longitudinal surveys the follow the NPSAS survey. The Beginning Postsecondary Students (BPS) Longitudinal Study and the Baccalaureate and Beyond (B&B) Longitudinal Study are follow-ups of alternate NPSAS surveys. The Education Department needs the NPSAS and the BPS surveys to examine the effects of financial aid on entry into, persistence and progress through and completion of graduate-level education (Horn & Berktold, 1999). The Education Department also needs the B&B surveys to examine the relationship between enrollment and progress, degree and employment, and demographic characteristics and enrollment patterns, progress and completion of postsecondary students with deafness (Horn & Berktold, 1999).
One of the surveys conducted by NCES that has information on deafness and hearing impairment is the National Education Longitudinal Study (NELS) (Rossi, Herting, & Wolman, 1997). The information showed up in its 1988 survey (NELS: 88) but was consolidated with blindness and visual impairments into a combined category of sensory impairments in its 1994 survey (NELS: 88/94) (Rossi, Herting, & Wolman, 1997). It is for this reason that the NELS is excluded from this study of post-1990 surveys.
Congress requires that US states provide educational services for children with disabilities, including deafness, in order to encourage their employment, self-help and participation in labor force. Congress also provides funding to state education departments. In IDEA Congress gave the Education Department the responsibility to monitor special education services for students with deafness. The Education Department conducts the Count Counts surveys and collects information on the number of children with deafness receiving IEP services from state education departments. It needs the surveys to help them formulate public education policy, determine funding to state education departments and evaluate the effectiveness of educational programs for children with deafness within states (Office of Special Education Programs, 2001). The Education Department also needs information on special schools and programs for children with deafness and the demographic characteristics of such children regardless of whether or not they receive IEP services. The Gallaudet University’s Graduate Research Institute is contracted by the Education Department’s Office of Special Education Programs to conduct the Annual Surveys and gather information on the schools and programs for children with deafness and the educational, health, audiological and communication characteristics of such children. It needs the information to help them assess the number, distribution and characteristics of programs and its deaf and hard of hearing students (Holden-Pitt & Diaz, 1998).
Survey questions and population cohortsThe different juxtapositions of deafness and society reflected in the agendas of the surveying institutions that generated different needs and purposes also framed the survey questions differently. The purposes of the surveying institutions are translated into survey questions. The survey questions are then labeled into population cohorts. Consequently, the different needs and purposes have generated different questions across surveys, which in turn have generated different population cohorts.The purpose of the CRS survey, which is assess the use of hearing for normal conversations, generated questions on whether deafness affected the ability to hear normal conversations. The CRS questions were based on the questions in the 1990 Census. The Census questions were: Do you have difficulty hearing what is said in normal conversation, and Are you unable to hear what is said in normal conversation (US Census Bureau, 1997). From these questions population cohorts were created. As Table 1 shows, the cohorts were persons who have difficulty in hearing what is said in normal
91
INTERNATIONAL JOURNAL OF SPECIAL EDUCATION Vol 24 No 1 2009
conversation and persons who were unable to hear what is said in normal conversation (US Census Bureau, 1997).. The 2000 Census included a question on hearing impairment in conjunction with visual impairment. Figures are provided but for the number of individuals with sensory impairment (Waldrop & Stern, 2003). It is difficult to sort out the estimates for individuals with deafness based on the Census 2000 data.
The purpose of the SIPP surveys, which is to assess the relationship between hearing abilities and employment of deaf people, was translated to survey questions. In the 1991-1992 SIPP survey the questions asked were whether deaf individuals have difficulty hearing or are unable to hear. In the 1994-1995 and 1996-1997 SIPP surveys the questions that were asked pertained to whether deaf individuals have hearing difficulties and whether the difficulties are severe or not. In all SIPP surveys the questions on hearing acuity were then followed up with questions on employment. The survey questions in questionnaires and follow-up interviews were translated into cohorts. The SIPP estimates of the American deaf population were for those individuals who have hearing difficulties and who have hearing inabilities for the 1991-1992 survey and those who have difficulty hearing who have not severe difficulty hearing for the 1994-1995, 1996-1997 and 2001-2002 surveys.
The purpose of the NHIS surveys, which is to gather information on hearing ability as an aspect of personal health and societal functioning, was translated into interview questions, which were about whether individuals could hear and understand normal voice, hear and understand voice when whispered and when shouted and distinguish speech from other sounds and noises. The questions were derived from the Gallaudet Hearing Scale (GHS), which measures the extent to which an individual has difficulty hearing and understanding normal and whispered speech. From the interviews they created population cohorts. In its 1991 survey the NHIS counted persons as having hearing impairments when interviews revealed that they can hear and understand speech only when shouted. They also counted persons as having deafness when interviews showed that they cannot distinguish speech from other sounds and noises (Reis, 1994). In its 1993-2003 surveys the NHIS altered the questions. It became: Which statement best describes your hearing without a hearing aid: good, a little trouble hearing, a lot trouble hearing, or deaf? (Lucas, Schiller, & Benson, 2004). For its 1993-1996 surveys the NHIS counted and classified individuals into two cohorts, one was for those who have a little trouble hearing and the other for those who have a lot of trouble hearing or deaf (Benson & Marano, 1995; Adams & Marano, 1995; Blackwell, Collins, & Coles, 2002; Lucas, Schiller, & Benson, 2004). In the 2003, 2004 and 2006 surveys NHIS combined cohorts who have a little trouble hearing,; a lot of trouble hearing; or deaf into one category, entitled hearing trouble.
The NCES’s NPSAS, BPS and B&B surveys deal with the relationship between deafness, enrollment, finances and postsecondary education. However, each of the NCES surveys slightly differs in the types of students and questions asked of the students. The NPSAS surveys covered undergraduate and graduate-first professional students with deafness while the BPS and B&B surveys covered students with deafness in postsecondary education institutions. In the NPSAS surveys the interview question was: Do you have any disabilities, such as hearing, speech, or mobility impairment, or vision problems that can’t be corrected with glasses? The questions asked in the BPS and B&B surveys were similar: Do you have any of the following disabilities (hard of hearing or deafness)? However, the population cohorts created in the NPSAS, B&B and BPS surveys were not similar. The NPSAS categorized deaf and hard of hearing as hearing disability and the B&B categorized it as hearing impaired or deaf. The BPS categorized it as hearing impairment or deaf in its 1989-1990 survey and hearing impaired postsecondary students in its 1993-1994 and 1995-1996 surveys (Horn & Berktold, 1999). The interview questions were changed in the NPSAS and BPS surveys of 2003-2004 to Do you need the services of sign language or oral interpreters? The population cohorts were changed in accordance to the changed question to Service needed: sign language or oral interpreters. This was done to create consistency in survey questions for the NPSAS and the BPS surveys. In spite of similar survey questions, the population cohorts for the BPS and NPSAS surveys of 2003-2004 differed. The BPS remained focused on institutions of higher education, and the NPSAS remained focused on undergraduate, graduate and professional students.
The Survey on Deaf and Hard of Hearing Students in Postsecondary Education focuses on deaf and hard of hearing students in postsecondary education. Educational institutions were asked whether they have enrolled any students in the academic years from 1989-1990 to 1992-1994 who identified themselves to the institutions as deaf or hard of hearing (Lewis & Farris, 1994). The institutions were not provided with definitions of deaf and hard of hearing for counting purposes. Lewis and Ferris
92

INTERNATIONAL JOURNAL OF SPECIAL EDUCATION Vol 24 No 1 2009
(1994) contained definitions of deafness that were borrowed from Research and Training Center on Independent Living (1993). Hearing impairments is a generic form used to indicate any degree of hearing loss, from mild to profound, and includes both deaf and hard of hearing. Deaf is a profound degree of hearing loss that prevents the reception of speech through the ear. Hard of hearing refers to a mild to moderate hearing loss that may or may not be improved through amplification (Lewis & Farris, 1994). These categories became the cohorts in the surveys from 1989 to 1994.
The Child Counts deal with deaf and hard of hearing children who receive IEP services. It utilizes IDEA classifications for deafness. IDEA provides two classifications for deafness, which are deaf and hard of hearing. Deaf is a severe hearing impairment that prevents a child from processing linguistic information through the use of audition. Hard of hearing is a hearing impairment that is not included under the definition for deaf but that also affects a child’s educational performance. In the Child Counts both IDEA constructions are consolidated into children with hearing impairments who require IEP services. State education authorities counted children who are classified as having hearing impairments if they are diagnosed as such and if they receive IEP services. The estimates for the American deaf child population in the Child Counts were for children with hearing impairments who receive IEP services.
The purpose of the Annual Surveys of Deaf and Hard of Hearing Children, which is to study the characteristics and enrollment patterns of students who attend special schools and programs for the deaf and the heard of hearing in the US, generated questions on hearing and communication abilities, types of educational programs and some other questions on student characteristics. It used the Gallaudet Hearing Scale and types of educational settings as demographic variables. The types of educational settings ranged from special schools to integrated classrooms. The degrees of deafness and types of educational programs and services were the bases for the construction of deaf population cohorts. In the 1989-1990, 1991-1992, and 1993-1994 Annual Surveys the estimates were for hearing impaired children and youth who received primary or secondary special educational services in local public schools or in special residential or day schools for the deaf (Schildroth & Hotto, 1991, 1993, 1996). The estimates for the 1994-1995 Annual Survey were for all deaf and hard-of-hearing children receiving special educational services in the US. The 1997 estimates were for all deaf and hard-of-hearing children who attended any US program or school, both public and private and deaf children who received special education services. In the 1999-2000 to 2006-2007 Annual Surveys only those children who received special education services were counted (Gallaudet Research Institute, 2001). The conceptualizations of the deaf child population cohorts seem to vary slightly over the years of the surveys.
Survey methodologies and respondentsThe survey questions and resultant cohorts that were framed by survey purposes also determine certain types of respondents. Different surveying institutions devised different methodologies for reaching and counting individuals with deafness. Different surveys were sent to different respondents. In addition, some surveys relied on self-reported data, some used questionnaires on functional hearing of conversations, some used audiometric data and some others used institutional data.
The CRS surveys were initiated by responses to questions on hearing in the decennial Census. The CRS mailed questionnaires and conducted interviews with individuals aged 16 and over who affirmatively responded to the Census questions in the long form on hearing difficulties. The SIPP surveys were mailed out to regionally based samples of households and individuals aged 15 years and over. Individuals were asked about their hearing abilities, identified and interviewed. The NHIS surveys were also mailed out to with randomly selected 40,000 households in the civilian noninstitutionalized population. They contained questions on deafness in the family. Individuals who responded in the affirmative were first identified and then interviewed by the NHIS.
The NPSAS survey questionnaires that included questions on deafness and hearing impairments were mailed to postsecondary students. Those who reported their hearing disability were followed up with computer-assisted telephone interviews. For the BPS survey students included in the NPSAS who had just started their postsecondary education were contacted and interviewed two additional times throughout their education and employment. For the B&B survey the NPSAS students were also contacted one year after the NPSAS surveys and given interviews. For the Survey on Deaf and Hard of Hearing Students in Postsecondary Education survey coordinators were assigned to institutions. They were asked whether their institutions had enrolled any students who self-reported as deaf, hard of
93

INTERNATIONAL JOURNAL OF SPECIAL EDUCATION Vol 24 No 1 2009
hearing or a combined category of hearing impairment. The OSEP sent Child Counts questionnaires to authorities at state education departments. The state education authorities responded to survey questions and counted children within their states who were deaf and received IEP services. The GRI mailed out questionnaires for the Annual Surveys of Deaf and Hard of Hearing Children to administrators of special schools and programs for deaf and hard of hearing children. School administrators filled in the number of children within their schools and programs.
Survey coverageThe survey questions, population cohorts and methodologies constrained the surveying institutions to cover certain individuals. The CRS identified individuals who responded in the Census that they have hearing difficulties. The SIPP and the NHIS counted individuals who responded in the affirmative to survey questionnaires and interviews that they have hearing difficulties. The Survey on Deaf and Hard of Hearing Students in Postsecondary Education counted individuals who reported to their institutions that they are deaf or hard of hearing. The NCES surveys identified students who self-reported that they have hearing disabilities for the earlier surveys and need interpreters for the later surveys of NPSAS and its longitudinal follow-up surveys, the BPS and B&B. The Child Counts counted children who received IEP services. The Annual Surveys counted children who attended schools and programs for the deaf and the hard of hearing.
In addition, each survey covered different age groups within the deaf population. The 1990 CRS covered individuals aged 16 and over. The NHIS covered adult population aged 18 and over. This age range is the range of ages of persons that the CRS and NHIS considered able to conduct societal activities and live independently (US Census Bureau, 1997). Not on reference (I deleted the 2000 date.) Lethbridge-Cejku & Vickerie, 2005). The CRS did not include persons of other ages and who did not claim that they experience difficulties in hearing normal conversation, even though their audiograms and personal experiences may indicate otherwise. The SIPP data were also limited to a small sample size of the deaf population. The SIPP provided separate demographic figures for two age groups, ages six to 14 and ages 15 and over. Why the SIPP included the age range of six-to-14 year old was not explained in its surveys. Individuals from this age group are not eligible for employment, as per federal regulations on child labor. Furthermore, the surveys were limited to a sample of deaf civilian noninstitutionalized population. The institutionalized deaf civilian population and deaf people in the military were excluded from the surveys. The Child Counts and the Annual Surveys covered school-age children, not adults. The former covered children receiving IEP services and the latter covered children six-17 year olds who attend special schools and programs for the deaf and the hard of hearing. Since 2000 they added figures for children three to five years old, but the figures are not shown in the table here. The three NCES surveys covered adults in postsecondary education. It has been reported that the age ranged from below 18 to over 40 years (Horn & Berktold, 1999). There is no information on the age range of students in the Survey on Deaf and Hard of Hearing Students in Postsecondary Education. Because surveys differ in the age ranges of its respondents, population estimates across surveys may not cover the same age ranges, and it is not possible to compare population estimates across the surveys.
DiscussionSurveys do not agree with each other on estimates of the deaf and hard of hearing population. Previous studies on the demography of deaf and hard of hearing population examined the discrepancies in estimates across surveys. They explained the discrepancies in terms of sampling and probability errors, different survey methodologies, federal mandates, changing medical conditions and fluctuations in prevalence rates. The problem with previous studies is that demographers assume that different surveys cover the same set of deaf and hard of hearing populations and carry similar definitions and characteristics of people with deafness. However, the role of different surveying institutions with its own agendas and purposes need to be explored as possibly shaping the different estimates of deaf and hard of hearing population. This study takes a critical demography model and finds that estimates are results of the purposes and agendas of surveying institutions. It shows that different surveys produce different estimates because of different mandates and agendas, which have impacted on the shaping of questions, methodologies and types of respondents. Different surveying institutions produced different estimates of the American deaf population since 1990. While all demography studies are mandated and funded by the US Congress, Congress funds different survey projects of competing constellations of federal surveying agencies and public and private program and service agencies. The constellations revolve around the US Department of Commerce, the US Department of Health and Human Services, and the US Department of Education.
94

INTERNATIONAL JOURNAL OF SPECIAL EDUCATION Vol 24 No 1 2009
Each institution has different purposes for conducting demography studies, and definitions of population cohorts. The US Department of Commerce is interested in the economic situation of the American deaf population, the US Department of Health and Human Services focuses on the health situation of the deaf population, and the US Department of Education deals with the education situation of the population. The impetus for their different purposes is based on their different needs for conducting the surveys. The US Department of Commerce need people count to assess the labor force, self-help, and participation of the deaf population in its labor and welfare programs. The US Department of Health and Human Services need surveys to examine the health conditions of the deaf population and its participation in its self-help and well-being programs. The US Department of Education requires surveys to study the implementation of federal education laws and the effectiveness of special education services for the deaf child population. The different needs and purposes of the surveying institutions suggest that they, in counting deaf people, focus on certain aspects of deafness that are integral to their missions. The surveys do not speak about the same set of deaf people. They focus on different subsets of the American deaf population. The Commerce Department deals with the employability of deaf people, the Health and Human Services Department deals with the general well being of deaf people, and the Education Department works with the educability of deaf people. Their focus on certain aspects of deaf people to the exclusion of others underlies the problems of demography.
Demography is a problematic field because it is an extension of social policy. Social policy is reflected in the political, social, and economic motivations of the demography institutions regarding persons with deafness. The motivations are nested in their agendas and purposes. Social policy requires demography to assess needs, agendas and programs. The divergences in estimates across surveys suggest that demography is an extension of social policy. Demography is a politico-economic activity conducted by organizations and institutions in order to assess and justify their funding, programs and services, and personnel management. As the above discussion of tables shows, social policy may have skewed population figures. What is clear from the foregoing is that one needs to take caution when examining and using demography data on the American deaf population. One needs to be mindful that the estimates are a function of the agendas and mandates of the surveying institutions that conduct the surveys.
Accurate estimates of the deaf population are essential for studying deaf people and the different aims of surveys and incompatibilities of definitions across surveys hinder valid research, meaningful projections of program needs and clear communication between professionals. Confusions in research and educational practices and the eligibility and ineligibility of deaf people from programs and services are but unfortunate consequences of demography as a sociopolitical act (see also Bienenstock & Vernon, 1994). The survey questions, population cohorts and methodologies may delimit the deaf population. Population estimates may be further affected by conflicting agendas between the respondents and the surveying institutions. These critical issues have the potential to exclude certain groups of deaf individuals from enumeration and skew estimates of the deaf population. The possible effect is that the counting of some individuals to the exclusion of some others may have skewed demography studies and the allocation of resources, programs, and services by the governmental departments and public and private organizations and agencies to the detriment of individuals who get excluded in the surveys. While a discussion of this possibility is outside of the scope of this study, it is worth further investigation.
What is clear is that people count—that is, who gets counted and who does not—is a function of the sociopolitical aims of the surveying institutions and their angularized perspectives of deaf people. Once the angularized perspectives and the sociopolitical aims of the surveying institutions are taken into account, the population estimates can be better analyzed and understood.
ReferencesAdams, P.F., & Marano, M.H. (1995). Current estimates from the National Health Interview Survey, 1994. Health and Vital Statistics 10, Number 193.Adams, R.F., Hendershot, G.E., & Marano, M.A. (1999). Current estimates from the National Health Interview Survey, 1996. Health and Vital Statistics 10, Number 200. Benson, V., & Marano, M.A. (1995). Current estimates from the National Health Interview Survey, 1993. Health and Vital Statistics 10, Number 190.Bienenstock, M.A., & Vernon, M. (1994). Classification by the states of deaf and heard of hearing. American Annals of the Deaf 139: 80-85.
95

INTERNATIONAL JOURNAL OF SPECIAL EDUCATION Vol 24 No 1 2009
Black, D., Gates, G., Sanders, S., & Taylor, L. (2000). Demographies of the gay and lesbian population in the United States: Evidence from available systematic data sources. Demography 37: 139-154.Blackwell, D.L., Collins, J.G., & Coles, R. (2002). Summary health statistics for US adults, National Health Interview Survey, 1997. Health and Vital Statistics 10, Number 205.Blanchfield, B., Dunbar, J, Feldman, J, & Gardner, E. (1999). The severely to profoundly hearing impaired population in the US: Prevalence and demographics. Bethesda, MD: Project HOPE Center for Health Affairs.Demeny, P. (1988). Social science and population policy. Population and Development Review 14: 451-479.Gallaudet Research Institute. (2001). Regional and National Summary Report of Data from the 1999-2000 Annual Survey of Deaf and Hard of Hearing Children and Youth. Washington, DC: Gallaudet University Graduate Research Institute.Gallaudet Research Institute. (2002). Regional and National Summary Report of Data from the 2000-2001 Annual Survey of Deaf and Hard of Hearing Children and Youth. Washington, DC: Gallaudet University Graduate Research Institute.Gallaudet Research Institute. (2003a). Regional and National Summary Report of Data from the 2001-2002 Annual Survey of Deaf and Hard of Hearing Children and Youth. Washington, DC: Gallaudet University Graduate Research Institute.Gallaudet Research Institute. (2003b). Regional and National Summary Report of Data from the 2002-2003 Annual Survey of Deaf and Hard of Hearing Children and Youth. Washington, DC: Gallaudet University Graduate Research Institute.Gallaudet Research Institute. (2005a). Regional and National Summary Report of Data from the 2003-2004 Annual Survey of Deaf and Hard of Hearing Children and Youth. Washington, DC: Gallaudet University Graduate Research Institute.Gallaudet Research Institute (2005b). Regional and National Summary Report of Data from the 2004-2005 Annual Survey of Deaf and Hard of Hearing Children and Youth. Washington, DC: Gallaudet University Graduate Research Institute.Gallaudet Research Institute (2006). Regional and National Summary Report of Data from the 2006-2007 Annual Survey of Deaf and Hard of Hearing Children and Youth. Washington, DC: Gallaudet University Graduate Research Institute.Greenhalgh, S. (1996). The social construction of population science: An intellectual, institutional and political history of 20th century demography. Comparative Studies in Society and History 38: 26-66.Hammel, E.A., & Howell, N. (1987). Research in population and culture: An evolutionary framework. Current Anthropology 28: 141-150.Handwerber, W.P. (1986). Culture and reproduction: Exploring micro/macro linkages. In W.P.Handwerber (ed.), Culture and reproduction: Reconstructing the demographic paradigm (pp. 1-27). Boulder, CO: Westview Press.Holden-Pitt, L., & Diaz, J.A. (1998). Thirty years of the Annual Survey of Deaf and Hard-of-Hearing Children and Youth: A glance over the decades. American Annals of the Deaf 142: 72-76.Horn, L., & Berktold, J. (1999). Students with disabilities in postsecondary education: A profile of preparation, participation, and outcomes, NCES 1999-187. Washington, DC: US Department of Education, National Center for Education Statistics.Horton, H.D. (1999). Critical demography: The paradigm of the future? Sociological Forum 14: 363-368.Lethbridge-Cejku, M., & Vickerie, J. (2005). Summary health statistics for U.S. adults: National Health Interview Survey, 2003. Vital and Health Statistics 10, Number 225.Lethbridge-Çejku M, Rose D, & Vickerie J. (2006). Summary health statistics for U.S. Adults:National Health Interview Survey, 2004. Vital and Health Statistics 10, Number 228.Lewis, L., & Farris, E. (1994). Deaf and heard of hearing students in postsecondary education, NCES 94-394. Washington, DC: US Department of Education, National Center for Education Statistics.Lucas, J.W., Schiller, J.S., & Benson, V. (2004). Summary health statistics for US adults:National Health Interview Survey, 2001. Vital and Health Statistics 10, Number 218.McNeil, J.M. (1994). Americans with Disabilities: 1991-1992. Current Population Reports P70-33. Washington, DC: US Department of Commerce, Bureau of the Census.McNeil, J.M. (1997). Americans with Disabilities: 1994-1995. Current Population Reports P70-61. Washington, DC: US Department of Commerce, Bureau of the Census.McNeil, J. (2000). Employment, earnings, and disability. Paper presented at the 75 th Annual Conference of the Western Economic Association International.McNeil, J.M. (2001). Americans with Disabilities: 1997. Current Population Reports P70-73. Washington, DC: US Department of Commerce, Bureau of the Census.
96
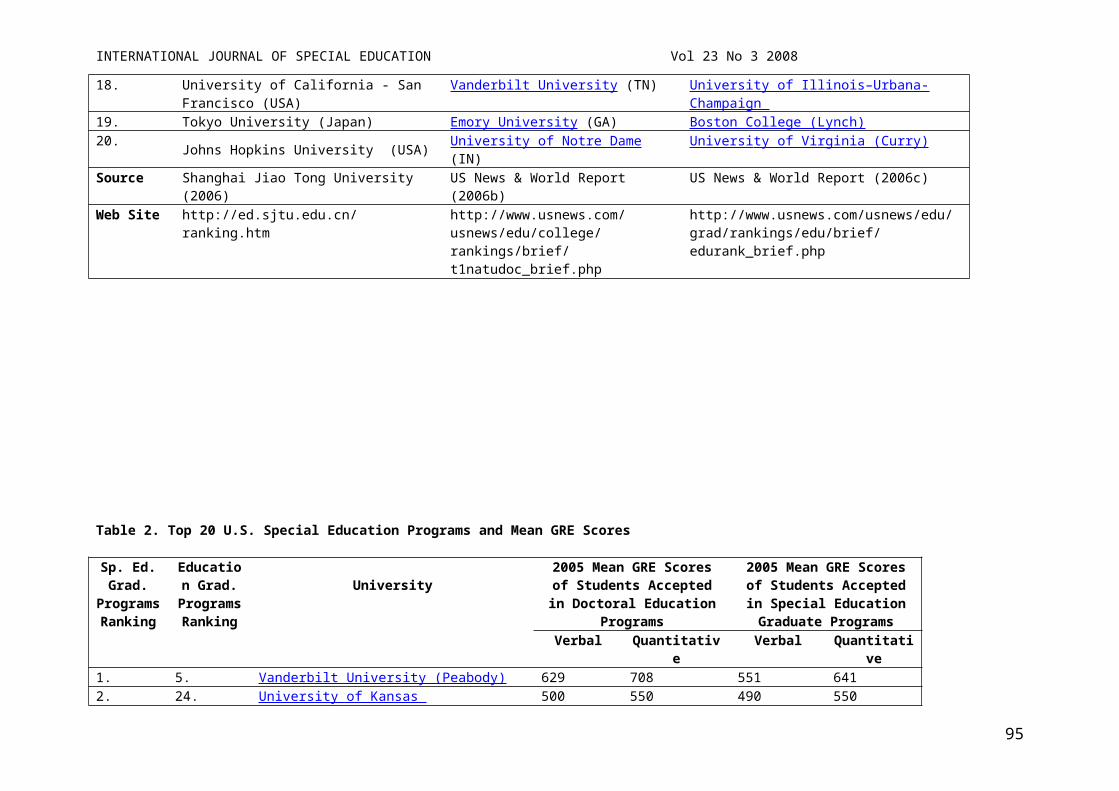
INTERNATIONAL JOURNAL OF SPECIAL EDUCATION Vol 24 No 1 2009
Office of Special Education Programs. (1992). Fourteenth Annual Report to Congress on the Implementation of the Individuals with Disabilities Education Act, 1990-1991. Washington, DC: US Department of Education.Office of Special Education Programs. (1993). Fifteenth Annual Report to Congress on the Implementation of the Individuals with Disabilities Education Act, 1991-1992. Washington, DC: US Department of Education.Office of Special Education Programs. (1994). Sixteenth Annual Report to Congress on the Implementation of the Individuals with Disabilities Education Act, 1992-1993. Washington, DC: US Department of Education.Office of Special Education Programs. (1995). Seventeenth Annual Report to Congress on the Implementation of the Individuals with Disabilities Education Act, 1993-1994. Washington, DC: US Department of Education.Office of Special Education Programs. (1996). Eighteenth Annual Report to Congress on the Implementation of the Individuals with Disabilities Education Act, 1994-1995. Washington, DC: US Department of Education.Office of Special Education Programs. (1997). Nineteenth Annual Report to Congress on the Implementation of the Individuals with Disabilities Education Act, 1995-1996. Washington, DC: US Department of Education.Office of Special Education Programs. (1998). Twentieth Annual Report to Congress on the Implementation of the Individuals with Disabilities Education Act, 1996-1997. Washington, DC: US Department of Education.Office of Special Education Programs. (1999). Twentieth-First Annual Report to Congress on the Implementation of the Individuals with Disabilities Education Act, 1997-1998. Washington, DC: US Department of Education.Office of Special Education Programs. (2000). Twentieth-Second Annual Report to Congress on the Implementation of the Individuals with Disabilities Education Act, 1998-1999. Washington, DC: US Department of Education.Office of Special Education Programs. (2001). Twentieth-Third Annual Report to Congress on the Implementation of the Individuals with Disabilities Education Act, 1999-2000. Washington, DC: US Department of Education.Office of Special Education Programs. (2002). Twentieth-Fourth Annual Report to Congress on the Implementation of the Individuals with Disabilities Education Act, 2000-2001. Washington, DC: US Department of Education.Office of Special Education Programs. (2003). Twentieth-Fifth Annual Report to Congress on the Implementation of the Individuals with Disabilities Education Act, 2001-2002. Washington, DC: US Department of Education.Office of Special Education Programs. (2004). Twentieth-Sixth Annual Report to Congress on the Implementation of the Individuals with Disabilities Education Act, 2002-2003. Washington, DC: US Department of Education.Office of Special Education Programs. (2005). Twentieth-Seventh Annual Report to Congress on the Implementation of the Individuals with Disabilities Education Act, 2003-2004. Washington, DC: US Department of Education.Office of Special Education Programs. (2006). Twentieth-Eighth Annual Report to Congress on the Implementation of the Individuals with Disabilities Education Act, 2004-2005. Washington, DC: US Department of Education.Office of Special Education Programs. (2007). Twentieth-Ninth Annual Report to Congress on the Implementation of the Individuals with Disabilities Education Act, 2005-2006. Washington, DC: US Department of Education.Pleis JR, & Lethbridge-Çejku M. (2007). Summary health statistics for U.S. adults: National Health Interview Survey, 2006. Vital and Health Statistics 10, Number 235. Reis, P. (1994). Prevalence and characteristics of persons with hearing trouble: United States, 1990-1991. Vital and Health Statistics 10, Number 188.Research and Training Center on Independent Living. (1993). Guidelines for reporting and writing about people with disabilities. 3rd edition. Lawrence, KS: University of Kansas Bureau of Child Research.Riley, N. (1999). Challenging demography: Contributions from feminist theory. Sociological Forum 14: 369-398.Riley, N. (1997). Similarities and differences: Anthropological and demographic perspectives on gender. In D.L. Kerter & T. Fricke (eds.), Anthropological Demography: Toward a New Synthesis, pp. 115-138. Chicago, IL: University of Chicago Press.
97

INTERNATIONAL JOURNAL OF SPECIAL EDUCATION Vol 24 No 1 2009
Rossi, R., Herting, J., & Wolman, J. (1997). Profiles of students with disabilities as identified in NELS: 88, NCES 97-254. Washington, DC: US Department of education, National Center for Education Statistics.Schein, J. (1996). The demography of deafness. In P. Higgins & J. Nash (eds.), Understanding Deafness Socially, pp. 21-43. Springfield, IL: C.C. Thomas Publishers.Scherper-Hughes, N. (1997). Demography without numbers. In D.L. Kerter & T. Fricke (eds.) Anthropological Demography: Toward a New Synthesis (pp. 201-222). Chicago, IL: University of Chicago Press.Schildroth, A.N., & Hotto, S.A. (1991). Annual Survey of Hearing-Impaired Children and Youth, 1989-1990 School Year. American Annals of the Deaf 136(2).Schildroth, A.N., & Hotto, S.A. (1993). Annual Survey of Hearing-Impaired Children and Youth, 1991-1992 School Year. American Annals of the Deaf 138(2): 163-171.Schildroth, A.N., & Hotto, S.A. (1996). Changes in student and program characteristics, 1984-85 and 1994-95. American Annals of the Deaf 141(2): 68-71.Steinmetz, E. (2004). Americans with Disabilities: 2002. Current Population Reports, P70-107, Washington, DC: US Census Bureau.US Bureau of the Census. (1997). Statistical Abstracts of the United States: 1990. Washington, DC: United States Government Printing Office.US Bureau of the Census. (2002). Disability: 1990 Census, Table 3. Retrieved from www.census.gov.us/hhes/www/disable/census/tables/tab3us.html.U.S Department of Education, National Center for Education Statistics. (1991). 1989-90 National Postsecondary Student Aid Survey (NPSAS:90).Washington, DC: US Department of Education, Data Analysis System. U.S Department of Education, National Center for Education Statistics. (1994). 1992-93 National Postsecondary Student Aid Survey (NPSAS:93). Washington, DC: US Department of Education, Data Analysis System.U.S Department of Education, National Center for Education Statistics. (1995a). 1989-90 Beginning Postsecondary Students Longitudinal Study (BPS:90/94).Washington, DC: US Department of Education, Data Analysis System.U.S Department of Education, National Center for Education Statistics. (1995b). 1992-93 Beginning Postsecondary Students Longitudinal Study (BPS:93/94). Washington, DC: US Department of Education, Data Analysis System.U.S Department of Education, National Center for Education Statistics. (1995c). 1993-94 Beginning Postsecondary Students Longitudinal Study (BPS:94). Washington, DC: US Department of Education, Data Analysis System.U.S Department of Education, National Center for Education Statistics. (1997). 1995-96 National Postsecondary Student Aid Survey (NPSAS:96). Washington, DC: US Department of Education, Data Analysis System.U.S Department of Education, National Center for Education Statistics. (1998). 1993-94 Baccalaureate and Beyond Longitudinal Study, Second Follow-up (B&B:97). Washington, DC: US Department of Education, Data Analysis System. U.S Department of Education, National Center for Education Statistics. (2001). 1999-2000 National Postsecondary Student Aid Survey (NPSAS:2000). Washington, DC: US Department of Education, Data Analysis System.U.S Department of Education, National Center for Education Statistics. (2002a). 1995-96 Beginning Postsecondary Students Longitudinal Study, Second Follow-up (BPS:2001). Washington, DC: US Department of Education, Data Analysis System.U.S Department of Education, National Center for Education Statistics. (2002b). 1999-2000 Baccalaureate and Beyond Longitudinal Study (B&B:2000/01). Washington, DC: US Department of Education, Data Analysis System. U.S Department of Education, National Center for Education Statistics. (2005). 2003-2004 National Postsecondary Student Aid Survey (NPSAS:2004). Washington, DC: US Department of Education, Data Analysis System.U.S Department of Education, National Center for Education Statistics. (2007). 2003-04 Beginning Postsecondary Students Longitudinal Study (BPS:04/06). Washington, DC: US Department of Education, Data Analysis System.Waldrop, J., & Stern, S.W. (2003). Disability status: 2000—Census 2000 Brief. Washington,DC: U.S. Department of Commerce, Economics and Statistics Administration
98

INTERNATIONAL JOURNAL OF SPECIAL EDUCATION Vol 24 No 1 2009
WORKING WITH STUDENTS WITH SPECIAL EDUCATIONAL NEEDS IN GREECE:TEACHERS’ STRESSORS AND COPING STRATEGIES
99

INTERNATIONAL JOURNAL OF SPECIAL EDUCATION Vol 24 No 1 2009
Alexander-Stamatios AntoniouFotini Polychroni
University of Athensand
Christina KotroniPedagogical Institute, Athens
Few studies explore the specific sources of stress, and the coping strategies applied by teachers of children with special educational needs, particularly in small countries such as Greece. The present study investigated the specific work-related stressors affecting special educational needs teachers in Greece and the coping strategies applied by them. 158 One hundred fifty eight special education teachers participated in the study, recruited from Athens (n = 113), and other urbanised areas of Greece (n = 45). Pilot interviews were conducted in order to generate a scale for measuring specific sources of stress in Greek special education teachers. The resulting scale(s), together with the Coping sub-scale of the Occupational Stress Indicator were administered to the sample, and a number of sociodemographic factors were also obtained by the use of a detailed biographical questionnaire. The results identified five key stressors, loading mainly onto the domains of working conditions, workload, and organisational problems, which appear to have an impact on teachers of Special Educational Needs students in Greece. Furthermore, a number of key coping strategies were identified by the teachers, as a means of dealing with work-related stress. The implications of the study are discussed, with a view to forming suggestions for stress intervention programmes.
Review of literatureResearch evidence on occupational stress suggests that teaching is among one of the most stressful occupations (Boyle et al., 1995; Doune, 1999; Hui and Chan, 1996; Schonfeld, 2001). As far as the social welfare occupations are concerned, it has been claimed that in fact, teachers experience the highest levels of stress (Travers and Cooper, 1993). In a study carried out in 1996, 80% of the head teachers in special schools in the UK reported that they considered teaching to be a very stressful profession and more than 50% reported having actively contemplated leaving (Male and May, 1997).
Evidence suggests that prolonged occupational stress can lead to physical, mental and emotional ill-health (Borg, 2003; Kelso, French and Fernandez , 2005; Male and May, 1997; Pithers, 1995; Travers and Cooper, 1996), as well as an impairment of the quality of teaching itself ( Jaoul, Kovess and FSP-MGEN, 2004). Furthermore, high levels of occupational stress are also associated with job dissatisfaction, absenteeism and work turnover (Billingsley and Cross, 1993).
Forlin (2001) has classified teacher stressors into three general clusters: administrative, (i.e. heavy workload, role overload and role conflict, role ambiguity, time/resource difficulties), classroom-based, (i.e., classroom climate, high ratio between teacher-pupils, limited progress of pupils with an emphasis on pupils’ disruptive behaviors) (Brouwers and Tomic, 2000; Friedman, 1995; Hock, 1988) and personal, (i.e., poor collaboration with colleagues, poor working environment, external locus of control, insufficient salary and low social status) (Borg, Riding and Falzon, 1991; Byrne, 1994; Guglielmi and Tatrow, 1998; Kyriacou, 2001; Male and May, 1997).
Although a great deal of research on teachers’ stress has been carried out since the late 1970s, studies on the stress experienced by teachers of children with special educational needs remain rather scarce despite the specific factors acting as stressors for teachers in special education schools or classes (Fore, Martin, and Bender, 2002; Galloway, 1985; Upton & Varma, 1996). Williams and Gersch (2004) provided evidence that there are no significant differences in the total level of stress between mainstream and special school teachers, but differences have been identified with regard to the sources of stress in SEN and non SEN teachers. As such, SEN teachers tend to experience high levels of stress by disruptive pupils, pupils’ poor attitudes to schoolwork, lack of available time to spend with individual pupils and OFSTED inspections with the mainstream teachers being stressed by lack of resources (Willliams & Gersch, 2004).
Stress appears to be especially evident for teachers working in inclusive settings and special classes within mainstream schools (Forlin, 2001; Vlachou and Barton, 1994). The additional sources of stress that special educational needs teachers experience may relate to the individual learning and emotional
100

INTERNATIONAL JOURNAL OF SPECIAL EDUCATION Vol 24 No 1 2009
needs of the children who are mentally, physically and/or sensory impaired (Chapman and Stone, 1996; Fraser, 1996; Lecavalier, Leone and Wiltz, 2006; Nelson, 2001; Upton, 1996; Ware, 1996).
Few studies exist which investigate stress among teachers working in small countries such as Greece, particularly within the field of SEN. Recently however, attention has been drawn to teachers’ stress in Greece, with the main focus being the sources and levels of stress and job satisfaction of mainstream school teachers at the primary and secondary level. Low wages and limited opportunities for promotion, teachers' goals (occupational and financial) have been identified as a source of stress for Greek primary and secondary teachers (Koustelios and Kousteliou, 1997; Papastylianou, 1997). However, there is some evidence that the levels of stress of mainstream teachers are lower compared to those in other countries with teachers reporting less working hours, less physical exertion and higher levels of social support than their European counterparts (Alexopoulos, 1992; Leondari, Kiridis and Gialamas, 2000; Pomaki and Anagnostopoulou, 2003). With regard to children with special needs, feelings of inadequacy have been reported by Greek mainstream school teachers, mainly deriving from the inadequate training that they have received (Padeliadu, 1995; Antoniou, Polychroni and Vlachakis, 2006).
The Greek special education system comprises special kindergartens, special primary schools, inclusion classes in mainstream kindergartens and mainstream primary schools, special lower secondary schools and special upper secondary schools. The aim in recent years is towards inclusion. Primary special education is for children 4-14 years, lower gymnasium is for 14-18 years and upper secondary is for 18-22 years old. In terms of the demographics of the different categories of special needs, the majority of pupils (68,35%) attending special schools or units are pupils with specific learning difficulties (i.e. dyslexia), 15.38% of pupils have mental retardation, 4.5% have severe learning difficulties and fewer have severe neurological conditions, autism, hearing and visual impairments (The Information Network in Europe, 2005).
Despite the recent attention that stress and teaching has received, there are still virtually no studies investigating the specific sources of stress and the coping strategies of the teachers of children with special needs in Greece. Teaching stress may be moderated by the use of a number of coping strategies rather than being a mere exposure to difficult situations. Approaches to reducing stress may be either direct (e.g. changing the source of stress) or indirect (e.g. changing the way one thinks about or physically responds to the stress to reduce impact) and either active (e.g. taking some action to change oneself or the situation) or inactive (e.g. avoiding or denying the source of stress by engaging in sport activities, relaxation techniques, alcohol consumption) (Folkman, 1984; Kelso, French and Fernandez, 2005; Williams and Gersch, 2004). In a study carried out by Gersch (1996) a number of strategies were indicated, suggested as effective by teachers. These included listing and prioritising work, having a sympathetic adult or mentor to share problems with, engaging in leisure activities and pursuing hobbies outside school hours.
Considerably less attention has been given to the coping strategies used by special education teachers. However, Green and Ross (1996) identified a number of coping strategies used by SEN teachers, also proposed in an earlier study by Lazarus and Folkman (1984) as general approaches for coping with demanding circumstances. These fell into three major categories: problem-focused, emotion-focused and avoidance coping strategies. Special education teachers are more likely to use different directed coping strategies than regular education teachers, but also employ self-directed coping strategies which are similar to those used by mainstream teachers. These may include a step by step plan of action to remedy problems or taking direct action and putting aside other activities to solve problems, and avoidant coping strategies, including trying not to think about problems (Green and Ross, 1996; Markham, Green and Ross, 1996).
The present study explores the specific sources of stress experienced by Greek teachers in Special Education, and investigates the coping strategies used by these teachers in an effort to overcome stress. In addition, the study seeks to identify possible predicting factors for both the sources of stress experienced, and the coping strategies employed by Greek SEN teachers.
MethodSampleThe sample consisted of 158 teachers working in special needs classrooms in special schools and/or inclusive classrooms situated in Athens (71.5%) and three other main cities in Greece (28.5%),
101

INTERNATIONAL JOURNAL OF SPECIAL EDUCATION Vol 24 No 1 2009
Thessaloniki, Irakleio and Volos. Records from the Greek Ministry of Education showed that these cities had a large number of special needs schools and schools with inclusive classes. As a result, they were considered more suitable for participation in the study. Questionnaires were mailed to 200 schools addressed to all special needs teachers working on site. Finally, 158 teachers (106 males and 52 females) from 120 schools (45 special schools and 75 mainstream schools) responded. The breakdown of the sample can be found in Table 1.
Table 1.Breakdown of sample and demographics (N=158)
Variable Demographic Categories N % Gender Males
Females10652
67.1% 32.9%
Location AthensOther areas in Greece
11345
71.5%28.5%
Type of School MainstreamSpecial
7545
62.5%37.5%
Age (years)
up to 40 41 - 50 over 51
536639
33.5%41.8%24.7%
Marital Status MarriedSingle
14315
90.5%9.5%
Teaching Experience(years)
1 -15 16 - 24 over 25
437441
27.2%46.8%25.9%
Position in school TeacherHead teacherOther
733154
46.7%19.6%33.7%
Years in current position 1-45-9over 10
564062
35,4%25.3%39.2%
Teaching hours per week 1-2021-30
38120
24%75.9%
Preparation time per week (hours)
1 - 5 6-10 11-20
735713
46.2%36.1%8.2%
Assessment time per week (hours)
1-23-5over 6
466052
29.1%38.0%32.9%
Number of pupils in class 1-56-15
51101
32.3%66.4%
MeasuresThe study has a cross-sectional self-report design. Pilot interviews were conducted with a small group of Greek SEN teachers (N=10) in order to generate items for a scale assessing the specific sources of stress of SEN teachers in Greece. The final scale constructed consisted of 45 items describing sources of stress relating to working conditions, students’ achievement and behaviour, resources and equipment, job demands and occupation status. Sample items included: lack of progress for a number of students; unrealistic expectations and pressure by parents; lack of support staff in the classroom and limited recognition of my contribution by the state. Responses were obtained through a six-point Likert-type self-report rating scale ranging from no stress at all (1) to very high level of stress (6). Reliability of the scale was high, with Cronbach’s alpha calculated at 0.943.
The questionnaire utilized to assess coping strategies was the coping subscale from the Occupational Stress Indicator (OSI) developed by Cooper, Sloan and Williams (1988). The 28-item scale is designed to measure the positive and negative coping strategies which an individual uses to overcome various stressful situations. Individuals are asked to rate the statements on a six-point Likert type scale ranging from 1 (never used by me) to 6 (extensively used by me) (e.g. Try to deal with the situation objectively and in an unemotional way). The coping strategies are broken down into the following six subscales: social support (assistance which an individual can obtain from a social support system), task strategies (individual’s efforts to cope with occupational stress by rearranging their current and future tasks),
102
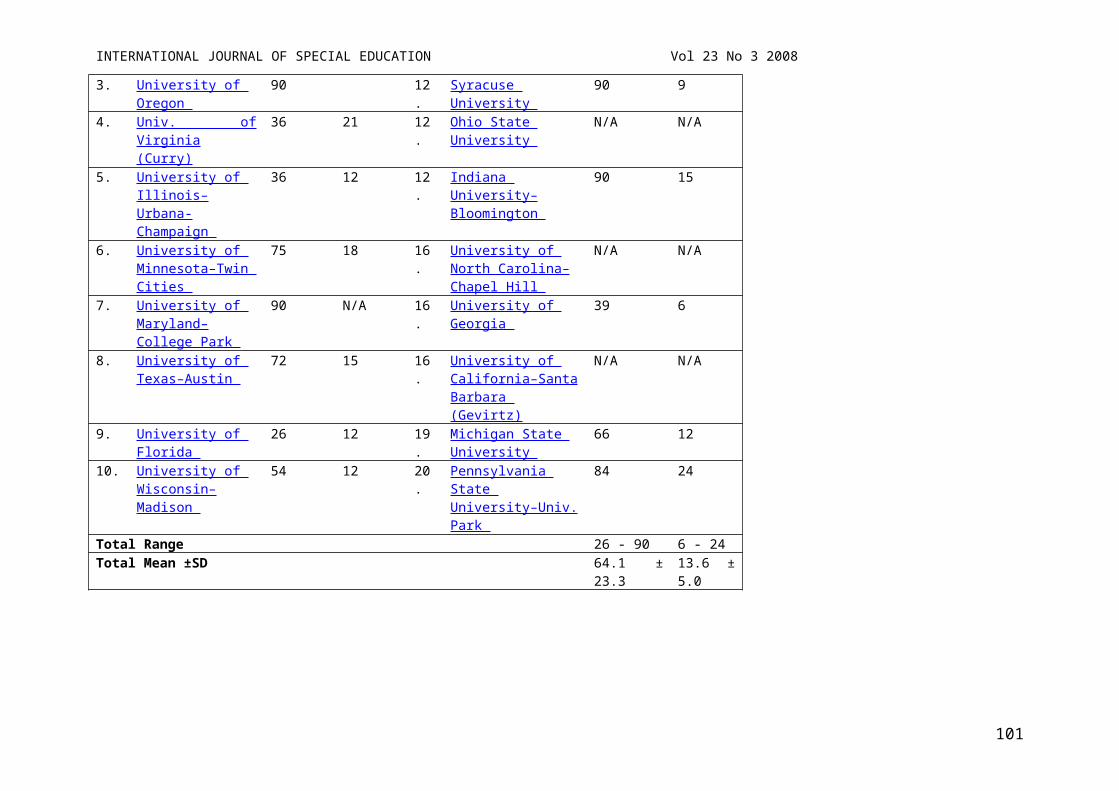
INTERNATIONAL JOURNAL OF SPECIAL EDUCATION Vol 24 No 1 2009
logic (individual’s unemotional and rational approach to stressful situations), home-work relationships (ways in which the individual can obtain support from the home environment as well as from other interests), time (benefits for an individual when using an effective time management as coping strategy) and involvement (how an individual becomes appointed to the tasks leading them to increased stress) (Cronbach’s alpha: 0.862). Similar procedures have been previously adopted by other researchers when investigating sources of stress (Antoniou, 1999; Travers and Cooper, 1996).
Demographic information and work characteristics were employed as predictor variables. Teachers were asked to fill in a detailed biographical questionnaire which included information with regard to gender, age, teaching experience, hours spent on preparation and marking, and thoughts of quitting the job.
ResultsA principal components factor analysis with varimax rotation was applied to the responses to the 45 potential sources of stress. Six factors were derived from the analysis that contributed for 55.08% of the total variance of the scores: 1) Work conditions (29.82% variance), 2) Workload (6.85%), 3) Lack of recognition and support (5.32%), 4) Organisational problems (4,78%), 5) Students’ motivation (4.62%), 6) Difficult student behaviour (3.69%). The factors eliciting greater levels of stress were work conditions, workload, and organisational problems factors. In particular, five specific items loading onto these factors were identified as the most important and re-curring sources of stress (see table 2) as follows: lack of resources and equipment in schools; responsibility for pupils; support from the government; pressure of time at school; and favouritism at work, whereby promotion is perceived to be based on social contacts rather than on professional performance.
Table 2.Rank order of mean scores and standard deviations of the most important sources of stress (N=158)
Rank Order
Sources of Stress Mean SD Percent % scoring 5 or 6
1 Resources and equipment 4.39 1.24 50.62 Responsibility for pupils 4.24 1.38 44.93 Support from the government 4.18 1.33 52.04 Pressure of time at school 4.09 1.36 38.75 Favoritism 4.04 1.51 44.9Range of scale: 1=Not stressful at all, 2=Not stressful, 3=Generally not stressful, 4=Generally stressful, 5=Quite stressful, 6=Very stressful.
Factor analysis was also performed on the coping strategies sub-scale, in order to confirm the structure. Analysis yielded six factors that contributed to 57.93% of the total variance, depicting a slightly different structure compared to the original structure of the OSI as follows: 1) Social support (12.89%), 2) Time (10.36%), 3) Involvement (9.80%), 4) Logic (8.87%), 5) Task strategies (8.05%), 6) Separating Home-work relationships (7.96%).
Mean scores for the individual items of the coping strategies scale were investigated, in order to ascertain those most frequently applied. Coping strategies employed by the teachers in order to minimize their occupational stress levels are depicted in Table 3, ranked by frequency. It was found that teachers used mainly strategies loading onto the involvement factor, (i.e. looking for ways to make their job more interesting) and the task strategies factor, (i.e. setting priorities in their duties and reorganizing their work). In addition, strategies loading onto the social support factor were also applied (i.e. maintaining stable relationships).
Table 3.Rank order of mean scores and standard deviations of coping strategies (N=158)
Rank Order
Coping Strategies Mean SD Percent% scoring5 or 6
1 Look for ways to make the work more interesting
5.0 1.19 77.8
2 Have stable relationships 4.89 1.09 69.0
103

INTERNATIONAL JOURNAL OF SPECIAL EDUCATION Vol 24 No 1 2009
2 Reorganize my work 4.89 1.09 69.63 Set priorities 4.84 1.09 72.14 Deal with problems
immediately4.82 1.27 63.3
5 Expand interest and activities outside work
4.78 1.21 68.9
Range of scale: 1=Not stressful at all, 2=Not stressful, 3=Generally not stressful, 4=Generally stressful, 5=Quite stressful, 6=Very stressful.
Independent samples t-test was applied to identify differences in scores between male and female teachers with regard to the most frequently reported sources of stress items and the 6 stress factors, together with the most frequently applied coping strategy items and the 6 coping strategy factors (see Table 4).
Table 4.Independent samples t-test identifying significant differences between male and female teachers
for specific stress and coping strategy items and factors.
Mean (SD) t pMen Women
Specific stress Items:Responsibility for pupilsPressure of time at schoolSpecific stress factors:Student motivationStudent difficult behaviour
4.04 (1.44)3.92 (1.39)
25.5017.28
4.64 (1.16)4.43 (1.23)
28.0015.10
2.632.25
2.512.64
.009
.025
.013
.004
Coping ItemHaving stable relationships 4.76 (1.14) 5.15 (0.92) 2.15 .033
Significant differences in mean scores were identified for stress items in relation to responsibility for pupils, and pressure of time at school, with women reporting more stress in these areas, Females also reported significantly more stress for the student motivation factor, whilst men reported more stress in relation to difficult student behaviour. A significant difference was also identified for the having stable relationships item of the coping scale, with women reporting more extensive use of this strategy than men. No significant differences were identified for the coping strategy factors.
Differences in scores on the most frequently reported sources of stress items and 6 stress factors, were also investigated across the three age ranges, as were the frequently recurring coping strategy items and 6 coping strategy factors (see Table 5). Significant differences were evident for the support from the government stress item, with the 41-50 age group reporting greater stress, but there were no significant differences for the specific stress factors. The 41 – 50 age group reported greater usage of three of the coping strategy items: reorganize my work; set priorities; and deal with problems immediately, whilst the <40 age group indicated significantly more use of the expand interest and activities outside work strategy. Investigation of the 6 coping factors revealed that SEN teachers aged from 41 to 50 used social support and involvement in the situation more often compared to their younger and older colleagues.
Table 5.One-Way Analysis of Variance identifying significant differences by age range for
specific stress and coping strategy items and factorsMean Score (SD) F p< 40 41 - 50 >50
Specific stress items:Support from the government 4.06 4.48 3.85 3.30 0.39Specific Coping items:
104

INTERNATIONAL JOURNAL OF SPECIAL EDUCATION Vol 24 No 1 2009
Reorganise my workSet prioritiesDeal with problems immediatelyExpand interest and activities outside work
5.02 (.97)4.94 (.88)4.79 (1.18)
4.85 (1.21)
5.06 (.95)4.98 (.86)5.11 (.97)
4.00 (.91)
4.44 (1.31)4.96 (1.51)4.36 (1.66)
4.33 (1.52)
4.823.294.43
3.96
.009
.040
.013
.021
Specific Coping Factors:Social supportInvolvement 31.45
19.2432.1319.43
28.9417.48
3.713.67
.026
.028
Table 6 presents the rank order of individual coping strategy items, used by male and female teachers separately. For male teachers the most frequently used coping strategy is looking for ways to make work more interesting (classified as involvement strategy in the OSI), whilst for female teachers this coping strategy is ranked in the sixth position. Additional coping strategies used was attempting to set priorities (a task coping strategy), taking up interests and activities outside work (home and work strategies). Other coping strategies, frequently used by male SEN Greek teachers were found to be stable relationships, effective time management, trying to stand aside and think through the situation, dealing objectively with the situation and planning ahead. Females used predominantly social support strategies such as trying to maintain stable relationships with others. Re-organizing work and dealing immediately with problems (time strategy) were ranked as second and third strategy. Female SEN Greek teachers also resorted to interests and activities outside work, talking to understanding friends, standing aside and thinking through the situation as well as using effective time management.
Table 6.Rank order of mean scores and standard deviations of the most important coping
strategies by gender (N=158)Coping Strategies Rank
Males (N=105) Females (N=53)Look for ways to make the work more interesting 1 6Set priorities 2 5Expand interests and activities outside work 3 7Reorganise my work 4 2Deal with problems immediately 5 3Have stable relationships 6 1Effective time management 7 10Try to stand aside and think through the situation 8 9Try to deal with the situation objectively 9 -Plan ahead 10 4Talk to understanding friends - 8
Stepwise multiple regression analysis was applied, to identify the impact of the frequently used sources of stress items on the most widely used coping strategy items, with the most common predicting stress items being lack of resources and lack of support from the government (see table 7). There was no effect of the source of stress items on the setting priorities coping strategy. The same analysis was used to investigate the predicting effects of a number of demographic variables (e.g. teaching hours, number of students in class, time spent assessing, marital status, years of experience), with dependent variables being the frequently reported stress items and coping strategy items. Table 8 demonstrates the results of this analysis. No predicting demographic variables were identified for the favoritism stress item.
Table 7.Stepwise regression for the key stress items significantly predicting the use of specific Coping
Strategies Dependent Variable (coping strategies)
Predicting Variables (source of stress)
R R 2 p Beta
Find ways to Lack of resources 0.31 0.10 0.001 0.26
105

INTERNATIONAL JOURNAL OF SPECIAL EDUCATION Vol 24 No 1 2009
make work more interestingHaving stable relationships
Lack of resourcesLack of support from government
0.24 0.6 0.012 -0.23
Re-organise work
Lack of support from government
0.38 0.14 0.000 -0.35
Deal with problems immediately
Lack of resources 0.44 0.20 0.000 0.39
Expand activities outside work
Pressure of time at school
0.35 0.12 0.000 0.36
Table 8.Stepwise regression for the key demographic variables significantly predicting
sources of stress and the use of specific Coping StrategiesDependent Variable (Sources of stress)
Predicting Variables (demographic) R R2 p Beta
Lack of resources Teaching hours 0.35 0.12 0.003 0.35Responsibility for pupils
Number of students in classTime spent assessingGender
0.330.460.20
0.110.210.03
0.0040.0040.009
-0.33-0.20
Support from government
PositionTime spent assessingMarital status
0.360.540.60
0.120.270.33
0.0000.0000.014
-0.470.42-0.25
Pressure of time at school
Gender 0.17 0.02 0.025 -0.17
Dependent Variable (Coping strategies)Look for ways to make work more interesting
Teaching hoursLocation
0.340.41
0.100.15
0.0010.040
0.38-0.23
Have stable relationships
Teaching hoursLocation
0.310.41
0.080.14
0.0020.024
0.36-0.26
Re-organise work PositionTeaching hoursYears in positionNumber of students in classYears of experienceTeachers age
0.400.500.550.620.660.18
0.140.230.270.350.390.03
0.0000.0000.0000.0030.0190.017
-0.470.36-0.38-0.29-0.24-0.18
Set priorities Teaching hoursType of schoolPosition
0.310.390.45
0.080.120.16
0.0430.0270.039
0.230.25-0.23
Deal with problems immediately
Position 0.29 0.07 0.012 -0.29
Expand activities outside of work
Hours spent preparing lessonsYears of experience
0.370.45
0.120.18
0.0040.018
-0.33-0.26
Discussion The present study explored the key sources of stress, and the coping strategies used by Greek teachers of children with special educational needs to overcome stress. In addition, the study sought to identify possible predicting factors for both the sources of stress experienced, and the coping strategies employed by Greek SEN teachers. It was shown that the five most important stressors referred to the difficulties of teaching students with SEN due to lack of resources and equipment, their feelings of increased responsibility for their pupils’ well being and education, general lack of support from the government regarding their occupational status, pressure of time at school, and discrimination. When the factor structure of the stress items was examined, these five most frequently recurring stress items were found to load mainly onto the work conditions; work load and organisational problems factors.
106
INTERNATIONAL JOURNAL OF SPECIAL EDUCATION Vol 24 No 1 2009
In line with the classifications proposed by Forlin (2001), with regard to teacher stress, these 5 items may be seen to relate predominantly to the administrative and personal categories.
Lack of equipment and human resources appears to be an issue which is frequently raised by special educational needs teachers in Greece. Teachers may attribute this to lack of support from the government, including lack of official educational guidelines from the state and insufficient opportunities for professional development for SEN teachers. Favoritism, which is often observed within the context of Greek schools and which was also illustrated during the pilot interviews in the study, appears to be related to this, in the sense that teachers who have close personal relationships with head teachers are often favored against others. Lack of resources and equipment was also identified in the studies by Williams and Gersch (2004) and Male and May (1996) with British SEN teachers. Teachers may feel inadequate when they need to balance their responsibilities with shortage of resources and equipment (e.g. libraries, supportive technologies, resource banks) in order to meet the different needs of each pupil, which may lead to high levels of stress and low self-esteem.
When differences between male and female teachers were explored with respect to the five key stressors identified, it was revealed that women scored significantly higher than men with regards to their perceptions of the extent to which responsibility for pupils, and pressure of time at school were considered important sources of stress. Likewise, when differences were explored with regard to the specific stress factors, women reported higher levels of stress with regard to student motivation. However, men were significantly more stressed than women with regards to the difficult student behaviour factor. These findings may imply that the social role and personality differences between men and women, as defined by their gender, may have an impact on their perceptions of stressful factors. However, due to the smaller number of female teachers in the study, any differences related to gender should be treated with caution. Nonetheless, this indication may prove useful in designing teachers’ stress management programmes.
When the frequently reported stress items were compared across different age ranges, the 41 – 50 age groups reported more stress than teachers in the younger and older age groups with regard to perceptions of support from the government. This may reflect that this age group, possibly at a key stage in their career, feel particularly strongly with regards to the lack support provided by governmental authorities. No significant differences in scores for the specific stress factors were identified between the three age groups.
In addition to the identification of specific stressors amongst Greek SEN teachers, this study also investigated the key coping strategies applied by them. Most teachers reported frequent usage of items contributing to mainly active (involvement and task) strategies, for example, taking steps to try to remove or circumvent the stressors or to ameliorate its effects. Examples of active strategies include looking for ways to make the work more interesting, re-organizing the work, and setting priorities. These are termed as task strategies, involvement and time strategies by Cooper (1988) and are very similar to what Carver, Scheier and Weintraub (1989) termed active coping or planning, i.e. initiating action strategies, thinking about what steps to take and how best to handle the problem. Social support strategies, such as having stable relationships were also indicated as main coping strategies. In accordance with the three major categories for SEN coping proposed by Green and Ross (1996), the current study suggests that Greek SEN teachers seem to apply mainly problem focussed and emotion focussed strategies.
There is a growing body of evidence that social support plays a considerable role in reducing the effects of stress on an individual’s health and well-being (Sutherland and Davidson, 1993). Social support provides the individual with opportunities for moral support, sympathy, and understanding (emotion focused), and is also a useful means for seeking advice, assistance or information (problem focused). In the present study, when teachers were asked to indicate their preferred choice of support for sharing work problems, it was revealed that they asked for advice and support principally from colleagues (problem-focused approach) and spouses (emotion-focused approach). Active behaviour, such as problem focused coping is associated with reduced stress and burnout while withdrawal coping strategies such as avoidance appear to be related with higher levels of burnout although it is difficult to ascertain the causal direction of this relationship (Koeske, Kirk and Koeske, 1993; Thornton, 1992).
In the current study, women teachers reported significantly more extensive use of the stable relationship coping strategy than men. This difference may possibly be interpreted by the stereotyped
107

INTERNATIONAL JOURNAL OF SPECIAL EDUCATION Vol 24 No 1 2009
belief that women are more likely to take more emotion-focused actions in general, a suggestion which is reinforced by Admiraal, Korthagen and Wubbens (2000) in that emotion-focused form of coping are often influenced by personality factors.
The literature has documented that individual differences might influence coping, and our findings suggest that female SEN teachers in Greece give priority to building stable relationships, an emotion-focused coping strategy as described above. The literature further demonstrates that women tend to be much more involved in their social networks and are more likely to seek out and use social support (Glynn, Christenfeld and Gerin, 1999; Taylor et al., 2000). No other significant gender differences were identified in the present study with regards to usage of specific coping strategies. However, males reported higher usage of problem-focused strategies, involved in actions that have the goal of changing or eliminating the stressor, for example, by looking for ways to make the work more interesting.
Significant differences across age ranges were identified for a number of the frequently applied coping items. Participants in the 41-50 age group reported greater use of the coping items in relation to re-organizing their work, and dealing with problems immediately, whilst those in the >50 age group scored higher on the item setting priorities. For the frequently reported item in relation to expanding interests outside of work as a coping strategy, teachers in the <40 age group scored significantly higher, perhaps indicating greater opportunities for outside activities in the younger age group. An investigation with regards to age differences in the total facet scores of the coping strategies scale, revealed that teachers in the >50 age range adopted social support and involvement coping strategies less than their younger colleagues, implying that older teachers may feel more equipped to deal with daily hassles at work, and in line with the literature, may experience lower levels of stress (Trendall, 1989).
To identify predictors of the use of the individual coping strategy items, frequently reported stress items were investigated for the whole sample. The results revealed that lack of resources and support from the government were key predictors for the use of a number of coping strategies. Thus, it would appear that these particular stressors are of special importance to SEN teachers in Greece. As previously mentioned, lack of resources tend to be a problem in Greece, and as such, it was somewhat expected that Greek SEN teachers would identify this as particularly stressful, as well as issues with regard to governmental support.
Demographic variables were investigated with a view to identifying their ability to predict sources of stress, and utilisation of specific coping strategies, which revealed a number of findings. Stress with regard to lack of resources was predominantly predictable by the number of teaching hours, whilst support from the government could be predicted by the teacher’s position, time spent assessing, and marital status. Number of students in the class, time spent assessing, and genders were all predictors of stress with regard to responsibility for pupils, whilst gender was also a predictor of pressure of time at school as a stressor. In terms of the use of specific coping strategies, various predicting factors were identified. The number of teaching hours and the location of the school were the key predictors for looking for ways to make the work more interesting, and having stable relationships. Use of the re-organising work strategy was predicted by a number of variables including position, years in position, and number of teaching hours, whilst teaching hours, type of school and position influenced the use of the setting priorities strategy. Finally, dealing with problems immediately was predictable by the teachers position in the school, and the use of the expanding activities outside of work strategy could be predicted by hours spent preparing lessons and years of experience.
As outlined above, a number of factors were found to contribute to specific stressors and coping mechanisms. In particular, factors in relation to time (e.g. teaching hours, time spent assessing, and time spent preparing lessons) feature quite highly in terms of predictors of stress and use of coping strategies. It has been previously reported that working hours of mainstream Greek teachers may be less than in other countries, but in the current study, working hours do appear to be a specific issue. It is possible, that the numbers of working hours are exacerbated in SEN teachers, and that this is further affected by lack of adequate resources
The results of this study highlight a number of significant findings applicable to SEN teachers in Greece. Such findings may be of value to Greek SEN teachers themselves, by helping them to gain insights about their own feelings of stress and the coping procedures which they follow. Moreover, these identifications could help to form suggestions and propositions for the most effective stress
108

INTERNATIONAL JOURNAL OF SPECIAL EDUCATION Vol 24 No 1 2009
intervention programs addressed to SEN teachers, and for training teachers in classroom stress management. It follows that training must help people to become effective in their own work settings. In addition, the curriculum content of postgraduate training programmes for SEN teachers may require reappraisal. There needs to be discussion and decision making on the knowledge and skills which are considered essential or desirable in teachers working with students of all ages with special needs. The findings of the current study could also offer significant information on the measures and adjustments with which the government should be advised to proceed, in order to ameliorate the special education framework in Greece and in this way to reduce the relevant sources of stress. Likewise, the results of this study could prove useful to countries of a similar size and cultural structure to Greece, wherein similar issues in relation to lack of resources, and support from the government might apply.
The present study has a number of limitations. The sample was relatively small, female participants were significantly less than male and there are certain difficulties in generalizing the present findings at a global level, based on a specific sample of teachers in a Greek cultural context. In addition, it is realised that the number of teachers involved in the generation of items for the stress scale was relatively small. It was beyond the scope of this study to consider the existing differences between inclusive and special settings in terms of the work environment and the school structure. The study indicated a significant difference between teachers in mainstream schools, and those employed in special schools, with regard to use of the separate work and home coping strategy. A research study, further examining the differences between SEN teachers working in special schools and those working in inclusive settings regarding their attitudes towards stress and the related coping strategies, might help to fill a gap in the literature. Unfortunately, no previous research in Greek SEN teachers’ stress and coping strategies was available, that could be referred to for the purpose of this study. Likewise, there are few recent studies in the international literature on SEN teachers, as the majority of studies mostly focus on teachers of regular school. Clearly, it is desirable to investigate the issues of teachers’ perceived stress and coping strategies in special education in future international studies. Another issue that should perhaps be examined is if and how different special educational needs influence the levels of SEN teachers’ stress and their coping strategies. Further research is also required to discover whether and how much the coping strategies applied by SEN teachers have a positive or negative effect in the long term.
In conclusion, this study highlights key factors influencing sources of stress, and applied coping strategies in SEN teachers in Greece. It is important to recognise that increased stress levels in teachers could have major ramifications for the teachers themselves, and also for pupils and the school/education provision as a whole. Within the cultural context of Greece, this study provides evidence that lack of resources and support from the government are key issues for Greek SEN teachers, but that the coping strategies applied by them are generally positive. In particular, social support is expected to play a essential role in helping Greek teachers to cope with stress, given the traditional structure of Greece, and the importance of the family.
It is uncertain the extent to which stress and coping in Greek SEN teachers might compare to that of mainstream Greek teachers, but it is possible that stressful issues might be exacerbated in SEN teachers. Further research comparing teachers in SEN settings with mainstream teachers might prove fruitful in furthering our understanding.
Finally, although no hypotheses were generated with regard to age and gender, specific differences were identified which should be taken into consideration when designing stress intervention programmes for SEN teachers. In order to deliver effective education provision, healthy school environments should be created, where members at all levels can work and learn at their maximum potential, and with minimum pressure. Creating healthy schools may be particularly relevant for special education provision, as this study has indicated.
References Admiraal, W.F., Korthagen, F.A.J. & Wubbels, T. (2000). Effects of student-teachers coping behaviour. British Journal of Educational Psychology, 70, 33-52.Alexopoulos, D. (1992). The changing role of secondary school teachers in Greece: sources of stress, occupational stress and job satisfaction. OLME Information Bulletin, 633, 29-31. Antoniou, Α.S. (1999). Mental health, occupational stress and job satisfaction of hospital doctors in Greece. Unpublished PhD Thesis, University of Manchester Institute of Science and Technology.
109
INTERNATIONAL JOURNAL OF SPECIAL EDUCATION Vol 24 No 1 2009
Antoniou, A.-S., Polychroni, F. & Vlachakis, A.-S. (2006). Gender and age differences in occupational stress and professional burnout between primary and high-school teachers in Greece. Journal of Managerial Psychology, 21( 7), 682-690.Billingsley, B. S. & Cross, L. H. (1992). Predictors of commitment, job satisfaction, and intent to stay in teaching: A comparison of general and special educators. The Journal of Special Education, 25, 453-471.Boyle, G. J., Borg, M. G., Falzon, J. M. & Baglioni Jr., A. J. (1995). A structural model of the dimensions of teacher stress. British Journal of Educational Psychology, 65, 49-67. Borg, M., Riding, R. & Falzon, J. (1991). Stress in teaching: a study of occupational stress and its determinants, job satisfaction and career commitment among primary schoolteachers. Educational Psychology, 11, 59-75. Borg, M. G. (2003) Occupational stress in British educational settings: A review. Educational Psychology, 10, 103-126. Brouwers, A. & Tomic, W. (2000). A longitudinal study of teacher burnout and percieved self-efficacy in classroom management. Teaching and Teacher Education, 16, 239-253. Byrne, B. M. (1994). Burnout : Testing the validity, replication, and invariance of causal structure across elementary, intermediate, and secondary teachers. American Educational Research Journal, 31, 645-673. Carver, C. S., Scheier, M. F., & Weintraub, J. K. (1989). Assessing coping strategies: A theoretically based approach. Journal of Personality and Social Psychology, 56(2), 267-283.Chapman, E. & Stone, J. (1996). Visual Impairment. In G. Upton & V. Varma (Eds.), Stress in Special Educational Needs Teachers (pp.57-72). England: Arena. Cooper, C. L., Sloan, S. J. & Williams, S. (1988). Occupational Stress Indicator Management Guide. NFER-Nelson, Windsor. Doune, M. (1999). Teacher attrition: a review of literature. Teaching and Teacher Education, 15, 835-848.Folkman, S. (1984). Personal control and stress and coping processes: A theoretical analysis. Journal of Personality and Social Psychology, 46, 839-852.Fore, C., Martin, C., & Bender W. N. (2002). Teacher burnout in special education: The causes and the recommended solutions. High School Journal [Special Issue: Teacher retention], 86, 36-44.Fraser, B. (1996). Hearing impairment. In G. Upton & V. Varma (Eds.), Stresses in Special Educational Needs teachers (pp. 41-56). England: Arena. Friedman, I. A. (1995). Student behavior patterns contributing to teacher burnout. Journal of Educational Research, 88, 281-289. Forlin, C. (2001). Inclusion: Identifying potential stressors for regular class teachers. Educational Research, 43, 235-245.Galloway, D. (1985). Schools, Pupils and Special Educational Needs. Beckenham: Croom Helm. Glynn, L.M., Christenfeld, N. & Gerin, W. (1999). Gender, social support and cardiovuscular responses to stress. Psychosomatic Medicine, 61, 234-242.Green, S. B. & Ross, M. E. (1996). A theory-based measure of coping strategies used by teachers: the problems in teaching scale. Teaching & Teacher Education, 12, 315-325. Guglielmi, R., & Tatrow, K. (1998). Occupational stress, burnout, and health in teachers: a methodological and theoretical analysis. Review of Educational Research, 68, 61-99. Hock, R. R. (1988). Professional burnout among public school teachers. Public Personnel Management, 17, 167-189.Hui, E. K. P. & Chan, D. W. (1996). Teacher stress and guidance work in Hong Kong secondary school teachers. British Journal of Guidance and Counselling, 24, 199-211. Jaoul, G., Kovess, V. & FSP-MGEN (2004). Le burnout dans la profession enseignante. Annales medico Psychologiques, 162, 26-35.Kelso, T., French D., & Fernandez, M. (2005). Stress and coping in primary caregivers of children with a disability: a qualitative study using the Lazarus and Folkman Process Model of Coping. Journal of Research in Special Educational Needs, 5, 3-10. Koeske, G.F., Kirk, S.A. and Koeske, R.D. (1993). Coping with job stress: Which strategies work best? Journal of Occupational and Organizational Psychology, 66, 319-335. Koustelios, A. & Kousteliou, I. (1998). Relations among measures of job satisfaction, role conflict, and role ambiguity for a sample of Greek teachers. Psychological Reports, 82, 131–136.Kyriacou, C. (2001). Teachers Stress: directions for the future research. Educational Review, 53, 28-35. Lazarus, R. S. & Folkman, S. (1984). Coping and adaptations. In W. D. Gentry (Ed), Handbook of Behavioural Medicine (pp. 282-325). New York: The Guilford Press.
110

INTERNATIONAL JOURNAL OF SPECIAL EDUCATION Vol 24 No 1 2009
Lecavalier, L., Leone, S. & Wiltz, J. (2006). The impact of behaviour problems on caregiver stress in young people with autism spectrum disorders. Journal of Intellectual Disability Research, 50, 172-183. Leondari, A., Kiridis, A., & Gialamas, K. (2000). Occupational stress of primary school teachers. Education Review. 30, 139-161. Male, D. & May, D. (1997). Stress, burnout and workload in teachers of children with special educational needs. British Journal of Special Education, 24, 133-140. Markham, P., Green, S. B., & Ross, M. E. (1996). Identification of Stressors and Coping Strategies of ESL/Bilingual, Special Education, and Regular Education Teachers. The Modern Language Journal, 80, 141-150.Nelson, J.R., Maculan, A., Roberts, M. L. & Ohlund, B. (2001). Sources of occupational stress for teachers of students with emotional and behavioral disorders. Journal of Emotional and Behavioral Disorders, 9, 123-131. Panteliadu, S. (1995). Children with special educational needs in mainstream classrooms: a research approach. Current Education, 82-83, 90-96. Papastylianou, D. (1997). The stress of teachers of comprehensive schools. In F. Anagnostopoulos, A. Kosmogianni & V. Messini (Eds.), Contemporary Psychology (in Greek) (pp. 211-230). Athens: Ellinika Grammata.Pithers, R. T. (1995). Teacher stress research: problems and progress. British Journal of Educational Psychology, 65, 387-392. Pomaki, G. & Anagnostopoulou, T. (2003). A test and extension of the Demand/Control/Social support model: Prediction of wellness/health outcomes in Greek teachers. Psychology and Health, 18, 537-550. Shonfeld, I. S. (2001). Stress in 1st-year women teachers: The context of social support and coping. Genetic Social and General Psychology Monographs, 127, 133-168. Sutherland, V., & Davidson, M. J. (1993). Using a stress audit: the construction site manager experience in the UK. Work & Stress , 7(3), 273-86.Taylor, S.E., Klein, L.C., Lewis, B.P., Gruenewald, T.L., Gurung, R. & Updergraff, J.A. (2000). Biobehavioral responses to sress in females: Tend-and-befriend, ot fight-or-flight. Psychological Review, 109, 751-753.The Information Network in Europe (2005). Eurybase , EURYDICE database providing detailed information on each Education System covered by the network. www.eurydice.org/Eurybase/Application/frameset.asp?country=GR&language=ENThornton, P. (1992). The relation of coping, appraisal, and burnout in mental health workers. The Journal of Psychology, 126(3), 261-271.Travers, C. & Cooper, C. (1996). Teachers Under Pressure: Stress in the teaching profession. London: Routledge. Travers, C.J. & Cooper, C.L. (1993). Mental health, job satisfaction and occupational stress among UK teachers. Work and Stress, 7, 203-209. Trendall, C. (1989). Stress in teaching and teacher effectiveness: A study of teachers across mainstream and special education. Educational Research, 31, 52-58.Upton, G. (1996). Emotional and behaviour difficulties. In G. Upton & V. Varma (Eds.), Stresses in Special Educational Needs teachers (pp. 103-116). England: Arena. Vlachou, A. & Barton, L. (1994). Inclusive education: Teachers and the changing culture of schooling. British Journal of Special Education, 21, 105-107.Ware, J. (1996). Multiple disabilities. In G. Upton & V. Varma (Eds.), Stresses in Special Educational Needs Teachers (pp.117-132). England: Arena.Williams, M. & Gersch, I. (2004). Teaching in mainstream and special schools: are the stresses similar or different? British Journal of Special Education, 31(3), 157-162.
TEACHER EFFICACY, TOLERANCE, GENDER, AND YEARS OF EXPERIENCEAND SPECIAL EDUCATION REFERRALS
Maria Del Carmen Tejeda-DelgadoTexas A&M University
111

INTERNATIONAL JOURNAL OF SPECIAL EDUCATION Vol 24 No 1 2009
Teacher efficacy and teacher tolerance, along with teacher gender, were examined for their relationship with the number of students teachers referred to special education. In a sample of 167 elementary school teachers from an urban school district in the State of Texas, no statistically significant relationships were yielded between teacher tolerance and referrals made to special education; between teacher efficacy and referrals made to special education; and, between teacher years of experience and referrals made to special education. In addition, no differences were found in teacher tolerance and teacher efficacy as a function of gender. Results were not supportive of previous research studies. Implications of these findings are discussed.
Teacher efficacy has been defined as the conviction that one can successfully bring about the desired outcome in one’s students (Gibson & Dembo, 1984). In a study designed to develop an instrument to measure teacher efficacy, Gibson and Dembo determined that teaching could affect specific outcomes in students (teaching efficacy) and beliefs about one’s own ability to bring about student improvement (personal efficacy). They found that efficacy in teachers contributed to methodology and classroom management. Teachers with differing levels of efficacy used different classroom practices such as whole class versus small group instruction and persistence levels in situations where student encounter difficulty in answering questions. Teachers with low efficacy allowed for almost twice as much time for small group instruction than teachers with high efficacy. Further, teachers with low efficacy appeared to reach a point of being flustered easier and more rapidly than their counterparts if their routine was disturbed or ignored. The number of students off-task appeared to be greater within a low-efficacy teacher’s classroom than within a high efficacy teacher. In contrast, teachers with high efficacy were more effective in using cognitive and open-ended questioning strategies to probe and lead student to correct responses and reflections than teachers with low efficacy who tended to move on to another student or another question when a student showed signs of difficulty.
In one of the first studies, conducted in Europe, to examine the relationship between teacher efficacy and referral to special education, Meijer and Foster (1988) found that teachers who had high personal efficacy were less likely to refer students to special education than were teachers with low personal efficacy. The findings of this study were not explored in the United States until 1993 when Podell and Soodak (1993) gave case studies of hypothetical regular education students of varying SES with reading difficulties to regular education teachers and asked them to rate the appropriateness of the students’ current placement as well as how likely they would be to refer such a student to special education. The teachers then completed Gibson and Dembo’s (1984) Teacher Efficacy Scale. In their study, Podell and Soodak (1993) found a relationship between teacher efficacy and student socioeconomic status. Teachers with higher degrees of teacher efficacy were found to refer fewer students to special education than were teachers with lower degrees of teacher efficacy. Referral to special education was not simply related to personal efficacy, but to teaching efficacy as well. The authors concluded, teachers must feel both confident in their own teaching and confident in the effects of teaching in general to agree to retain students with problems in general education (p. 78).
Concomitant with teacher efficacy as a potential factor in teacher referral of students for special education is the variable of teacher tolerance. Shinn, Tindal, and Spira (1987, p. 43) suggested that, the decision to refer a student to special education is an operationalization of a teachers’ tolerance and a statement about the likelihood of the student profiting instructionally from that teacher (p. 43). In other words, teachers’ level of tolerance may be related to the number of students teachers refer to special education. Moreover, the regularity of the referrals may also be related to the level of teacher tolerance.Researchers studying the issue of teacher tolerance have shown that certain behaviors are generally more tolerable in the classroom than others (Algozzine, 1977; Algozzine, Ysseldyke, & Christenson, 1982). Algozzine et al. (1983) gave elementary school teachers case studies to examine, half of which described a student as having immature behaviors and the other half described a student as having unmanageable behaviors. Their sample of teachers was then asked to indicate the extent to which the student had a behavior problem, a learning problem, or both, and to predict future class placement. The teachers were also given a tolerance scale on which they were classified as either highly tolerant or lowly tolerant. Though no differences were found in classifying the students’ disability, these groups differed in their predictions for the future classroom placement of the case study student. Highly tolerant teachers were less likely to predict that the student would be placed into special education than were the less tolerant teachers.
112

INTERNATIONAL JOURNAL OF SPECIAL EDUCATION Vol 24 No 1 2009
In another study in this area, Algozzine and Curran (1978) had teachers rate a hypothetical child’s likelihood to be successful in a regular classroom. Their sample of teachers was given a tolerance measure and were found to have varying tolerance levels for different types of student behavior. These varying levels of tolerance were reflected in their predictions of success for hypothetical students in the regular education classroom with tolerance level and prediction of success positively correlated. Their rationale for these findings was Swap’s (1974) goodness of fit theory that certain teachers can be matched with certain students whose behavior will be readily tolerated in their classroom.
Safran and Safran (1984), in developing a new tolerance scale, reported similar results. In a follow up study using the same measure, they found that special education teachers were generally more tolerant of behavior problems than were regular education teachers. These results were replicated five years later (Ritter & Lamprecht, 1989).
Gersten, Walker, and Darch (1988) evaluated the relationship of teacher tolerance and teacher effectiveness. They stated that teachers with the lowest tolerance for student behavior problems were also most likely to resist students with disabilities in their classroom thereby increasing the number of students they referred to special education. Further, results from the self-report instrument that was utilized in the study, suggested that the same teachers with low tolerance, were also the most effective in working with their students.
Another variable that may influence teacher referral of students for special education, along with the variables previously discussed of teacher efficacy and teacher tolerance, is that of teacher gender. Gender differences have been noted in many areas of study, such as socialization, stereotyping, parenting, free-play, and peer relations (Maccoby, 1988,1991). Most educational research, however, relating to gender and teacher expectancy has focused on the gender of the student, but has paid relatively little attention to the gender of the teacher (Dweck, Davidson, Nelson, & Enna, 1978; Fagot, 1978; Witek, 1997). Differential treatment and expectations have been demonstrated for students based on their gender, as male students received positive feedback for academic abilities and negative feedback for nonacademic issues such as conduct, whereas females were regarded as motivated and diligent, but only received positive feedback for nonintellectual aspects of work, like neatness. Fagot (1978) found that inexperienced teachers, significantly more so than experienced teachers, interacted more with female students engaged in typically feminine activities than male students engaged in typically masculine activities, and reinforced the female students for taking part in feminine activities. Additional researchers have also suggested to the contrary, that student gender is not significantly correlated with teacher referral to special education (Cousineau & Luke, 1990; Dusek & Joseph, 1983). Witek (1997) did not demonstrate a main effect for student gender on teacher referral, but teacher expectations within the study were found to be significantly influenced by student gender.
Researchers have suggested, a more viable target for study would consist of the specific characteristics of the perceiver (Witek, 1997, p.14), who specifically suggested studying the influence of teacher gender. Though some researchers have investigated the influence of teacher gender, most researchers have focused on areas such as perceptions about school safety, the quality of classroom interactions, job satisfaction, and beliefs about student aggression (Dickinson, 2000). The research has not been related to teacher referral.
The extent of research on teacher gender has demonstrated that, generally, female teachers hold more positive beliefs and attitudes toward disabled students than do male teachers. In addition, females are more willing than males to interact with people with disabilities in general (Conine, 1968; Tringo, 1970). Female teachers have also been shown to be more willing to interact with disabled students, and female physical education teachers, in particular, were more likely to integrate these students into class activities (Aloia, Knutsen, Minner, & Von Seggen, 1980).
This researcher located one study in which both teacher gender and teacher referral were involved, however, both of these factors were used as independent variables. Page and Rosenthal (1990) investigated teacher gender as one of the possible influences on student performance. Teachers were instructed to teach proposed academic tasks analysis of variance was conducted. In general, students with male teachers performed significantly better than those students with female teachers. Upon examination, male and female teachers were found to teach differentially depending on the student’s
113
INTERNATIONAL JOURNAL OF SPECIAL EDUCATION Vol 24 No 1 2009
race and gender, thus explaining the difference in student performance scores. Male and female teachers treated students differently, resulting in varying referrals and levels of student performance.
Purpose of the StudyOne component that contributes to the representation of students in special education deals with the factors that influence teachers’ decisions to refer students to special education. The literature clearly indicates that the education system lacks uniformity and consistency dealing with the process of teacher referrals and the factors that influence the referrals and the decision-making process that results in students being placed in special education (Garcia & Ortiz, 1988). In this study, this author investigated several variables to determine the extent to which they influenced teachers’ decisions to refer students for special education. Specifically then, the purpose of the study was to examine the relationships among factors of teacher tolerance, teacher efficacy, teacher gender, years of teaching experience, and number of referrals to special education.
Research QuestionsThe study was guided by five research questions:
1. Is there a statistically significant difference in teacher efficacy between teachers with zero, one to two, and three or more special education referrals?
2. Is there a statistically significant difference in teacher tolerance between teachers with zero, one to two, and three or more special education referrals?
3. Is there a statistically significant difference between teacher years of experience and number of special education referrals?
4. Is there a statistically significant difference in teacher efficacy between male and female teachers as related to special education?
5. Is there a statistically significant difference in teacher tolerance between male and female teachers as related to special education?
MethodParticipants
A total of 676 surveys were sent to teachers via in-school mail within an urban school district in the State Of Texas. Grade levels taught by participants ranged from the first through the fifth grade. Out of the 676 surveys sent to teachers, 167 surveys were returned, for a response rate of 24%, deemed acceptable by Gall, Gall, and Borg (2003). As would be expected, given that this sample of teachers was taken from elementary schools, that 152 (91%) were females and 15 (9%) were males. Participant ethnicity was fairly equally split among Whites (n = 82, 48%) and Hispanics (n = 78, 47%), with 3 Black teachers, and 4 who selected Other for their ethnic membership. The percentage of Whites and Hispanics who completed the survey correspond to the percentage of White and Hispanic teachers in this urban school district. Ages and years of teaching experience are shown in Table 1.
Table 1Demographic Characteristics of Participants
Characteristic n %Age at time of survey (years)
20-29 21 1230-39 42 2540-49 56 3450-59 43 2660-69 5 3Teaching Experience1-9 69 419-19 48 29
Out of the respondents represented in grades first through fifth, the distributions were somewhat evenly distributed across grade levels (1st = 22.2%, 2nd =18.6%, 3rd = 22.8%, 4th = 23.4%, and 5th = 13.2%). Teachers were asked, in the survey, to report the number of students they had referred to special education in the current year. Table 2 indicates 61 or 36.5% reported that they did not refer any students, 75 or 44.9% reporting that had referred one to two students, 25 or 15% indicating that they had referred three to four students to the special education program on their campus.
Table 2
114

INTERNATIONAL JOURNAL OF SPECIAL EDUCATION Vol 24 No 1 2009
Number of Teacher Referrals to Special Education
Number of Referrals Made Number of Teachers Percentage0 61 36.51-2 75 44.93-4 25 15%5-6 4 3%7-8 1 .6%9-10 1 .6%
InstrumentationThe Likert scale measuring efficacy ranged from 1 (strongly disagree) to 5 (strongly agree) with a score of 3 indicating a neutral response. The Likert scale measuring tolerance ranged from 1 (extremely intolerable) to 5 (extremely tolerable) with a score of 3 indicating a neutral response.
A scale item was calculated for each teacher efficacy question from the 11 original Likert items. Following a reliability analysis, three items were removed, items 3, 9, and 11, due to their low corrected item total correlations. The resulting Alpha coefficient for the 8-item teacher efficacy scale was .77 and had a mean of 31.45 and a standard deviation of 4.18. The teacher efficacy scale items were: Personal Dedication; Personal Expertise; Re-Teaching Capacity; Technique Capacity; Assessment; Training; Personal Dedication; Teaching Approaches; Parental Support; Home Experiences; and, Extrinsic Factors.
A scale item was also calculated for Teacher Tolerance from the original 14 Likert-type items. A reliability analysis was conducted and one item was removed, item seven due to its low corrected item total correlation. The resulting coefficient for the 13-item Teacher Tolerance scale was .87. The Tolerance Scale had a mean of 31.70 and a standard deviation of 6.48. Items on the Teacher Tolerance Scale were: Self-Evaluation; Irrelevant Responses; Repeated Instruction; Irrelevant Responses; Off-Task-Behaviors; Frustration Level; Irrelevant Responses; Destructive Nature; Abusive Behavior; Collaborative Capacity; Responsibility Level; and, Off-Task Behaviors.
When scores are measured on an ordinal scale, a great number of researchers believe it is not appropriate to use the mean to describe central tendency (Gravetter & Wallnau, 2004). For an ordinal item, such as a Likert-type scale, scores are ordered categories and do not allow one to determine distance. In cases such as this, the median is invariably appropriate and is generally the accepted and preferred measure of central ten Table 3 includes descriptive statistics for the original Teacher Efficacy and Table 4 has the median response for the Teacher Tolerance survey items.dency (Gravetter & Wallnau, 2004).
Table 3Median Responses for the Teacher Efficacy Survey Items
Variable MedianPersonal Dedication 4Personal Expertise 4Re-teaching Capacity 4Technique Capacity 4Assessment 4Training 4Personal Dedication 4Teaching Approaches 4Parental Support 4Home Experiences 4Extrinsic Factors 2
Table 4Median Responses for the Teacher Tolerance Survey Items
Variable MedianSelf-Evaluation 3Irrelevant Responses 3Repeated Instruction 3Off-Task Behaviors 3
115

INTERNATIONAL JOURNAL OF SPECIAL EDUCATION Vol 24 No 1 2009
Frustration Level 3Irrelevant Responses 3Destructive Nature 1Abusive Behavior 1Collaborative Capacity 2Responsibility Level 2Off-Task Behaviors 2
None of the items had a median score of five, representing a central response of strongly agree. Six of the items had a median score of four, representing a response of agree. Efficacy dealing directly with student behaviors had five while factors related directly to the teacher’s ability to meet the students’ individual needs, had one. The smallest sample median response was one indicating a median response of disagree for the efficacy question dealing with outside factors and contributors.
On the Teacher Tolerance measure, nine of the items had a median score of two, representing Intolerable, causing problems. None of the items had a median response of five or four, representing Extremely Tolerable and Tolerable respectively. However, three items reflected a median score of three, representing a response of Somewhat disturbing, but not intolerable. The remaining Tolerance Likert-type questions had the smallest sample median of 1, indicating a median response of Extremely Intolerable.
Of the computed measurement scale items dealing with teacher efficacy and number of referrals, two or more had the highest mean (M = 32.03, SD = 4.31), indicating that respondents with the highest efficacy score made two or more special education referrals per school year. Those teachers who referred no students to special education had the lowest mean (M = 32.01, SD = 3.96). Of the computed measurement scale items dealing with teacher tolerance, one number of referrals had the highest mean (M = 31.88, SD = 6.31), indicating that respondents with the highest Tolerance score made at least one special education referral per school year. Those teachers who referred two or more students to special education had the lowest mean (M = 31.13, SD = 8.62).
ResultsAll variables were initially screened for accuracy and normality through computing descriptive statistics for each test variable. Frequency distributions with histograms and descriptive statistics (mean or median, standard deviation) were used to identify any characteristics of shape or distribution that might affect the analysis. Because all variables were found to be within normal limits, parametric procedures were conducted for all statistical analyses.
Research Question OneIs there a statistically significant difference in teacher efficacy according to the Teacher Efficacy Scale used by Gibson and Dembo (1984) between teachers with zero, one to two, and three or more special education referrals?The SPSS General Linear Model procedure Univariate Analysis of Variance (ANOVA) was utilized to test this hypothesis. Specifically, a one-way ANOVA was conducted to evaluate the relationship between teacher efficacy and the number of special education referrals made by teachers. The independent variable, the referral factor, included three levels: zero, one to two, and three or more number of referrals. The dependent variable was the efficacy score on the teacher efficacy scale item. The ANOVA was not statistically significant, F (2, 161) = 1.98, p > .05. Thus, the level of teacher efficacy did not differ according to the number of special education referrals made by the teacher.
Research Question TwoIs there a statistically significant difference in Teacher Tolerance between teachers with zero, one to two, and three or more special education referrals?A one-way ANOVA was used to address the relationship between teacher tolerance and the number of special education referrals made by teachers. The independent variable was again the referral factor, with the dependent variable this time being the teacher tolerance score. Results on this ANOVA were not statistically significant, F (2, 159) = .145, p > .05. Thus, the level of teacher tolerance did not differ according to the number of special education referrals made by teachers.
116

INTERNATIONAL JOURNAL OF SPECIAL EDUCATION Vol 24 No 1 2009
Research Question ThreeIs there a statistically significant difference in teacher years of experience and number of special education referrals?Again, a one-way ANOVA was used to evaluate the relationship between teacher years of experience and the number of special education referrals made by teachers. The independent variable was again the referral factor, with the dependent variable being years of teaching experience. The ANOVA failed to yield a statistically significant finding, F (2, 164) = 1.87, p > .05. Thus, the level of teacher experience did not differ according to the number of special education referrals made by teachers.
Research Question FourIs there a statistically significant difference in teacher efficacy between male and female teachers as related to special education?A one-way ANOVA was conducted to evaluate the relationship between teacher efficacy and teacher gender, with the independent variable being teacher gender and the dependent variable being the teacher efficacy score. This ANOVA was not statistically significant, F (1, 160) = .341, p > .05. Thus, the level of teacher efficacy did not differ according to teacher gender.
Research Question FiveIs there a statistically significant difference in teacher tolerance between male and female teachers as related to special education?Again, a one-way ANOVA was conducted to evaluate the relationship between teacher tolerance and teacher gender, with the independent variable being teacher gender and the dependent variable being the teacher tolerance score. Results on the ANOVA were not statistically significant, F (1, 158) = 1.22, p > .05. Thus, the level of teacher tolerance did not differ according to teacher gender.
The results supported the conclusion that the level of teacher efficacy and the level of teacher tolerance, respectively, were not directly related to the number of students who are referred to special education in this urban area school district in the State of Texas. Moreover, the results indicated the teachers with a lower degree of teacher efficacy as well as the teachers with a lower degree of teacher tolerance did not significantly differ in the number of special education referrals than their counterparts with a greater degree of teacher efficacy and a greater degree of teacher tolerance. The related ANOVA tests of statistical significance collectively support the inability to reject the null hypotheses set forth in the first five quantitative research hypotheses that stated there was not a significant difference between teacher efficacy, teacher tolerance, teacher ethnicity, teacher experience and teacher gender and the number of special education referrals.
DiscussionThe purpose of the study was to examine the extent to which teacher factors such as teacher tolerance, teacher efficacy, gender, years of teaching experience, and number of referrals to special education were related. In doing so, this researcher discussed the referrals of students to special education and investigated the factors associated with teacher tolerance and teacher efficacy with relation to special education referrals.
Analyses of the teacher efficacy score did not support the research findings of Gibson and Dembo (1995) in which teacher efficacy and number of referrals to special education were found to be strongly related. In this study, no such relationship was present. However, much of the literature indicates teacher efficacy is defined as the conviction that one can successfully bring about the desired outcome in one’s students. Furthermore, the literature supports that public school teachers with differing levels of efficacy differ in classroom practices such as whole class versus small group instruction, persistence levels in situations where students encounter difficulty in academia, which may result to an alternative such as Special Education Placement.
Findings from this study were also not supportive of the research findings of Safran and Safran (1985) who reported that teacher tolerance and number of referrals to special education were strongly related. Wig and Semmel (1984), defined tolerance as, the summarization of the interaction of teacher, target student, and peer characteristics in such a way as to define (a) modal range within which students are perceived as ‘teachable’ and (b) a preference for some observable distribution of learning outcomes . Shinn et al. (1997) suggested that the decision to refer a student to special education is an operationalization of a teachers’ tolerance and a statement about the likelihood of the student profiting
117

INTERNATIONAL JOURNAL OF SPECIAL EDUCATION Vol 24 No 1 2009
instructionally from that teacher. Furthermore, the literature supports that public school educators are the most able to be empowered to change or impact the special education referral system as we have known it.
Respondents, on average, were neutral about the role that Teacher Efficacy and Teacher Tolerance played in their decision to refer a student. Moreover, present in the data was that each Teacher Efficacy indicator measured from 2 to 4, with 2 being Disagree and 4 being Agree. With regard to Teacher Tolerance, the indicators ranged from 1.8 to 3.1, with 2 being Intolerable. However, indicated in the teacher tolerance literature was that certain behaviors are generally more tolerable in the classroom than others depending on the level of tolerance of the teacher. Further, the decision to refer a student to special education has been demonstrated to rely heavily on the level of teacher tolerance a particular teacher possesses (Algozzine & Christenson, taken from Algozzine et al. (1982).
The analysis of quantitative data reveals that the indicators related to the factors behind special education referrals are complicated and are difficult to measure. An Efficacy Scale developed by Gibson and Dembo (1984) was utilized to measure the relation between degrees of efficacy and the number of special education referrals teachers make. In addition, a Tolerance Scale developed by Safran and Safran (1984) was incorporated in the survey to measure whether or not there was a significant relationship between teacher tolerance and the number of special education referrals teachers make. However, neither scale yielded results significantly linking them to the number of referrals teacher make.
ReferencesAlgozzine, B. (1977). The emotionally disturbed child: Disturbed or disturbing? Journal of Abnormal Child Psychology, 5, 205-211.Algozzine, B., & Curran, J. (1978). Elementary teachers’ tolerance of problem behaviors. The Elementary School Journal, 243-244.Algozzine, B., Ysseldyke, J., & Christenson, S. (1982). Probabilities associated with the referral to placement process. Teacher Education and Special Education, 5, 19-23.Aloia, G.F., Knutson, R, Minner, S.H., & Von Seggen, M. (1980). Physical education teachers’ initial perceptions of handicapped children. Mental Retardation, 18, 85-87.Conine, T.A. (1968). Teachers’ attitudes toward disabled persons. Dissertation Abstracts International, 29, 4102A.Cousineau, W.J., & Luke, M.D. (1990). Relationships between teacher expectations and academic learning time in sixth grade physical education basketball classes. Journal of Teaching in Physical Education, 9, 262-271.Dickinson, G. (2000). Job satisfaction and teacher union membership. Dissertation Abstracts International, 61, 2118A. Dusek, J.B., & Joseph, G. (1983). The bases of teacher expectancies: A meta-Analysis. Journal of Educational Psychology, 5, 327-46.Dweck, C.S., Davidson, W., Nelson, S., & Enna, B. (1978). Sex differences in learned helplessness: II. The contingencies of evaluative feedback in the classroom III. Developmental Psychology, 14, 268-276Fagot, B.I. (1978). Reinforcing contingencies for sex-role behaviors: Effects of experience with children. Child Development, 49, 30-36.Gall, M.D., Gall, J.P., & Borg, W.R. (2003). Educational research: An introduction. 7th edition. Upper Saddle River, NJ: Pearson Education, Inc.Garcia, S.B., & Ortiz, A.A. (1988). Preventing inappropriate referrals of language minority students to special education. New Focus: The National Clearinghouse for Bilingual Education (5).Gersten, R., Walker, H., & Darch, C. (1988). Relationship between teachers’ effectiveness and their tolerance for handicapped students. Exceptional Children, 54 (5), 433-438.Gibson. J., & Dembo, M. (1984). Teacher efficacy: A construct validation. Journal of Educational Psychology, 76, 569-582.Gravetter, F.J., & Wallnau, L.B. (2004). Statistics for the behavioral sciences. 6th edition. Belmont, CA: Thomson Learning, Inc.Maccoby, E. (1988). Gender as a social category. Developmental Psychology, 24, 755-765.Maccoby, E. (1991). Gender and relationships: A reprise. American Psychologist,46, 538-539.Meijer, C.J.W., & Foster, S.F. (1988). The effect of teacher self-efficacy on referral chance. The Journal of Special Education, 22, 378-385.
118

INTERNATIONAL JOURNAL OF SPECIAL EDUCATION Vol 24 No 1 2009
Page, S., & Rosenthal, R. (1990). Sex and expectations of teachers and sex and race of students as determinants of teaching behavior and student performance. Journal of School Psychology, 28, 119-131.Podell, D.M., & Soodak, L.C. (1993). Teacher efficacy and bias in special education referrals. Journal of Educational Research, 86 (4), 247-253.Ritter, D.R., & Lamprecht, M. (1989). Teachers’ perceptions of problem behavior in general and special education. Exceptional Children, 55 (6), 559-564.Safran S.P., & Safran, J.S. (1984). Elementary teachers’ tolerance of problem behaviors. The Elementary School Journal, 85 (2), 237-243.Safran, S.P., Safran, J.S., & Barcikowski, R.S. (1985). Differences in teacher tolerance: An illusory phenomena? Behavioral Disorders, 11, 11-15.Shinn, M.R., Tindal, G.A., & Spira, D.A. (1987). Special education referrals as an index of teacher tolerance: Are teachers’ imperfect tests? Exceptional Children, 54 (1), 32-40.Swap, S.M. (1974). Disturbing classroom behaviors: A developmental and ecological view. Exceptional Children, 41, 163-172.Tringo, J.L. (1970). The Hierarchy of Preference Toward Disability Groups. Journal of Special Education, 4, 3, 295-306, Sum – F 70.Wiig, S. (1984). Understanding Williams Syndrome: The clinical evaluation of language functions. 65-66.Witek, J.M. (1997). The influence of teacher gender-type on teacher attributions and expectancy for student success. Northern Illinois University.
119