running head: fluid and crystallized g vs. m.i.: sem of
TRANSCRIPT

Running Head: FLUID AND CRYSTALLIZED G VS. M.I.: SEM OF HUMAN
INTELLIGENCE 1

FLUID AND CRYSTALLIZED G VS. M.I.: SEM OF HUMAN INTELLIGENCE 2
Fluid and Crystallized g vs. Multiple Intelligence: A Structural Equation Modeling Study of
Human Intelligence Theories & Measurement
A Thesis Submitted in Partial Fulfillment of Requirements for the Master of Science Degree in
Educational Psychology
By
Bryan Eastes
Bachelor of Science,
George Mason University, 2012
Director: Kimberly Sheridan, Associate Professor
Educational Psychology
Spring Semester 2016
George Mason University
Fairfax, Virginia

FLUID AND CRYSTALLIZED G VS. M.I.: SEM OF HUMAN INTELLIGENCE 3
Abstract
The thesis investigated debated intelligence theories: Cattell’s (1943) “Theory of Fluid and
Crystallized Intelligence” and Gardner’s (1983) “Theory of M.I.” The research asks: Which
existing theory-based and hypothetically based measurement models of intelligence fit the
measurement data better? How does a traditional vs. modified M.I. Theory measurement model
fit? How does a combined measurement model of the theories fit? Participants (n=287) were
students (age 18-25) from a top-tier East-Coast university. Approximate statistical power is .90
with effect size of .5 (p≤.05). Participants were administered the Reynolds Adaptable Intelligence
Test and Multiple Intelligence Developmental Assessment Scales. Structural equation modeling
revealed better fit for the “Theory of Fluid and Crystallized Intelligence” data (χ2(4) =8.08,
p=.09; CMIN/d.f.=2.02; RMSEA= .06; TLI= .98; CFI= .99; IFI=.99; SRMR=.0221). The
traditional Theory of M.I.” model fit was insupportable (χ2(300) =1441.448, p<.000;
CMIN/d.f.=4.80; RMSEA= .12; TLI= .61; CFI= .64; IFI=.65; SRMR=.2239), but alternative
M.I. models were supported. A correlated M.I. model (χ2(264) =569.09, p<.001;
CMIN/d.f.=2.16; RMSEA= .06; TLI= .88; CFI= .90; IFI= .91; SRMR=.06) and 4-factor model
M.I. with distinct bodily-kinesthetic and musical talent (χ2(267) =526.32, p<.001;
CMIN/d.f.=2.12; RMSEA= .06; GFI=.91; TLI= .92; CFI= .94; IFI= .94; SRMR=.06) show
acceptable to good fit. A M.I. Indicator & R.A.I.T. TII to g SCU Model shows good fit (χ2(120)
=247.56, p<.001; CMIN/d.f.=2.06; RMSEA= .06; TLI= .89; GFI=.94; CFI= .96; IFI= .96;
SRMR=.10). Current findings are further discussed in relation to analogous studies.

FLUID AND CRYSTALLIZED G VS. M.I.: SEM OF HUMAN INTELLIGENCE 4
Introduction
The thesis topic is the construct, theory, and measurement of human intelligence. The
research tests two opposing and intensely debated theories of intelligence (Allix, 2000; Castejon,
Perez, & Gilar, 2010; Gardner, 1999, 2006; Gardner & Connell, 2000; Gardner & Krechevsky,
2006; Visser, Ashton, Vernon, 2006a, b; Waterhouse, 2006a, b). Gardner’s (1983) “Theory of
Multiple Intelligence (M.I.)” states that the biological human brain consists of eight uncorrelated
areas of intelligence that elicit expertise through distinct ability channels (Connell, Sheridan, &
Gardner, 2004). Cattell’s (1943) “Theory of Fluid and Crystallized Intelligence” states that
intelligence is composed of two factors. Humans have an amount of fluid intelligence, primarily
in the cortical of the brain, elicited in basic and extended logic and relations. Crystallized
intelligence is an ability, acting as an agency, primarily in the hippocampal area of the brain
influenced by fluid investment and basic learning (Cattell, 1987). Cattell’s “Investment Theory”
explains the correlation between fluid and crystallized intelligence that is also proportionate with
age.
When I was young and at the mall, there was a large piece of artwork in the front of an
art store picturing a large house on the water with several cars outside of the garages. The
representation contained electronic blinking lights throughout the picture. The caption on the
artwork read “Justification for Higher Education.” It is a beginning fact that intelligence is
related to education. The concept of intelligence has developed into a variety of relations,
theories, factors, connotative terms, subjective materials, and debates on its origins, processes to
obtain it, structure, function, and variance between humans in past and present research,
philosophy, and literature worldwide. A general definition of intelligence is the operational
combination of learning, including academic, achievements with an umbrella of ability that are

FLUID AND CRYSTALLIZED G VS. M.I.: SEM OF HUMAN INTELLIGENCE 5
expected and supported throughout life (Cattell, 1940, 1943; Gardner, 1983, 1999; Spearman,
1904; Sternberg, 1984). The definition can be applied wholly to three separate and prominent
theories of intelligence that all have empirical and validity evidence for their constituents, but
these constituents pointedly vary causing debate and a problem for research. Cattell’s “Theory of
Fluid and Crystallized Intelligence” is an extension of Spearman’s “General Intelligence, g-
Factor, Theory of Intelligence”. The third theory is Gardner’s “Theory of M.I.” which broke
away from most traditional conceptions by countering through research-based appeal major
shortcomings of a general or even correlated system of intelligence. There are other theories
separate from one another within the fields of intelligence and education, but they have an
essence of cogency, or take sides with those theories. From the definition, other achievements
exist but if there is to be a human intelligence that all humans possess individually then that is a
good general definition. I once had a professor who strongly stressed the distinctions between
ability, achievement, and aptitude, which I do not disagree with for the sake of being in an
assessment, evaluation, and testing concentrated program, but these constructs become
applicable when conceptualizing another construct like intelligence. Combinations of those
achievements can serve to make up a good comprehensive profile of an individual.
Achievements occur on several levels. Developing from an embryo to a healthy fetus is a
biological achievement. Learning to walk is an achievement in two forms. It is a physical
achievement and a learned achievement, and the achievements go hand in hand via the neural
connections between the human central and peripheral nervous system and skeleton. In
evolutionary terms, the fact that humans do walk, and upright, is a form of intelligence.
However, all in all, walking upright is distinguished from an overall accepted conceptualization
of human intelligence. According to Darwinian philosophy, and conceptualization of survival of

FLUID AND CRYSTALLIZED G VS. M.I.: SEM OF HUMAN INTELLIGENCE 6
the fittest, human’s ability to walk upright is due to gains in intelligence over time (Darwin, Beer
(Ed.), 2008). A consistent mental striving and reasoning to need something that required standing
upright proved beneficial to earlier humans whether it was to gain food, safety, or empathy.
According to Darwin, traits that prove to benefit life are passed on while traits that are unneeded
are left behind in the evolutionary process (Darwin, Beer, 2008). Walking upright is now
considered a physical trait while intelligence is considered a mental trait. David Hume (2007)
made notions that at one time philosophers credited intelligence to everything in the world.
Humans are naturally altruistic beings and strive to pass down in the form of intelligence what
has helped them and the groups survive (Compte & Bridges (Trans.), 2009; Trivers, 1971). Most
species altruistically form social groups and differences in survival and intelligence tactics does
not take away from an altruistic nature. Humans must reason to survive regardless of culture, and
Cattell’s (1940; 1943) definitions of fluid intelligence accounts for this reasoning. Gardner’s
(1999) eight intelligence criteria includes an evolutionary plausibility of continued need. In
conceptualizing the term intelligence, there is a difference between natural survivability and
what is taught in schools, but the difference is not so divergent. Higher education is passed down
from elders to children, adolescents, and young adults as it logically and developmentally fits
(Flavell, Miller, & Miller, 2002; Lehalle, 2006; Piaget, 1999). The “justification for higher
education” picture supports this notion. The purpose of this study is to investigate two debated
theories of intelligence via contemporary and competitively valid measures and analysis. Both
Gardner’s (1983) “Theory of M.I.” and Cattell’s (1943) “Theory of Fluid and Crystallized
Intelligence” have empirical evidence for them, and comparative studies have been unable to
refute adequately either theory. A structural equation modeling approach is taken to analyze
intelligence data between the two theories.

FLUID AND CRYSTALLIZED G VS. M.I.: SEM OF HUMAN INTELLIGENCE 7
Cattell’s (1940; 1943) “Theory of Fluid and Crystallized Intelligence” states that the
brain has a single intelligence that is compounded of natural human problem-solving fluid ability
and crystallized ability that is gained within the environment. Investment Theory further states
that fluid ability invests in crystallized ability (Cattell, 1987).
Gardner’s (1993) “Theory of M.I.” states that M.I. exist and lie in the biological human
brain located in distinct areas. According to Gardner (1993), each intelligence has its own set of
correlating indicators, but the intelligence themselves do not correlate. According to Gardner’s
M.I. Theory, processes of ability working within the brain connect with the intelligence, and
abilities can elicit and gain expertise in the environment (Connell, Sheridan, & Gardner, 2004).
Recent advancements in cognitive neuroimaging have brought forth research that would more
than likely support Gardner’s biopsychological theory of M.I. if it were correct; however, these
studies rely more on traditional theory for measuring intelligence and have had varying results
related to the theory.
Both of the theories have been met with applaud and criticism. Gardner’s theory has been
widely applied in educational settings (Chen, Moran, & Gardner, 2009). Gardner (2004) states
that his theory holds up in educational settings because the theory is correct. Gardner (1999)
states that even though M.I. theory is not an educational, but a scientific, theory, educator’s
conceptualizations of intelligence are the most valid. In the same vein, Gardner does not believe
that teachers should believe that they can elicit intelligence from others for any particular reason;
thus, Gardner implicitly asks for a well-designed instrument to measure M.I. Gardner’s (1999)
criteria for intelligence includes psychometric evidence that includes the distinction between the
identified intelligence. Gardner consistently defends his theory while rebuking traditional
intelligence theory saying that the traditional psychological view of intelligence does not carry

FLUID AND CRYSTALLIZED G VS. M.I.: SEM OF HUMAN INTELLIGENCE 8
hope for success. Cattell’s theory is expanded, and it applies in education and scientific settings
in original and extended form. The theories have been tested against each other in a number of
empirical research settings (Almeida et al., 2010; Castejon, Perez, & Gilar, 2010; Gardner, 1999,
2006; Gardner & Krechevsky, 2006; Visser, Ashton, Vernon, 2006a, b).
Intelligence is a conceptual entity thus is explained through scientific theories rather than
any scientific laws. The way intelligence is defined and conceptualized makes it a measurable
concept. The measurement of intelligence has come to be put forward as a somewhat separate
field in its philosophy and theory. All psychological constructs for a normal population should be
able to be measured. This study is based on two theories of intelligence and the measurements
based on those theories. Cattell’s (1943, 1963) “Theory of Fluid and Crystallized Intelligence”
and Gardner’s (1993) “Theory of M.I.” are analyzed individually and comparatively in this
measurement and structural model and factor analytic design study through the methods of
which they are most validly measured. A psychometric analysis versus a psychometric theory is
utilized to make statistical inferences about the theories.
The former theory is more precise in its definition of intelligence while the latter’s
definition constructs intelligence as a brain and cognitive ability that is elicited as what it
implies, intelligence. Human intelligence is a construct surrounded by numerous definitions,
philosophical viewpoints, and theories. Measurement is a significant matter of validity, but
validity to any extent does not make a theory a scientific law or imply causation in human
behavior or reference. Psychometric validity only enhances construct validity and is not the sole
impact of a theory.
Traditionally speaking, general theories of psychology and intelligence and learning have
been for the most part held between behavioral, cognitive, psychoanalytic, developmental,

FLUID AND CRYSTALLIZED G VS. M.I.: SEM OF HUMAN INTELLIGENCE 9
environmental, epistemological, genetic, neuronal, and psychometric concentrations in the
domains of psychology and education. Both theories in this study have been exceptions in that
Gardner’s theory was developed from a dynamic perspective and Cattell’s theory has become
what is widely conveyed a psychometric theory because it quantifies abilities. The theories are
instructed within their respective course titles or sections of a course devoted to the concentration
in high school, college, and university courses. All of these fields arose out of another area
practiced and taught prior but whether through popularity or research became its separate field.
More and more programs are now taking dual, tri-, and even quad- perspectives such as social-
cognitive, cognitive neuroscience, social-cognitive-behavioral neuroscience psychologies. The
American Psychological Association (APA) consists of fifty-four psychology divisions alone.
Reasoning leads many psychologists to propose more innovative, dynamic theories of what
intelligence, and other concepts, is and are within the fields and domains of psychology and
education and how and why humans and even other species process and express intelligence.
The construct of intelligence is popular in society due to its interesting nature and ability to
predict and classify observed behaviors and realistic outcomes. The measurement field has
adopted the construct of intelligence because it is such a latent factor that there is much
opportunity for studying it.
The two utmost proposed theories of intelligence are Cattell’s (1943, 1963) cognitive
“Theory of Fluid and Crystallized Intelligence” and Gardner’s (1993) biopsychological “Theory
of M.I.” Cattell’s (1943) “Theory of Fluid and Crystallized Intelligence” is the utmost theory of
intelligence based on the continued research of its core assumptions of an inherent intelligence,
gf, and a learned intelligence, gc, that ultimately flourishes. Cattell’s core assumptions have
developed into even further extended theories that add multiple lower-order factors at multiple

FLUID AND CRYSTALLIZED G VS. M.I.: SEM OF HUMAN INTELLIGENCE 10
hierarchies that have added support and validity to the multiple vs. single general, g, factor
assumption in many models (Cattell, 1987; Carroll, 1993; Horn & Cattell, 1966; Horn & Noll,
1997). Cattell’s theory is a baseline in most structural theories presented. Factor analyses have
and continue to open doors to identify evidence for sets of separated factors which are borderline
but calculable entities. Horn and Cattell’s (1966) revision adding visualization, speediness,
retrieval, and precision states that “nonintellectual traits” are accounted for, even though Cattell
(1943) put these traits aside (p. 207). The extension of the measurement of a construct does not
necessarily override the basic tenets of a theory, as with the Cattell-Horn-Carroll (CHC) theory
(Cattell, 1987). Carroll’s “Three-Stratum Theory” added to the Horn and Cattell revision by
factor analyzing Spearman’s (1904) single g back into the third-order, overall, structure and
narrow abilities of the revised factors, including factors of fluid and crystallized, into the first-
order. Cattell’s theory has been sought and applied in many educational settings. Ackerman’s
(1996) Process, Personality, Interest, Knowledge (PPIK) theory of intelligence is a separate
theory and adds several peripheral constructs. Cattell studied and contributed to the measurement
of personality but distinguished it from intelligence, and for reasons of two robust factors, named
fluid and crystallized intelligence, dismissed the trivial factors attributed to motivation in
intelligence theory testing (Cattell, 1963). Gardner’s (1993) “Theory of M.I.” is the theory of
intelligence most researched and applied in educational systems, especially classrooms (Chen,
Moran & Gardner, 2009). According to Gardner, the “Theory of M.I.” is a biological theory of
intelligence though many fields of psychology went into developing the theory. Carroll (1993)
indicates that the CHC theory model somewhat resembles Gardner’s M.I. Cattell’s theory rose
out of empirical evidence for human intelligence and its measurement and structure. There has

FLUID AND CRYSTALLIZED G VS. M.I.: SEM OF HUMAN INTELLIGENCE 11
been longstanding direct and indirect debate within and between the two theories as well as what
may be considered acceptance or an integration of both.
Raymond Cattell’s (1943) “Theory of Fluid and Crystallized Intelligence” states there are
two primary factors, gc and gf, within Spearman’s (1904; 1914) higher-order general intelligence,
g-factor; however, Spearman noted the possibly of a structure of factors. Cattell’s (1943; 1987)
“Investment Theory” of fluid intelligence states that fluid intelligence is the third-order factor for
crystallized intelligence (p. 146). According to Cattell (1987), crystallized intelligence is most
significantly moderated by investments of Fluid intelligence throughout life. Crystallized
intelligence is also composed of memory, motivation, and time. Second-order fluid intelligence
moderates culture fair tests at first-order, e.g. matrices, some crystallized subtests, and memory.
Crystallized intelligence moderates first-order general cognitive and achievement variables
reflected from motivation and memory for achievement factors. These last factors, as well as
personality factors, were identified in the original theory and factor analysis (Cattell, 1943;
1963). Cattell’s (1987) “Triadic Theory” of ability removes visual from g intelligence and
categorizes it with provincial powers, p, of auditory, tactile, and cerebellar. Powers of g and p
and learning and motivation interests and experience are reflective of the agencies of verbal,
numerical, spatial, mechanical, and crystallized intelligence that all reflect and form a single
measured factor of crystallized intelligence (p. 380). Cattell (1963) found motivation, and
personality, to be somewhat insignificant in terms of eigenvalues, and current research
distinguishes motivation from intelligence (Gagne & St Père, 2002). Cattell’s subsequent
theories continued the notion that his theory superseded additional findings and notes.
The “Theory of M.I.”, as presented by Howard Gardner (1993), claims to have been
developed from research withing and between many fields. These fields include neuroscience to

FLUID AND CRYSTALLIZED G VS. M.I.: SEM OF HUMAN INTELLIGENCE 12
“psychometrics” to “differential” to “experimental” to “cognitive” to “developmental”; still,
Gardner’s definition of an intelligence is a “biopsychological potential to process information
that can be activated in a cultural setting to solve problems or create products that are of value in
a culture” (Gardner & Moran, 2006, p.227). According to Gardner and Moran (2006),
intelligence is “composites of fine-grained neurological subprocesses but not those subprocesses
themselves, as biopsychological information processing capacities, and as the bases on which an
individual can participate in meaningful activities in the broader cultural milieu” (p. 227).
In some senses, Gardner’s theory broke away from the general intelligence continuum,
and in other ways it did not. Intelligence lies within each human whom processes it based on
environment. The theory certainly did do away with any confounding physical bodily
measurements that had previously been a part of intelligence measurement. The theory states that
any and all intelligence are located in the brain of humans. However, there was much criticism of
Gardner’s theory when it was introduced mostly in regards to lack of published direct empirical
evidence for critics, for or against, to conduct any replication or validation studies; however, the
theory of M.I. has been able to spread and be applied throughout the world (Chen, Moran &
Gardner, 2009). M.I. Theory research is continually approved and provided grants to be studied.
The explicitly empirical “Theory of Fluid and Crystallized Intelligence: A Critical Experiment”
was published twenty years after the introduction of the hypothesis presented by Cattell in a
somewhat meta-analytic survey of intelligence tests (Cattell, 1943, 1963). Waterhouse (2006)
waged a published debate based on non-empirical evidence with Gardner and Moran (2006) on
the theory of M.I. Waterhouse criticized the empirical evidence and validity of M.I. Theory, the
Mozart effect, and emotional intelligence (E.I.). A core argument is that these theories attempt to
replace rather than build upon traditional intelligence theory. Waterhouse (2006a; 2006b) argued

FLUID AND CRYSTALLIZED G VS. M.I.: SEM OF HUMAN INTELLIGENCE 13
that M.I. theory did not fit with empirical biopsychological research and lacked its own empirical
research, and noted that Gardner changed his theory without additional empirical support.
Empirical evidence in brain imaging for M.I. theory as a conceptualization of the
definition of intelligence does not fully exist although strives are continually made. Gardner’s
theory was introduced at the time that the field of cognitive neuroscientific psychology was
blossoming; however, Brodmann’s (1909) maps of the human brain structures and functions had
been around nearly three-fourths of a century, and Broca’s and Wernicke’s identified areas of the
brain and respective amusia’s were widely known. Gardner did not identify the location of any
intelligence. So soon, one of the first resources for validating a functional area of the brain would
be through brain imaging such as fMRI; however, these methods are based on correlations
between blood flow and neuronal activity, and they have been criticized for a lack of causation
just as other correlational and covariance methods have been. There are neuroscientific brain
imaging studies that support and do not support Gardner’s brain-based intelligence theory. A
conundrum to the innovations in brain research fact is that many neuroscientists are identifying
brain areas associated with intelligence according to traditional g-theory of intelligence
measures. Gardner contends that his theory is not founded on measurement.
Gardner’s (1983) theory of M.I. is based on biopsychological evidences he encountered
throughout decades of working with gifted children and neurologically impaired adults. Gardner
proposes eight distinct intelligence: linguistic, logical-mathematical, musical, spatial, bodily-
kinesthetic, intrapersonal, interpersonal, and naturalist intelligence located in the neuroanatomy
of humans. Gardner was given a grant by the Van Leer Foundation to develop a comprehensive
report of human abilities that seems to have been an attempt to devise a method for better
prediction of future achievement and ability (Gardner, 1999). It seems that Gardner may have

FLUID AND CRYSTALLIZED G VS. M.I.: SEM OF HUMAN INTELLIGENCE 14
succeeded in his tasks that he initially set out to do, then what developed out of his research was
a theory of intelligence that distinctly divided up the general conception of intelligence. The
recurring question that formulates when studying Gardner’s intelligence is whether or not they
are intelligence, or are they styles, talents, personality traits, or some other function or ability. In
context, it seems that the theory would be a complement to traditional intelligence theory
diagnosis that would have effectiveness in intervention.
This research presents a history of intelligence that has led to two of today’s most
prominent theories of intelligence that are somewhat subjectively similar but also completely
distinct and provides empirical evidence for each theory through empirical measurement of the
theories with instruments found to have greater validity than previous ones for the research
problem. Structural models of the theoretical models are calculated using raw data collected from
the prominent measurement instruments. The theories to be empirically tested via psychometric
measurement and analysis are Gardner’s (1983) theory of M.I. and Cattell’s (1943) theory of
fluid and crystallized intelligence. Previous empirical research has attempted to resolve the
debate between the two theories, but limitations and rebuttals between theorists and researchers
have left numerous gaps in the research (Almeida et al., 2010; Castejon, Perez, & Gilar, 2010;
Gardner, 2006; Visser, Ashton, & Vernon, 2006). This study incorporates contemporary methods
for measurement and analysis of the theories. Other theory, research, and measurement are
discussed in relation to these theories.
Background
In past and present worldwide literature, the construct of intelligence and what it is and
composed of is so varied that it can be described in terms as of deriving from a divine, and even
heavenly, power to being completely separate and opposite from the divine as a moderator of

FLUID AND CRYSTALLIZED G VS. M.I.: SEM OF HUMAN INTELLIGENCE 15
evil. From Plato’s philosophy to Piaget’s principles, the measurement of intelligence has also
been relevant and essential to studying the construct of intelligence. The Flynn Effect claims that
intelligence quotients are making massive gains each decade, but this is an effect that empirical
research for the most part cannot directly link to a biological, environmental, behavioral,
cognitive, etc. theory (Flynn, 1998; Pietschnig & Voracek, 2015; Rodgers, 1998; Trahan,
Stuebing, Fletcher, & Hiscock, 2014).
Common and Contemporary Definitions of Intelligence
The Oxford Dictionary of Psychology defines intelligence as “cognitive ability”
(Coleman, 2009). The definition is one of the simplest definitions of intelligence in the literature.
In the terms of Gardner’s Theory, intelligence is a biopsychological potential that is processed
via ability and elicited in the form of expertise level (Connell, Sheridan, Gardner, 2004; Gardner,
1999). This definition takes away from the biological entity of intelligence as proposed by
Gardner. Cattell (1963) speaks of cognitive hypotheses (his own), tests, variables, factors,
performance, components, fields, realms, and specifics.
The Matsumoto Cambridge Dictionary of Psychology (2009) defines intelligence as “a
set of abilities to adapt better to the environment through experience” (p. 259). This definition
incorporates facilities within both Gardner’s and Cattell’s theories. According to Connell,
Sheridan, and Gardner (2004), “humans as a species have certain gross biopsychological
potentials, or fundamental capacities for processing different kinds of informational content, plus
mechanisms that can coordinate these capacities into still more complex functional units”, where
the units are intelligence and capacities and mechanisms are abilities triggered by environmental
situations (p. 136-148). Connell, Sheridan, and Gardner state that not intelligence, but ability,
comprising information processing, is elicited in the form of expertise, but the ability is needed

FLUID AND CRYSTALLIZED G VS. M.I.: SEM OF HUMAN INTELLIGENCE 16
for measuring an intelligence. Connell et al. do a good job explaining how abilities are
processors, but the researchers do not explain the power of the intelligence as an entity to retain
and elicit the forces provided to them by abilities. According to Connell et al., the sum of ability
and intelligence is expertise, and expertise is elicited, and accumulated expertise is competence
within ability. Cattell (1963) explains that the abilities within Fluid and Crystallized intelligence,
hierarchal of general intelligence, form a hierarchy of abilities, or manifests, expressed in the
environment, and, for this reason, the Theory of Fluid and Crystallized Intelligence is a practical
one for testing.
The APA College Dictionary of Psychology (2009) defines intelligence as “the ability to
derive information, learn from experience, adapt to the environment, understand, and correctly
utilize thought and reason. There are many different definitions of intelligence, and there is
currently much debate, as there has been in the past, over the exact nature of intelligence” (p.
203). APA’s definition includes processes to elicit and intake something as an ability. Gardner’s
definition distinguishes an intelligence from an ability.
The Cambridge Dictionary of Psychology (2009) defines crystallized intelligence as “the
form of intelligence associated with previously learned material such as deductive reasoning,
vocabulary, general knowledge, reading comprehension, and solving analogies. It increases
slowly throughout adulthood until the onset of physical decline in elderly people and is
associated most closely with the hippocampus” (p. 260). The Cambridge Dictionary of
Psychology (2009) defines fluid intelligence as “the form of intelligence associated with learning
new material, inductive reasoning, pattern detection, abstract reasoning, quantitative reasoning,
and problem-solving. It tends to peak at around age 25 and slowly decline thereafter. It is
associated with the prefrontal and cingulate cortexes” (p. 260).

FLUID AND CRYSTALLIZED G VS. M.I.: SEM OF HUMAN INTELLIGENCE 17
According to the “Organization for Economic Co-operation and Development” (2007),
intelligence is defined as a “characteristic of the mind lacking a scientific definition. Can be fluid
or crystallized intelligence (see also M.I., IQ)” (p. 256).
History of the Construct of Intelligence
According to Plato (427-348 B.C.) in The Republic, the mind and soul have four levels:
the highest is intelligence/reasoning; next is thinking/understanding, e.g. schoolwork, etc.; next is
belief/conviction/faith; and lastly is conjecture. Plato, in The Republic, Laws, and Philebus,
defines intelligence as knowledge and learning, information processing and speed of it,
perception, memory, judgment, and spontaneity. According to Plato in Laws, intelligence may be
present but is in no way yet matured to perfection. According to Plato in Philebus, scientific
measurement is essential to all disciplines. According to Plato in The Republic, the individuals
who do possess intelligence have a certain love for knowledge and motivation, and Princiotta
and Goldstein (2014) state the measurable indicators of intelligence were more along the lines of
good and bad character and knowledge..
Aristotle (384 B.C.E.-322 B.C.E.) conceptualizes intelligence in a more holistic sense.
Intelligence is a construct that all individuals possess. According to Aristotle, all individuals
possess reasoning and judgment intelligence, but in different degrees, so intelligence is now
conceived of and reported as a latent construct that can be measured with variability. Aristotle
also believed there was a positive correlation with brain size and intelligence within the heart-
brain makeup of man (Gross, 1995). Plato more or less indicated there are a few elites who
possessed intelligence in the mind and soul, and all those who elicited mind and soul intelligence
should be the rulers of government (Chroust, 1968). Aristotle described the brain as “cold” and
“wet” (Gross, 1995). Aristotle did not agree with a considerable amount of Plato’s philosophy,

FLUID AND CRYSTALLIZED G VS. M.I.: SEM OF HUMAN INTELLIGENCE 18
and he criticizes Plato’s Republic and philosophical leaders (Chroust, 1968). In Politics, Aristotle
distinguishes intelligence from Plato’s soul, spirit, or motivation, by comparing cultures, but
similar to Plato, Aristotle distinguished thinking from intelligence. Aristotle distinguishes the
good man versus intelligent man from the good citizen versus the intelligent citizen.
The Roman Era conceptualized human intelligence in a more holistic sense. All humans
possess a construct of intelligence. Gaius Plinius Secundus, a.k.a. “Pliny the Elder” (23-79 A.D.)
met the criteria for Plato’s intelligent authority. In the text Naturalis Historia (77 A.D.), Pliny
the Elder philosophizes on the sciences, arts, and philosophies of the times. Naturalis Historia
was completed just before the destruction of the Pompeiian Latin Empire upon the eruption of
Mt. Vesuvius. In a chapter on zoology, Pliny the Elder philosophizes on the superior intelligence
of all humans, and suggests that intelligence is in fact causal for some evils, which could be
applied to Plato’s view that sinners have no intelligence and Spearman’s eventual law of
diminishing returns, in the psychology of humans. The schools established earlier by Plato and
Aristotle, and Confucianism in the Eastern Han Dynasty, evolved into a worldwide culture of
education lasting ever since (White, 2007).
In the late 19th century, educators and psychologists began to develop and apply notably
valid quantitative methods to measure the construct of intelligence. Sir Francis Galton (1822-
1911) philosophized, in a similar fashion to Plato and Aristotle, on the existence of individual
differences in intelligence. Galton is considered the “father of differential psychology” for
human individual differences. Galton’s work in differential psychology contributed to numerous
subsequent scientific-based theory, including intelligence typologies and nature/nurture debate
and theory (see English Men of Science) (Roeckelein, 2006). Galton ignored Plato’s identified
facets of intelligence in a pursuit to develop an intelligence test, but he laid the foundation for a

FLUID AND CRYSTALLIZED G VS. M.I.: SEM OF HUMAN INTELLIGENCE 19
measurement and analysis process of, including, but not limited to, mathematics, reaction time,
and vision, that later become defined as psychometrics. Galton conceived the statistical notion of
equations and applications for correlation, standard error, standardized scores, percentile ranking,
measures of central tendency, rating scales, and regression (Galton’s law of regression). Galton’s
scored data showed that human mental abilities form a normal distribution and bell-shaped
curve.
James Cattell (1860-1944) (1890), following and contributing to Galton’s psychometric
approach, published a set of mental tests of ability. Cattell reported instructions for test
administration, including time and setting. Cattell indicates effort and need to distinguish the
mental from the more physical tests within his work. Similar to Galton’s results, there were
identifiable differences in all test scores/rankings; however, further analysis these tests lacked
criterion validity due to indicators such as physical measurements. The ten indicators in Cattell’s
(1890) test were dynamometer pressure (strength as supposed correlation of body and mental
energy and effort), rate of movement (correlate of strength), sensation areas (distinguishing
sensations), pressure causing pain, least noticeable difference in weight (distinguishing objects
weight), reaction time for sound, time for naming colors, bisection of fifty centimeter line,
judgment of ten seconds time, and number of letters remembered once hearing (p. 373).
Distinguishing musical tones and chords were manifest indicators of the hearing test. Galton’s
remarks within the article actually propose more “general knowledge” indicators of what would
now be assumed as various components of physical measurements, motivation, personality
(sensitivity), and talent and skill (music, drawing, games involving hand-eye coordination) (p.
380).

FLUID AND CRYSTALLIZED G VS. M.I.: SEM OF HUMAN INTELLIGENCE 20
Alfred Binet (1857-1911) proposed that the conception of intelligence takes two paths,
maturity and rectitude (Binet & Simon, 1916). This conceptualization can somewhat be applied
to the fluid problem-solving skills, crystallized learning, and the control factor associated with
crystallized intelligence in Cattell’s theory and the intelligence and elicited expertise in
Gardner’s theory.
Alfred Binet and Theodore Simon (1873-1961) are credited with the development of the
first intelligence test with a methodological manual that would yield a norm-referenced mental
age score (Stern, Whipple (Trans.), 1914). The test’s purpose was to identify deficiencies in
schoolchildren in France. Binet’s and Simon’s (1916) conceptualization of intelligence facets
included attention, memory, imagination, common sense, judgment, and abstraction. Binet was a
dynamist who completed work in cognitive, psychoanalytic, experimental, and biological
psychology. Based on Binet’s and Simon’s method of producing a mental age, Louis William
Stern (1914) developed and reported the equation for a “mental quotient”, or intelligence
quotient (IQ), as mental quotient=mental age/chronological age (Whipple (Trans.), 1914).
Lewis Terman (1877-1956), at Stanford University, modified the translated French-
English version of the Binet-Simon into the Stanford-Binet test. Continuous modifications of the
Stanford-Binet, including target population, lead the development of the Army Alpha and Beta
Tests (Wechsler, 1939). These tests were able to be administered to large samples of adults, and,
thus, began to establish higher psychometric reliability and validity coefficients (Thorndike,
1921; Wechsler, 1939).
Charles Spearman’s (1863-1945) theory of a general, g, intelligence factor was derived
from the usage of correlational psychometrics based on the experimental and Gestalt teachings of
Wilhelm Wundt, “the father of experimental psychology”. Spearman (1904) provides a

FLUID AND CRYSTALLIZED G VS. M.I.: SEM OF HUMAN INTELLIGENCE 21
comprehensive review of intelligence research up until the introduction of g-theory. Spearman
indicates the notion that the conceptualization of intelligence to that point merely left the
question of whether intelligence is a single entity or multiple entities. Spearman becomes a
pioneer of the conceptualization and theory of intelligence as he argues that many so-called
intelligence factors were, in fact, personality factors.
Spearman’s conceptualization of intelligence came from experiments of ability to
cognitively discriminate auditory sound, visual colors, tangible weights of objects, memory.
Spearman also included grade level achievement, or present efficiency, and grade level over age,
or native capacity which are also cognitive measures. Spearman added other people’s
perceptions of an individual’s intelligence as an indicator of intelligence. There was also a
common sense indicator. The first two essentially make up what would be fluid and crystallized
intelligence (Cattell, 1943). The grade level achievement was initially intelligence, and cognitive
discriminations were initially sensory functions from a sample of students in a small village.
Spearman describes the method of calculating a correlation between the indicators to derive a
factor or factors, noting that psychology is briefly put to the side for mathematics. Sight and
weight were then dropped, and musical intelligence based on music teacher’s grades was
incorporated. Highly significant correlations continued, and Spearman put forth the “Theorem of
Intellective Unity”, or general human intelligence.
Spearman’s general intelligence factor, g, derived from a set of six measures of academic
achievement and music teacher rating of music ability and pitch. Pitch ability was also
implicated to have a negatively influencing cultural bias. Spearman results showed
distinguishability between the musician and layperson regarding general intelligence. According

FLUID AND CRYSTALLIZED G VS. M.I.: SEM OF HUMAN INTELLIGENCE 22
to Spearman, the correlations are due to an overarching general factor, g, and some less-loaded
specific factors, s.
Spearman’s g-theory would go on to be tested, analyzed, reported, expanded upon, and
debated for more than a century, until today, and into the future (Carroll, 1993). E. L. Thorndike
(1874-1949), “father of educational psychology”, debated against the existence of g within the
Army Alpha and Beta tests (Thorndike, 1921). Subsequent tests of g in conceptualizing
intelligence identified factors of g while at the same time attempting to rid factors of motivation,
physical characteristics, and social intelligence (Cattell, 1943). Separate theories would emerge
that would incorporate these constructs back into theory.
Raymond Cattell’s (1905-1998) “Theory of Fluid and Crystallized Intelligence” has the
greatest evidence for intelligence theory and test validity and is based on Spearman’s g
intelligence theory for intelligence except that latent g itself has latent factors. Raymond Cattell’s
(1943) “Theory of Fluid and Crystallized Intelligence” states that there are two primary factors,
gc and gf, of general intelligence, g, for adults. Cattell (1963) conducted a factor analytic study
on Spearman’s g. The results of the empirical research study show that g consists of two
independent factors, gc and gf, as well as some lower-loaded motivation and personality factors
(Cattell, 1963).
There are several theories of intelligence active in the field. These theories branch from
and into and are recognized by several academic disciplines. Cattell’s “Theory of Fluid and
Crystallized Intelligence” was revised by Cattell and his student John Horn into a modified
theory. It later formulated as a “Cattell-Horn-Carroll (CHC) Theory of Intelligence” with sets of
broad and narrow abilities added due to results of first, second, and third-order confirmatory
factor studies (Carroll, 1993; Cattell & Horn, 1978). Cattell’s original “Theory of Fluid and

FLUID AND CRYSTALLIZED G VS. M.I.: SEM OF HUMAN INTELLIGENCE 23
Crystallized Intelligence” remains the basis for all proposed intelligence abilities. Many believe
that the CHC theory is too developed.
Jung and Haier (2007) introduced the neuropsychological parietal-function integration
(P-FIT) theory of intelligence that asserts that intelligence is located in fourteen Brodmann areas
(BA 6, 9, 10, 45, 46, 47, 39, 40, 7, 32, 18, 19, 21, 37) and fires through the arcuate fasciculus. P-
Fit theory uses traditional intelligence testing to gain its validity. Another hypothesis is that gray
matter, or gray neurons, in the brain may have developed through neurogenesis for evolutionary
reasons to elicit fluid intelligence for early-life survival (Jung & Haier, 2007).
In terms of biological psychology and M.I. theory, Shearer (2009) explains that the
intelligence are “cerebral systems” (p. 19). Another research question that is beyond the purview
of the research being conducted in this thesis is: “Are the intelligence a biological entity such as
a single neuron or several neurons and the cerebral systems the cognitive aspect as we know it?”
The question fits with the previous postulation that a dynamic theory is warranted. In a dynamic
theory that somewhat explicitly crosses the threshold of the construct of intelligence, Ackerman
(1996) proposed the “Process, Personality, Interest, Knowledge (PPIK)” theory of adult
intelligence with fluid and crystallized intelligence as higher-order factors.
Current Study Theories of Intelligence
Cattell’s “Theory of Fluid and Crystallized Intelligence”
Cattell’s “Theory of Fluid and Crystallized Intelligence” grew out of Spearman’s “g-
factor” research and has extended and expanded furthest into the field of intelligence testing.
Cattell (1940) explained that fluid intelligence accounted for more than what Spearman (1904)
put into general intelligence. According to Cattell’s (1943) “Theory of Fluid and Crystallized
Intelligence”,

FLUID AND CRYSTALLIZED G VS. M.I.: SEM OF HUMAN INTELLIGENCE 24
“Adult mental capacity is of two kinds…”” “Fluid” and “Crystallized” …Fluid ability has
the character of a purely general ability to discriminate and perceive relations between
any fundaments, new or old. It increases until adolescence and then slowly declines. It is
associated with the action of the whole cortex. It is responsible for the intercorrelations,
or general factor, found among children’s tests and among the speeded or adaptation-
requiring tests of adults…Crystallized ability consists of discriminatory habits long
established in a particular field, originally through the operation of fluid ability, but not
longer requiring insightful perception for their successful operation…Intelligence tests
test at all ages the combined resultants of fluid and crystallized ability…” (Cattell, 1943,
p. 178).
Fluid intelligence is elicited in nonverbal sheer and non-pictorial series, classifications,
analogies, and topology tests (Cattell, 1987); however, pictorial series are currently accepted in
testing. Fluid intelligence consists of all complex logic and relations where memory is not
involved (Cattell, 1987). According to Cattell (1987), fluid intelligence is a single structure in
cortical areas of the brain contributing to total neural performance (p. 252-253, 366). Crystallized
intelligence is time and interest in expression of fluid ability and general achievement (Cattell,
1963). Crystallized intelligence is elicited in verbal, numerical, reasoning, mechanical
information and skills, and judgment tasks that have been experienced or taught, and memory is
involved (Cattell, 1987). According to Cattell (1987), crystallized intelligence is an agency, so
one could relate this notion to Gardner’s (1999) notion that the M.I. are selective according to
task. According to Cattell (1987), crystallized intelligence is related to the hippocampal areas of
the brain (p. 252). According to Cattell, age is a mediator in the correlations between fluid and
crystallized intelligence as it decreases with age.

FLUID AND CRYSTALLIZED G VS. M.I.: SEM OF HUMAN INTELLIGENCE 25
Cattell’s “Theory of Fluid and Crystallized Intelligence” has been extended several times
in terms of factors and abilities but not modified regarding the original hypotheses (Cattell &
Horn, 1978; Horn & Cattell, 1966; Hakstian & Cattell, 1978). The theory somewhat modified to
include visualization, gv, fluency, and speed, gs as primary factors (Horn & Cattell, 1966). The
modification justification was factor analytic studies of thirty-one factors ranging from general
reasoning to perceptual speed to memory to adventurousness and sensitivity. It is noted that the
results indicated: a) visualization correlated highest with fluid intelligence, crystallized
intelligence, then another factor, b) speed with fluid intelligence; c) fluency with speed then fluid
intelligence (Horn & Cattell, 1966, p. 262). Kan, Kievit, Dolan, and der Maas (2011) argue for
“Cattell’s Fluid and Crystallized Investment Theory” over “CHC Theory” concluding that
crystallized intelligence is a formative variable of verbal comprehension and academic education
instead of an underlying variable, and this notion is supported when carrying out this research.
Gardner’s “Theory of Multiple Intelligence (M.I.)”
Gardner’s (1983) “Theory of M.I.” was formulated through direct observation of humans,
specifically children. Gardner was familiar with traditional intelligence theory. According to
Gardner, continuous “exceptions” to traditional intelligence theory, especially with brain
damaged individuals, arose, and he reflects on The Shattered Mind: The Person After Brain
Damage (p. 3-4). Essentially, impairment in one area did not cause impairment in another.
Peretz, Gagnon, Hebert, and Macoir (2004) present an empirical case study and review empirical
evidence for differences of processing music and language. The evidence for distinct, non-
correlating, or networking intelligence is mixed (Peretz, Gagnon, Hebert, and Macoir, 2004).
Gardner’s “Theory of M.I.” states that intelligence does not correlate while the question of his
meaning of correlation and intelligence is indefinite.

FLUID AND CRYSTALLIZED G VS. M.I.: SEM OF HUMAN INTELLIGENCE 26
According to Gardner (1999), the definition of intelligence is “the ability to solve
problems or to create products that are valued within one or more cultural settings” and “a
biopsychological potential to process information that can be activated in a cultural setting to
solve problems that are of value in a culture” (p. 33). Gardner states that his linguistic and
logical-mathematical intelligence are at “such a premium in schools today” (p. xi), but empirical
evidence has shown that intelligence(s) moderate academic achievement, and not vice-versa and
that all of the intelligence “potentials” would have been activated in American culture, or at least
for an individual who has attended school in American culture. Gardner states that g is a fable.
Gardner claims that opponents of intelligence theory, in general, have claimed that Gardner has
added fuel to fire. Gardner calls Frames of Mind a contribution to Thurstone’s (1938) abilities
and Guilford’s (1956) work on M.I. On psychometrics, Gardner cites psychometrician Ceci
(1990) who found training and cultural effects on reaction time measures. According to Gardner,
the intelligence is linked to content and styles separately. Gardner says that the intelligence is
malleable and have correlated subcomponents within.
According to Gardner (1983, 1999), there are eight criteria for an intelligence, and the
multiple eight intelligence meet these criteria (p. 36). The first criterion is the independence by
brain damage. The second criterion is an evolutionary plausibility. The third criterion is a set of
indicators for each intelligence. These indicators may correlate when measured. The fourth
criterion is the ability to be symbolized. The fifth criterion is related to the expertise and its
ability to have a developmental trajectory in a society. The sixth criterion is the intellectual
behavior elicited by savants, prodigies, and other exceptional individuals. The seventh criterion
is evidence of cognitive interference between two or more intelligence during elicitation. The
eighth criterion is support from psychometric findings.

FLUID AND CRYSTALLIZED G VS. M.I.: SEM OF HUMAN INTELLIGENCE 27
According to Gardner, the intelligence are not distributed individually to individuals, and
an assessment of M.I. should not reveal a single intelligence, contrary to Almeida et al.’s (2010)
factor. As Gardner introduced the “Theory of M.I.” in Frames of Mind, it was stated that no
theory of intelligence includes the amount of abilities proposed by the theory of M.I., and
Gardner welcomes his theory to be tested. An individual who has taken a single course on
intelligence theory or measurement can question and apply Gardner’s biographical examples
supporting the theory of M.I. with classical theories and tests. Numerous are listed within this
article, and Cattell (1987) constructed a similar table with musical, psychomotor coordination,
dexterity, etc. based on previous evidence (p. 32-36). Gardner cancels Piaget’s theory of
cognitive development with the notion that child prodigies exist. Again, Gardner’s examples of
prodigies direct the informed reader back to classical intelligence theory. The chapter on biology
shows support for a genetic cause of intelligence. The behaviorist, “laws of learning”, plasticity
notions in the chapter on biology seems to somewhat support theory of fluid and crystallized
intelligence or other theories.
The study of child psychology and linguistics points to the fact that first-year infants
begin to “babble”, even deaf infants, and this fact is universal (O’Grady, Archibald, Aronoff,
Rees-Miller, 2010). Chompsky’s “nativist language acquisition” theory states that infants are
born with innate language structure and capabilities. O’Grady et al. (2010) present a table with
consonant sounds produced by infants across English, Thai, Japanese, Arabic, Hindi, and Mayan
languages (p. 356). O’Grady et al. describe what would be linguists with high linguistic
intelligence who tend to either use one of two types of spatial intelligence, or abilities, to learn
multiple languages, but also describes case studies of linguistic savants and children deprived of
a “critical period” of language acquisition.

FLUID AND CRYSTALLIZED G VS. M.I.: SEM OF HUMAN INTELLIGENCE 28
According to Gardner (2011), “to the extent that the tasks that purportedly assess one
intelligence correlate highly with one another, and less highly with those that purportedly assess
other intelligence, my formulation enhances its credibility. To the extent that psychometric
results prove unfriendly to my proposed constellation of intelligence, there is cause for concern”
(p. 70).
Gardner (1999) addresses myths about M.I. Theory. Gardner states that traditional
intelligence tests do not measure the M.I. Gardner states that Project Spectrum activities attempt
to measure the M.I. All measurements must have indicators whether they are qualitative
measurements or quantitative measurements. These indicators must have high construct validity
so that they do not interfere with other intelligence because more than one intelligence can be
elicited in a domain (Gardner, 1999). The comment seems to somewhat stress for a more valid
paper and pencil test. This study uses an instrument to measure M.I. that has reports of
established construct validity. When Intelligence Reframed was published in 1999, Gardner
states that he has had objections to the reviews of M.I. assessments. M.I. assessment reviews
from the Mental Measurement Yearbook (MMY) with Tests in Print are summarized in this
study. Gardner’s comment on previous assessments came before Shearer’s (2011) M.I.
Developmental Assessment Scales which have only had positive reviews in the MMY. Major
limitations identified in the methods of studies (Castejon et al., 2010) that this study somewhat
replicates are validity issues with M.I. assessment. Gardner stresses that for self-report measures
to have construct validity they must measure capacities and not preferences.
Gardner indicates that there will never be a Rosetta stone for intelligence (p. 59). Gardner
implies that there will never be a law for intelligence. Gardner’s prerequisites of an intelligence
are: a) problem-solving, b) circled by what was just described, and c) Gross’s list of modes of

FLUID AND CRYSTALLIZED G VS. M.I.: SEM OF HUMAN INTELLIGENCE 29
communication that are essentially the M.I. and Hirst’s seven forms of knowledge that all require
synthesis skills that would correlate to fluid and crystallized intelligence factors and their
correlations (Salthouse, Pink, Tucker-Drob, 2008). Gardner states that abilities within traditional
intelligence theory are a prerequisite for his eventual identification of the M.I. Then, the highly
cited criteria for an intelligence is laid out.
There is an empirical history for the M.I. right inside traditional intelligence
measurement. What is bodily-kinesthetic intelligence was measured by Binet and Simon and
until the mental age of seven (Stern, Whipple (Trans.)). According to Gardner (1993), bodily-
kinesthetic intelligence is bodily movement and skill. Dexterity and athletics are measurement
indicators on the M.I.D.A.S. (Shearer, 2011). Gardner describes the actor, dancer, athlete, and
inventor (p. 240-245). The Binet-Simon method assumes that a mental age of three “points to
mouth, eye, and nose” and mental age seven “knows number of fingers”, and the Terman and
Childs (1912) modified version assumes that a mental age of seven “knows right hand and left
ear (six) (p. 156-157). According to Gardner, musical intelligence entails composing and
listening and is made up of three components of pitch, rhythm, and tone. He consistently cites
talent vs. intelligence leaving a confounding perception. M.I.D.A.S. indicators of musical
appreciation, vocal ability, instrumental skill, and composing measure musical intelligence
(Shearer, 2011). Why are they not measured in mainstream intelligence testing? The Binet-
Simon method assumed that a mental age of five “repeats ten syllabled sentences” and mental
age ten “makes two sentences to include three words”, and the Terman and Childs (1912)
modified version assumes that a mental age of five “repeats thirteen syllabled sentences” and
mental age ten “makes sentence to include three words” (p. 156-157). Gardner provides the
example of the linguist, musician, and actor of three distinct intelligence in “M.I. theory”, but all

FLUID AND CRYSTALLIZED G VS. M.I.: SEM OF HUMAN INTELLIGENCE 30
require their intelligence includes body and sound manipulation. Language development includes
learning nasals, liquids, voices, affricates, fricatives, glides, and more rules that are dependent on
the accurate and precise movements and coordination of the abdomen, chest, lungs, vocal chords,
tongue, teeth, inner-mouth, and lips. Abnormal affect, or deficits in this intelligence, beyond
what a traditional intelligence test measures, are more qualitative remarks for the intelligence test
administrator.
Gardner identifies M.I., but downplays their individual existence with relation to ability.
According to Wechsler (1944), the average mental age of a twenty chronological-year-old is
fifteen mental years, and intelligence scores increase up to age twenty-five. According to
Gardner, “normal individuals should develop each intelligence to some extent…the intelligence
actually interacts with, and build upon, one another from the beginning of life (p. 278). Later,
Gardner goes on to say that “metaphoric (or analogy) intelligence,” which is measured by
contemporary adult intelligence tests, is the ability to “integrate” intelligence (p. 290). According
to Gardner (2006), gifted individuals have high intelligence quotients and geniuses have
intelligence quotients over 150 (p. 43). Gardner states that giftedness is somehow crystallized,
and genius is a broad domain with a link to childhood (p. 45). Gardner states that experts are
categorized within a domain or field and utilize cumulative knowledge/skills. Gardner cites
Aristotle’s claim that metaphors are “genius”, then again it was Plato that ranked metaphoric
reasoning, or “intelligence”, higher than academic thinking. Gardner (1987) criticizes
measurement of Piaget’s concrete operations because of single logic indicators. The connections
drawn here, according to this author, give rise to purpose to test the M.I. against another widely
accepted two-factor, multiple indicator, theory of intelligence measure.

FLUID AND CRYSTALLIZED G VS. M.I.: SEM OF HUMAN INTELLIGENCE 31
Gardner states that American education imposes g, logical-mathematical, intrapersonal,
and linguistic intelligence on students while religious cultures and low-literacy cultures impose
interpersonal intelligence. Nonetheless, psychologists are found worldwide, and these
psychologists, of course, have a level of general intelligence and usually high interpersonal
intelligence. According to USAToday, psychology is the second most popular college major next
to business administration in the United States (Stockwell, 2014). On heredity, if any, Gardner
predicts a greater hereditary factor for mathematical, spatial, and musical intelligence over
linguistic, naturalist, interpersonal, and intrapersonal intelligence.
Gardner (1999) comments on the statement that “MI Theory questions not the existence
but the province and explanatory power of g…MI Theory is neutral on the question of the
heritability of specific intelligence, instead underscoring the centrality of genetic and
environmental interactions” (p. 87-88). Gardner states there are more factors of intelligence than
g. Gardner “rejects… [a] nature-nurture dichotomy” but accepts a dynamic interaction between
genetic and environmental factors (p. 87).
Gardner provides implications for traditional intelligence theory, but the restrain for these
implications related to correlated abilities and the normal curve has been somewhat set earlier in
this text. First, Gardner (1987) says that the distant sailor is failed on a traditional intelligence
test because his spatial abilities are not measured. That is simply not true, as fluid reasoning tasks
measure these abilicomprerehensties. Secondly, the religious linguistic is not failed on a
traditional test because there are crystallized measures of comprehension, reasoning, and
memory. Thirdly, Gardner states that intelligence tests never incorporate music. Most general
knowledge tests do incorporate general knowledge of the musical domain and many other
domains, so there is an appreciation indicator fulfilled. Intelligence tests incorporate the same

FLUID AND CRYSTALLIZED G VS. M.I.: SEM OF HUMAN INTELLIGENCE 32
skills that musicians apply to composing. These individuals have taken their abilities measured
by intelligence tests and applied them to a capability within a profession. It is somewhat more
communistic to identify an intelligence via a profession than to measure a broad set of abilities
together.
According to Gardner (1999), the theory of M.I. was developed from a multitude of
empirical evidence, but criticism of the theory is based on the notion there was a lack of
empirical evidence for founding and introducing the theory of the “new” M.I. (Gardner, 1995, p.
202). In fact, it is only somewhat the case that there is a lack of empirical testing for Gardner’s
post-introduction of the structural theory. It is also a fact there is unambiguously more direct
empirical evidence of Cattell’s “Theory of Fluid and Crystallized Intelligence” and its scientific
measurement (Carroll, 1993). Gardner (1995) welcomes his theory to be empirically tested and
modified. Gardner (1983, 2011) has disclosed self-knowledge that the addition of a M.I. theory
into the field of intelligence would attract fandom. According to Gardner, multiple ability, talent,
or wisdom would not have made such an impact. Gardner has continuously received fandom and
criticism since the introduction of M.I. Theory. Gardner (2011) acknowledges criticism from his
own colleague Feldman, Project Spectrum collaborator, before introduction of the Theory in
Frames of Mind. According to Feldman (2003), Gardner’s Theory stemmed from creativity
research.
M.I. Theory is accepted in the field of intelligence. According to Google Scholar,
Gardner’s Frames of Mind has been cited >20,000 times (Google, 2015). Marsh and Shavelson
(1985) empirically related the theory to self-concept. McKeachie (1986) cites Gardner’s theory
for educational implications. Lewis, Jaskir, and Enright (1986) were the first to cite Gardner,
with Sternberg, in an issue of Intelligence in their intelligence development research.

FLUID AND CRYSTALLIZED G VS. M.I.: SEM OF HUMAN INTELLIGENCE 33
Literature Review: Empirical Research of Relevant Theory and Measurement
Review of Empirical Support for Theories
Cattell (1943; 1987) reasons and shows that fluid and crystallized intelligence are the
primary factors of intelligence. Cattell (1943) surveyed existing intelligence tests and proposed
his Theory. Cattell (1963) collected data from junior high school students (n=277) with
intelligence measures based on five tests of Thurstone’s primary abilities and four tests from the
Institute of Personality and Ability Testing (IPAT) Culture Fair Intelligence Test. Results
indicated that two factors named fluid intelligence and crystallized intelligence had the highest
factor loadings and highest correlations between one another. Some lower-loaded motivation and
personality factors were reported (Cattell, 1963). An array of other research provides support for
the reasoning over extended theory.
Ghisletta, Rabbitt, Lunn, and Lindenberger (2012) show that fluid and crystallized
intelligence factors could, in fact, be higher order factors of broad abilities. The findings
supported the use of a measure of basic fluid and crystallized intelligence with an optional
combined g output in the current study vs. a non-parsimonious study of extended CHC Theory.
An abundance of research reports significant declines in fluid intelligence and gains in
crystallized intelligence with age after adolescence (Cattell, 1943; Horn & Cattell, 1967;
Kaufman & Horn, 1996; Kaufman, Reynolds, & McLean, 1989). A longitudinal study conducted
by Tucker-Drob (2009) shows support for Cattell’s (1987) “Investment Theory”. Fluid g and
crystallized g most consistently had the highest factor loadings between childhood and adulthood
while crystallized abilities had the most significant increases (Tucker-Drob, 2009).
Tucker-Drob and Briley (2014) results of a longitudinal, meta-analysis study on genetic
and environmental influences on cognition contextually apply to Cattell’s “Investment Theory.”

FLUID AND CRYSTALLIZED G VS. M.I.: SEM OF HUMAN INTELLIGENCE 34
According to the Tucker-Drob and Briley (2014) results, the stability of fluid abilities with age is
less susceptible to an environment than the stability of crystallized abilities, but fluid abilities
stability is more susceptible to an environment than overall general intelligence. Therefore, when
g is a relatively stable ability, as it is, the results support Cattell’s “Investment Theory” (Carroll,
1993).
Johnson, Bouchard, Krueger, McGue, and Gottesman (2004) conducted a confirmatory
factor analysis on data from three intelligence batteries with twenty lower-order broad
crystallized and fluid ability tests. The models for the individual tests revealed borderline good
fit while only using RMSEA as a measure of fit. The correlated tests, or single “g”, model also
revealed borderline good fit while only using RMSEA as a measure of fit. The results did not
provide enough fit statistics. The design should be retested with crystallized indicators loading
on a crystallized factor and fluid indicators loading on a fluid factor then allowing them to
correlate to a g-factor rather than broad abilities.
Johnson, Nijenhuis, and Bouchard (2008) semi-replicated the original study but utilized
five batteries and reported more fit statistics. Again, each individual test showed good fit. One of
the batteries was Cattell’s “Culture Fair Test” of fluid ability. Results identified a third-order g-
factor between the g’s of the individual tests. The RMSEA’s of the combined models in both
Johnson et al.’s studies were adequate fits.
Major, Johnson, and Deary (2012) retested Johnson and Bouchard’s (2005) verbal-
perceptual-image rotation model based on Vernon’s (1961) hierarchical verbal-perceptual model
of intelligence against Cattell-Horn-Carroll (CHC) theory and extended fluid-crystallized (gf-gc)
theory. Johnson and Bouchardjr (2005) showed that a verbal-perceptual-image rotation model fit
as well as CHC Theory and extended gf-gc Theory and CHC Theory. The verbal-perceptual-

FLUID AND CRYSTALLIZED G VS. M.I.: SEM OF HUMAN INTELLIGENCE 35
image rotation model seems to essentially be a Fluid and Crystallized model with two
Crystallized factors. Major et al. (2012) used exploratory and confirmatory factor analysis to
retest extended gc-gf theory, CHC theory, and the verbal-perceptual-image rotation models
against data from sets of thirty-seven and twenty-two aptitude and achievement tests from
ProjectTalent. ProjectTalent was a nationwide longitudinal assessment of nearly 400,000 high-
school students. Major et al. (2012) report that Carroll used data from ProjectTalent before
putting forward CHC Theory but most of Carroll’s individual analyses of the data resulted in two
to three second-order factors. All Major et al.’s (2012) models showed good fit and at least
highly adequate fit depending on the fit indices analyzed.
Gardner and Krechevsky (2006) report a one-year observational study of children in two
“Project Spectrum” classrooms. The classroom consists of various learning areas that
correspond, but not directly, to the M.I. (see Gardner & Krechevsky, 2006, p. 94-95).
Observation includes scoring sheets and checklists, but also interviews and graded portfolios.
Results indicated that Project Spectrum activities do not correlate with one another.
According to Chen (2009), M.I. theory has successfully been initiated throughout China’s
schools. Chen notes that conceptions of intelligence previously stemmed from the Chinese
family vs. school. Gardner (1999) reports the success of schools that have implemented M.I.
Theory into the curriculum. Empirical results show increased standardized test scores owing to
M.I. theory and improved overall academic environment.
The Eastern and Confucian conceptualization of intelligence and education progress is
analogous to the Western Aristotlean and Platonic conceptualization of intelligence and
education progress. However, in regards to current M.I. theory in China, another article
published at the same time by Higgins and Xiang (2009), goes deeper into pre-communist China
FLUID AND CRYSTALLIZED G VS. M.I.: SEM OF HUMAN INTELLIGENCE 36
intelligence testing and charts the numerous studies that have brought traditional intelligence
testing back to China.
Carroll (1993) examined eighty-seven knowledge and achievement ability datasets and
identified one-hundred twenty-seven factors that were divided into five groups. Twelve of the
factors created a group titled “knowledge of behavioral content” (p. 513). According to Carroll,
the knowledge of behavioral content coincides with Gardner’s Intrapersonal Intelligence and to
some extent Interpersonal Intelligence. Carroll notes the similarity between some of the
intelligence and broad abilities in CHC Theory. These personal intelligences were not analyzed
in Almeida et al. (2010) and have led to conflicting results in M.I. measurement (Shearer,
2012b).
Innovation in cognitive neuroscience leads to hope for increased empirical evidence for
biopsychological theory, especially Gardner’s “Theory of M.I.” which are separate
biopsychological potentials in the brain. Nonidentification of these specific areas via brain
imaging when Gardner released the theory is the reason for some of the debate. Gardner (1999)
claims that the neurological evidence to date supports the M.I. theory. However, Gardner’s
Theory has not shown unobjectionable evidence for its validity in brain image research. The
debate stands where psychometric assessment of the intelligence stands (Deary, Penke, &
Johnson, 2010). Shearer (2009) explains that the intelligence are “cerebral systems” (p. 19).
Empirical neuroscientific research has come as far as identifying Brodmann’s areas that coincide
with M.I. Theory.
A review of biopsychological research is able to provide empirical evidence for the M.I.,
as proposed by Gardner, in the human brain with little to no correlations. Brodmann areas 41, 42,
and right 22 are associated with Musical Intelligence (Angulo-Perkins et al., 2014; Armony,

FLUID AND CRYSTALLIZED G VS. M.I.: SEM OF HUMAN INTELLIGENCE 37
Aubé, Angulo-Perkins, Peretz, & Concha, 2015; Ellis et al., 2012; Schneider, Scherg, Dosch,
Specht, Gutschalk, & Rupp, 2002). Angulo-Perkins et al. (2014) report significance of the
planum polare. Brodmann areas 28, 29, 30, 34, 35, and 36 are associated with Spatial
intelligence (Epstein, 2008; Epstein, Harris, Stanley, & Kanwisher, 1999; Henderson, Zhu, &
Larson, 2011; Hafting, Fyhn, Molden, Moser, & Moser, 2005). The basal ganglia and cerebellum
are associated with Bodily-Kinesthetic Intelligence (Bareš, Husárová, Filip, Mareček, Mikl, &
Lungu, 2014; Binetti, Siegler, Bueti, & Doricchi, 2013; Epstein, 2008; Epstein, Harris, Stanley,
& Kanwisher, 1999; Hafting, Fyhn, Molden, Moser, & Moser, 2005; Henderson, Zhu, & Larson,
2011; Maschke, 2003). Brodmann areas 39 and 40 are associated with Logical-Mathematical
Intelligence (Basten, Biele, Heekeren, & Fiebach, 2010; Cappelletti, Barth, Fregni, Spelke, &
Pascual-Leone, 2007; Wendelken, 2015). Brodmann areas 22, 44, and 45 are associated with
Linguistic intelligence (Burr & Tsurada, 2000; Catani, Thiebaut de Schotten, 2012; Fedorenko,
Duncan, & Kanwisher, 2012). Brodmann areas 20 and 46 are associated with Naturalist
Intelligence (Mitchell, Heatherton, & Macrae, 2002; Vanutelli & Balconi, 2015). Brodmann
areas 8, 9, and 10 are associated with Intrapersonal intelligence (Mitchell, Banaji, & Macrae,
2005). Brodmann areas 4, 6, 10, 32, 47 are associated with Interpersonal Intelligence (Amodio &
Frith, 2006; Knutson, McClellan, & Grafman, 2008).
Colom et al. (2009) report general intelligence in Brodmann areas 5, 6, 8, 9, 10, 11, 45,
46, 47, 3, 7, 20, 21, 22, 36, 39, 42, 18, and 19. Colom et al. report Crystallized intelligence in
Brodmann areas 8, 11, 5, 7, 40, 20, 21, 38, 39, 18, and 19. Geake and Hansen (2010) report Fluid
intelligence in Brodmann areas 45, 48, 10, 6, 46, 21, 39.
Gardner and Krechevsky (2006) report a predictive validity study on a sample of
seventeen children. The measures used in the study were the Stanford-Binet Intelligence Scale

FLUID AND CRYSTALLIZED G VS. M.I.: SEM OF HUMAN INTELLIGENCE 38
(4th) and the Project Spectrum battery. It should be noted that Gardner reports that the Project
Spectrum battery takes approximately one year to administer. A strength or weakness on one of
the ten Project Spectrum activities has the criteria of scoring one s.d. above or below the mean of
that sample. Data analysis included dividing the sample into three ability groups based on
Stanford-Binet scores. High ability group members exhibited various numbers and areas of
strengths with no weaknesses. (Gardner & Krechevsky, 2006, p. 103). Low ability group
members exhibited various numbers and areas of strengths along with associated weaknesses
(Gardner & Krechevsky, 2006, p. 103). Gardner states that the predictive validity for the
Stanford-Binet Intelligence Scale is not a predictor of specific strengths or number of Project
Spectrum strengths. Additionally, Gardner states that “The Spectrum model does not postulate g
as a general intelligence factor…” in the activities that correspond to M.I. Theory (p. 104).
Visser, Ashton, and Vernon (2006) conducted a study with a sample of university
students and an exploratory factor analysis focusing on correlations between general intelligence,
g, measure and two to four measures of each of the eight intelligence. Visser, et al. (2006a)
critiqued Gardner’s M.I. and categorized linguistic, spatial, logical-mathematical, naturalistic,
and interpersonal intelligence to have exclusive cognitive factors, interpersonal intelligence to
have cognitive and personality factors, bodily-kinesthetic intelligence to have a motor factor, and
musical intelligence having sensory and cognitive factors. Visser et al. (2006a) hypothesized that
correlations between test scores between a general intelligence measure and within the categories
would be high and respective to the categories. Visser et al. hypothesized the appearance of a
second-order g-factor with respective correlations. Visser et al. hypothesized that M.I., minus
bodily-kinesthetic, scores would positively correlate after controlling for g. Results show that at
least one indicator of Linguistic, Spatial, Logical-Mathematical, Interpersonal, Intrapersonal, and

FLUID AND CRYSTALLIZED G VS. M.I.: SEM OF HUMAN INTELLIGENCE 39
Naturalistic measures statistically significantly loaded on and correlated with the g-measure after
extracting the original g-factor (Visser et al. 2006a). Visser et al. (2006a) cite Gardner's call for a
valid measure of M.I. The results of the M.I. measures left many significant correlations between
the intelligence (Visser, Ashton, Vernon, 2006).
Visser, Gardner, and others have exchanged commentaries on one another’s views for
several years (Gardner, 2006; Visser, Ashton, & Vernon, 2006b). Gardner (2006) responded to
Visser et al. by criticizing the measurement of the intelligence. For example, Gardner states that
measurement of musical intelligence requires “musical analysis” vs. “simply auditory acuity” (p.
504). Here, Gardner reiterates that he predicted that g correlates with linguistic, logical, and
spatial intelligence.
Almeida et al. (2010) administered two batteries of general intelligence containing fluid
and crystallized tests to three samples of children. Six of Gardner’s Project Spectrum activities
were constructed and assessed. The social Project Spectrum activity was not assessed (Gardner
& Krechevsky, 2006). In other words, interpersonal and intrapersonal intelligence were not
assessed. Almeida et al. (2010) found difficulty in their design due to lack of logical correlations
such as correlations between linguistic intelligence and verbal measures and logical-
mathematical intelligence and numerical measures. Almeida et al. found that naturalistic and
visual-spatial intelligence correlated highest with the general intelligence measures. There were
correlations between the M.I., e.g. kinesthetic and linguistic with naturalistic, but not as much as
between some of general intelligence measures, including logical reasoning and verbal aptitude.
Almeida et al. found significant correlations between verbal traditional intelligence test scores
and naturalistic, bodily-kinesthetic, and visual-spatial M.I. scores. Numerical traditional
intelligence scores revealed significant correlations with all M.I. except for bodily-kinesthetic.

FLUID AND CRYSTALLIZED G VS. M.I.: SEM OF HUMAN INTELLIGENCE 40
Spatial traditional intelligence has significant correlations with all M.I. except for musical and
logical-mathematical. Logical reasoning traditional intelligence correlated with all M.I. but
linguistic, musical, and logical-mathematical. Memory traditional intelligence significantly
correlated with bodily-kinesthetic, visual-spatial, musical, and logical-mathematical. All M.I.
had significant correlations. Confirmatory factor analytic models were tested. A single-factor
model was rejected, but a two-factor model for traditional intelligence and M.I. as correlated
factors did fit good with regards to RMSEA; however, no SRMR was reported with RMSEA.
Castejon, Perez, and Gilar (2010) tested and published four M.I. confirmatory factor
analysis models; however, the personal intelligences were not included in any of the analysis.
The traditional theory of M.I. model did not show good fit. A M.I. on single-g model did not fit
well as with Almeida et al. (2010). Castejon et al. concluded that a correlated M.I. factor model
and a M.I. model with higher-order cognitive and non-cognitive factors fit well, and Castejon et
al. state the models could be attributed to contemporary M.I. Theory or CHC Theory. Castejon et
al. stress the necessity for better methodology in some of the research. Castejon et al. employ a
confirmatory factor analysis method in a purposively selected, but representative, sample of
children with a four-point Likert M.I. assessment that was constructed from six of seven Gardner
et al.’s (1998) Project Spectrum activities: naturalistic, bodily-kinesthetic, spatial, musical,
logical–mathematical, and linguistic. Again, the social activity was not assessed. Castejon et al.
(2010) disclose the items, tasks, abilities, and respective intelligence and provide a web link for
further inquiry. Castejon et al. state the implication that a more valid M.I. assessment is
warranted, and this implication leaves a hole in the existing research for the current study that
replicates parts of the research design and the tested models. The M.I. assessment utilized in this

FLUID AND CRYSTALLIZED G VS. M.I.: SEM OF HUMAN INTELLIGENCE 41
study is the Shearer’s (2007) Multiple Intelligence Developmental Assessment Scales
(M.I.D.A.S.) that has its reference in the Mental Measurements Yearbook with Tests in Print.
The similar, somewhat replicated here with an adult sample and paper-and-pencil
measures, confirmatory factor, measurement model, and structural model, or structural equation
modeling, studies on M.I. and traditional intelligence theories all have shortcomings. Fit indices
are not reported as suggested. SRMR indices and chi-square p-values are missing or not
interpreted. Some consider n<250 too small for any factor analyses. M.I. are missing from the
entire analysis. The M.I. subjective assessments are listed as limitations. This study tests all the
M.I. Fit indices are reported according to recommendations. The M.I. assessment utilized in this
research is has referenced validity in the Mental Measurements Yearbook with Tests in Print.
The debated theories, empirical research, and direct claims above culminates to a build a
purpose for the current study. The purpose of the present study the internal and external validity
of two intelligence measures constructed to measure two theories of intelligence: M.I. Theory
(Gardner, 1983) and Fluid and Crystallized Intelligence Theory (Cattell, 1943). As stated earlier,
there are minimal published research studies on the assessment of M.I. theory. As developers of
M.I. measures confirm the various types of validity associated with them, these measures, and
the theories associated with them, researchers have a duty to test the various claims and validities
within replicated research. A structural equation model study on measure scores of M.I. theory
and fluid and crystallized intelligence theory sheds even more light and empirical evidence on
the upcoming research questions.

FLUID AND CRYSTALLIZED G VS. M.I.: SEM OF HUMAN INTELLIGENCE 42
Review of Relevant Psychometric Measurement & Empirical Findings for Theories
Review of Assessment of Fluid and Crystallized Intelligence
Many standardized intelligence tests on the market measure fluid and crystallized
abilities. For M.I. theory standardized tests, there are much fewer developed assessments for the
theory. The following is a description of standard intelligence tests that measure and provide
scores of fluid and crystallized intelligence.
The Shipley-2 purports to measure latent fluid and crystallized cognitive functioning via
verbal, reasoning, and block completion manifest indicators (Shipley, Gruber, Martin, & Amber,
2009). The test was sufficiently standardized by English proficient adults and children. The
crystallized intelligence measure uses forty general vocabulary indicator items. Fluid intelligence
is measured by either a twenty-five indicator item puzzle and block abstraction or a twelve-item
Block Pattern Multiple-choice test based on Kohs cube designs. All tests are timed, and test
completion takes twenty to twenty-five minutes. According to Mental Measurement Yearbook
with Tests in Print professional reviewers, the Shipley-2 has mixed reviews. The test has content
validity backed by Carroll (1993) theory, acceptable convergent validity correlation coefficients
with the well-known intelligence measures, high reliability estimates for adults, but adverse
reviews point to administration time and length, too many revisions, and lack of empirical
evidence (as cited in Carlson, Geisinger, & Jonson, 2014).
The Multi-Dimensional Intelligence Test purports to measure fluid and crystallized
intelligence (PsychTests AIM, 2011b). Spatial, matrices, two- and three-dimensional images,
logical, arguments, and puzzle manifest indicators measure latent fluid intelligence. These sub-
measures total fifty-four indicator items. Verbal, vocabulary, analogies, numerical, arithmetic,
and graphs and charts manifest indicators measure latent crystallized intelligence. These sub-

FLUID AND CRYSTALLIZED G VS. M.I.: SEM OF HUMAN INTELLIGENCE 43
measures total fifty-five indicator items. The test only suggests a single time limit. According to
professor reviews, the theoretical background for development and reliability for fluid and
crystallized scores are somewhat good, but reviews of validity in other areas, including specific
development, content validity, sub-measure reliability, standardization, timing, etc., warn of
blatant validity threat for this assessment (as cited in Carlson, Geisinger, & Jonson 2014).
The Kaufman Adolescent and Adult Intelligence Test (K.A.I.T.) purports to measure latent
general intelligence via latent fluid and crystallized intelligence latent variable scales based on
the Horn and Cattell (1966, 1967) theory of fluid and crystallized intelligence (Kaufman &
Kaufman, 1993). K.A.I.T. fluid manifest indicator scales include “rebus learning”, logical steps,
mystery codes, and memory for block designs. K.A.I.T. crystallized manifest indicator scales
include definitions, auditory comprehension, double meanings, and famous faces. The K.A.I.T.
was sufficiently standardized. The K.A.I.T. subtests are timed. Content validity has been
confirmed by exploratory and confirmatory factor analysis supporting fluid and crystallized
intelligence theory. The test purports to measure the factors of Horn and Cattell’s theory versus
the extended gc-gf theory, and the developers cite reasons for the practicality and empirical
validity of this choice (Kaufman & Kaufman). The K.A.I.T. crystallized and fluid scale
reliabilities are good, and the subscales are better than acceptable. It is also reported that the
K.A.I.T. incorporates Piagetian cognitive and Luria neuropsychological theory (Kaufman &
Kaufman). Apparently, the authors have decided to not measure extended CHC Theory with the
measure. The review indicates that some subtests do better correlate with extended gc-gf theory
latent constructs and insinuates that the K.A.I.T. factors these extensions into fluid intelligence
measurement (Conoley & Impara, 1993). The K.A.I.T. does have an optional test for delayed
recall, or what could be labeled an indicator of extended theory long-term retrieval and storage,

FLUID AND CRYSTALLIZED G VS. M.I.: SEM OF HUMAN INTELLIGENCE 44
glr. Keith and Reynolds (2012) show that incorporation of this latent factor and manifest tests
into the traditional theory of fluid and crystallized intelligence model reveals a more
parsimonious fit.
The Woodcock-Johnson III Tests of Cognitive Abilities is well-known and
developed specifically from modern CHC Theory broad and narrow abilities, but there is no gc or
gf composite score directly reported (Woodcock, McGrew, Mather, & Schrank, 1997). The
Woodcock Johnson IV Tests of Cognitive Abilities is still developed specifically from modern
CHC Theory broad and narrow abilities, and there is a gc-gf composite score (Schrank, McGrew,
Mather, Wendling, & Dailey, 2014).
The Reynolds Adaptable Intelligence Test (R.A.I.T.) purports to measure latent fluid and
crystallized intelligence. The R.A.I.T. is able to provide a Crystallized Intelligence Index (CII),
Fluid Intelligence Index (FII), Total Intelligence Index (TII), Quantitative Intelligence Index
(QII), and Total Battery Intelligence Index (TBII). (Reynolds, 2014a, 2014b). The R.A.I.T. was
standardized (N=2,124) for ages ten to seventy-five years (Reynolds, 2014a, 2014b). The
R.A.I.T. shows convergent validity with the Wechsler Adult Intelligence Scale-IV (Wechsler,
2008), Wonderlic Personnel Test (Wonderlic, 2002), and other standardized academic
achievement measures (Reynolds, 2014b). The R.A.I.T. Professional Manual reviews all forms
of validity for the test and measure latent variables. Reported Cronbach alpha reliabilities have
sufficient range within subtests and score indexes for ages 18-25 (αsubtests=.71-90; αindexes=.89-
97). The test has been professionally applied to effective diagnoses of learning disability,
intellectual disability, and giftedness and decision-making in human resource/employment
contexts (Reynolds, 2014b). The R.A.I.T. also has practical application validity in hearing,
physical/orthopedic/motor, and neuropsychological impairment, and emotional disturbance

FLUID AND CRYSTALLIZED G VS. M.I.: SEM OF HUMAN INTELLIGENCE 45
contexts (Reynolds, 2014b). Reynolds (2014b) defines crystallized intelligence as problem
solving based on knowledge and fluid intelligence as problem solving without factual
knowledge. According to Reynolds (2014), the R.A.I.T. was developed in accordance with the
Standards for Educational and Psychological Testing (American Educational Research
Association, American Psychological Association, & National Council on Measurement in
Education, 1999). According to reviews, the R.A.I.T. is based on the most contemporary
normative data (Reynolds, 2014a). According to reviews, “In contrast to highly interactive,
individually administered intelligence tests, the R.A.I.T. seems most appropriate for evaluation of
typical adolescents and adults” (Carlson, Geisinger, & Jonson, 2014, n.p.). According to reviews,
the R.A.I.T. is one of the best intelligence tests for convergent validity and multiple settings
(Carlson, Geisinger, & Jonson, 2014). “The R.A.I.T. succeeds in its goal of providing an
adaptable, shorter comprehensive measure of intelligence developed with technical quality”
(Carlson, Geisinger, & Jonson, 2014, n.p.). This study uses the R.A.I.T. as a measure fluid
intelligence and crystallized intelligence.
Review of Assessment of M.I.
Shearer’s (2011) Multiple Intelligence Developmental Assessment Scales (M.I.D.A.S.)
carries the most validity for the assessment of Gardner’s “M.I. Theory.” This conclusion is based
on limitations in previous research, the following reviews taken from several editions of the
Mental Measurements Yearbook with Tests in Print, and empirical evidence for the M.I.D.A.S.
The Assessment of Multiple Intelligence (AMI) purports to measure latent bodily-
kinesthetic, logical-mathematical, linguistic, visual-spatial, musical, intrapersonal, and
naturalistic intelligence (PsychTests AIM, Inc., 2011a). The assessment is not timed, but an
approximate test time for the total of fifty-five item indicators is pointed out (PsychTests AIM,

FLUID AND CRYSTALLIZED G VS. M.I.: SEM OF HUMAN INTELLIGENCE 46
Inc). The assessment is self-reported, and development descriptive statistics indicate a positive
skew for inflated self-ratings. Overall reliability meets basic, but not high-stakes, standards with
the naturalistic latent indicator not meeting classroom test reliability levels, but there are no
component or factor analytic results for construct validity in the manual (Carlson, Geisinger, &
Jonson, 2014).
The Teele Inventory for Multiple Intelligence (T.I.M.I.) purports to measure “dominant
ways individuals learn and process information…dominant intelligence” via latent variable
scores of linguistic, logical-mathematical, musical, spatial, bodily-kinesthetic, intrapersonal, and
interpersonal intelligence. These are seven of the eight or more intelligence proposed by
Gardner’s “Theory of M.I.”. The T.I.M.I. assessment is not timed, but an approximate test time
for the total of twenty-eight item indicators is pointed out. The T.I.M.I. assessment description
supports a definition of intelligence as a learning style. Reviews indicate no validity reports, poor
overall validity, and a preference vs. aptitude scale (Spies & Plake, 2005).
The Multiple Intelligence Developmental Assessment Scales, Adult Version (M.I.D.A.S.-
Adult) consists of 119 Likert-style response items (Shearer, 2007). Administration of the
M.I.D.A.S. takes approximately twenty-five minutes and the assessment is untimed (Shearer,
2007). The M.I.D.A.S. can be administered in paper-and-pencil format or in a computerized
format. The M.I.D.A.S. measures eight latent intelligence proposed in Gardner’s (1993) “Theory
of M.I.” and the assessment’s items are based on Gardner’s detailed description of the
intelligence in Frames of Mind (Shearer, 2007). The latent intelligence factor variables of the
M.I.D.A.S. are Musical Intelligence, Kinesthetic Intelligence, Logical-Mathematical Intelligence,
Spatial Intelligence, Linguistic Intelligence, Interpersonal Intelligence, Intrapersonal
Intelligence, and Naturalist Intelligence. The M.I.D.A.S.-Adult was normed from representative

FLUID AND CRYSTALLIZED G VS. M.I.: SEM OF HUMAN INTELLIGENCE 47
samples (N>2,000) of college students (n=1,347) and adults (n=1,071) from a variety of
disciplines (Shearer, 2007). According to professional reviews, confirm the empirical research
for the overall validity of the M.I.D.A.S. (Geisinger, Spies, Carlson, & Plake, 2007).
The M.I.D.A.S. manual provides a Principal Components Analysis of adult data collected.
Only a few indicators had significant correlations with intelligence that they were not developed
to measure (Shearer, 2007). The original 2005 study (n=23,000) included two latent factor spatial
scales and found nine factors (as cited in Shearer, 2012a). Shearer and Luzzo (2009) report the
long-term benefits of the M.I.D.A.S. based on M.I. theory. Self-reports of former M.I.D.A.S.
participants reveal the practical validity of M.I. theory.
Shearer (2012a) conducted an inter-rater reliability study that resulted in high content,
criterion group, concurrent and construct validity for the self-report M.I.D.A.S. Primary-self and
secondary self-agreements were high. The appendices in the report include the definitions of the
intelligence and a summary of psychometric findings. Pizarro (2003) found seven factors and
Yoong (2001) found eight factors (as cited in Shearer, 2012a).
Shearer (2012b) found generalizability, external, validity evidence for the M.I.D.A.S.
Shearer (2012b) reports that a nine-factor hypothesized model fit well after a confirmatory factor
analysis of M.I.D.A.S. data (n=1,800) from a previous North American sample. Shearer (2012b)
implemented a cross-cultural principal components analysis design study using the M.I.D.A.S.
with an English speaking sample (n=2,615) gathered from nine different countries across the
world. A cogent range of item responses was reported across the samples. A PCA scree plot
indicated a break at eight components, and nearly half of the variance was accounted for by ten
components. Shearer (2012b) implemented a cross-cultural exploratory factor analysis design
study using the M.I.D.A.S. with a non-English speaking sample (n=742) gathered from nine

FLUID AND CRYSTALLIZED G VS. M.I.: SEM OF HUMAN INTELLIGENCE 48
different countries. The final results support culturally related intelligence factors within culture-
fair tests.
Assessment Summary
The Reynolds Adaptable Intelligence Test has high validity for the testing of Cattell’s
“Theory of Fluid and Crystallized Intelligence” purposes of this study. The Multiple Intelligence
Developmental Assessment Scales carry high validity, especially related to previous theory of
M.I. study implications, for the purposes of this study.
Research Questions
There are several research questions. Which existing theory-based and hypothetically
based models of intelligence reveal the best fit after administration of an assessment of
crystallized and fluid intelligence? Which existing theory-based and hypothetically based models
of intelligence reveal the best fit after administration of an assessment of M.I.? Does the Multiple
Intelligence Developmental Assessment Scales reveal a hierarchical second-order factor? Which
combined theory models of intelligence reveal the best fit?
The stated a priori criterion for best fitting models was one with a χ2 goodness-of- fit p-
value >.05. The Comparative Fit Index (CFI), Tucker-Lewis Index (TLI), and Root Mean Square
Error of Approximation (RMSEA) and its confidence intervals were a priori stated fit indexes to
assess model fit. Criteria for the latter fit indexes would be based on recommendations from the
literature. Further model and lists of additional fit indices used for assessment are listed in the
Methods section.

FLUID AND CRYSTALLIZED G VS. M.I.: SEM OF HUMAN INTELLIGENCE 49
Methods
Participants
Participants were provided a HSRB approved informed consent form before testing.
Participants were aware they would be participating in a study of human intelligence and theory
where collected data would be kept confidential. The research had less than minimal to no
foreseeable risks. Participants understood that testing would take one-hour. Participants would be
compensated $10 for their participation. Participants were also entitled to the official M.I.D.A.S.
profile and R.A.I.T. ranking. Participants understood participation was voluntary, and participants
may have withdrawn from participation at any time and for any reason. If participants decided to
withdraw from the study, then they would be compensated with a Rubik’s cube keychain or mind
puzzle for time spent. The initial participant sample was three hundred and five participants
(n=305) while the final sample size was two hundred eighty-seven (n=287). SPSS 23
Professional calculated the descriptive statistics for the final sample (IBM, 2015).
Table 1: Participant Age
N Valid 286
Missing 1
Mean 20.31
Median 20.00
Mode 18
S.D. 2.082
Minimum 18
Maximum 25 Table 1: Participant Age Descriptive
Statistics displays the sample (n=287)
mean age, median age, and modal age
(M= 20.31, Med=20, Mode=18).
The standard deviation is the average
distance from the mean age in the
distribution (s.d.=2.082). The range of
age was 18 to 25 (Min.=18, Max=25).

FLUID AND CRYSTALLIZED G VS. M.I.: SEM OF HUMAN INTELLIGENCE 50
Participants reported age on the R.A.I.T. Participant year of birth was reported on the
M.I.D.A.S. Table 1: Participant Age provides frequencies, percent, percent without missing data,
cumulative percent, and totals for participant ages. Participant age ranged from 18 to 25 years
old while the average age was between twenty and twenty-one with one standard deviation
equaling age eighteen to twenty-two (Mage= 20.31; s.d.=2.1; Min.=18, Max.=25) (Table 1). The
most observed age was eighteen while the middle age in the set was twenty (Modeage=18;
Medage= 20.00) (Table 2).
Table 2: Participant Age Frequency Statistics
N Percent Cumulative Percent
Valid 18 71 24.7 24.8
19 60 20.9 45.8
20 39 13.6 59.4
21 31 10.8 70.3
22 30 10.5 80.8
23 30 10.5 91.3
24 14 4.9 96.2
25 11 3.8 100.0
Total 286 99.7
Missing System 1 .3
Total 287 100.0 Table 2: Age Frequency Statistics displays: count of participants by age, percent
by age, cumulative percent, count and percentage totals, missing count and
percentage, and total count and percentages for the sample (n=287).
Approximately twenty-five percent of participants in the analysis were age 18 (n=71).
Approximately twenty-one percent of participants were age 19 (n=60). Approximately fourteen
percent of participants were age 20 (n=39). Approximately eleven percent of participants were
age 21 (n=31). Approximately eleven percent of participants were age 22 (n=30). Approximately

FLUID AND CRYSTALLIZED G VS. M.I.: SEM OF HUMAN INTELLIGENCE 51
eleven percent of participants were age 23 (n=30). Approximately five percent of participants
were age 24 (n=14). Approximately four percent of participants were age 25 (n=11). Less than
one percent of participants did not provide age on the R.A.I.T. test form answer sheet (n=1), but
this participant’s age was twenty-four or twenty-five based on year of birth. Later in the analysis,
the participants age was entered as twenty-four.
Table 3: Participant Gender
n Percent
Cumulative
Percent
Valid Female 159 55.4 55.4
Male 128 44.6 100.0
Total 287 100.0 Table 3: Participant Gender displays: count, percent, and cumulative percent for
female (n=159) and male (n=128) participants.
Participants reported gender on the test forms. Approximately fifty-five percent of
participants were female (n=159). Approximately forty-five percent of participants were male
(n=128). Table 3: Participant Gender provides n, percent, and cumulative percent totals for
participant ages. Gender frequency statistics are representative of the population.
Table 4: Participant Grade
N Percent
Valid 13 86 30.0
14 58 20.2
15 65 22.6
16 35 12.2
17 23 8.0
18 14 4.9
19 1 .3

FLUID AND CRYSTALLIZED G VS. M.I.: SEM OF HUMAN INTELLIGENCE 52
Total 282 98.3
Missing System 5 1.7
Total 287 100.0 Table 4: Participant Grade Level:
Freshman=13, Sophomore=14, Junior=15,
Senior=16, Grad 1st=17, Grad 2nd =18,
Grad 3rd =19
Participants were instructed to report grade level according to university records based on
number of credits earned. Grade 13 represents a freshman university student. Grade 14
represents a sophomore university student. Grade 15 represents a junior university student. Grade
16 represents a senior university student. Grade 17 represents a first year graduate student. Grade
18 represents a second year graduate student. Grade 19 represents a third year graduate student.
Grade 20 would represent a fourth year graduate student, but no participants reported a grade
level of 20.
Participants reported grade level/highest level of education ranging from 13 to 19.
Freshman university students made up 30% of the sample (n=86). Sophomore university students
made up approximately 20% of the original sample (n=58). Junior university students made up
nearly 23% of the sample (n=65). Senior university students made up approximately 12% of the
sample (n=35). First year graduate students made up 8% of the sample (n=23). Second year
graduate students made up approximately 5% of the sample (n=14). Third year graduate students
made up <1% of the sample (n=1). Students with missing data reported responses to grade
level/highest level of education such as “bachelors” or “graduate” (<2%; n=5).

FLUID AND CRYSTALLIZED G VS. M.I.: SEM OF HUMAN INTELLIGENCE 53
Table 5: Participant Race Category
Frequency Percent
Valid Asian 86 30.0
Black or African American 31 10.8
Hispanic or Latino 23 8.0
Native Hawaiian or Other Pacific Islander 2 .7
No Answer 20 7.0
Two or More Races 20 7.0
White 105 36.6
Total 287 100.0 Table 5: Participant Race Category displays NCES race category frequencies and percentages.
Participant race was disclosed on the R.A.I.T. Race was categorized according the
National Council on Education Statistics (NCES) categories (U.S. Department of Education,
Institute of Education Sciences, National Center for Education Statistics, n.d.). Race was
categorized as Asian, Black or African American, Hispanic or Latino, Native Hawaiian or Other
Pacific Islander, Two or More Races, White, or No Answer.
Thirty-percent of participants reported being of the Asian race (n=86). Approximately
eleven percent of participants reported being of the Black or African-American race (n=31).
Eight percent of participants reported being of the Hispanic or Latino category (n=23). Less than
one percent of participants reported being of the Native Hawaiian or Other Pacific Islander race
(n=2). Seven percent of participants reported being of the Two or More Races category (n=20).
Approximately thirty-seven percent of the participants reported being in the White race category
(n=105). Seven percent of participants did not report a race category (n=20).

FLUID AND CRYSTALLIZED G VS. M.I.: SEM OF HUMAN INTELLIGENCE 54
Measures
Reynolds Adaptable Intelligence Test (R.A.I.T.)
The Reynolds Adaptable Intelligence Test (R.A.I.T.) is able to provide a Crystallized
Intelligence Index (CII), Fluid Intelligence Index (FII), Total Intelligence Index (TII),
Quantitative Intelligence Index (QII), and Total Battery Intelligence Index (TBII) (Reynolds,
2014). Reynold's (2014) R.A.I.T. was standardized for ages ten to seventy-five years. The
R.A.I.T. can be administered in paper-and-pencil format or in a computerized format. The CII
and FII average equal a TII, general intelligence, or g. The CII and FII are used in this study
using paper-and-pencil format. The CII and FII total testing time is thirty minutes. The CII takes
a total of thirteen minutes to complete. The FII takes a total of seventeen minutes to complete.
The five subtests for both indexes are timed.
The CII provides a latent factor variable measure of crystallized intelligence, gc. The CII
consists of three verbal and inductive reasoning subtests, or indicators (Reynolds, 2014). The
General Knowledge (GK) manifest subtest consists of forty-seven items to be completed in a
three-minute time span. The manifest variable items measure the manifest variables of cultural
knowledge, reasoning, and classification abilities. Famous people are identified and the test-taker
classifies the people into categories. The Odd Word Out (OWO) manifest subtest consists of
forty items to be completed in a five-minute time span. The manifest items measure basic
vocabulary and verbal reasoning by asking the examinee to select one out of five words that do
not categorize with the other four words. The Word Opposites (WO) subtest consists of forty
items to be completed in a five-minute time span. The items measure basic vocabulary and
verbal reasoning by asking the examinee to view a target word and identify the antonym of the

FLUID AND CRYSTALLIZED G VS. M.I.: SEM OF HUMAN INTELLIGENCE 55
target word from five response choices. The antonym vs. synonym structure is somewhat
innovative. Internal-consistency of the CII is reported as high (α=.93) (Reynolds, 2014).
The Fluid Intelligence Index (FII) provides a measure of Fluid intelligence, gf. The FII
consists of two nonverbal and deductive reasoning subtests, or indicators (Reynolds, 2014). The
Nonverbal Analogies (NVA) subtest consists of fifty-two items to be completed in a seven-
minute time span. The items measure nonverbal and deductive reasoning by asking the examinee
to complete a fill-in-the-blank pictorial, shapes, objects, or colors, or combination analogy. The
Sequences (SEQ) subtest consists of forty-three items to be completed in a ten-minute time span.
The items measure nonverbal and deductive reasoning and sequencing abilities by asking the
examinee to choose the best response to add to the sequence of pictures, shapes, objects, or
colors, or combination of these. Internal-consistency of the FII is high (α=.93) (Reynolds, 2014).
Item difficulties increase systematically. The official R.A.I.T. answer sheet is divided into
seven subtest columns with two answer columns in each subtest. The three crystallized subtests
generally have at least one column completed in the allowed time. The two fluid subtests
generally have a little more than one column complete in the allowed time.
Carroll (1993) identified 236 factors of intellectual reasoning in his survey of factor
analytic studies of mental reasoning. Two of the factors were Figure Analogies Completion and
Figure Classification. The NVA test of the R.A.I.T. is comparable to the Figure Analogies
Completion. The SEQ test of the R.A.I.T. is comparable to the Figure Classification. Three of the
factors were Word Classification, Vocabulary, Reconcile Opposites, and Recognition of Figures.
The OWO test of the R.A.I.T. is comparable to the Word Classification factor. The WO test of
the R.A.I.T. is comparable to the Vocabulary and Reconcile Opposites factors. The GK test of the
R.A.I.T. is comparable to the Recognition of Figures factor.

FLUID AND CRYSTALLIZED G VS. M.I.: SEM OF HUMAN INTELLIGENCE 56
Multiple Intelligence Developmental Assessment Scales—Adult (M.I.D.A.S.-Adult)
The Multiple Intelligence Developmental Assessment Scales, Adult Version (M.I.D.A.S.-
Adult) consists of 119 Likert-style response items (Shearer, 2007). Administration of the
M.I.D.A.S. takes approximately twenty-five minutes, and the assessment is untimed (Shearer,
2007). Some individuals complete the M.I.D.A.S. in as little as fifteen minutes and for some it
takes closer to minutes or more. On average, the M.I.D.A.S. takes twenty-five minutes to
complete, and assessment takers should be instructed of the eight subtests with one-hundred and
nineteen items with approximate time length. Essentially, a M.I.D.A.S. assessment taker should
be instructed that the product of eight subtests with four minutes in each subtest equals thirty-two
minutes. The M.I.D.A.S. measures eight latent intelligence proposed in Gardner’s (1993) “M.I.
Theory.” The latent intelligence factor variables of the M.I.D.A.S. are Musical Intelligence,
Kinesthetic Intelligence, Logical-Mathematical Intelligence, Spatial Intelligence, Linguistic
Intelligence, Interpersonal Intelligence, Intrapersonal Intelligence, and Naturalist Intelligence.
Each latent intelligence factor variable within the M.I.D.A.S. is measured via two to four
manifest subscale indicators. The manifest subscales, or indicators, consist of nine to twenty
manifest item variables. Manifest subscales of appreciation, vocal ability, instrumental skill, and
composing measure musical intelligence. Athletics and dexterity measure kinesthetic
intelligence. Strategy games, everyday math skill, everyday problem solving, and school math
measure logical-mathematical intelligence. Spatial awareness, artistic design, and working with
objects measure spatial intelligence. Rhetorical skills, expressive sensitivity, and
written/academic ability measure linguistic intelligence. Social sensitivity, social persuasion, and
interpersonal work measure interpersonal intelligence. Personal knowledge/efficacy, self/other-

FLUID AND CRYSTALLIZED G VS. M.I.: SEM OF HUMAN INTELLIGENCE 57
efficacy, calculations, and spatial problem-solving measure intrapersonal intelligence. Animal
care, plant care, and science measures naturalist intelligence.
The manifest variables are measured on a six-point Likert scale with responses self-
reported by the assessment taker. The Likert scale collects self-reports ratings and answers of
“never”, “not at all”, “no”, etc. to “all the time”, “excellent”, etc., and each manifest item allows
an “I don’t know” response. The variety of responses within the assessment allows for some
manifest variables to be considered dichotomous, “yes” or “no”, but, also ordinal in what extent
or magnitude of “yes”. This essentially supports a self-reported measurement of ability but based
on factual past experiences, and report of factual experiences is suggested for validity in self-
reports (Gerald & George, 2010).
Data Collection
A criterion sampling method with convenience sampling similarity was used. Participants
were recruited via flyers posted on campus and university email. Emails were drawn from the
university directory. Requirements to participate in the research on human intelligence were to
be age 18-25 and a university student.
Test and Assessment Administration
Data collection took place for twelve weeks. Testing took place in a single classroom in
the College of Education and Human Development at the university. The testing area was pre-
approved and secured by the researcher as adequate testing area. Testing area adequacy criteria
included a comfortable location with ample desk space to take the tests, zero to very limited
disruptions during testing, and access to the test administrator at all times during testing.
Participants scheduled for a time of their choice on a Thursday or Friday. Testing session
attendance varied from two to twenty-eight. Pencils and scratch paper were provided.

FLUID AND CRYSTALLIZED G VS. M.I.: SEM OF HUMAN INTELLIGENCE 58
Participants were allowed to use their own pencil if requested. Participants were required to
review and sign an informed consent form prior to the testing session. Timers tracked time on the
R.A.I.T. subtests. The M.I.D.A.S. is untimed, but participants were reminded that the instructions
state that the assessment takes approximately twenty-five minutes, so they should not find
themselves in a subtest for more than four minutes. The testing sessions went on for twelve
weeks. At two times during the twelve weeks, participants were invited back to collect their
M.I.D.A.S. profiles and R.A.I.T. rankings. Approximately one-third of the participants returned
for their scores. Prior to the testing stages of the research, an informal training on how to disclose
M.I.D.A.S. profiles to participants took place.
Participants are greeted when arriving for testing time. Participants were provided the
informed consent form to sign and a copy for their records.
Administration of the R.A.I.T. is first. Each participant is given a test booklet and a
separate answer sheet. Participants are reminded to read the test booklet cover instructions
thoroughly. Each test has a ‘continue to next page’ or ‘stop’ prompt. Participants are told to
notify the test administrator upon reaching a ‘stop’ and having no desire to check previous
answers. Though the R.A.I.T. is not a test of speed, the administrator keeps track of test times
with a stopwatch. After each test, participants are instructed to locate the next subtest in the
booklet, read the instructions, and begin. Upon completion of all R.A.I.T. subtests, test booklets
and answer sheets are collected.
Administration of the M.I.D.A.S. is second. The total testing time is twenty-five minutes.
Each participant is given a test and a separate answer sheet. Participants are reminded to read the
test instructions thoroughly and begin. The assessment is completed in its entirety without pauses
between subtests. Upon completion of the untimed M.I.D.A.S., the test administrator collected

FLUID AND CRYSTALLIZED G VS. M.I.: SEM OF HUMAN INTELLIGENCE 59
forms and answer sheets. Participants were thanked for their time, compensated, and reminded
that they may contact the researcher for scores.
M.I.D.A.S. and R.A.I.T. test data was collected from three-hundred and five participants
(n=305). Two cases were immediately dropped for incomplete tests, and two cases were
eventually dropped for discovering that they were not students in the university directory
(n=301). These four cases (n=4, ≈1%) are considered error of execution or missing completely at
random (MCAR) data (Anscombe & Guttman, 1960; Tabachnick & Fidell, 2013). Fourteen
additional cases were eventually dropped for being univariate or multivariate outliers (n=287).
Data Analysis
IBM SPSS Statistics Premium 23 and SPSS Amos 23 (2015) statistical software was used
for data storage and analysis. Multiple measurement models were constructed based on existing
theory, empirical evidence, and untested hypothetical models in SPSS Amos 23 (IBM, 2015).
Assumptions of Structural Equation Modeling (SEM) were met with consideration for normality.
Raw test and assessment scores were used during the main analysis while R.A.I.T. standard
scores were incorporated into some the last tested models. It turned out that a variety of fit
indices from the literature were utilized in assessing model fit.
Measurement and Structural Models
The R.A.I.T. collected data was analyzed via traditional and second-order confirmatory
factor analytic models during the SEM. A model's fit for Cattell’s original bi-factor theory was
created with covariance between the factors. The R.A.I.T. Professional Manual provides a
Principal Components Analysis (PCA) displaying the two factors and respective coefficients
(Reynolds, 2014). A second-order confirmatory model was tested within the SEM. This model
reflected the first model and still reflect Cattell’s Theory with the second-order g factor rather

FLUID AND CRYSTALLIZED G VS. M.I.: SEM OF HUMAN INTELLIGENCE 60
than correlations between each other. A single-trait multimethod (STMM) without g factoring
through first-order gf and gc model was tested, and a single-trait correlated uniqueness (STCU)
between fluid subscales and crystallized subscales was tested (Gignac, 2006; Holzinger &
Swineford, 1937; Sternberg & Grigorenko, 2002).
The M.I.D.A.S. data was analyzed by first, second, and third-order confirmatory factor
analysis during the SEM. The theoretical measured model, Castejon et al.’s measured models,
and additional models were tested.
First, a model of eight distinct uncorrelated latent factors (intelligence) was be tested for
fit. This model is one first proposed by Gardner (1993) with eight distinct and uncorrelated
intelligence.
Second, a model with eight correlated intelligence, as tested by Castejon et al. (2010) was
be tested for fit. This is the MI theory model that was supported in Castejon et al.’s study.
A model with first-order M.I. factors and two second-order factors of intelligence were
tested for fit. Castejon et al. (2010) found acceptable fit for this model as well. This same model
was retested with a third-order factor measurement model containing a general intelligence
factor, g. Castejon et al. (2010) rejected this model. A nested multiple factor model with musical
and bodily-kinesthetic factors as talent was tested (Keith & Reynolds, 2012, p. 771; Sternberg &
Grigorenko, 2002).
Structural Equation Modeling (SEM) Assumptions
The final sample size was two-hundred eighty-seven (n=287). Anscombe and Guttman
(1960) state that 5% of data are error of execution outliers. Tabachnick and Fidell (2013) indicate
that approximately 5% of data becomes Missing Completely at Random (MCAR). According to
Rencher and Christensen (2012), more often than not 10% of observations, and commonly more,

FLUID AND CRYSTALLIZED G VS. M.I.: SEM OF HUMAN INTELLIGENCE 61
are outliers. Kline (1998) also suggests 10% of data be dropped. According to Ratcliff (1993),
“the goal for our models and empirical research should be to account for the middle 85–95% of
the observations in our reaction time distributions; these are the data that are most likely to come
from the real processes under consideration and also most likely to be critical in testing
hypotheses and models” (p. 511).
After four cases (n=4, ≈1.3%) from the original three-hundred and five (n=305) were
dropped as MCAR data, fourteen (n=14, ≈4.6%) were dropped for being univariate or
multivariate outliers. Seven cases were excluded from analysis for being univariate outliers
(>±3.0 s.d., p≤.0027). David (1979) states that some suggest univariate outlier cutoff criterion of
p = .2 or 1, but he indicates that the lower p-values provide more robust estimates. One case had
a self-knowledge, calculations, and effectiveness outlier z-score of >±3.0 s.d. (z=-3.6, z=-4.4, z=-
3.2, respectively). One case had a self-knowledge outlier z-score (z=-3.6). One case had a
working with people outlier z-score (z=-3.2). Two cases had OWO outlier z-scores (z=3.1; z=-
3.0). One case had a NVA outlier z-score (z=-3.1). One cases had a SEQ outlier z-score (z=-3.1).
A Mahalanobis d-squared value at p≤ .0015 criterion cut-off was used for multivariate
outliers (Tabachnick & Fidell, 2013). Seven cases were excluded from analyses for being all
thirty-one (M.I.D.A.S. & R.A.I.T.); twenty-six M.I.D.A.S., or five R.A.I.T. multivariate outliers
(Mahalanobis d-squared= 61.6348, p=.0009; 60.4933, p=.0012; 59.7021, p=.0015 (R.A.I.T. &
M.I.D.A.S.); 58.4724, p=.0003; 56.5592 p=.0005 (M.I.D.A.S.); 37.7509, p=.0000; 19.8973
p=.0013 (R.A.I.T.). Tables 6-8 display the R.A.I.T. & M.I.D.A.S., M.I.D.A.S., and R.A.I.T.
observations farthest from the centroid with highest Mahalanobis d-squared values and lowest p-
values for the retained sample (n=276).

FLUID AND CRYSTALLIZED G VS. M.I.: SEM OF HUMAN INTELLIGENCE 62
Table 6: M.I.D.A.S. & R.A.I.T. Observations Farthest
from the Centroid
Observation number Mahalanobis d-squared p1 p2
160 56.359 .004 .638
242 53.856 .007 .570
20 53.364 .008 .366
250 53.254 .008 .183
254 52.968 .008 .092
94 51.997 .010 .084
16 51.810 .011 .040
103 50.963 .013 .041
203 50.309 .016 .038
284 49.864 .017 .029
222 49.704 .018 .016
156 48.458 .024 .044 Table 6: M.I.D.A.S. & R.A.I.T. Observations Farthest from the Centroid displays
the highest Mahalanobis d-squared values and lowest p-values for the sample
after statistically significant (p≤.0015) Mahalanobis d-squared outlier
observations were rejected from the analyses.
SPSS Amos (2015) calculates Mahalanobis d-squared as (x-μ) Т Σ -1 (x-μ). Mahalanobis
(1936) introduced the d-squared statistic for “sampling fluctuations” (p. 52-53).
Table 7: M.I.D.A.S. Observations Farthest from the
Centroid
Observation number Mahalanobis d-squared p1 p2
2 49.480 .004 .647
274 48.276 .005 .422
176 48.238 .005 .180
43 47.723 .006 .088
177 47.058 .007 .051
201 46.392 .008 .033
195 45.981 .009 .018
283 45.948 .009 .006
87 45.900 .009 .002
38 44.676 .013 .004
189 43.627 .017 .009

FLUID AND CRYSTALLIZED G VS. M.I.: SEM OF HUMAN INTELLIGENCE 63
Observation number Mahalanobis d-squared p1 p2
210 43.585 .017 .004
184 43.316 .018 .002
180 43.154 .019 .001
143 42.650 .021 .001 Table 7: M.I.D.A.S. Observations Farthest from the Centroid displays the highest
Mahalanobis d-squared values and lowest p-values for the sample after statistically
significant (p≤.0015) Mahalanobis d-squared outlier observations were rejected from
the analyses.
The centroid is located in the center of a x-y plot of all the variable data, essentially the center of
all of the means (Tabachnick & Fidell, 2013).
Table 8: R.A.I.T. Observations Farthest from the Centroid
Observation number Mahalanobis d-squared p1 p2
71 18.1409 .0028 .5495
53 17.1175 .0043 .3480
256 16.9832 .0045 .1427
46 16.5021 .0055 .0772
43 15.6886 .0078 .0757
213 14.9141 .0107 .0912
207 14.4687 .0129 .0805
220 14.4665 .0129 .0344
62 14.2914 .0139 .0199
258 13.1267 .0222 .1099 Table 8: R.A.I.T. Observations Farthest from the Centroid displays the highest
Mahalanobis d-squared values and lowest p-values for the sample after statistically
significant (p≤.0015) Mahalanobis d-squared outlier observations were rejected from
the analyses.
Tables 6, 7, and 8 show that no cases in the final sample were multivariate outliers according to
the Mahalanobis d-squared with a cut-off criterion of p≤.0015. According to Amos (2015), the
p1-value is the probability of a Mahalanobis distance squared larger than its value in the dataset,
and the p2-value is the probability of the largest possible Mahalanobis distance squared is larger
than its value.

FLUID AND CRYSTALLIZED G VS. M.I.: SEM OF HUMAN INTELLIGENCE 64
Table 9: R.A.I.T. Assessment of Normality
Variable min Max Skew c.r. kurtosis c.r.
SEQ 16 39 -.47 -3.26 -.10 -.36
NVA 15 45 -.09 -.62 -.47 -1.62
WO 7 36 .12 .85 .29 1.00
OWO 9 33 .06 .39 -.34 -1.16
GK 1 35 .08 .55 -.29 -.99
Multivariate 1.08 1.09 Table 9: R.A.I.T. Assessment of Normality: Minimum and Maximum Scores,
Skewness and Kurtosis Statistics, Skewness and Kurtosis Critical Ratios, Mardia’s
Coefficient of Multivariate Kurtosis, and Mardia’s Coefficient Critical Ratio
Byrne (2010) reviews the importance of the assessment of normality in SEM. Kurtosis
values ≥7 disturb a normal distribution (Byrne, 2010). The R.A.I.T. subtest data contains very
minimal kurtosis (M= -0.18). The M.I.D.A.S. subtest data contains very minimal kurtosis (M= -
0.56). Byrne (2010) also provides an explicit example of minor deviations when running ML
Estimation with highly extreme non-normal data.
Table 10: M.I.D.A.S. Assessment of Normality
Variable Min Max skew c.r. kurtosis c.r.
Composer 1.00 5.00 .02 .13 -.79 -2.74
Vocal .00 5.00 .20 1.41 -.65 -2.25
Instrument 1.00 5.00 .24 1.67 -.55 -1.90
Appreciation 1.00 5.00 -.22 -1.51 -.32 -1.10
Dexterity 1.25 4.63 .15 1.04 -.41 -1.42
Athletic 1.00 5.00 .13 .89 -.78 -2.68
Everyday_PS 1.00 5.00 -.14 -1.00 -.61 -2.11
Effectiveness 1.00 5.00 -.24 -1.65 -.49 -1.70
Plant_Care .00 5.00 .22 1.51 -.46 -1.58
Animals 1.00 5.00 .36 2.50 -.69 -2.40
Science 1.00 5.00 -.13 -.87 -.78 -2.70
Objects 1.00 5.00 -.06 -.42 -.69 -2.38
Art_Design 1.00 5.00 -.08 -.56 -.72 -2.49
Spatial_Aware 1.00 4.83 .02 .16 -.83 -2.89
Everyday_Math 1.00 5.00 .22 1.49 -.72 -2.49

FLUID AND CRYSTALLIZED G VS. M.I.: SEM OF HUMAN INTELLIGENCE 65
Variable Min Max skew c.r. kurtosis c.r.
Logic_Games 1.00 4.67 .12 .80 -.73 -2.51
School_Math 1.25 5.00 -.28 -1.95 -.79 -2.73
Spatial_PS 1.00 5.00 .06 .39 -.17 -.60
Calculations 1.33 5.00 -.47 -3.23 -.20 -.71
Self_Know 1.00 5.00 -.61 -4.25 -.24 -.84
People 1.33 5.00 .00 .00 -.35 -1.20
Sensitivity 1.20 5.00 -.21 -1.48 -.28 -.95
Persuasion 1.20 5.00 -.28 -1.94 -.45 -1.57
Read_Write 1.43 5.00 -.10 -.66 -.49 -1.68
Rhetorical 1.00 5.00 -.11 -.77 -.58 -2.00
Expressive 1.38 5.00 .02 .14 -.65 -2.26
Multivariate 29.29 6.50 Table 10: M.I.D.A.S. Assessment of Normality: Minimum and Maximum Scores,
Skewness and Kurtosis Statistics, Skewness and Kurtosis Critical Ratios, Mardia’s
Coefficient of Multivariate Kurtosis, and Mardia’s Coefficient Critical Ratio
A formula for determining multivariate normality based on Mardia’s multivariate
coefficient provided by AMOS is p(p+2) where p is the number of variables, and Mardia’s
multivariate coefficient value < p(p+2) assumes normality (Raykov & Marcoulides, 2008; Teo,
Tsai, & Yang, 2013). For the R.A.I.T. data, Mardia’s multivariate coefficient = 1.08 and p(p+2) =
5(7) =35. For the M.I.D.A.S. data, Mardia’s multivariate coefficient = 29.29 and p(p+2) = 26(28)
=728. Additionally, Q-Q plots, percentiles, z-scores and p-values, chi-square statistics and p-
values, standard score statistics, scatter plots, histograms, and other distance measures were
analyzed. The R.A.I.T. and M.I.D.A.S. data is sufficiently normally distributed without outliers
for the assumptions and purposes of ML estimation in the SEM.
Test & Assessment Scores
R.A.I.T. data was scored according to the instructions in the R.A.I.T. Professional Manual
(Reynolds, 2014). A scoring key was provided with the test kit. Raw, t-, and standard scores
were calculated. The demographic information and scores were input into an encrypted SPSS

FLUID AND CRYSTALLIZED G VS. M.I.: SEM OF HUMAN INTELLIGENCE 66
file. Raw scores were used during the majority of the inferential data analysis, but the scaled
scores were eventually entered into structural models.
M.I.D.A.S. data was input into an encrypted SPSS file. Raw scores and demographic
information were entered. The raw scores were sent to the Online M.I.D.A.S. Scoring system for
profile generation. Raw scores were used during the inferential data analysis of this study.
Cronbach’s alpha reliability between scales (119 items) was high (α=.95), and alpha within
scales was high (Min α=.77; Max α=.91; Malpha=.85). Raw scores were averaged for each
subscale indicator. Scores of “six” on an item for “I do not know” were became missing data, but
unawareness of an intelligence indicator would not affect an indicator average if at least one
indicator had a 1-5 score. The missing data was simply not computed in the average.
Unawareness of an intelligence does not make it lower or higher.
Assessment of Model Fit
Chi-square estimates of fit should be reported; however, the estimates and significance of
them are rarely the sole statistics in applied research (Brown, 2015). Chi-square p-values may
not contribute much to an analysis when recommended confirmatory factor analysis sample sizes
are acquired. The American Psychological Association (APA) Board of Affairs officially
investigated validity problems associated with χ2 p-values (Byrne, 2001). A theoretical or
hypothetically based model should not have a statistically significant χ2 estimate of difference
from the estimate of a model with exact fit.
Amos reports a CMIN/d.f. when the fitted model is correct (IBM, 2015). CMIN/d.f.
alternative χ2 ratios from ≈2-5 have been cut-offs for acceptable models (Marsh & Hocevar,
1985; Wheaton, Muthen, Alwin, & Summers, 1977). During this analysis, values that
approximate two indicate a good fit.

FLUID AND CRYSTALLIZED G VS. M.I.: SEM OF HUMAN INTELLIGENCE 67
Bentler and Bonett (1980) developed the original, incremental, goodness-of-fit, normed
and non-normed fit index for covariance structure matrix analyses in response to the χ2 p-value
controversy. Bentler and Bonett (1980) state that models with incremental fit indexes >.90 tend
to be accepted. This criterion represents “traditional” or “acceptable” standards during this
analysis.
Numerous fit indices had been explicitly and implicitly proposed and modifications
introduced in the literature, and discrepancies have arisen between their exploratory and
confirmatory factor analysis applications (see Hu & Bentler, 1999). Jöreskog and Sörbom (1984)
incorporated another goodness of fit index, explicitly GFI, into software (as cited in IBM, 2015).
The Comparative Fit Index (CFI) is a normed incremental index. According to Bentler
(1990), the CFI does not underestimate fit whereas χ2 does.
The Tucker-Lewis index (TLI), or NNFI, is a non-normed incremental fit index (Bentler
& Bonnett, 1980; Tucker & Lewis, 1973). TLI takes complexity of models into account and is
biased towards samples >250 (Hu & Bentler, 1999). Hu and Bentler (1999) recommend a
combination of TLI of ≥.95 and SRMR >.10 as cutoff values.
Bollen’s (1989) Incremental Fit Index (IFI), or BL89, adjusts fit for sample size and d.f.
Bollen’s (1989) report noted that (N-1) *(IFI) produces a more valid χ2 estimate.
Hu and Bentler (1999) recommend a contemporary criterion of TLI, CFI, or IFI at
approximately ≥.95 and SRMR <.10 for good model fit. These criteria represent “contemporary”
standards for model fit in this analysis.
The Root Mean Square Error of Approximation (RMSEA) is an absolute approximation
of a model fit to the population. RMSEA also takes model complexity into account. RMSEA of 0
equals a perfect model fit. RMSEA ≤.06 indicates good model fit. RMSEA >.06 and <.10

FLUID AND CRYSTALLIZED G VS. M.I.: SEM OF HUMAN INTELLIGENCE 68
indicates a moderate fitting model. RMSEA >.10 indicates poor model fit, and the consensus is
that RMSEA >.10 should be rejected. Hu and Bentler (1999) recommend RMSEA <.05-.08 and
SRMR <.6-.11 for good-fit. RMSEA is accompanied with a confidence interval and p-value in
SPSS AMOS.
The Standardized Root Mean Square Residual (SRMR) is “a measure of the mean
absolute correlation residual, the overall difference between the observed and predicted
correlations” (Kline, 2011, p. 209). SRMR values range from 0-1 with smaller SRMR’s
indicating good fit. SRMR should be <.10 with sample sizes ≤500 (Hu & Bentler, 1999). The
SRMR is an important fit statistic that was not reported by Castejon et al. (2010).
Brown (2015) reviews more about what should be reported in a confirmatory factor
analysis, or SEM, study. The background section has detailed the hypothesized models. Figures
of these models with textual descriptions are provided. Standardized and unstandardized Lambda
(λ) coefficients lie on the paths in the figures and reported in the text.

FLUID AND CRYSTALLIZED G VS. M.I.: SEM OF HUMAN INTELLIGENCE 69
Results
Table 11: R.A.I.T. Raw Score Descriptive Statistics
N Minimum Maximum Mean s.d.
GK 287 1 35 17.87 7.260
NVA 287 15 45 32.38 5.889
SEQ 287 16 39 29.31 4.935
OWO 287 9 33 20.81 4.784
WO 287 7 36 21.35 4.908 Table 11: R.A.I.T. Raw Score Descriptive Statistics displays the raw scores for the sample with means and s.d.’s for
the General Knowledge, Nonverbal Analogies, Sequences, Odd Word Out, and Word Opposites subtests of the R.A.I.T. GK= General
Knowledge; NVA= Nonverbal Analogies; SEQ=Sequences; OWO=Odd Word Out; WO-Word Opposites
Table 11: R.A.I.T. Raw Score Descriptive Statistics displays the number of participants,
minimum and maximum correct responses, mean number of correct responses, and standard
deviation from the means.
Table 12: R.A.I.T. Standard Score Descriptive Statistics
N Minimum Maximum Mean s.d.
CII 287 61 132 97.87 14.552
FII 287 76 128 106.13 10.595
TII 287 71 131 101.46 12.746 Table 12: R.A.I.T. Standard Score Descriptive Statistics displays the adjusted intelligence scores derived from the raw scores based on ages 18,
19-20, and 21-29. The maximum age in this study was 25. CII=Crystallized Intelligence Index; FII=Fluid Intelligence Index; TII=Total
Intelligence Index
Table 12: R.A.I.T. Standard Score Descriptive Statistics displays the calculated
Crystallized Intelligence Index (CII), Fluid Intelligence Index (FII), and Total Intelligence Index
(TII) R.A.I.T. Standard Scores. Scores below seventy are significantly below average. Scores
between seventy and seventy-nine are moderately below average. Scores between eighty and
eighty-nine are below average. Scores between ninety and one-hundred nine are average. Scores

FLUID AND CRYSTALLIZED G VS. M.I.: SEM OF HUMAN INTELLIGENCE 70
between one-hundred ten and one-hundred nineteen are above average. Scores between one-
hundred twenty and one-hundred twenty-nine are moderately above average. Scores above one-
hundred twenty-nine are significantly above average (Reynolds, 2014).
Table 13: M.I.D.A.S. Raw Subscale Descriptive Statistics
N Min Max Mean s.d.
Expressive 287 1.38 5.00 3.3248 .82141
Rhetorical 287 1.00 5.00 3.3357 .92345
Read_Write 287 1.43 5.00 3.4374 .74612
Persuasion 287 1.20 5.00 3.5006 .85291
Sensitivity 287 1.20 5.00 3.3653 .78494
People 287 1.33 5.00 3.2521 .68814
Self_Know 287 1.00 5.00 3.6394 .97419
Calculations 287 1.33 5.00 3.6405 .79026
Spatial_PS 287 1.00 5.00 3.1098 .83894
Effectiveness 287 1.00 5.00 3.2456 1.00945
School_Math 287 1.25 5.00 3.4945 .94440
Logic_Games 287 1.00 4.67 2.7538 .90419
Everyday_Math 287 1.00 5.00 2.9591 .91647
Everyday_PS 287 1.00 5.00 3.3384 .83565
Spatial_Aware 287 1.00 4.83 2.8942 .90720
Art_Design 287 1.00 5.00 3.0008 .97704
Objects 287 1.00 5.00 3.2787 .92204
Appreciation 287 1.00 5.00 3.2692 .86427
Instrument 287 1.00 5.00 2.9111 .96930
Vocal 287 .00 5.00 2.6185 1.20019
Composer 287 1.00 5.00 3.0714 .99729
Athletic 287 1.00 5.00 2.9949 .99039
Dexterity 287 1.25 4.63 2.8218 .69790
Science 287 1.00 5.00 3.2161 .96162
Animals 287 1.00 5.00 2.6527 1.05119
Plant_Care 287 .00 5.00 2.4042 1.08166 Table 13: M.I.D.A.S. Raw Subscale Descriptive Statistics provides sample size (n=287),
Minimum, Maximum, Mean (M), and Standard Deviations (s.d.) of M.I.D.A.S. subscale raw scores.

FLUID AND CRYSTALLIZED G VS. M.I.: SEM OF HUMAN INTELLIGENCE 71
Table 13: M.I.D.A.S. Raw Subscale Descriptive Statistics provides sample size (n=287),
Minimum, Maximum, Mean (M), and Standard Deviations (s.d.) of M.I.D.A.S. subscale raw
scores. These were the scores used in the inferential analyses.
Table 14: M.I.D.A.S. Raw M.I. Descriptive Statistics
N Minimum Maximum Mean S.D.
Linguistic 287 1.58 4.96 3.3660 .72199
Interpersonal 287 1.58 4.82 3.3727 .66469
Intrapersonal 287 1.54 5.00 3.4088 .67676
Logical-Mathematical 287 1.57 4.65 3.1365 .69545
Spatial 287 1.33 4.67 3.0578 .73362
Musical 287 1.00 4.90 2.9675 .80562
Bodily-Kinesthetic 287 1.38 4.65 2.9093 .72228
Naturalistic 287 .89 4.69 2.7577 .82412 Table 14: M.I.D.A.S. Raw Subscale Descriptive Statistics provides sample size (n=287), Minimum,
Maximum, Mean (M), and Standard Deviations (s.d.) of M.I.D.A.S. scale raw scores.
Table 14: M.I.D.A.S. Raw M.I. Descriptive Statistics displays averaged M.I.D.A.S.
subscale scores. These scores were not used in any inferential analysis. The scores are
informative of the sample.
Table 15: M.I.D.A.S. OMS Scaled Score Descriptive Statistics
n Min Max M s.d.
Musical 287 4 95 50.66 18.797
Bodily-Kinesthetic 287 8 92 46.83 18.018
Logical 287 15 90 55.26 16.350
Spatial 287 5 90 50.33 18.066
Linguistic 287 16 99 59.59 17.629
Interpersonal 287 15 96 59.83 15.964
Intrapersonal 287 24 93 57.37 13.933
Naturalistic 287 2 97 48.80 19.979

FLUID AND CRYSTALLIZED G VS. M.I.: SEM OF HUMAN INTELLIGENCE 72
Appreciation 287 0 100 62.66 21.878
Instrumental 287 0 100 39.74 28.616
Vocal 287 0 100 43.43 26.346
Composer 287 0 100 38.90 26.156
Athletic 287 4 100 50.37 24.535
Dexterity 287 0 92 43.16 19.466
SchoolMath 287 0 100 64.23 25.648
LogicGames 287 0 94 49.10 21.002
EverydayMath 287 0 100 51.36 22.924
EverydayProblemSolving 287 0 100 61.46 20.286
SpatialAwareness 287 0 100 50.51 24.403
ArtisticDesign 287 0 100 50.55 25.104
Working W Objects 287 0 100 48.95 20.639
Expressive 287 4 100 56.50 20.423
Rhetorical 287 6 100 58.11 21.319
Reading Writing 287 19 100 68.08 19.684
Persuasion 287 8 100 61.90 19.575
Sensitivity 287 5 100 64.41 20.193
Working W People 287 0 100 53.99 21.505
Personal Knowledge 287 13 100 64.90 17.841
Calculations 287 5 100 54.68 22.553
Spatial Problem-Solving 287 0 100 53.37 22.513
Effectiveness 287 5 100 58.43 19.541
Science 287 0 100 56.68 24.409
Animal Care 287 0 100 42.57 26.489
Plant Care 287 0 100 43.92 23.518 Table 15: M.I.D.A.S. OMS Scaled Score Descriptive Statistics provides sample size (n=287),
Minimum, Maximum, Mean (M), and Standard Deviations (s.d.) of M.I.D.A.S. scaled scores.
All M.I.D.A.S. raw scores statistically significantly correlated (r) with M.I.D.A.S. O.M.S.
scaled scores (p<.001, two-tailed). M.I.D.A.S. Scaled Score Descriptive Statistics are provided
with Min., Max. and Mean Scores, and s.d. for the sample (Table 15).

FLUID AND CRYSTALLIZED G VS. M.I.: SEM OF HUMAN INTELLIGENCE 73
Table 16: R.A.I.T. Correlations w/Age, Grade, Gender
CII FII TII Age Grade
Gender
(F=1, M=2)
CII Pearson Correlation 1 .493** .942** -.268** -.280** .069
Sig. (2-tailed) .000 .000 .000 .000 .247
N 287 287 287 287 282 287
FII Pearson Correlation .493** 1 .755** -.131* -.109 .156**
Sig. (2-tailed) .000 .000 .027 .069 .008
N 287 287 287 287 282 287
TII Pearson Correlation .942** .755** 1 -.253** -.254** .112
Sig. (2-tailed) .000 .000 .000 .000 .057
N 287 287 287 287 282 287
Age Pearson Correlation -.268** -.131* -.253** 1 .863** .108
Sig. (2-tailed) .000 .027 .000 .000 .068
N 287 287 287 287 282 287
Grade Pearson Correlation -.280** -.109 -.254** .863** 1 .054
Sig. (2-tailed) .000 .069 .000 .000 .368
N 282 282 282 282 282 282
Gender Pearson Correlation .069 .156** .112 .108 .054 1
Sig. (2-tailed) .247 .008 .057 .068 .368
N 287 287 287 287 282 287 **. Correlation is significant at the 0.01 level (2-tailed).
*. Correlation is significant at the 0.05 level (2-tailed).
R.A.I.T. Crystallized Intelligence Index (CII), Fluid Intelligence Index (FII), and Total
Intelligence Index (TII) subscale scores statistically significantly correlated with one another
(p≤.01). CII scores statistically significantly negatively correlated with age and grade (p≤.01).
FII scores statistically significantly negatively correlated with age (p≤.05). FII scores statistically
significantly positively correlated with gender (p≤.01) while females were coded as 1 and males
as 2. TII scores statistically significantly negatively correlated with age and grade (p≤.01). Age
and grade statistically significantly positively correlated with each other (p≤.01).

FLUID AND CRYSTALLIZED G VS. M.I.: SEM OF HUMAN INTELLIGENCE 74
Table 17: M.I.D.A.S. Subscale Correlations with Age, Grade, and Gender
Age Grade Gender (F=1; M=2)
Age Pearson Correlation 1 .863** .108
Sig. (2-tailed) .000 .068
N 287 282 287
Grade Pearson Correlation .863** 1 .054
Sig. (2-tailed) .000 .368
N 282 282 282
Gender Pearson Correlation .108 .054 1
Sig. (2-tailed) .068 .368
N 287 282 287
Expressive Pearson Correlation .026 .019 -.042
Sig. (2-tailed) .664 .748 .477
N 287 282 287
Rhetorical Pearson Correlation -.005 .019 .064
Sig. (2-tailed) .932 .754 .278
N 287 282 287
Read_Write Pearson Correlation -.038 -.034 -.155**
Sig. (2-tailed) .517 .566 .008
N 287 282 287
Persuasion Pearson Correlation -.011 -.002 -.079
Sig. (2-tailed) .846 .971 .180
N 287 282 287
Sensitivity Pearson Correlation .062 .031 -.111
Sig. (2-tailed) .296 .604 .060
N 287 282 287
People Pearson Correlation .084 .073 -.052
Sig. (2-tailed) .154 .224 .381
N 287 282 287
Self_Know Pearson Correlation .030 .027 -.132*
Sig. (2-tailed) .614 .646 .025
N 287 282 287
Calculations Pearson Correlation -.002 .019 -.138*
Sig. (2-tailed) .975 .745 .020
N 287 282 287
Spatial_PS Pearson Correlation -.102 -.043 -.017
Sig. (2-tailed) .084 .475 .772
N 287 282 287
Effectiveness Pearson Correlation .059 .024 .021
Sig. (2-tailed) .322 .683 .720
N 287 282 287

FLUID AND CRYSTALLIZED G VS. M.I.: SEM OF HUMAN INTELLIGENCE 75
School_Math Pearson Correlation .077 .093 .256**
Sig. (2-tailed) .194 .121 .000
N 287 282 287
Logic_Games Pearson Correlation .038 .035 .087
Sig. (2-tailed) .519 .563 .142
N 287 282 287
Everyday_Math Pearson Correlation .123* .141* .211**
Sig. (2-tailed) .037 .018 .000
N 287 282 287
Everyday_PS Pearson Correlation .192** .175** .178**
Sig. (2-tailed) .001 .003 .003
N 287 282 287
Spatial_Aware Pearson Correlation .160** .157** .250**
Sig. (2-tailed) .007 .008 .000
N 287 282 287
Art_Design Pearson Correlation .065 .066 -.193**
Sig. (2-tailed) .270 .269 .001
N 287 282 287
Objects Pearson Correlation .060 .050 .208**
Sig. (2-tailed) .313 .403 .000
N 287 282 287
Appreciation Pearson Correlation -.212** -.184** -.076
Sig. (2-tailed) .000 .002 .199
N 287 282 287
Instrument Pearson Correlation -.210** -.223** -.147*
Sig. (2-tailed) .000 .000 .013
N 287 282 287
Vocal Pearson Correlation -.143* -.103 -.083
Sig. (2-tailed) .015 .084 .161
N 287 282 287
Composer Pearson Correlation -.159** -.155** -.001
Sig. (2-tailed) .007 .009 .986
N 287 282 287
Athletic Pearson Correlation -.065 -.083 .174**
Sig. (2-tailed) .275 .165 .003
N 287 282 287
Dexterity Pearson Correlation -.041 -.036 -.045
Sig. (2-tailed) .491 .544 .444
N 287 282 287
Science Pearson Correlation .207** .183** -.044
Sig. (2-tailed) .000 .002 .457
N 287 282 287

FLUID AND CRYSTALLIZED G VS. M.I.: SEM OF HUMAN INTELLIGENCE 76
Age and Grade statistically significantly positively correlated with each other (p≤.01).
Age is statistically significantly positively correlated with Everyday Math (p≤.05). Age is
statistically significantly positively correlated with Everyday Problem Solving (p≤.01). Age is
statistically significantly positively correlated with Spatial Awareness (p≤.01). Age is
statistically significantly positively correlated with Everyday Math (p≤.05). Age is statistically
significantly negatively correlated with Music Appreciation (p≤.01). Age is statistically
significantly negatively correlated with Instrument (p≤.01). Age is statistically significantly
negatively correlated with Vocal (p≤.05). Age is statistically significantly negatively correlated
with Music Composer (p≤.01). Age is statistically significantly positively correlated with
Science (p≤.01). Age is statistically significantly negatively correlated with Animals (p≤.05).
Age is statistically significantly positively correlated with Plant Care (p≤.01). Grade is
statistically significantly positively correlated with Everyday Math (p≤.05). Grade is statistically
significantly positively correlated with Everyday Problem Solving (p≤.01). Grade is statistically
significantly positively correlated with Spatial Awareness (p≤.01). Grade is statistically
significantly positively correlated with Everyday Math (p≤.05). Grade is statistically
significantly negatively correlated with Music Appreciation (p≤.01). Grade is statistically
significantly negatively correlated with Instrument (p≤.01). Grade is statistically significantly
Animals Pearson Correlation -.127* -.195** -.135*
Sig. (2-tailed) .031 .001 .022
N 287 282 287
Plant_Care Pearson Correlation .159** .088 -.002
Sig. (2-tailed) .007 .140 .979
N 287 282 287 **. Correlation is significant at the 0.01 level (2-tailed).
*. Correlation is significant at the 0.05 level (2-tailed).

FLUID AND CRYSTALLIZED G VS. M.I.: SEM OF HUMAN INTELLIGENCE 77
negatively correlated with Music Composer (p≤.01). Grade is statistically significantly positively
correlated with Science (p≤.01). Grade is statistically significantly negatively correlated with
Animals (p≤.01). Vocal, Plant Care, and Animals differed between significance for age and
grade.
Females self-reported significantly higher Self-Knowledge, Calculations, Instrument, and
Animals scores (p≤.05). Females self-reported significantly higher Reading/Writing and Art
Design scores (p≤.01). Males self-reported significantly higher School Math, Everyday Math,
Everyday Problem Solving, Spatial Awareness, Working with Objects, and Athletic scores
(p≤.01).
Table 18: M.I.D.A.S. Averaged Raw Scores to Intelligence
& Age, Grade, Gender Correlations
Age Grade Gender
Linguistic Pearson Correlation -.006 .003 -.042
Sig. (2-tailed) .923 .957 .479
N 287 282 287
Interpersonal Pearson Correlation .048 .036 -.096
Sig. (2-tailed) .413 .544 .106
N 287 282 287
Intrapersonal Pearson Correlation .000 .011 -.085
Sig. (2-tailed) .994 .849 .150
N 287 282 287
Logical Mathematical Pearson Correlation .137* .142* .238**
Sig. (2-tailed) .021 .017 .000
N 287 282 287
Spatial Pearson Correlation .120* .115 .105
Sig. (2-tailed) .043 .053 .077
N 287 282 287
Musical Pearson Correlation -.222** -.203** -.096
Sig. (2-tailed) .000 .001 .106

FLUID AND CRYSTALLIZED G VS. M.I.: SEM OF HUMAN INTELLIGENCE 78
N 287 282 287
Bodily Kinesthetic Pearson Correlation -.064 -.075 .097
Sig. (2-tailed) .279 .212 .100
N 287 282 287
Naturalistic Pearson Correlation .096 .027 -.075
Sig. (2-tailed) .106 .656 .203
N 287 282 287 **. Correlation is significant at the 0.01 level (2-tailed).
*. Correlation is significant at the 0.05 level (2-tailed).
Age statistically significantly positively correlates with self-reports of Logical-
Mathematical and Spatial Intelligence (p≤.05). Age statistically significantly negatively
correlates with self-reports of Musical Intelligence (p≤.01). Grade statistically significantly
positively correlates with self-reports of Logical-Mathematical Intelligence (p≤.05). Grade
statistically significantly negatively correlates with self-reports of Musical Intelligence (p≤.01).
Males statistically significantly self-report higher scores on Logical-Mathematical Intelligence
(p≤.01).

FLUID AND CRYSTALLIZED G VS. M.I.: SEM OF HUMAN INTELLIGENCE 79
Figure 1: Theory of Fluid and Crystallized Intelligence Factor Structural Model
(Unstandardized)
The total effect (combined direct and indirect effect) unstandardized regression estimates
for Crystallized General Knowledge, Odd Word Out, and Word Opposites are statistically
significant (λGK=1.00; λOWO=.71; λWO=.75; p<.001). The unstandardized regression estimates for
Fluid Nonverbal Analogies and Sequences are provided (λNVA=1.00; λSEQ=.62; p<.001). The
unstandardized covariance between CRYSTALLIZED and FLUID is significantly significant
(φ=19.18, p<.001, two-tailed; s.e.=2.552).

FLUID AND CRYSTALLIZED G VS. M.I.: SEM OF HUMAN INTELLIGENCE 80
Figure 2: Theory of Fluid and Crystallized Intelligence Factor Structural Model with
Standardized Correlation Coefficients
The standardized beta weights and correlations between Crystallized and General
Knowledge, Odd Word Out, and Word Opposites are provided (βGK=.77; βOWO=.83; βWO=.86).
The standardized beta weights and correlation estimates between Fluid and Nonverbal Analogies
and Sequences are provided (βNVA=.95; βSEQ=.70). The standardized covariance between
CRYSTALLIZED and FLUID is statistically significant (φstandardized=.61, p<.001, two-tailed).

FLUID AND CRYSTALLIZED G VS. M.I.: SEM OF HUMAN INTELLIGENCE 81
Figure 3: Fluid and Crystallized with Higher-Order g Factor Structural Model
(Standardized)
This second-order g hierarchical measurement model incorporates the higher-order g.
The fit statistics are equivalent to the first and second models. The unstandardized beta weights
and correlations between Crystallized and General Knowledge, Odd Word Out, and Word
Opposites are provided (βGK=.77; βOWO=.83; βWO=.86). The unstandardized beta weights and
correlation estimates between Fluid and Nonverbal Analogies and Sequences are provided
(βNVA=.95; βSEQ=.70). The unstandardized beta weights and correlation estimates between
Crystallized and g are provided (βCRYSATALLIZED=.78, p<.001, two-tailed). The unstandardized

FLUID AND CRYSTALLIZED G VS. M.I.: SEM OF HUMAN INTELLIGENCE 82
beta weights and correlation estimates between Fluid and g are provided (βFLUID=.79, p<.001,
two-tailed).
Table 19: Fluid and Crystallized Intelligence Model Fit
Indices
CMIN
Model NPAR CMIN DF P CMIN/DF
Default model 11 8.08 4 .09 2.02
Saturated model 15 .00 0
Independence model 5 676.68 10 .00 67.67
RMR, GFI
Model RMR GFI AGFI PGFI
Default model .71 .99 .96 .26
Saturated model .00 1.00
Independence model 13.46 .47 .20 .31
Baseline Comparisons
Model NFI
Delta1
RFI
rho1
IFI
Delta2
TLI
rho2 CFI
Default model .99 .97 .99 .98 .99
Saturated model 1.00 1.00 1.00
Independence model .00 .00 .00 .00 .00
RMSEA
Model RMSEA LO 90 HI 90 PCLOSE
Default model .06 .00 .12 .32
Independence model .48 .45 .51 .00
Table 19: Fluid and Crystallized Intelligence Model Fit Summary Output supplied by
SPSS AMOS. CMIN=χ2; GFI; IFI; TLI; CFI; RMSEA; RMSEA 90% C.I.
The theory of fluid and crystallized intelligence model shows good fit (χ2(4) =8.08,
p=.09; CMIN/d.f.=2.02; RMSEA= .06; GFI=.99; TLI= .98; CFI= .99; IFI=.99; SRMR=.02). The
chi-square p-value for departure of the data from the model is not significant at the .05 level
(p=.09). RMSEA’s p-value is not significant at the .05 level (pclosefit=.32). The “theory of fluid

FLUID AND CRYSTALLIZED G VS. M.I.: SEM OF HUMAN INTELLIGENCE 83
and crystallized intelligence” model unstandardized lambda (λ) and standardized beta (β)
regression parameter estimates factor loadings are displayed in the Figures. Hoelter’s statistic
was >200 (Hoelter=336, p≤.05; Hoelter=470, p≤.01). Eigenvalues were 3.1, 1.0, .4, .3, and .3.
Table 20: R.A.I.T. Sample
Correlations
SEQ NVA WO OWO GK
SEQ 1.00
NVA .67 1.00
WO .37 .48 1.00
OWO .40 .51 .71 1.00
GK .27 .44 .67 .63 1.00 Table 20: Sample Correlations (d.f.=4) displays
R.A.I.T. subtest correlations
Table:21 Sample correlations displays correlations between the R.A.I.T. subtests. Sample
correlations for the R.A.I.T. subtests are all statistically significant (p≤.01, two-tailed).
Table 21: Implied Correlations for the Population
FLUID CRYSTAL SEQ NVA WO OWO GK
FLUID 1.00
CRYSTAL .61 1.00
SEQ .70 .43 1.00
NVA .95 .58 .67 1.00
WO .53 .86 .37 .50 1.00
OWO .51 .83 .36 .48 .71 1.00
GK .47 .77 .33 .45 .66 .64 1.00 Table 21: Implied Correlations for the Population displays correlations for the population

FLUID AND CRYSTALLIZED G VS. M.I.: SEM OF HUMAN INTELLIGENCE 84
Tables 20 and 21 should be inspected for strong differences within subtests. Table 20
provides sample correlations while Table 21 provided implied correlations for the population. It
is seen that the correlations are not too distant from each other.
Table 22: Squared
Multiple Correlations
(R2)
Estimate
SEQ .49
NVA .90
WO .73
OWO .69
GK .60 Table 22: Squared Multiple
Correlations (R2) represent the
variance accounted for by the
subtests
Table 22: Squared Multiple Correlations (R2) displays sufficient R2 values. According to
Kline (2011), R2 should ≈.50 or more. Squared multiple correlations are the percentage of the
variance accounted for by the measure for the latent variable. It is estimated that the predictors of
SEQ explain 49.3 percent of its variance. In other words, the error variance of SEQ is
approximately 50.7 percent of the variance of SEQ itself. It is estimated that the predictors of
NVA explain 89.9 percent of its variance. In other words, the error variance of NVA is
approximately 10.1 percent of the variance of NVA itself. It is estimated that the predictors of
WO explain 73.5 percent of its variance. In other words, the error variance of WO is
approximately 26.5 percent of the variance of WO itself. It is estimated that the predictors of
OWO explain 69.2 percent of its variance. In other words, the error variance of OWO is
approximately 30.8 percent of the variance of OWO itself. It is estimated that the predictors of

FLUID AND CRYSTALLIZED G VS. M.I.: SEM OF HUMAN INTELLIGENCE 85
GK explain 59.8 percent of its variance. In other words, the error variance of GK is
approximately 40.2 percent of the variance of GK itself (IBM, 2015).
Table 23: Fluid and Crystallized Variances
Estimate S.E. C.R. P Label
CRYSTALLIZED 31.41 4.27 7.35 *** par_5
FLUID 31.08 4.08 7.62 *** par_6 Table 23: Fluid and Crystallized Variances are significant (p≤.001)
The variance estimate for CRYSTALLIZED is statistically significantly different from
zero (p≤0.001, two-tailed). The variance estimate for FLUID is statistically significantly
different from zero (p≤0.001, two-tailed) (Table 23).
Table 24: Factor Score Weights
SEQ NVA WO OWO GK
FLUID .14 .78 .04 .03 .02
CRYSTALLIZED .02 .10 .46 .39 .19 Table 24: Factor Score Weights based on factor loadings and r’s.
Table 24: Factor Score Weights displays the factor scores for each subscale on each latent
variable. Factor scores based on factor loadings and correlations contribute to evidence for
construct validity (Brown, 2015).
Table 25: Standardized Total
Effects
FLUID CRYSTALLIZED
SEQ .70 .00
NVA .95 .00

FLUID AND CRYSTALLIZED G VS. M.I.: SEM OF HUMAN INTELLIGENCE 86
FLUID CRYSTALLIZED
WO .00 .86
OWO .00 .83
GK .00 .77 Table 25: Standardized Total Effects shows
Direct and Indirect Effects of each subscale on
the latent variable.
Table 25: Standardized Total Effects shows Direct and Indirect Effects of each subscale
on the latent variable. Notes for group indicate a recursive model and the sample size (n=287).
The minimum for SPSS Amos to run the model with regression estimates was achieved. Model
fit summaries are provided. The ratio of χ2 to degrees of freedom for the theory of fluid and
crystallized intelligence model as measured by the Reynolds Adaptable Intelligence Test
indicates a good model fit that retains the null hypothesis, H0, that the model’s predicted
variance-covariance matrix resembles the samples variance covariance matrix.
The Factor Scores table displayed gives regression weights for predicting the unobserved
variables from the observed variables. The table is organized with a row for each unobserved
variable and a column for each observed variable. When the measured variable SEQ goes up by
1 unit, the predicted value for the latent variable FLUID goes up by 0.138 units. When the
measured variable NVA goes up by 1 unit, the predicted value for the latent variable FLUID
goes up by 0.784 units, and so on. When the measured variable WO goes up by 1 unit, the
predicted value for the latent variable CRYSTALLIZED goes up by 0.461 units. When the
measured variable OWO goes up by 1 unit, the predicted value for the latent variable
CRYSTALLIZED goes up by 0.395 units. When the measured variable GK goes up by 1 unit,
the predicted value for the latent variable CRYSTALLIZED goes up by 0.185 units (IBM, 2015).

FLUID AND CRYSTALLIZED G VS. M.I.: SEM OF HUMAN INTELLIGENCE 87
The standardized total (direct and indirect) effect of FLUID on SEQ is .702. That is, due
to both direct (unmediated) and indirect (mediated) effects of FLUID on SEQ, when FLUID
goes up by 1 standard deviation, SEQ goes up by 0.702 standard deviations. The standardized
total (direct and indirect) effect of FLUID on NVA is .948. That is, due to both direct
(unmediated) and indirect (mediated) effects of FLUID on NVA, when FLUID goes up by 1
standard deviation, NVA goes up by 0.948 standard deviations. The total (direct and indirect)
effect of CRYSTALLIZED on GK is 1.000. That is, due to both direct (unmediated) and indirect
(mediated) effects of CRYSTALLIZED on GK, when CRYSTALLIZED goes up by 1, GK goes
up by 1. The total (direct and indirect) effect of CRYSTALLIZED on OWO is .709. That is, due
to both direct (unmediated) and indirect (mediated) effects of CRYSTALLIZED on OWO, when
CRYSTALLIZED goes up by 1, OWO goes up by 0.709. The total (direct and indirect) effect of
CRYSTALLIZED on WO is .749. That is, due to both direct (unmediated) and indirect
(mediated) effects of CRYSTALLIZED on WO, when CRYSTALLIZED goes up by 1, WO
goes up by 0.749 (IBM, 2015).
Eigenvalues based on the correlation matrix were 3.1, 1.0, .4, .3, and .3. Kaiser’s criterion
is an eigenvalue ≥1.0. These values can be interpreted in two ways. First, the two-factor model
has two factors accounting for the greater proportions of the variance. Second, the greatest
eigenvalue accounts for the most variance and is g. The minimal values seem similar to Cattell’s
(1943) minor factors of motivation, self-regulation, and speed. The covariance between
CRYSTALLIZED and FLUID is statistically significant (p<.001, two-tailed).
For the Fluid and Crystallized to higher-order g-factor model, the fit indices are exactly
the same. The variance is statistically significant for g (p<.001, two-tailed).

FLUID AND CRYSTALLIZED G VS. M.I.: SEM OF HUMAN INTELLIGENCE 88
When g goes up by 1, Crystallized goes up by 1. This regression weight was fixed at
1.00, not estimated. When g goes up by 1, Fluid goes up by 1. This regression weight was fixed
at 1.00, not estimated. When g goes up by 1 standard deviation, Crystallized goes up by 0.78
standard deviations. When g goes up by 1 standard deviation, Fluid goes up by 0.79 standard
deviations.
Table 26: Standardized Regression
Weights
Estimate
Crystallized <--- G .78
Fluid <--- G .79
GK <--- Crystallized .77
OWO <--- Crystallized .83
WO <--- Crystallized .86
NVA <--- Fluid .95
SEQ <--- Fluid .70 Table 26: Standardized Regression Weights displays
correlations between subtests and latent variables
Additionally, age was collected as a continuous variable. Age was only somewhat related
to this analysis. The initial sample was criterion selected to be age 18-25 because the theory
states that fluid intelligence begins to taper off around age 25; however, age variance was a
statistically significant factor in the analysis including age (p<.001). According to investment
theory, fluid intelligence invests into crystallized intelligence, so crystallized intelligence should
at most minimally correlate positively with age and fluid intelligence should at most minimally
negatively with age. The analysis already reported that fluid and crystallized intelligence
statistically significantly negatively correlated with age (r= -.131; r= -.268, respectively). When
Age goes up by 1, Crystallized goes down by 0.66. When Age goes up by 1, Fluid goes down by

FLUID AND CRYSTALLIZED G VS. M.I.: SEM OF HUMAN INTELLIGENCE 89
0.57. When Age goes up by 1 standard deviation, Crystallized goes down by 0.24 standard
deviations. When Age goes up by 1 standard deviation, Fluid goes down by 0.22 standard
deviations. When Age goes up by 1, g goes down by 0.61. When Age goes up by 1 standard
deviation, g goes down by 1 standard deviations. The total effect (combined direct and indirect
effect) unstandardized regression weight estimates are statistically significant (p<.001).
Figure 4: Sole G-factor Structural Model Based on Intelligence Subtests (Unstandardized)

FLUID AND CRYSTALLIZED G VS. M.I.: SEM OF HUMAN INTELLIGENCE 90
Figure 5: Sole G-factor Structural Model Based on Intelligence Subtests (Standardized)
The indicators of intelligence to a g-factor, or general intelligence, model had poor fit
though the single SRMR fit statistic does not reject the model (SRMR=.0980). The theory of a
non-hierarchical g model does not show good fit (χ2(5) =109.59, p<.000; CMIN/d.f.=21.92;
RMSEA= .27; GFI= .88; TLI= .69; CFI= .84; IFI=.84; SRMR=.10). This model is worthy of
being analyzed because it contributes to existing human intelligence theory. Each of the
indicators is a valid measure of intelligence. Carroll (1993) identified these indicators as
individual factors of intelligence in his survey of intellectual reasoning studies; however,
according to this model fit, a moderating fluid and crystallized intelligence is needed.
The regression coefficient for NVA was fixed to one when identifying the model.
Nonverbal analogies alone are very commonly sufficed as a single measure of intelligence (Jung
& Haier, 2007). The total effect (combined direct and indirect effect) unstandardized regression
estimates for Crystallized General Knowledge, Odd Word Out, and Word Opposites are
statistically significant (λGK=1.49; λOWO=1.08; λWO=1.12; p<.001). The unstandardized

FLUID AND CRYSTALLIZED G VS. M.I.: SEM OF HUMAN INTELLIGENCE 91
regression estimates for Fluid Nonverbal Analogies and Sequences are provided (λNVA=1.00;
λSEQ=.66; p<.001).
After running the model, each unstandardized estimate is statistically significant while
crystallized indicators have higher loadings. When g goes up by 1, GK goes up by 1.49 (p≤.001).
When g goes up by 1, SEQ goes up by 0.66 (p≤.001). When g goes up by 1, OWO goes up by
1.08 (p≤.001). When g goes up by 1, WO goes up by 1.11 (p≤.001). It is seen here that the
crystallized indicators do better at discriminating intelligence in this data. It is seen now that a
latent crystallized factor and a latent fluid factor moderate a g-factor better than a perceiving g as
a single entity.
The eigenvalues of the sample correlation matrix were 3.1, 1.0, .4, .3, and .3. The model
yields the same eigenvalues as the first solution. There are two factors with eigenvalues ≥1.
Figure 6: G-factor Structural STCU Model Based on Fluid and Crystallized Intelligence
Subtests (Unstandardized)

FLUID AND CRYSTALLIZED G VS. M.I.: SEM OF HUMAN INTELLIGENCE 92
Figure 7: G-factor Structural STCU Based on Fluid and Crystallized Intelligence Subtests
(Standardized)
A single-trait correlated uniqueness (STCU) model was created based on the fluid and
crystallized intelligence model (Gignac, 2006). The model makes two inferences. First, fluid and
crystallized intelligence moderates g, and if it did not, then the previous model would have had
better fit. Second, contrary to Gignac’s (2006) findings, both fluid and crystallized abilities load
well, and approximately equally, on g. This inference is based on the factor loadings and squared
multiple correlations.
Table 27: Squared
Multiple Correlations
(R2)
Estimate
WO .44
OWO .50
SEQ .30
NVA .53
GK .35 Table 27: Squared Multiple
Correlations (R2) displays the
amounts of variance accounted for
by the subtests

FLUID AND CRYSTALLIZED G VS. M.I.: SEM OF HUMAN INTELLIGENCE 93
Figure 8: STMM Measurement Model Based on Fluid and Crystallized Intelligence
Subtests (Standardized)

FLUID AND CRYSTALLIZED G VS. M.I.: SEM OF HUMAN INTELLIGENCE 94
Figure 9: STMM Measurement Model Based on Fluid and Crystallized Intelligence
Subtests (Standardized)
Table 28: Fluid and Crystallized Intelligence STMM
Model Fit Indices
CMIN
Model NPAR CMIN DF P CMIN/DF
Default model 13 5.47 2 .06 2.73
Saturated model 15 .00 0
Independence model 5 676.68 10 .00 67.67
RMR, GFI
Model RMR GFI AGFI PGFI
Default model .53 .99 .94 .13
Saturated model .00 1.00
Independence model 13.46 .47 .20 .31

FLUID AND CRYSTALLIZED G VS. M.I.: SEM OF HUMAN INTELLIGENCE 95
Baseline Comparisons
Model NFI
Delta1
RFI
rho1
IFI
Delta2
TLI
rho2 CFI
Default model .99 .96 .99 .97 .99
Saturated model 1.00 1.00 1.00
Independence model .00 .00 .00 .00 .00
RMSEA
Model RMSEA LO 90 HI 90 PCLOSE
Default model .08 .00 .16 .20
Independence model .48 .45 .51 .00
Table 28: Fluid and Crystallized Intelligence STMM Model Fit Indices indicates
overall good fit. CMIN=χ2; GFI; IFI; TLI; CFI; RMSEA; RMSEA 90% C.I.
The single-trait g Correlated Uniqueness (STCU) between fluid subscales and
crystallized subscales and single-trait multimethod (STMM) fluid and crystallized nested models
yield the same fit statistics (Gignac, 2006). The two vs. three indicators for fluid intelligence
were set with regression weights of one for identification (Kenny, Kashy, & Bolger, 1998). The
Single g trait Correlated Uniqueness (STCU) and STMM with nested fluid and crystallized
factors, or theory of fluid and crystallized intelligence, model shows good fit (χ2(4) =5.47,
p=.065; CMIN/d.f.=2.73; RMSEA= .08 (LO=.00); TLI= .97; CFI= .99; IFI=.99; SRMR=.015).
Hoelter’s statistic was >200 (Hoelter=314, p≤.05; Hoelter=482, p≤.01).
Table 29: Squared Multiple Correlations (R2) for Fluid
and Crystallized, Fluid and Crystallized w/g, and g
Fluid &
Crystallized
Fluid &
Crystallized
w/g
g
SEQ .49 .62 .44
NVA .90 .75 .50
WO .73 .75 .30
OWO .69 .68 .53

FLUID AND CRYSTALLIZED G VS. M.I.: SEM OF HUMAN INTELLIGENCE 96
Fluid &
Crystallized
Fluid &
Crystallized
w/g
g
GK .60 .60 .35 Table 29: Squared Multiple Correlations (R2) for Fluid and Crystallized, Fluid
and Crystallized w/g, and g shows that
The squared multiple correlations between the models show that the fluid and crystallized
model reflects the greatest variances. Factor score weights show General Knowledge and Word
Opposites (WO) load higher on the Crystallized factor than g. Factor score weights show
Sequences (SEQ) load higher on the Fluid factor than g. Factor score weights show Odd Word
Out (OWO) load higher on g than the Crystallized factor. Factor score weights show Nonverbal
Analogies (NVA) load higher on g than the Fluid factor. This result contributes to the conclusion
that a multiple factor method is best for measuring intelligence differences. This result also
confirms why many researchers will rely solely on nonverbal analogies as an indicator of general
intelligence.

FLUID AND CRYSTALLIZED G VS. M.I.: SEM OF HUMAN INTELLIGENCE 97
Figure 10: Traditional M.I. Factor Measurement Model

FLUID AND CRYSTALLIZED G VS. M.I.: SEM OF HUMAN INTELLIGENCE 98
Figure 11: Traditional M.I. Factor Measurement Model

FLUID AND CRYSTALLIZED G VS. M.I.: SEM OF HUMAN INTELLIGENCE 99
Table 30: Traditional M.I. Theory Structural Model Fit
Indices
CMIN
Model NPAR CMIN DF P CMIN/DF
Default model 51 1441.45 300 .00 4.80
Saturated model 351 .00 0
Independence model 26 3525.37 325 .00 10.85
RMR, GFI
Model RMR GFI AGFI PGFI
Default model .17 .66 .60 .56
Saturated model .00 1.00
Independence model .21 .34 .29 .31
Baseline Comparisons
Model NFI
Delta1
RFI
rho1
IFI
Delta2
TLI
rho2 CFI
Default model .59 .56 .65 .61 .64
Saturated model 1.00 1.00 1.00
Independence model .00 .00 .00 .00 .00
RMSEA
Model RMSEA LO 90 HI 90 PCLOSE
Default model .12 .11 .12 .00
Independence model .19 .18 .19 .00
Table 30: M.I. Model Fit Indices indicate unacceptable fit. CMIN=χ2; GFI; IFI; TLI;
CFI; RMSEA; RMSEA 90% C.I.
The traditional Gardner theory of M.I. was tested. Amos was instructed to run the
analysis with the uncorrelated variables. The two Athletic and Dexterity indicators for Bodily-
Kinesthetic Intelligence were both set with regression weights of one as required for model
identification (Kenny, Kashy, & Bolger, 1998). The model was identified by Amos which
supplied the following output. The traditional theory of M.I.s model does not show overall good
fit (χ2(300) =1441.45, p<.001; CMIN/d.f.=4.80; RMSEA= .12 (LO (90% C.I.=11); GFI=.66;
TLI= .61; CFI= .64; IFI= .65; SRMR=.22). The model should be rejected. Only the CMIN/d.f.

FLUID AND CRYSTALLIZED G VS. M.I.: SEM OF HUMAN INTELLIGENCE 100
(CMIN/d.f.=4.80) meets a higher-end acceptable fit standard (CMIN/d.f.<5) previously
suggested by some (Marsh & Hocevar, 1985; Wheaton, Muthen, Alwin, & Summers, 1977), and
no other fit indices corroborate an acceptable fit. The sample correlations matrix shows many
correlated indicators that, according to theory, should not be correlated, e.g. linguistic indicator
variables and musical indicator variables. Fixing the error variances to correlate, as Gardner
stated that within intelligence observed endogenous variables often do correlate, did minimal to
the SRMR and did not affect other fit statistics at all. Hoelter values for generalizability were
<200 (Hoelter= 68, p≤.05; 72, p≤.01).
When LINGUISTIC goes up by 1, Expressive goes up by 1. This regression weight was
fixed at 1.00, not estimated. When LINGUISTIC goes up by 1, Rhetorical goes up by 0.88.
When LINGUISTIC goes up by 1, Read_Write goes up by 0.66. When INTERPERSONAL goes
up by 1, Persuasion goes up by 1. This regression weight was fixed at 1.00, not estimated. When
INTERPERSONAL goes up by 1, Sensitivity goes up by 1.1. When INTERPERSONAL goes up
by 1, People goes up by 0.65. When INTRAPERSONAL goes up by 1, Self_Know goes up by 1.
This regression weight was fixed at 1.00, not estimated. When INTRAPERSONAL goes up by 1,
Calculations goes up by 0.84. When INTRAPERSONAL goes up by 1, Spatial_PS goes up by
0.61. When LOGICALMATHEMATICAL goes up by 1, School_Math goes up by 1. This
regression weight was fixed at 1.00, not estimated. When LOGICALMATHEMATICAL goes up
by 1, Logic_Games goes up by 0.8. When LOGICALMATHEMATICAL goes up by 1,
Everyday_Math goes up by 1.28. When SPATIAL goes up by 1, Spatial_Aware goes up by 1.
This regression weight was fixed at 1.00, not estimated. When SPATIAL goes up by 1,
Art_Design goes up by 0.85. When SPATIAL goes up by 1, Objects goes up by 1.23. When
NATURALISTIC goes up by 1, Science goes up by 1. This regression weight was fixed at 1.00,

FLUID AND CRYSTALLIZED G VS. M.I.: SEM OF HUMAN INTELLIGENCE 101
not estimated. When NATURALISTIC goes up by 1, Animals goes up by 0.73. When
NATURALISTIC goes up by 1, Plant_Care goes up by 0.98. When INTRAPERSONAL goes up
by 1, Effectiveness goes up by 0.45. When LOGICALMATHEMATICAL goes up by 1,
Everyday_PS goes up by 0.7. When KINESTHETIC goes up by 1, Athletic goes up by 1. This
regression weight was fixed at 1.00, not estimated. When KINESTHETIC goes up by 1,
Dexterity goes up by 1. This regression weight was fixed at 1.00, not estimated. When
MUSICAL goes up by 1, Appreciation goes up by 1. This regression weight was fixed at 1.00,
not estimated. When MUSICAL goes up by 1, Instrument goes up by 0.95. When MUSICAL
goes up by 1, Vocal goes up by 1.14. When MUSICAL goes up by 1, Composer goes up by 1.1
(IBM, 2015). All λ estimates are statistically significant (p≤0.001 level, two-tailed).
Table 31: Squared Multiple Correlations (R2)
of the M.I.D.A.S. Subscales
Estimate
Composer .58
Vocal .43
Instrument .45
Appreciation .64
Dexterity .64
Athletic .32
Everyday_PS .30
Effectiveness .12
Plant_Care .49
Animals .29
Science .65
Objects .63
Art_Design .27
Spatial_Aware .43
Everyday_Math .83
Logic_Games .33
School_Math .47

FLUID AND CRYSTALLIZED G VS. M.I.: SEM OF HUMAN INTELLIGENCE 102
Estimate
Spatial_PS .33
Calculations .71
Self_Know .66
People .39
Sensitivity .86
Persuasion .60
Read_Write .48
Rhetorical .56
Expressive .91 Table 31: Squared Multiple Correlations (R2) of the indicators. R2 values
are between .12 and .91 for the indicators.
Squared multiple correlations, R2, explain the amount of variance drawn from the
indicators. R2 is a measure of indicator reliability for true score variance (Brown, 2015). R2
values for the indicators are between.12 and .91. Kline (2011) states that R2 should be
approximately .50 for each indicator. Athletic, Everyday Problem Solving, Effectiveness,
Animals, Art Design, Logic Games, Working with People, and Spatial Problem Solving have R2
values <.40, so eight of the twenty-six indicators do not explain much variance for their latent
variable.
Table 32: M.I. Sample Correlations
a b c d e f g h i j k l m n o p q r s t u v w x y z
Composer 1
Vocal .48 1
Instrument .49 .50 1
Appreciation .63 .50 .52 1
Dexterity .30 .30 .15 .26 1
Athletic .18 .03 .01 .16 .45 1
Everyday_PS .29 .17 .09 .15 .38 .10 1
Effectiveness .16 .07 -.02 .19 .28 .15 .23 1
Plant_Care .07 .06 -.01 .09 .18 .06 .41 .22 1
Animals .12 .14 .18 .17 .23 .11 .33 .01 .38 1
Science .18 .10 .05 .10 .26 .08 .58 .29 .56 .43 1
Objects .22 .09 .09 .13 .44 .24 .53 .23 .20 .19 .31 1
Art_Design .18 .17 .07 .14 .48 .09 .40 .32 .38 .31 .47 .41 1

FLUID AND CRYSTALLIZED G VS. M.I.: SEM OF HUMAN INTELLIGENCE 103
a b c d e f g h i j k l m n o p q r s t u v w x y z
Spatial_Aware .21 .11 .00 .11 .44 .26 .48 .27 .27 .15 .29 .52 .34 1
E-day_Math .13 .09 -.02 .09 .31 .19 .49 .22 .14 .06 .20 .46 .13 .45 1
Logic_Games .09 .10 -.01 .02 .29 .06 .46 .13 .22 .16 .27 .44 .30 .41 .50 1
School_Math .09 .06 -.12 -.01 .14 .09 .29 .03 .02 -.13 .16 .34 .07 .29 .64 .38 1
Spatial_PS .09 .14 -.01 .11 .27 .13 .22 .40 .09 .02 .17 .26 .19 .29 .25 .21 .12 1
Calculations .06 .15 .06 .10 .29 .23 .25 .26 .08 .13 .14 .20 .18 .29 .32 .15 .09 .47 1
Self_Know -.03 .10 -.01 .06 .21 .11 .23 .26 .12 .16 .15 .16 .15 .24 .30 .12 .06 .45 .70 1
People .10 .03 -.04 .07 .23 .16 .21 .19 .16 .07 .13 .19 .23 .28 .25 .23 .11 .25 .36 .25 1
Sensitivity .14 .11 .10 .10 .24 .06 .28 .28 .17 .23 .24 .18 .27 .29 .25 .20 .00 .33 .48 .39 .58 1
Persuasion .22 .18 .08 .14 .46 .21 .38 .35 .22 .24 .29 .31 .38 .39 .30 .23 .03 .42 .50 .43 .49 .72 1
Read_Write .25 .25 .24 .28 .30 .00 .36 .26 .22 .26 .29 .18 .28 .20 .17 .30 -.05 .20 .26 .21 .30 .37 .43 1
Rhetorical .14 .14 .03 .12 .39 .17 .38 .27 .16 .12 .15 .25 .23 .41 .30 .26 .09 .29 .32 .28 .42 .42 .60 .52 1
Expressive .30 .23 .15 .26 .41 .14 .44 .31 .20 .15 .30 .21 .26 .32 .24 .28 -.01 .28 .27 .23 .43 .48 .60 .66 .71 1
a. Composer b. Vocal c. Instrument d. Appreciation e. Dexterity f. Athletic g. Everyday_PS h. Effectiveness i. Plant_Care j. Animals k. Science l.
Objects m. Art_Design n. Spatial_Aware o. Everyday_Math p. Logic_Games q. School_Math r. Spatial_PS s. Calculations t. Self_Know u.
People v. Sensitivity w. Persuasion x. Read_Write y. Rhetorical z. Expressive
The traditional Gardner theory of M.I.s model has 86 parameters while the Fluid and
Crystallized intelligence model has 18. Box (1979) notes the benefits of parsimonious and
acceptable models. According to Box (1979), “all models are wrong but some are useful” (p.
202). Box (1979) notes that the scientific law of ideal gas where PV=nRT which incorporates
Boyle’s, Charles’, and Avogadro’s distinct laws. The law is a constant approximation (R in the
equation) of ideal gas behavior, but the scientific law is truly only an estimate, or acceptable fit.
The Eigenvalues provided were 7.3, 2.5, 2.2, 1.8, 1.4, 1.2, 1.0, .9, .8, .7, .6, .6, .6, .5, .5, .4, .4, .4,
.3, .3, .3, .3, .3, .2, .2, and .2. All variance estimates were statistically significant (p≤.001).

FLUID AND CRYSTALLIZED G VS. M.I.: SEM OF HUMAN INTELLIGENCE 104
Figure 12: Correlated M.I. Structural Model (Unstandardized)

FLUID AND CRYSTALLIZED G VS. M.I.: SEM OF HUMAN INTELLIGENCE 105
Figure 13: Correlated M.I. Structural Model (Standardized)

FLUID AND CRYSTALLIZED G VS. M.I.: SEM OF HUMAN INTELLIGENCE 106
Table 33: Correlated M.I. Model Fit Indices CMIN
Model NPAR CMIN DF P CMIN/DF
Default model 87 569.09 264 .00 2.16
Saturated model 351 .00 0
Independence model 26 3525.37 325 .00 10.85
RMR, GFI
Model RMR GFI AGFI PGFI
Default model .05 .86 .82 .65
Saturated model .00 1.00
Independence model .21 .34 .29 .31
Baseline Comparisons
Model NFI
Delta1
RFI
rho1
IFI
Delta2
TLI
rho2 CFI
Default model .84 .80 .91 .88 .90
Saturated model 1.00 1.00 1.00
Independence model .00 .00 .00 .00 .00
RMSEA
Model RMSEA LO 90 HI 90 PCLOSE
Default model .06 .06 .07 .00
Independence model .19 .18 .19 .00
Table 33: Correlated M.I. Model Fit Indices indicate acceptable fit according to some
traditional standards. CMIN=χ2; GFI; IFI; TLI; CFI; RMSEA; RMSEA 90% C.I.
A correlated M.I. model was tested. This model is similar to the model tested by Castejon
et. al (2010) that showed best fit and support for a MI theory with correlated intelligences. Only
the Dexterity indicator was set with a regression weight of one because of the correlations while
the Athletic indicator was not set with a regression weight. Initial modification indices indicated
that a better fit was calculable when the within intelligence measurement error terms were set to
correlate. A correlated theory of M.I.s model shows good fit according to some fit indices and
criterions (χ2(264) =569.09, p<.001; CMIN/d.f.=2.16; RMSEA= .06; TLI= .88; CFI= .90; IFI=
.91; SRMR=.06).

FLUID AND CRYSTALLIZED G VS. M.I.: SEM OF HUMAN INTELLIGENCE 107
Hu and Bentler (1999) recommend one combination of RMSEA ≤.06 and SRMR <.10
thus making this model an acceptably good fit. This model would not be rejected. The RMSEA
≤.06 and SRMR <.10 criterions led to the least amount of Type I and Type II errors in Hu and
Bentler’s (1999) cumulative fit index analysis.
According to original CFI and IFI standards, the model is a good fit. Bollen (1989), along
with the IFI and .90 criterion, noted that (N-1)*(IFI) produces a more valid χ2 estimate. Here,
(286)*(.91)= 260.26, so (χ2Bollen(264) =260.26, p>.05). There is good model fit based on the
Bollen (1989) adjusted χ2 goodness of fit test. For the original theory of M.I. model and Bollen’s
(1989) adjusted χ2 goodness of fit, (286)*(.65)= 185.9, so (χ2(300) =185.9, p<.001), and the
original theory of M.I. model still represents unacceptable fit. The reported Eigenvalues were 7.3
2.5 2.2 1.8 1.4 1.2 1.0 .9, .8 .7 .6 .6 .6 .5 .5 .4 .4 .4 .3 .3 .3 .3 .3 .2 .2, and .2. Hoelter values for
generalizability were <200 (Hoelter= 153, p≤.05; 162, p≤.01).
There does not seem to be an issue with singularity because no latent variable correlates
>.90, but Linguistic and Interpersonal factors had the second highest significant correlations
(r=.72), and Logical-Mathematical and Spatial factors had the highest significant correlations
(r=.88). Logical-Mathematical variance is low (var=.08, p=.02). Analysis of the Factor Score
Weights matrix shows that School Math equally loads on Logical-Mathematical, Spatial, and
Naturalistic. Everyday Math and Everyday Problem-Solving load higher on Spatial than Logical-
Mathematical.
Uncorrelated error indicators account for random measurement error of the latent
variable whereas allowing the indicator errors to correlate accounts for an additional latent
structure within the indicators (Brown, 2015). Gardner (1983) stated in his theory that M.I.
indicators often correlate but the intelligence themselves are distinct.

FLUID AND CRYSTALLIZED G VS. M.I.: SEM OF HUMAN INTELLIGENCE 108
Table 34: M.I. Correlations
Estimate
LINGUISTIC <--> INTERPERSONAL .72
LINGUISTIC <--> MUSICAL .36
LINGUISTIC <--> BODILYKINESTHETIC .46
LINGUISTIC <--> NATURALISTIC .36
INTERPERSONAL <--> SPATIAL .56
INTERPERSONAL <--> MUSICAL .23
INTERPERSONAL <--> BODILYKINESTHETIC .46
INTERPERSONAL <--> NATURALISTIC .37
MUSICAL <--> INTRAPERSONAL .17
BODILYKINESTHETIC <--> INTRAPERSONAL .41
NATURALISTIC <--> INTRAPERSONAL .29
MUSICAL <--> NATURALISTIC .20
BODILYKINESTHETIC <--> NATURALISTIC .32
LINGUISTIC <--> INTRAPERSONAL .49
INTERPERSONAL <--> INTRAPERSONAL .75
LINGUISTIC <--> SPATIAL .46
LINGUISTIC <--> LOGICALMATHEMATICAL .57
INTERPERSONAL <--> LOGICALMATHEMATICAL .49
SPATIAL <--> INTRAPERSONAL .54
SPATIAL <--> NATURALISTIC .61
NATURALISTIC <--> LOGICALMATHEMATICAL .71
BODILYKINESTHETIC <--> LOGICALMATHEMATICAL .46
MUSICAL <--> LOGICALMATHEMATICAL .27
SPATIAL <--> LOGICALMATHEMATICAL .88
MUSICAL <--> BODILYKINESTHETIC .35
SPATIAL <--> BODILYKINESTHETIC .68
SPATIAL <--> MUSICAL .29
LOGICALMATHEMATICAL <--> INTRAPERSONAL .46 Table 34: M.I. Correlations gives estimates of correlations among exogenous variables.
The estimated correlation between LINGUISTIC and INTERPERSONAL is large
(r=.72). The estimated correlation between LINGUISTIC and INTRAPERSONAL is moderate
(r=.36). The estimated correlation between LINGUISTIC and BODILYKINESTHETIC is

FLUID AND CRYSTALLIZED G VS. M.I.: SEM OF HUMAN INTELLIGENCE 109
somewhat large (r=.46). The estimated correlation between LINGUISTIC and NATURALISTIC
is moderate(r=.36). The estimated correlation between INTERPERSONAL and SPATIAL is
large (r=.56). The estimated correlation between INTERPERSONAL and MUSICAL is
small(r=.23). The estimated correlation between INTERPERSONAL and
BODILYKINESTHETIC is somewhat large(r=.46). The estimated correlation between
INTERPERSONAL and NATURALISTIC is moderate (r=.37). The estimated correlation
between MUSICAL and INTRAPERSONAL is small (r=.17). The estimated correlation
between BODILYKINESTHETIC and INTRAPERSONAL is moderate (r=.41). The estimated
correlation between NATURALISTIC and INTRAPERSONAL is somewhat moderate(r=.29).
The estimated correlation between MUSICAL and NATURALISTIC is small (r=.20). The
estimated correlation between BODILYKINESTHETIC and NATURALISTIC is moderate
(r=.32). The estimated correlation between LINGUISTIC and INTRAPERSONAL is somewhat
large (r=.49). The estimated correlation between INTERPERSONAL and INTRAPERSONAL is
large (r=.75). The estimated correlation between LINGUISTIC and SPATIAL is somewhat large
(r=.46). The estimated correlation between LINGUISTIC and LOGICALMATHEMATICAL is
large (r=.57). The estimated correlation between INTERPERSONAL and
LOGICALMATHEMATICAL is somewhat large (r=.49). The estimated correlation between
SPATIAL and INTRAPERSONAL is large (r=.54). The estimated correlation between
SPATIAL and NATURALISTIC is large (r=.61). The estimated correlation between
NATURALISTIC and LOGICALMATHEMATICAL is large (r=.71). The estimated correlation
between BODILYKINESTHETIC and LOGICALMATHEMATICAL is somewhat large
(r=.46). The estimated correlation between MUSICAL and LOGICALMATHEMATICAL is
somewhat moderate (r=.27). The estimated correlation between SPATIAL and

FLUID AND CRYSTALLIZED G VS. M.I.: SEM OF HUMAN INTELLIGENCE 110
LOGICALMATHEMATICAL is large (r=.88). The estimated correlation between MUSICAL
and BODILYKINESTHETIC is moderate (r=.35). The estimated correlation between SPATIAL
and BODILYKINESTHETIC is large (r=.68). The estimated correlation between SPATIAL and
MUSICAL is somewhat moderate (r=.29). The estimated correlation between
LOGICALMATHEMATICAL and INTRAPERSONAL is somewhat large (r=.46).
Table 35: M.I. Unstandardized Regression Weights
Estimate S.E. C.R. P Label
Rhetorical <--- LINGUISTIC .94 .06 15.34 *** par_8
Read_Write <--- LINGUISTIC .70 .05 13.89 *** par_9
Sensitivity <--- INTERPERSONAL .75 .05 14.41 *** par_10
Art_Design <--- SPATIAL .98 .12 8.28 *** par_11
Instrument <--- MUSICAL .88 .09 9.82 *** par_12
Athletic <--- BODILYKINESTHETIC .64 .12 5.32 *** par_13
Plant_Care <--- NATURALISTIC .88 .09 9.65 *** par_14
Dexterity <--- BODILYKINESTHETIC 1.00
Vocal <--- MUSICAL 1.09 .11 9.66 *** par_15
Objects <--- SPATIAL 1.07 .11 10.18 *** par_16
Spatial_Aware <--- SPATIAL 1.00
Everyday_PS <--- LOGICALMATHEMATICAL 2.47 .51 4.82 *** par_17
Everyday_Math <--- LOGICALMATHEMATICAL 1.72 .28 6.09 *** par_18
School_Math <--- LOGICALMATHEMATICAL 1.00
People <--- INTERPERSONAL .47 .05 8.83 *** par_19
Persuasion <--- INTERPERSONAL 1.00
Science <--- NATURALISTIC 1.00
Animals <--- NATURALISTIC .68 .09 7.72 *** par_20
Appreciation <--- MUSICAL 1.00
Composer <--- MUSICAL 1.12 .10 11.49 *** par_21
Logic_Games <--- LOGICALMATHEMATICAL 1.75 .35 4.97 *** par_22
Expressive <--- LINGUISTIC 1.00
Effectiveness <--- INTRAPERSONAL .72 .14 5.14 *** par_51
Spatial_PS <--- INTRAPERSONAL .87 .12 7.48 *** par_52
Calculations <--- INTRAPERSONAL .92 .08 11.63 *** par_53
Self_Know <--- INTRAPERSONAL 1.00
Table 34: M.I. Unstandardized Regression Weights for Maximum-likelihood Estimation. S.E. is the standard error of the regression weight.
Dividing the regression weight estimate by the estimate of its standard error gives the c.r. P is the probability the regression weight for the

FLUID AND CRYSTALLIZED G VS. M.I.: SEM OF HUMAN INTELLIGENCE 111
prediction is significantly different from zero at the 0.001 level (two-tailed). These statements are approximately correct for large samples under
suitable assumptions.
When LINGUISTIC goes up by 1, Rhetorical goes up by 0.94. When LINGUISTIC goes
up by 1, Read_Write goes up by 0.7. When INTERPERSONAL goes up by 1, Sensitivity goes
up by 0.75. When SPATIAL goes up by 1, Art_Design goes up by 0.98. When MUSICAL goes
up by 1, Instrument goes up by 0.88. When BODILYKINESTHETIC goes up by 1, Athletic goes
up by 0.64. When NATURALISTIC goes up by 1, Plant_Care goes up by 0.88. When
BODILYKINESTHETIC goes up by 1, Dexterity goes up by 1. This regression weight was fixed
at 1.00, not estimated. When MUSICAL goes up by 1, Vocal goes up by 1.09. When SPATIAL
goes up by 1, Objects goes up by 1.07. When SPATIAL goes up by 1, Spatial_Aware goes up by
1. This regression weight was fixed at 1.00, not estimated. When LOGICALMATHEMATICAL
goes up by 1, Everyday_PS goes up by 2.47. When LOGICALMATHEMATICAL goes up by 1,
Everyday_Math goes up by 1.72. When LOGICALMATHEMATICAL goes up by 1,
School_Math goes up by 1. This regression weight was fixed at 1.00, not estimated. When
INTERPERSONAL goes up by 1, People goes up by 0.47. When INTERPERSONAL goes up
by 1, Persuasion goes up by 1. This regression weight was fixed at 1.00, not estimated. When
NATURALISTIC goes up by 1, Science goes up by 1. This regression weight was fixed at 1.00,
not estimated. When NATURALISTIC goes up by 1, Animals goes up by 0.68. When
MUSICAL goes up by 1, Appreciation goes up by 1. This regression weight was fixed at 1.00,
not estimated. When MUSICAL goes up by 1, Composer goes up by 1.12. When
LOGICALMATHEMATICAL goes up by 1, Logic_Games goes up by 1.75. When
LINGUISTIC goes up by 1, Expressive goes up by 1. This regression weight was fixed at 1.00,
not estimated. When INTRAPERSONAL goes up by 1, Effectiveness goes up by 0.72. When

FLUID AND CRYSTALLIZED G VS. M.I.: SEM OF HUMAN INTELLIGENCE 112
INTRAPERSONAL goes up by 1, Spatial_PS goes up by 0.87. When INTRAPERSONAL goes
up by 1, Calculations goes up by 0.92. When INTRAPERSONAL goes up by 1, Self_Know goes
up by 1. This regression weight was fixed at 1.00, not estimated (IBM, 2015). The λ estimates
are statistically significant (p<.001, two-tailed).
Table 36: Squared Multiple
Correlations (R2)
Estimate
Composer .61
Vocal .40
Instrument .39
Appreciation .65
Dexterity 1.00
Athletic .20
Everyday_PS .74
Effectiveness .20
Plant_Care .44
Animals .28
Science .72
Objects .49
Art_Design .37
Spatial_Aware .44
Everyday_Math .30
Logic_Games .31
School_Math .09
Spatial_PS .41
Calculations .52
Self_Know .40
People .29
Sensitivity .58
Persuasion .87
Read_Write .50
Rhetorical .60
Expressive .85 Table 31: Squared Multiple Correlations
(R2) of the indicators. R2 values are
between .09 and 1.00 for the indicators.

FLUID AND CRYSTALLIZED G VS. M.I.: SEM OF HUMAN INTELLIGENCE 113
This model showed improvement for R2 values. It is estimated that the predictors of
Composer explain 61 percent of its variance. In other words, the error variance of Composer is
approximately 39 percent of the variance of Composer itself. It is estimated that the predictors of
Vocal explain 40 percent of its variance. In other words, the error variance of Vocal is
approximately 60 percent of the variance of Vocal itself. It is estimated that the predictors of
Instrument explain 39 percent of its variance. In other words, the error variance of Instrument is
approximately 61 percent of the variance of Instrument itself. It is estimated that the predictors of
Appreciation explain 65 percent of its variance. In other words, the error variance of
Appreciation is approximately 35 percent of the variance of Appreciation itself. It is estimated
that the predictors of Dexterity explain 100 percent of its variance. In other words, the error
variance of Dexterity is approximately 0 percent of the variance of Dexterity itself. It is
estimated that the predictors of Athletic explain 20 percent of its variance. In other words, the
error variance of Athletic is approximately 80 percent of the variance of Athletic itself. It is
estimated that the predictors of Everyday_PS explain 74 percent of its variance. In other words,
the error variance of Everyday_PS is approximately 26 percent of the variance of Everyday_PS
itself. It is estimated that the predictors of Effectiveness explain 20 percent of its variance. In
other words, the error variance of Effectiveness is approximately 80 percent of the variance of
Effectiveness itself. It is estimated that the predictors of Plant_Care explain 44 percent of its
variance. In other words, the error variance of Plant_Care is approximately 56 percent of the
variance of Plant_Care itself. It is estimated that the predictors of Animals explain 28 percent of
its variance. In other words, the error variance of Animals is approximately 72 percent of the
variance of Animals itself. It is estimated that the predictors of Science explain 72 percent of its

FLUID AND CRYSTALLIZED G VS. M.I.: SEM OF HUMAN INTELLIGENCE 114
variance. In other words, the error variance of Science is approximately 28 percent of the
variance of Science itself. It is estimated that the predictors of Objects explain 49 percent of its
variance. In other words, the error variance of Objects is approximately 51 percent of the
variance of Objects itself. It is estimated that the predictors of Art_Design explain 37 percent of
its variance. In other words, the error variance of Art_Design is approximately 63 percent of the
variance of Art_Design itself. It is estimated that the predictors of Spatial_Aware explain 44
percent of its variance. In other words, the error variance of Spatial_Aware is approximately 56
percent of the variance of Spatial_Aware itself. It is estimated that the predictors of
Everyday_Math explain 30 percent of its variance. In other words, the error variance of
Everyday_Math is approximately 70 percent of the variance of Everyday_Math itself. It is
estimated that the predictors of Logic_Games explain 31 percent of its variance. In other words,
the error variance of Logic_Games is approximately 69 percent of the variance of Logic_Games
itself. It is estimated that the predictors of School_Math explain 9 percent of its variance. In other
words, the error variance of School_Math is approximately 91 percent of the variance of
School_Math itself. It is estimated that the predictors of Spatial_PS explain 41 percent of its
variance. In other words, the error variance of Spatial_PS is approximately 59 percent of the
variance of Spatial_PS itself. It is estimated that the predictors of Calculations explain 52 percent
of its variance. In other words, the error variance of Calculations is approximately 48 percent of
the variance of Calculations itself. It is estimated that the predictors of Self_Know explain 40
percent of its variance. In other words, the error variance of Self_Know is approximately 60
percent of the variance of Self_Know itself. It is estimated that the predictors of People explain
29 percent of its variance. In other words, the error variance of People is approximately 71
percent of the variance of People itself. It is estimated that the predictors of Sensitivity explain

FLUID AND CRYSTALLIZED G VS. M.I.: SEM OF HUMAN INTELLIGENCE 115
58 percent of its variance. In other words, the error variance of Sensitivity is approximately 42
percent of the variance of Sensitivity itself. It is estimated that the predictors of Persuasion
explain 87 percent of its variance. In other words, the error variance of Persuasion is
approximately 13 percent of the variance of Persuasion itself. It is estimated that the predictors of
Read_Write explain 50 percent of its variance. In other words, the error variance of Read_Write
is approximately 50 percent of the variance of Read_Write itself. It is estimated that the
predictors of Rhetorical explain 60 percent of its variance. In other words, the error variance of
Rhetorical is approximately 40 percent of the variance of Rhetorical itself. It is estimated that the
predictors of Expressive explain 85 percent of its variance. In other words, the error variance of
Expressive is approximately 15 percent of the variance of Expressive itself (IBM, 2015).

FLUID AND CRYSTALLIZED G VS. M.I.: SEM OF HUMAN INTELLIGENCE 116
Figure 13: Correlated M.I. MTMM Model (Unstandardized)

FLUID AND CRYSTALLIZED G VS. M.I.: SEM OF HUMAN INTELLIGENCE 117
Figure 14: Correlated M.I. MTMM Model (Standardized)

FLUID AND CRYSTALLIZED G VS. M.I.: SEM OF HUMAN INTELLIGENCE 118
Table 37: Correlated MTMM M.I. Model Fit
Summary
CMIN
Model NPAR CMIN DF P CMIN/DF
Default model 98 497.75 253 .00 1.97
Saturated model 351 .00 0
Independence model 26 3525.37 325 .00 10.85
RMR, GFI
Model RMR GFI AGFI PGFI
Default model .05 .88 .83 .63
Saturated model .00 1.00
Independence model .21 .34 .29 .31
Baseline Comparisons
Model NFI
Delta1
RFI
rho1
IFI
Delta2
TLI
rho2 CFI
Default model .86 .82 .93 .90 .92
Saturated model 1.00 1.00 1.00
Independence model .00 .00 .00 .00 .00
RMSEA
Model RMSEA LO 90 HI 90 PCLOSE
Default model .06 .05 .07 .04
Independence model .19 .18 .19 .00
Table 37: Correlated M.I. MTMM Model Fit Indices indicate good fit according
to some traditional standards. CMIN=χ2; GFI; IFI; TLI; CFI; RMSEA;
RMSEA 90% C.I.
A correlated Multi-Trait Multimethod (MTMM) theory of M.I.s model shows good fit
according to some fit indices and criterions (χ2(253) =497.75, p<.001; CMIN/d.f.=1.97;
RMSEA= .06; TLI= .90; CFI= .92; IFI= .93; SRMR=.06). The model fits better than the
correlated model. Bollen (1989), along with the IFI and .90 criterion, noted that (N-1) *(IFI)
produces a more valid χ2 estimate. Here, (286) *(.93) = 265.98, so (χ2Bollen (253) =265.98, p>.05).
There is good model fit based on the Bollen (1989) adjusted χ2 goodness of fit test. Hoelter
values for generalizability were <200 but neared it (Hoelter= 168, p≤.05; 178, p≤.01).

FLUID AND CRYSTALLIZED G VS. M.I.: SEM OF HUMAN INTELLIGENCE 119
Hu and Bentler (1999) recommend one combination of RMSEA ≤.06 and SRMR <.10
thus making this model a good fit. This model would not be rejected. The RMSEA ≤.06 and
SRMR <.10 criterions led to the least amount of Type I and Type II errors in Hu and Bentler’s
(1999) cumulative fit index analysis. RMSEA (.06; pclosefit=.04; 90% lower C.I.=.05) and SRMR
(.06) indicate that the model should be kept.
Table 38: M.I. Correlated MTMM Unstandardized Regression Weights
Estimate S.E. C.R. P Label
Rhetorical <--- LINGUISTIC .91 .06 14.71 *** par_1
Read_Write <--- LINGUISTIC .69 .05 13.57 *** par_2
Sensitivity <--- INTERPERSONAL 2.14 .48 4.45 *** par_3
Art_Design <--- SPATIAL 1.01 .12 8.48 *** par_4
Instrument <--- MUSICAL .88 .09 9.83 *** par_5
Athletic <--- BODILYKINESTHETIC .65 .12 5.44 *** par_6
Plant_Care <--- NATURALISTIC 1.04 .11 9.12 *** par_7
Dexterity <--- BODILYKINESTHETIC 1.00
Vocal <--- MUSICAL 1.09 .11 9.68 *** par_8
Objects <--- SPATIAL .73 .16 4.71 *** par_9
Spatial_Aware <--- SPATIAL 1.00
Everyday_PS <--- LOGICALMATHEMATICAL 1.03 .21 4.89 *** par_10
Everyday_Math <--- LOGICALMATHEMATICAL .52 .23 2.25 .02 par_11
School_Math <--- LOGICALMATHEMATICAL 1.00
People <--- INTERPERSONAL 1.26 .27 4.71 *** par_12
Persuasion <--- INTERPERSONAL 1.00
Science <--- NATURALISTIC 1.00
Animals <--- NATURALISTIC .84 .11 7.57 *** par_13
Appreciation <--- MUSICAL 1.00
Composer <--- MUSICAL 1.13 .10 11.49 *** par_14
Logic_Games <--- LOGICALMATHEMATICAL .60 .24 2.49 .01 par_15
Expressive <--- LINGUISTIC 1.00
Effectiveness <--- INTRAPERSONAL .80 .14 5.54 *** par_42
Spatial_PS <--- INTRAPERSONAL .89 .12 7.59 *** par_43
Calculations <--- INTRAPERSONAL .94 .08 11.25 *** par_44
Self_Know <--- INTRAPERSONAL 1.00
Logic_Games <--- SPATIAL .52 .16 3.30 *** par_51
Everyday_Math <--- SPATIAL .54 .12 4.37 *** par_52

FLUID AND CRYSTALLIZED G VS. M.I.: SEM OF HUMAN INTELLIGENCE 120
Estimate S.E. C.R. P Label
Everyday_PS <--- NATURALISTIC .71 .11 6.71 *** par_53
Objects <--- LOGICALMATHEMATICAL .67 .24 2.81 .00 par_54
Persuasion <--- INTRAPERSONAL .48 .15 3.26 .00 par_56
Persuasion <--- LINGUISTIC .29 .06 4.57 *** par_57
Science <--- LOGICALMATHEMATICAL .42 .16 2.63 .01 par_64 Table 38: M.I. Correlated MTMM Unstandardized Regression Weights for Maximum-likelihood Estimation. S.E. is the standard error of the
regression weight. Dividing the regression weight estimate by the estimate of its standard error gives the c.r. P is the probability the regression
weight for the prediction is significantly different from zero at the 0.001 level (two-tailed). These statements are approximately correct for large
samples under suitable assumptions.
When LINGUISTIC goes up by 1, Rhetorical goes up by 0.91. When LINGUISTIC goes
up by 1, Read_Write goes up by 0.69. When INTERPERSONAL goes up by 1, Sensitivity goes
up by 2.14. When SPATIAL goes up by 1, Art_Design goes up by 1.01. When MUSICAL goes
up by 1, Instrument goes up by 0.88. When BODILYKINESTHETIC goes up by 1, Athletic goes
up by 0.65. When NATURALISTIC goes up by 1, Plant_Care goes up by 1.04. When
BODILYKINESTHETIC goes up by 1, Dexterity goes up by 1. This regression weight was fixed
at 1.00, not estimated. When MUSICAL goes up by 1, Vocal goes up by 1.09. When SPATIAL
goes up by 1, Objects goes up by 0.73. When SPATIAL goes up by 1, Spatial_Aware goes up by
1. This regression weight was fixed at 1.00, not estimated. When LOGICALMATHEMATICAL
goes up by 1, Everyday_PS goes up by 1.03. When LOGICALMATHEMATICAL goes up by 1,
Everyday_Math goes up by 0.52. When LOGICALMATHEMATICAL goes up by 1,
School_Math goes up by 1. This regression weight was fixed at 1.00, not estimated. When
INTERPERSONAL goes up by 1, People goes up by 1.26. When INTERPERSONAL goes up
by 1, Persuasion goes up by 1. This regression weight was fixed at 1.00, not estimated. When
NATURALISTIC goes up by 1, Science goes up by 1. This regression weight was fixed at 1.00,
not estimated. When NATURALISTIC goes up by 1, Animals goes up by 0.84. When
MUSICAL goes up by 1, Appreciation goes up by 1. This regression weight was fixed at 1.00,

FLUID AND CRYSTALLIZED G VS. M.I.: SEM OF HUMAN INTELLIGENCE 121
not estimated. When MUSICAL goes up by 1, Composer goes up by 1.13. When
LOGICALMATHEMATICAL goes up by 1, Logic_Games goes up by 0.6. When LINGUISTIC
goes up by 1, Expressive goes up by 1. This regression weight was fixed at 1.00, not estimated.
When INTRAPERSONAL goes up by 1, Effectiveness goes up by 0.8. When
INTRAPERSONAL goes up by 1, Spatial_PS goes up by 0.89. When INTRAPERSONAL goes
up by 1, Calculations goes up by 0.94. When INTRAPERSONAL goes up by 1, Self_Know goes
up by 1. This regression weight was fixed at 1.00, not estimated. When SPATIAL goes up by 1,
Logic_Games goes up by 0.52. When SPATIAL goes up by 1, Everyday_Math goes up by 0.54.
When NATURALISTIC goes up by 1, Everyday_PS goes up by 0.71. When
LOGICALMATHEMATICAL goes up by 1, Objects goes up by 0.67. When
INTRAPERSONAL goes up by 1, Persuasion goes up by 0.48. When LINGUISTIC goes up by
1, Persuasion goes up by 0.29. When LOGICALMATHEMATICAL goes up by 1, Science goes
up by 0.42 (IBM, 2015). Estimates are statistically significant (p≤.001) except for logical-
mathematical to logic games (p≤.01), everyday math (p≤.02), objects (p≤.01), and science
(p≤.01) and intrapersonal to persuasion (p≤.01).
Table 39: M.I. MTMM Correlations
Estimate
LINGUISTIC <--> INTERPERSONAL .58
LINGUISTIC <--> MUSICAL .36
LINGUISTIC <--> BODILYKINESTHETIC .46
LINGUISTIC <--> NATURALISTIC .40
INTERPERSONAL <--> SPATIAL .50
INTERPERSONAL <--> MUSICAL .17
INTERPERSONAL <--> BODILYKINESTHETIC .29
INTERPERSONAL <--> NATURALISTIC .35
MUSICAL <--> INTRAPERSONAL .20
BODILYKINESTHETIC <--> INTRAPERSONAL .48

FLUID AND CRYSTALLIZED G VS. M.I.: SEM OF HUMAN INTELLIGENCE 122
Estimate
NATURALISTIC <--> INTRAPERSONAL .32
LINGUISTIC <--> INTRAPERSONAL .50
INTERPERSONAL <--> INTRAPERSONAL .68
LINGUISTIC <--> SPATIAL .51
LINGUISTIC <--> LOGICALMATHEMATICAL .27
INTERPERSONAL <--> LOGICALMATHEMATICAL .09
SPATIAL <--> INTRAPERSONAL .65
SPATIAL <--> NATURALISTIC .59
NATURALISTIC <--> LOGICALMATHEMATICAL .02
BODILYKINESTHETIC <--> LOGICALMATHEMATICAL .30
MUSICAL <--> LOGICALMATHEMATICAL .16
SPATIAL <--> LOGICALMATHEMATICAL .60
MUSICAL <--> BODILYKINESTHETIC .36
SPATIAL <--> BODILYKINESTHETIC .71
SPATIAL <--> MUSICAL .28
LOGICALMATHEMATICAL <--> INTRAPERSONAL .24
BODILYKINESTHETIC <--> NATURALISTIC .30
MUSICAL <--> NATURALISTIC .21 Table 39: M.I. MTMM Correlations displays decreased correlations from allowing the indicators to load on similar
Intelligence.
The correlations between the intelligence have decreased due to allowing them to have
similar observed variables.

FLUID AND CRYSTALLIZED G VS. M.I.: SEM OF HUMAN INTELLIGENCE 123
Figure 15: Correlated M.I. Model (Unsatisfactory Indicators Removed) (Unstandardized)
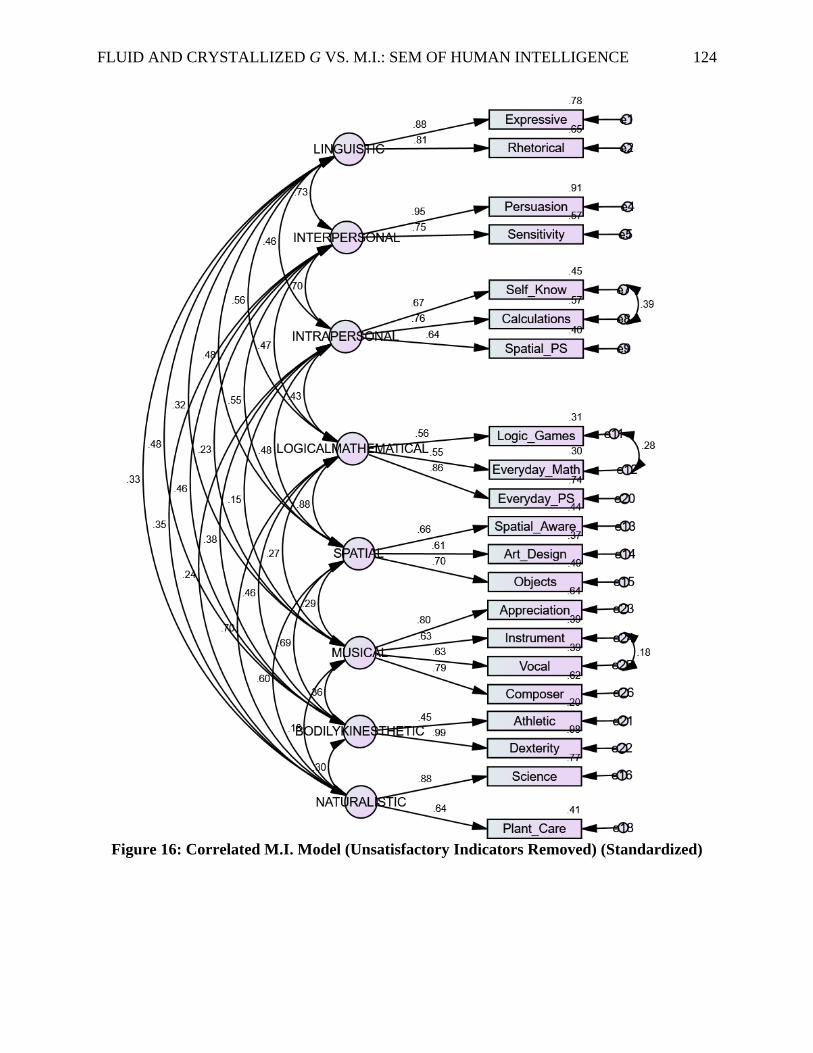
FLUID AND CRYSTALLIZED G VS. M.I.: SEM OF HUMAN INTELLIGENCE 124
Figure 16: Correlated M.I. Model (Unsatisfactory Indicators Removed) (Standardized)

FLUID AND CRYSTALLIZED G VS. M.I.: SEM OF HUMAN INTELLIGENCE 125
Table 40: Correlated M.I. Model Fit Summary
(Unsatisfactory Indicators Removed)
CMIN
Model NPAR CMIN DF P CMIN/DF
Default model 73 323.60 158 .00 2.05
Saturated model 231 .00 0
Independence model 21 2703.24 210 .00 12.87
RMR, GFI
Model RMR GFI AGFI PGFI
Default model .05 .90 .85 .62
Saturated model .00 1.00
Independence model .23 .37 .30 .33
Baseline Comparisons
Model NFI
Delta1
RFI
rho1
IFI
Delta2
TLI
rho2 CFI
Default model .88 .84 .93 .91 .93
Saturated model 1.00 1.00 1.00
Independence model .00 .00 .00 .00 .00
RMSEA
Model RMSEA LO 90 HI 90 PCLOSE
Default model .06 .05 .07 .03
Independence model .20 .20 .21 .00
Table 40: Correlated M.I. Model Fit Indices with poor loading indicators removed
indicates good fit according to some traditional standards. CMIN=χ2; GFI; IFI; TLI;
CFI; RMSEA; RMSEA 90% C.I.
A correlated theory of M.I.s model without Read_Write, Working w/People,
Effectiveness, School Math, and Animals indicators shows good fit according to some fit indices
and criterions (χ2(158) =323.60, p<.001; CMIN/d.f.=2.05; RMSEA= .06; GFI=.90; TLI= .91;
CFI= .93; IFI= .93; SRMR=.05). Hoelter values for generalizability were <200, but, again,
approached 200 (Hoelter= 167, p≤.05; 179, p≤.01). RMSEA (.06; pclosefit=.03; 90% lower
C.I.=.05) and SRMR (.06) indicate that the model should be kept.

FLUID AND CRYSTALLIZED G VS. M.I.: SEM OF HUMAN INTELLIGENCE 126
Table 41: Correlated M.I. Model Fit Summary (Unsatisfactory Indicators Removed)
Unstandardized Regression Weights
Estimate S.E. C.R. P Label
Rhetorical <--- LINGUISTIC 1.03 .08 13.38 *** par_1
Sensitivity <--- INTERPERSONAL .73 .05 13.91 *** par_2
Art_Design <--- SPATIAL .98 .12 8.24 *** par_3
Instrument <--- MUSICAL .88 .09 9.80 *** par_4
Athletic <--- BODILYKINESTHETIC .65 .12 5.46 *** par_5
Plant_Care <--- NATURALISTIC .82 .10 8.22 *** par_6
Dexterity <--- BODILYKINESTHETIC 1.00
Vocal <--- MUSICAL 1.09 .11 9.65 *** par_7
Objects <--- SPATIAL 1.08 .11 10.12 *** par_8
Spatial_Aware <--- SPATIAL 1.00
Everyday_PS <--- LOGICALMATHEMATICAL 1.44 .17 8.49 *** par_9
Everyday_Math <--- LOGICALMATHEMATICAL 1.00 .12 8.47 *** par_10
Persuasion <--- INTERPERSONAL 1.00
Science <--- NATURALISTIC 1.00
Appreciation <--- MUSICAL 1.00
Composer <--- MUSICAL 1.13 .10 11.42 *** par_11
Logic_Games <--- LOGICALMATHEMATICAL 1.00
Expressive <--- LINGUISTIC 1.00
Spatial_PS <--- INTRAPERSONAL .82 .11 7.20 *** par_40
Calculations <--- INTRAPERSONAL .92 .08 11.81 *** par_41
Self_Know <--- INTRAPERSONAL 1.00
Table 41: Correlated M.I. (Unsatisfactory Indicators Removed) Unstandardized Regression Weights for Maximum-likelihood Estimation. S.E. is
the standard error of the regression weight. Dividing the regression weight estimate by the estimate of its standard error gives the c.r. P is the
probability the regression weight for the prediction is significantly different from zero at the 0.001 level (two-tailed). These statements are
approximately correct for large samples under suitable assumptions.
When LINGUISTIC goes up by 1, Rhetorical goes up by 1.03. When
INTERPERSONAL goes up by 1, Sensitivity goes up by 0.73. When SPATIAL goes up by 1,
Art_Design goes up by 0.98. When MUSICAL goes up by 1, Instrument goes up by 0.88. When
BODILYKINESTHETIC goes up by 1, Athletic goes up by 0.65. When NATURALISTIC goes
up by 1, Plant_Care goes up by 0.82. When BODILYKINESTHETIC goes up by 1, Dexterity
goes up by 1. This regression weight was fixed at 1.00, not estimated. When MUSICAL goes up
by 1, Vocal goes up by 1.09. When SPATIAL goes up by 1, Objects goes up by 1.08. When

FLUID AND CRYSTALLIZED G VS. M.I.: SEM OF HUMAN INTELLIGENCE 127
SPATIAL goes up by 1, Spatial_Aware goes up by 1. This regression weight was fixed at 1.00,
not estimated. When LOGICALMATHEMATICAL goes up by 1, Everyday_PS goes up by
1.44. When LOGICALMATHEMATICAL goes up by 1, Everyday_Math goes up by 1. When
INTERPERSONAL goes up by 1, Persuasion goes up by 1. This regression weight was fixed at
1.00, not estimated. When NATURALISTIC goes up by 1, Science goes up by 1. This regression
weight was fixed at 1.00, not estimated. When MUSICAL goes up by 1, Appreciation goes up by
1. This regression weight was fixed at 1.00, not estimated. When MUSICAL goes up by 1,
Composer goes up by 1.13. When LOGICALMATHEMATICAL goes up by 1, Logic_Games
goes up by 1. This regression weight was fixed at 1.00, not estimated. When LINGUISTIC goes
up by 1, Expressive goes up by 1. This regression weight was fixed at 1.00, not estimated. When
INTRAPERSONAL goes up by 1, Spatial_PS goes up by 0.82. When INTRAPERSONAL goes
up by 1, Calculations goes up by 0.92. When INTRAPERSONAL goes up by 1, Self_Know goes
up by 1. This regression weight was fixed at 1.00, not estimated (IBM, 2015). All predicted λ
total effect regression weights are statistically significant (p<.001).

FLUID AND CRYSTALLIZED G VS. M.I.: SEM OF HUMAN INTELLIGENCE 128
Figure 17: M.I. to g Model (Unstandardized)

FLUID AND CRYSTALLIZED G VS. M.I.: SEM OF HUMAN INTELLIGENCE 129
Figure 18: M.I. to g Model (Standardized)

FLUID AND CRYSTALLIZED G VS. M.I.: SEM OF HUMAN INTELLIGENCE 130
Table 42: M.I. to g Model Fit Summary CMIN
Model NPAR CMIN DF P CMIN/DF
Default model 66 753.17 285 .00 2.64
Saturated model 351 .00 0
Independence model 26 3525.37 325 .00 10.85
RMR, GFI
Model RMR GFI AGFI PGFI
Default model .07 .83 .79 .67
Saturated model .00 1.00
Independence model .21 .34 .29 .31
Baseline Comparisons
Model NFI
Delta1
RFI
rho1
IFI
Delta2
TLI
rho2 CFI
Default model .79 .76 .86 .83 .85
Saturated model 1.00 1.00 1.00
Independence model .00 .00 .00 .00 .00
RMSEA
Model RMSEA LO 90 HI 90 PCLOSE
Default model .08 .07 .08 .00
Independence model .19 .18 .19 .00
Table 42: Correlated M.I. Model Fit Indices with poor loading indicators removed
indicates good fit according to some traditional standards. CMIN=χ2; GFI; IFI; TLI;
CFI; RMSEA; RMSEA 90% C.I.
A M.I. theory to g model shows unacceptable fit (χ2(285) =753.17, p<.001;
CMIN/d.f.=2.64; RMSEA= .08; TLI= .83; CFI= .85; IFI= .86; SRMR=.08). Hoelter values for
generalizability were <200 (Hoelter= 124, p≤.05; 131, p≤.01). The Eigenvalues were 7.3 2.5 2.2
1.8 1.4 1.2 1.0 .9 .8 .7 .6 .6 .6 .5 .5 .4 .4 .4 .3 .3 .3 .3 .3 .2 .2 and .2. The variance estimate for g is
statistically significant (p≤.001 level). This model was rejected by Almeida et al. (2010) and
Castejon et al. (2010). Almeida et al.’s (2010) general factor and multiple intelligence factor
model was supported, and there was a statistically significant correlation between the traditional
and M.I. factor. The model was replicated here and the fit was unacceptable. The model did

FLUID AND CRYSTALLIZED G VS. M.I.: SEM OF HUMAN INTELLIGENCE 131
show a statistically significant correlation between the two general factors (φ=.661, p≤.01; r=.21)
(Table 42).
Table 43: Fluid and Crystallized g Factor & M.I. g
Factor Covariance
Estimate S.E. C.R. P Label
F.C.g <--> M.I.g .661 .221 2.997 .003 par_29
Table 43: Fluid and Crystallized g Factor & M.I. g Factor Covariance for the model.
The model had unacceptable fit, but the factors did statistically significantly
Correlate.

FLUID AND CRYSTALLIZED G VS. M.I.: SEM OF HUMAN INTELLIGENCE 132
Figure 19: Two-Intelligence Factors w/Musical and Bodily Kinesthetic Talent Factors M.I.
Model (Unstandardized)

FLUID AND CRYSTALLIZED G VS. M.I.: SEM OF HUMAN INTELLIGENCE 133
Figure 20: Two-Intelligence Factors w/Musical and Bodily Kinesthetic Talent Factors M.I.
Model (Standardized)

FLUID AND CRYSTALLIZED G VS. M.I.: SEM OF HUMAN INTELLIGENCE 134
Table 44: Two-Intelligence Factors w/Musical and
Bodily Kinesthetic Talent Factors M.I. Model Fit
Summary
CMIN
Model NPAR CMIN DF P CMIN/DF
Default model 84 526.32 267 .00 1.97
Saturated model 351 .00 0
Independence model 26 3525.37 325 .00 10.85
RMR, GFI
Model RMR GFI AGFI PGFI
Default model .05 .88 .84 .67
Saturated model .00 1.00
Independence model .21 .34 .29 .31
Baseline Comparisons
Model NFI
Delta1
RFI
rho1
IFI
Delta2
TLI
rho2 CFI
Default model .85 .82 .92 .90 .92
Saturated model 1.00 1.00 1.00
Independence model .00 .00 .00 .00 .00
RMSEA
Model RMSEA LO 90 HI 90 PCLOSE
Default model .06 .05 .07 .03
Independence model .19 .18 .19 .00
Table 44: Two-Intelligence Factors w/Musical and Bodily Kinesthetic Talent Nested
Factors M.I. Model Fit indicates good fit according to some traditional standards.
CMIN=χ2; GFI; IFI; TLI; CFI; RMSEA; RMSEA 90% C.I.
A Two-Intelligence Factors w/Musical and Bodily Kinesthetic Talent Factors Nested M.I.
Model shows good fit (χ2(267) =526.32, p<.001; CMIN/d.f.=1.97; RMSEA= .06; TLI= .90;
CFI= .92; IFI= .92; SRMR=.06). Hoelter values for generalizability were <200 (Hoelter= 167,
p≤.05; 176, p≤.01). The RMSEA p-value increased (p=.03).
Additionally, a hierarchical model with two distinct intelligence higher-order to M.I. with
Bodily-Kinesthetic and Musical with Linguistic and the personal intelligence was tested. This
model is similar to Castejon et. al’s (2010) third good-fitting model and Almeida et al.’s (2010)
FLUID AND CRYSTALLIZED G VS. M.I.: SEM OF HUMAN INTELLIGENCE 135
model showing more support for dual intelligences over a single general intelligence. Linguistic,
Musical, Interpersonal, Intrapersonal, and Kinesthetic were set to load on Intelligence A. Spatial,
Logical-Mathematical, and Naturalistic intelligence were set to load on Intelligence B.
Intelligence A and B were set to correlate.
The dual theory of intelligences nested on the traditional theory of M.I. model did not
show acceptable fit with SRMR=.0720 and RMSEA=.07, LO 90% C.I.=.06, and this model was
omitted from presentation. A similar model was constructed based on entire Gardner (1983)
M.I. theory and measurement and broad and narrow intelligence factor research (Carroll, 1993;
McGrew, 2009) where bodily-kinesthetic and musical intelligence are broader and narrower
factors correlated with similar fluid and crystallized factors found within M.I. theory. The model
shows good fit according to some fit indices and criterions (χ2(267) =526.320, p<.001;
CMIN/d.f.=1.97; RMSEA= .06; TLI= .90; CFI= .92; IFI= .92; SRMR=.0621). The total effect
(combined direct and indirect effect) unstandardized regression weights are statistically
significant (p≤.001) except for Intelligence_B to Animals (p<.01).

FLUID AND CRYSTALLIZED G VS. M.I.: SEM OF HUMAN INTELLIGENCE 136
Figure 21: Two-Intelligence Factors M.I. Model (Unstandardized)

FLUID AND CRYSTALLIZED G VS. M.I.: SEM OF HUMAN INTELLIGENCE 137
Figure 22: Two-Intelligence Factors M.I. Model (Standardized)

FLUID AND CRYSTALLIZED G VS. M.I.: SEM OF HUMAN INTELLIGENCE 138
Table 45: Two-Intelligence Factors M.I. Model Fit CMIN
Model NPAR CMIN DF P CMIN/DF
Default model 68 301.11 142 .00 2.12
Saturated model 210 .00 0
Independence model 20 2700.20 190 .00 14.21
RMR, GFI
Model RMR GFI AGFI PGFI
Default model .05 .91 .86 .61
Saturated model .00 1.00
Independence model .24 .34 .27 .31
Baseline Comparisons
Model NFI
Delta1
RFI
rho1
IFI
Delta2
TLI
rho2 CFI
Default model .89 .85 .94 .92 .94
Saturated model 1.00 1.00 1.00
Independence model .00 .00 .00 .00 .00
RMSEA
Model RMSEA LO 90 HI 90 PCLOSE
Default model .06 .05 .07 .02
Independence model .21 .21 .22 .00
Table 45: Two-Intelligence Factors M.I. Model Fit indicates good fit according to
some traditional standards. CMIN=χ2; GFI; IFI; TLI; CFI; RMSEA; RMSEA 90% C.I.
A Bi-Factors Nested M.I. Model shows good fit (χ2(267) =526.32, p<.001;
CMIN/d.f.=2.12; RMSEA= .06; GFI=.91; TLI= .92; CFI= .94; IFI= .94; SRMR=.06). Hoelter
values for generalizability were <200 (Hoelter= 163, p≤.05; 175, p≤.01). This model fits than a
model with assumed talent factors. The RMSEA p-value increased (p=.02).

FLUID AND CRYSTALLIZED G VS. M.I.: SEM OF HUMAN INTELLIGENCE 139
Table 46: Two-Intelligence Factors M.I.
Squared Multiple Correlations (R2)
Estimate
INTRAPERSONAL .61
LOGICALMATHEMATICAL .02
NATURALISTIC .63
SPATIAL .88
INTERPERSONAL .60
LINGUISTIC .55
Logic_Games .42
School_Math .84
Everyday_Math .65
Everyday_PS .81
Effectiveness .23
Plant_Care .24
Animals .20
Science .45
Objects .48
Art_Design .26
Spatial_Aware .53
Spatial_PS .42
Calculations .48
Self_Know .39
People .40
Sensitivity .83
Persuasion .71
Read_Write .49
Rhetorical .60
Expressive .85 Table 46: Squared Multiple Correlations (R2) of the indicators for
Two Intelligence Factor M.I. (R2) of the indicators. R2 values are
between .02 and .88 for the intelligences and indicators.
Table 47: Squared Multiple Correlations (R2) of the indicators for Two Intelligence
Factor M.I. (R2) of the indicators. R2 values are between .02 and .88 for the intelligences and
indicators. The lowest R2 values are for Logical-Mathematical because its indicators are better
loaded on Spatial which the combination would be analogous to a fluid factor.

FLUID AND CRYSTALLIZED G VS. M.I.: SEM OF HUMAN INTELLIGENCE 140
Figure 23: Two-Intelligence M.I. & R.A.I.T. Structural Model (Unstandardized)

FLUID AND CRYSTALLIZED G VS. M.I.: SEM OF HUMAN INTELLIGENCE 141
Figure 24: Two-Intelligence M.I. & R.A.I.T. Structural Model (Standardized)

FLUID AND CRYSTALLIZED G VS. M.I.: SEM OF HUMAN INTELLIGENCE 142
Table 47: Two-Intelligence M.I. & R.A.I.T. Structural
Model Fit CMIN
Model NPAR CMIN DF P CMIN/DF
Default model 112 607.32 294 .00 2.07
Saturated model 406 .00 0
Independence model 28 3830.91 378 .00 10.13
RMR, GFI
Model RMR GFI AGFI PGFI
Default model .63 .87 .82 .63
Saturated model .00 1.00
Independence model 3.81 .34 .29 .32
Baseline Comparisons
Model NFI
Delta1
RFI
rho1
IFI
Delta2
TLI
rho2 CFI
Default model .84 .80 .91 .88 .91
Saturated model 1.00 1.00 1.00
Independence model .00 .00 .00 .00 .00
RMSEA
Model RMSEA LO 90 HI 90 PCLOSE
Default model .06 .05 .07 .00
Independence model .18 .17 .18 .00
Table 47: Two-Intelligence M.I. and R.A.I.T. Structural Model Fit
CMIN=χ2; GFI; IFI; TLI; CFI; RMSEA; RMSEA 90% C.I.
A Two-Intelligence Two-Intelligence M.I. & R.A.I.T. Structural Model shows good fit
(χ2(294) =607.32, p<.001; CMIN/d.f.=2.07; RMSEA= .06; TLI= .88; CFI= .91; IFI= .91;
SRMR=.07). Hoelter values for generalizability were <200 (Hoelter= 158, p≤.05; 167, p≤.01).

FLUID AND CRYSTALLIZED G VS. M.I.: SEM OF HUMAN INTELLIGENCE 143
Figure 25: Two-Intelligence M.I. & R.A.I.T. Structural Model (Unstandardized)

FLUID AND CRYSTALLIZED G VS. M.I.: SEM OF HUMAN INTELLIGENCE 144
Figure 26: Two-Intelligence M.I. & R.A.I.T. Structural Model (Standardized)

FLUID AND CRYSTALLIZED G VS. M.I.: SEM OF HUMAN INTELLIGENCE 145
The fit indices for this model were exactly the same as the last model. This model reveals
that bodily-kinesthetic intelligence and musical intelligence are distinct. Fluid intelligence seems
to be more precisely self-reported than crystallized intelligence when these intelligences are
conceptualized as grouped M.I.s. A Two-Intelligence M.I. and R.A.I.T. model shows good fit
(χ2(294) =607.32, p<.001; CMIN/d.f.=2.07; RMSEA= .06; TLI= .88; CFI= .91; IFI= .91;
SRMR=.07). Hoelter values for generalizability were <200 (Hoelter= 158, p≤.05; 167, p≤.01).

FLUID AND CRYSTALLIZED G VS. M.I.: SEM OF HUMAN INTELLIGENCE 146
Figure 27: M.I. Indicator & R.A.I.T. TII to g Structural Correlated Uniqueness (SCU)
Model (Unstandardized)

FLUID AND CRYSTALLIZED G VS. M.I.: SEM OF HUMAN INTELLIGENCE 147
Figure 28: M.I. Indicator & R.A.I.T. TII to g Structural Correlated Uniqueness (SCU)
Model (Standardized)

FLUID AND CRYSTALLIZED G VS. M.I.: SEM OF HUMAN INTELLIGENCE 148
Table 48: M.I. Indicator & R.A.I.T. TII to g Structural
Correlated Uniqueness (SCU) Model Fit
CMIN
Model NPAR CMIN DF P CMIN/DF
Default model 258 247.56 120 .00 2.06
Saturated model 378 .00 0
Independence model 27 3630.75 351 .00 10.34
RMR, GFI
Model RMR GFI AGFI PGFI
Default model .09 .94 .81 .30
Saturated model .00 1.00
Independence model .48 .34 .29 .32
Baseline Comparisons
Model NFI
Delta1
RFI
rho1
IFI
Delta2
TLI
rho2 CFI
Default model .93 .80 .96 .89 .96
Saturated model 1.00 1.00 1.00
Independence model .00 .00 .00 .00 .00
RMSEA
Model RMSEA LO 90 HI 90 PCLOSE
Default model .06 .05 .07 .05
Independence model .18 .18 .19 .00
Table 48: M.I. Indicator and R.A.I.T. TII to g Structural Correlated Uniqueness Model
Fit. CMIN=χ2; GFI; IFI; TLI; CFI; RMSEA; RMSEA 90% C.I.
A M.I. Indicator & R.A.I.T. TII to g Structural Correlated Uniqueness (SCU) Model
shows good fit (χ2(120) =247.56, p<.001; CMIN/d.f.=2.06; RMSEA= .06; TLI= .89; GFI=.94;
CFI= .96; IFI= .96; SRMR=.10). Hoelter values for generalizability were <200 though near
reaching (Hoelter= 170, p≤.05; 184, p≤.01). The RMSEA p-value increased to indicate good fit
(p≥.05). None of set to correlate error terms had a negative covariance.

FLUID AND CRYSTALLIZED G VS. M.I.: SEM OF HUMAN INTELLIGENCE 149
Table 49: M.I. Indicator & R.A.I.T. TII to g Structural
Correlated Uniqueness (SCU) Model Unstandardized
Regression Weights
Estimate S.E. C.R. P Label
g <--- TII .01 .00 2.68 .01 par_26
Expressive <--- g 1.00
Rhetorical <--- g 1.04 .34 3.02 .00 par_1
Read_Write <--- g 1.89 .57 3.32 *** par_2
Persuasion <--- g .39 .34 1.13 .26 par_3
Sensitivity <--- g -.06 .38 -.15 .88 par_4
People <--- g -.15 .36 -.42 .67 par_5
Self_Know <--- g .10 .47 .21 .84 par_6
Calculations <--- g -.18 .40 -.46 .64 par_7
Spatial_PS <--- g .57 .42 1.37 .17 par_8
Effectiveness <--- g -1.10 .71 -1.55 .12 par_9
School_Math <--- g .90 .57 1.58 .11 par_10
Logic_Games <--- g 2.32 .91 2.54 .01 par_11
Everyday_Math <--- g .86 .53 1.63 .10 par_12
Everyday_PS <--- g 1.49 .61 2.43 .01 par_13
Spatial_Aware <--- g .62 .43 1.44 .15 par_14
Art_Design <--- g .72 .52 1.39 .16 par_15
Objects <--- g 1.69 .76 2.22 .03 par_16
Appreciation <--- g .71 .47 1.50 .13 par_17
Instrument <--- g 1.59 .73 2.17 .03 par_18
Vocal <--- g 1.83 .86 2.13 .03 par_19
Composer <--- g 1.21 .61 1.97 .05 par_20
Athletic <--- g -.32 .51 -.63 .53 par_21
Dexterity <--- g .92 .39 2.36 .02 par_22
Science <--- g -.02 .47 -.04 .96 par_23
Animals <--- g 1.20 .67 1.80 .07 par_24
Plant_Care <--- g .31 .53 .58 .56 par_25 Table 49: Correlated M.I. Unstandardized Regression Weights for Maximum-
Likelihood Estimation. S.E. is the standard error of the regression weight.
Dividing the regression weight estimate by the estimate of its standard error
gives the c.r. P is the probability the regression weight for the prediction is
significantly different from zero at the 0.001 level (two-tailed). These statements
are approximately correct for large samples under suitable assumptions.
When TII goes up by 1, g goes up by 0.01. When g goes up by 1, Expressive goes up by
1. This regression weight was fixed at 1.00, not estimated. When g goes up by 1, Rhetorical goes
up by 1.04. When g goes up by 1, Read_Write goes up by 1.89. When g goes up by 1, Persuasion

FLUID AND CRYSTALLIZED G VS. M.I.: SEM OF HUMAN INTELLIGENCE 150
goes up by 0.39. When g goes up by 1, Sensitivity goes down by 0.06. When g goes up by 1,
People goes down by 0.15. When g goes up by 1, Self_Know goes up by 0.1. When g goes up by
1, Calculations goes down by 0.18. When g goes up by 1, Spatial_PS goes up by 0.57. When g
goes up by 1, Effectiveness goes down by 1.1. When g goes up by 1, School_Math goes up by
0.9. When g goes up by 1, Logic_Games goes up by 2.32. When g goes up by 1, Everyday_Math
goes up by 0.86. When g goes up by 1, Everyday_PS goes up by 1.49. When g goes up by 1,
Spatial_Aware goes up by 0.62. When g goes up by 1, Art_Design goes up by 0.72. When g goes
up by 1, Objects goes up by 1.69. When g goes up by 1, Appreciation goes up by 0.71. When g
goes up by 1, Instrument goes up by 1.59. When g goes up by 1, Vocal goes up by 1.83. When g
goes up by 1, Composer goes up by 1.21. When g goes up by 1, Athletic goes down by 0.32.
When g goes up by 1, Dexterity goes up by 0.92. When g goes up by 1, Science goes down by
0.02. When g goes up by 1, Animals goes up by 1.2. When g goes up by 1, Plant_Care goes up
by 0.31 (IBM, 2015).
TII’s factor loading is statistically significant (λ=.01, p≤.01). The Read_Write factor
loading is statistically significant (λ=1.89, p≤.001). The Logic_Games factor loading is
statistically significant (λ=2.32, p≤.01). The Rhetorical factor loading is statistically significant
(λ=1.04, p≤.01). The Everyday Problem-Solving factor loading is statistically significant
(λ=1.49, p≤.01). The Working with Objects factor loading is statistically significant (λ=1.69,
p≤.05). The Instruments factor loading is statistically significant (λ=1.59, p≤.05). The Vocal
factor loading is statistically significant (λ=1.83, p≤.05). The Composer factor loading is
statistically significant (λ=1.21, p≤.05). The Dexterity factor loading is statistically significant
(λ=.92, p≤.05). The given Eigenvalues were 7.3, 2.6, 2.3, 1.8, 1.5, 1.3, 1.1, 1.0, .8, .7, .7, .6, .6,
.5, .5, .5, .4, .4, .4, .3, .3, .3, .3, .3, .2, .2, and .2.

FLUID AND CRYSTALLIZED G VS. M.I.: SEM OF HUMAN INTELLIGENCE 151
A Pearson’s r correlational analysis was run is SPSS. Most, but not all (β±.05≈r), of the r
values corresponded to the beta weights in this model, and r values with statistical significance
levels are provided next. Logic Games statistically significantly correlates with g (r=.31, p≤.01,
two-tailed). Read_Write statistically significantly correlates with g (r=.30, p≤.01, two-tailed).
Everyday Problem Solving statistically significantly correlates with g (r=.21, p≤.01, two-tailed).
Working with Objects statistically significantly correlates with g (r=.22, p≤.01, two-tailed).
Instruments statistically significantly correlates with g (r=.20, p≤.01, two-tailed). Vocal
statistically significantly correlates with g (r=.18, p≤.01, two-tailed). Dexterity statistically
significantly correlates with g (r=.16, p≤.01, two-tailed). Expressive statistically significantly
correlates with g (r=.15, p≤.05, two-tailed). Rhetorical statistically significantly correlates with g
(r=.14, p≤.05, two-tailed). Composer statistically significantly correlates with g (r=.15, p≤.05,
two-tailed). Animals statistically significantly correlates with g (r=.14, p≤.05, two-tailed).
Effectiveness statistically significantly negatively correlates with g (r=.-.13, p≤.05, two-tailed).
Correlational analyses were run for CII and FII with M.I.D.A.S. scores. Expressive
statistically significantly correlates with crystallized abilities (r=.21, p≤.01, two-tailed).
Read_Write statistically significantly correlates with crystallized abilities (r=.37, p≤.01, two-
tailed). Logic_Games statistically significantly correlates with crystallized abilities (r=.26, p≤.01,
two-tailed). Everyday Problem-Solving statistically significantly correlates with crystallized
abilities (r=.17, p≤.01, two-tailed). Instrument statistically significantly correlates with
crystallized abilities (r=.22, p≤.01, two-tailed). Vocal statistically significantly correlates with
crystallized abilities (r=.20, p≤.01, two-tailed). Composer statistically significantly correlates
with crystallized abilities (r=.16, p≤.01, two-tailed). Rhetorical statistically significantly
correlates with crystallized abilities (r=.14, p≤.05, two-tailed). Working with Objects statistically

FLUID AND CRYSTALLIZED G VS. M.I.: SEM OF HUMAN INTELLIGENCE 152
significantly correlates with crystallized abilities (r=.13, p≤.05, two-tailed). Musical
Appreciation statistically significantly correlates with crystallized abilities (r=.13, p≤.05, two-
tailed). Animals statistically significantly correlates with crystallized abilities (r=.14, p≤.05, two-
tailed). Effectiveness statistically significantly negatively correlates with crystallized abilities
(r=-.15, p≤.05, two-tailed). Spatial Problem-Solving statistically significantly correlates with
fluid abilities (r=.16, p≤.01, two-tailed). School Math statistically significantly correlates with
fluid abilities (r=.30, p≤.01, two-tailed). Logic_Games statistically significantly correlates with
fluid abilities (r=.31, p≤.01, two-tailed). Everyday Math statistically significantly correlates with
fluid abilities (r=.24, p≤.01, two-tailed). Everyday Problem-Solving statistically significantly
correlates with fluid abilities (r=.24, p≤.01, two-tailed). Spatial Awareness statistically
significantly correlates with fluid abilities (r=.20, p≤.01, two-tailed). Art Design statistically
significantly correlates with fluid abilities (r=.21, p≤.01, two-tailed). Working with Objects
statistically significantly correlates with fluid abilities (r=.33, p≤.01, two-tailed). Dexterity
statistically significantly correlates with fluid abilities (r=.23, p≤.01, two-tailed).

FLUID AND CRYSTALLIZED G VS. M.I.: SEM OF HUMAN INTELLIGENCE 153
Discussion
The measurement and structural models in this research were developed according to
theory, previous research, and reasonably hypothetical relations. The individual and cumulative
structural equation models lead to several inferences about human intelligence theory, human
intelligence measurement, and human intelligence structure. A criterion-convenience method
was employed to sample intelligence test and assessment scores from students (n=287,
Mage=20.31, s.d.=2.082) at one university on the east coast of the United States in order to draw
inferences about the models.
The results of the analyses show greater support for the Theory of Fluid and Crystallized
Intelligence; however, the Theory of M.I. is also acceptably supported when there are
modifications placed on it. Support is found for Gardner’s (1993) Theory of M.I. models when
these theoretical models are modified to correlate. Acceptable structural models of M.I. Theory
exist, but in relation to Theory of Fluid and Crystallized Intelligence models, the M.I. Theory
models do not show a better structural fit. The Theory of Fluid and Crystallized Intelligence
measurement and structural models show close fit with all suggested tests of model fit. Portions
of the explanatory output and text is provided by SPSS and AMOS (IBM, 2015).
The study sought to have sufficient power and effect size stemming from the sample size.
The total number of participants in the study analysis was two-hundred eighty-seven (n=287).
The study’s approximate effect size is large with good power (r=.5; power=.90; p≤.01) for the
M.I. analyses, and should be considered similar for the R.A.I.T. analyses with additional evidence
based on Hoelter values >200 (Hoelter, 1983).
The restated purposes of this research were to: a) investigate two debated theories of
intelligence via contemporary and competitively valid measures and analysis, b) test the multiple

FLUID AND CRYSTALLIZED G VS. M.I.: SEM OF HUMAN INTELLIGENCE 154
intelligences against another widely accepted two-factor theory of intelligence, c) evaluate
internal and external validity of two intelligence measures constructed to measure two debated
theories of intelligence, and d) make inferences about analyses of debated and opposing theories
of human intelligence. Research questions asked: a) Which existing theory-based and
hypothetically based models of intelligence reveal the best fit after administration of an
assessment of crystallized and fluid intelligence?; b) Which existing theory-based and
hypothetically based models of intelligence reveal the best fit after administration of an
assessment of M.I.?; c) Does the Multiple Intelligence Developmental Assessment Scales reveal a
hierarchical second-order factor?; d) Which combined theory models of intelligence reveal the
best fit?
Which existing theory-based and hypothetically based models of intelligence reveal the
best fit after administration of an assessment of crystallized and fluid intelligence? The theory of
fluid and crystallized intelligence model shows good fit (χ2(4) =8.08, p=.09; CMIN/d.f.=2.02;
RMSEA= .06; GFI=.99; TLI= .98; CFI= .99; IFI=.99; SRMR=.02). Each model had nearly
excellent fit except for the uncorrelated indicators on g which was predicted. R.A.I.T. criterion
validity is confirmed and found to be high. If the model with uncorrelated indicators had good
fit, then the criterion validity of the R.A.I.T. would have been lowered. Again, each subtest of the
R.A.I.T. is an empirical measure of intelligence, but the general intelligence is moderated by fluid
and crystallized intelligence. The R.A.I.T. is an excellent measure of g, but only with fluid and
crystallized theory, and this finding supports the construct validity of the R.A.I.T.
Which existing theory-based and hypothetically based models of intelligence reveal the
best fit after administration of an assessment of M.I.? The traditional theory of multiple
intelligence model was rejected. The traditional theory of M.I.s model does not show overall

FLUID AND CRYSTALLIZED G VS. M.I.: SEM OF HUMAN INTELLIGENCE 155
good fit (χ2(300) =1441.45, p<.001; CMIN/d.f.=4.80; RMSEA= .12 (LO (90% C.I.=11);
GFI=.66; TLI= .61; CFI= .64; IFI= .65; SRMR=.22). The model should be rejected. Only the
CMIN/d.f. (CMIN/d.f.=4.80) meets a higher-end acceptable fit standard (CMIN/d.f.<5)
previously suggested by some (Marsh & Hocevar, 1985; Wheaton, Muthen, Alwin, & Summers,
1977).
Figures 12 and 13: Correlated M.I. Structural Model shows good fit according to some fit
indices and criterions (χ2(264) =569.09, p<.001; CMIN/d.f.=2.16; RMSEA= .06; TLI= .88; CFI=
.90; IFI= .91; SRMR=.06). This model was also confirmed by Castejon et al. (2010).
Which combined theory models of intelligence reveal the best fit? Modifying the
structure of the M.I. model to correspond to a bi-factor model resembling a fluid and crystallized
model showed good fit. Figures 21 and 22 Two-Factor MTMM M.I. Model shows good fit
(χ2(267) =526.32, p<.001; CMIN/d.f.=2.12; RMSEA= .06; GFI=.91; TLI= .92; CFI= .94; IFI=
.94; SRMR=.06).
Models with simply raw scores did not show sufficient, or better than individual
theoretical model, fit thus were not displayed. Structural equation modeling via scaled R.A.I.T.
scores provided the best insight into this question. Based on these results, a framework for
implementing educational techniques is allowed. A M.I. Indicator & R.A.I.T. FII to g Structural
Correlated Uniqueness (SCU) Model shows good fit (χ2(120) =247.56, p<.001; CMIN/d.f.=2.06;
RMSEA= .06; TLI= .89; GFI=.94; CFI= .96; IFI= .96; SRMR=.10). Reading and Writing and
Logic Games correlate the highest with g. A model with multiple intelligence and fluid and
crystallized indicators did not reveal near acceptable fit. Modification indices continually
suggested a more correlated model which was already found to be acceptable with M.I.

FLUID AND CRYSTALLIZED G VS. M.I.: SEM OF HUMAN INTELLIGENCE 156
indicators alone, so the analysis switched to a more structural one where R.A.I.T. standard scores
were entered into the equation.
This study found that both crystallized and fluid latent variables are significant predictors
of g. The single factor model did not show acceptable fit. Studies have found varying results in
regards to g. Some studies have found that crystallized indicators contribute most to g (Gignac,
2006).
Does the Multiple Intelligence Developmental Assessment Scales reveal a hierarchical
second-order factor? Figures 17 and 18 M.I. to g did not show good fit. This finding was similar
to Castejon et al.’s (2010) and Almeida et al.’s (2010) findings. Figures 21 and 22 are bi-factor
MTMM M.I. without bodily-kinesthetic and musical intelligence models synonymous to fluid
and crystallized factors that show the best overall fit (χ2(267) =526.32, p<.001; CMIN/d.f.=2.12;
RMSEA= .06; GFI=.91; TLI= .92; CFI= .94; IFI= .94; SRMR=.06).
The fact that continuous modifications of the traditional M.I. theory model into one
similar to a fluid and crystallized model makes the point of the analysis that a theory of fluid and
crystallized intelligence is a more accepted theory. Combining several observed linguistic
intelligence and personal intelligence indicators made for a better model that is synonymous with
crystallized intelligence. Combining several observed logical-mathematical, spatial, and
naturalistic intelligence indicators made for a better analytic model synonymous with fluid
intelligence. The audience is left with the question of whether musical intelligence and bodily-
kinesthetic intelligence are intelligence, and to what extent. In this analysis, the observed athletic
indicator accomplished little to nil. Dexterity contributed most to the bodily-kinesthetic
intelligence. Dexterity and musical seem more related to talents than intelligence. Figures 15 and

FLUID AND CRYSTALLIZED G VS. M.I.: SEM OF HUMAN INTELLIGENCE 157
16 Correlated M.I. Model (Unsatisfactory Indicators Removed) were constructed based on the
unsatisfactory factor loadings between the indicator and intelligence.
According to Epstein (1984), “Where we have no reason to do otherwise and where two
theories account for the same facts, we should prefer the one which is briefer, which makes
assumptions with which we can easily dispense, which refers to observables, which refers to
observables, and which has the greatest possible generality. Psychologists often violate this
principle, particularly in attributing complex behavior to cognitive processes” (p. 119).
Detterman (1982) argued against factoring abilities into a single g or even fluid and
crystallized intelligence though the main argument was against g. Detterman (1982) argued
against parsimony in models, and ignoring higher-order factors would diminish them. This
research showed the importance of higher-order factors because they aid in the logic of forming
and potentially bettering the factors, and in the field of assessment, evaluation, and testing,
construct validity is essential.
Similar to Castejon et al.’s (2010) and Almeida et al.’s (2010) findings, a traditional M.I.
model with a higher-order g-factor did not show good fit although it showed better fit than the
traditional M.I. model with or without correlated errors, and all the λ (direct and indirect)
loadings on g were statistically significant (p<.001) as in Visser et al’s (2006) study.
The Figures 27 and 28 structured TII correlated uniqueness model with M.I. and M.I. to
FII and CII correlations answered some questions about the relations between general
intelligence and M.I. indicators. These findings could be used as a framework for designing
educational strategy.
Two highly validated measures of each theory were chosen to lead the analysis. Measures
of M.I. theory in empirical research are subjective rather than objective ratings that have

FLUID AND CRYSTALLIZED G VS. M.I.: SEM OF HUMAN INTELLIGENCE 158
consistently headed implications. The Mental Measurements Yearbook with Tests in Print has
published reviews stating that the M.I.D.A.S. is the best-rated measure of the theory of M.I.
The R.A.I.T. is a somewhat new measure of fluid and crystallized intelligence loading on
a general intelligence. The R.A.I.T. utilizes pictorial analogies and sequences. The pictures within
the analogies are a combination of geometric shapes and real-life scenarios. An individual with a
high M.I.D.A.S. score in “Spatial Intelligence” due to a high indicator score for “Working with
Objects” is likely to have solved the R.A.I.T. Nonverbal Analogies (NVA) items containing
workable with objects more efficiently than an individual with a low score on “Working with
Objects.” The same is true for animals, people, art, nature, and sports According to “M.I.
Theory” and specific items on the M.I.D.A.S., this would be the case. The R.A.I.T. “General
Knowledge” subtest contains evenly distributed identification of people according to domains
such as athlete, scientist, artist, civil leader, and religious leader. Gardner (1999) states that
traditional intelligence tests do not measure the M.I. The R.A.I.T. is developed from fluid and
crystallized intelligence theory, but does contain the similarities of M.I. theory stated here.
The R.A.I.T. is based on the theory of fluid and crystallized intelligence, shows good fit
with the theory, and has convergent validity with other intelligence tests that do not necessarily
rely on the “Theory of Fluid and Crystallized Intelligence”. The R.A.I.T. General Knowledge
(GK) subtest statistically significantly correlates with the Wechsler Adult Intelligence Test IV
(WAIS-IV) Similarities, Digit Span, Vocabulary, Visual Puzzles, and Information subtests. The
R.A.I.T. Nonverbal Analogies (NVA) subtest statistically significantly correlates with the
Wechsler Adult Intelligence Test IV (WAIS-IV) Block Design and Visual Puzzles subtests. The
R.A.I.T. Sequences (SEQ) subtest statistically significantly correlates with the Wechsler Adult
Intelligence Test IV (WAIS-IV) Block Design and Visual Puzzles subtests. The R.A.I.T. Odd

FLUID AND CRYSTALLIZED G VS. M.I.: SEM OF HUMAN INTELLIGENCE 159
Word Out (OWO) subtest statistically significantly correlates with the Wechsler Adult
Intelligence Test IV (WAIS-IV) Vocabulary, Visual Puzzles, and Information subtests. The
R.A.I.T. Word Opposites (WO) subtest statistically significantly correlates with the Wechsler
Adult Intelligence Test IV (WAIS-IV) Block Design, Similarities, Vocabulary, Visual Puzzles,
and Information subtests. Similar correlations are seen with respect to the Wechsler Intelligence
Test for School Children IV (WISC-IV).
Although some of the reconstructed models show different, the study finds that the
M.I.D.A.S. does have high criterion validity equivalent to, or better than, existing empirical
frameworks for measures because of Figures 12 and 13: Correlated M.I. Structural Model results.
The M.I.D.A.S. asks questions about an individual’s past experiences with inner-self and
environmental situations and reactions. Individuals have had time to reflect on these experiences.
The M.I.D.A.S. does measure ability outcomes vs. preferences. Some of the one-hundred and
nineteen questions are directed to childhood or adolescence while some are to current status and
outcome. The M.I.D.A.S. questions preferences and abilities. If an individual has neither
experienced, shown ability, or realized their potential in an intelligence subarea, then there is an
“I do not know” answer that does not affect a score. Some of the indicators of one intelligence
correlate very high with indicators of another intelligence. Gardner (1999) did reveal that more
than one intelligence can be elicited in a domain, so the intelligences may be allowed to
correlate.
Although drawn from a population at a single university, the intelligence data collected in
this research was from a demographically representative sample of the population of young adult
college students studying a wide variety of disciplines. Hoelter’s Critical N statistic of >200 for
the fluid and crystallized, and close to for the M.I., intelligence analysis increases the

FLUID AND CRYSTALLIZED G VS. M.I.: SEM OF HUMAN INTELLIGENCE 160
generalizability validity evidence of the analysis (Hoelter, 1983). More research needs to go into
this statistic. It is essentially a generalizability statistic, but it does not seem to match with some
traditional and recommended power and effect size measures. For the M.I. analyses, increased
d.f. contributes to increased power (MacCallum, Browne, & Sugawara, 1996).
It is comparatively interesting, but not inferentially representative, or generalizable, here,
that the demographic data showed trends consistent with demographic related intelligence
research. The analysis found that both fluid and crystallized intelligence thus intelligence in
general decreases age (CII p≤.01; FII p≤ .05; TII p≤.01) in this sample between the ages of
eighteen and twenty-five (M=20.31, s.d.=2.082). Most studies report declines in fluid
intelligence around age twenty with subtle increases in crystallized intelligence through twenty-
five; however, these strongest crystallized increases usually occur right around and after twenty-
five (Carroll, 1993, p. 664-677; Horn & Cattell, 1967; Kaufman & Horn, 1996; Kaufman,
Reynolds, & McLean, 1989; Tucker-Drob, 2009). Further study into smaller range age changes
in intelligence is recommended.
One of the several minimal factors in the analysis is motivation (Cattell, 1963;
Duckworth, Quinn, Lynam, Loeber, & Stouthamer-Loeber, 2011). The motivation factor may
also be linked with the negative correlations with age in the low-range age span. Older students
are less likely to be motivated by monetary compensation. Older students are more likely to
realize the stakes involved in participating in voluntary research.
This study found statistically significant fluid intelligence differences, but not crystallized
or total intelligence differences, between genders with males scoring statistically significantly
higher than females (p≤ .01). Some studies have found higher fluid, crystallized, and general

FLUID AND CRYSTALLIZED G VS. M.I.: SEM OF HUMAN INTELLIGENCE 161
intelligence scores for males (Jackson & Rushton, 2006; Lynn, 1994, 1999; Nyborg, 2005;
Steinmayr, Beauducel, & Spinath, 2010).
Asian participant interest in participating in a human intelligence research study was
disproportionately high. The background section noted the significance of the conceptualization
of intelligence in Asia and Asian culture. Several Asian nations such as Singapore, Malaysia,
Shanghai, Macao, Japan, Korea, Taipai, Thailand, Hong Kong, Vietnam consistently have high
ranking intelligence scores worldwide (National Center for Education Statistics (NCES), 2016).
Sternberg and others regularly expands on the different conceptualizations of intelligence in Asia
and around the world (Azuma & Kashiwagi, 1987; Sternberg, 2003; Sternberg, Conway, Ketron,
& Bernstein, 1981; Yang & Sternberg, 1997a; Yang & Sternberg, 1997b).
The participant recruitment methods utilized in this research for collecting data on human
intelligence are highly recommended (Brase, Fiddick & Harris, 2006). Brase, Fiddick, and Harris
(2006) report that paid vs. unpaid university student participants at top-tier universities elicit the
best performances on Bayesian reasoning intelligence tasks, even when controlling for within
and between group effects.
The assumption process of identifying outliers and having a normal distribution was
lengthy in this study. Transformations and excluding high numbers of cases weakens the overall
data analysis validity just as interpreting results with debatable normal distributions. Following
accepted guidelines, the data does not provide a perfectly normal distribution but, rather, an
acceptable distribution based on several suggestions. Analyzing raw scores vs. standard scores
for outliers left several extreme cases in the analysis. No Total Intelligence Index (TII) was
significantly below average, but there were significantly below average Crystallized Intelligence

FLUID AND CRYSTALLIZED G VS. M.I.: SEM OF HUMAN INTELLIGENCE 162
Index (CII) scores in the analysis. The Maximum-Likelihood SEM estimation is robust to minor
non-normality (Brown, 2015).
The theory of fluid and crystallized intelligence has indeed been expanded upon by
researchers; however, its core components remain most significant; therefore, its concurrent and
convergent validity with newer and expanded theory is high, or the newer or expanded theory
has high concurrent and convergent validity with the traditional theory of fluid and crystallized
intelligence. It was stated earlier that the R.A.I.T. is a timed but not speeded test (Reynolds,
2014). In this study, one of the observed smaller factors based on Eigenvalues was more than
likely a speed factor. During test administration, there were only a couple of occurrences where a
participant was noticeably completed with a subtest before the total time allowed. Out of the
≈1,500 subtests, the number of perfectly correct subtests was minimal as well. According to
Carroll (1993), cognitive speed has consistently had varying results. At face value, speed fits
with fluid intelligence, and Carroll (1993) states that a separate speed factor or factors, gs, or gt,
compensate for speed within all abilities such as crystallized abilities rather than a minor
investment of fluid intelligence into crystallized intelligence.
In the chapter titled “Nurturing Intelligences in Early Childhood”, which is the same
chapter as the Stanford-Binet and M.I. comparison, Gardner identifies Project Spectrum
activities that include numbers, science, music, language, visual arts, movement, and social that
identify talents (Gardner & Krechevsky, 2006). M.I. theory consistently provides successful
outcomes in educational settings.
Did Gardner mean that intelligence is not correlated but abilities and ability channels are?
No, during a question on correlated intelligences, Gardner (2006) distinguishes skills and talents

FLUID AND CRYSTALLIZED G VS. M.I.: SEM OF HUMAN INTELLIGENCE 163
from interests with enough statistical terminology then explains that skills and talents would not
correlate.
This research was a semi-replication of M.I. and traditional intelligence research
conducted by Castejon et al. (2010), Almeida et al. (2010), and Visser et al. (2006). The similar
models tested in this research are similar to the results supported in these studies. The M.I.D.A.S.
does meet Gardner’s expectations of a M.I. test (Gardner, 2006).
The theory of fluid and crystallized intelligence fits well in this research, and this model
another aspect missing from these other studies. Castejon et al. (2010) utilized good statistical
analysis of M.I. activities, but the researchers did not incorporate a traditional measure(s) of
intelligence. Again, the measures of intelligence were exploratory in nature. Visser et al. (2006)
incorporated a measure of traditional general intelligence that highly correlated with all of the
intelligences. This research found the highest correlations between crystallized measures and
linguistic intelligence and fluid measures and spatial and logical-mathematical intelligence.
Almeida et al.’s (2010) findings show the most significant correlations between indicators and
latent variables in the theory of fluid and crystallized intelligence. The replicated CFA into
measurement and structural SEM models indicate that the measurements of the two intelligence
theories have significant covariance (φ=.661, p≤.01; r=.21). Comparing these studies to the
present study reveals an implication of self-report measures of intelligence based on past
experiences compared with subjective measures.
The research finds what Almeida et al. (2010) found with regards to a “g” factor. The “g”
factor arises as an explanatory factor when viewed as a higher-order hierarchical factor when
lower-order factors correlate. A single “g” factor loaded on numerous accepted intelligence tests
does not provide a good fit. A moderating “fluid” factor based on nonverbal evidence and

FLUID AND CRYSTALLIZED G VS. M.I.: SEM OF HUMAN INTELLIGENCE 164
“crystallized” factor based on experiential and learned evidence fits close enough to be accepted.
The research finds difficulty with the “Theory of M.I.” while science looks for the least difficult
and parsimonious models.
The answer to “What is the definition of intelligence?” may very well be “what
intelligence tests measure.” This definition does have bias toward a psychometric point-of-view
when other points-of-view are considered. Sternberg made this point. Carroll (1993) includes a
page of definitions of intelligence provided by prominent name in the field of human
intelligence. The names include Anastasi, Eyseneck, Gardner, Sternberg, Thorndike, and more. It
seems that one conclusion from this study is that the participant’s self-report on intelligences
model best with their performances on intelligence factors. Seemingly unrelated factors being
excluded from analysis leaves the best fit.
The pioneering of intelligence research has mostly searched for nonverbal intelligence in
the brain. The most common intelligence test utilized in neuroscientific research has been the
nonverbal analogies test. Outcomes of the research have found that networks vs. distinct areas
are involved. The intelligence networks hold when confounding processes are accounted for.
The Cambridge Dictionary of Psychology (2009) defines Crystallized intelligence as “the
form of intelligence associated with previously learned material such as deductive reasoning,
vocabulary, general knowledge, reading comprehension, and solving analogies. It increases
slowly throughout adulthood until the onset of physical decline in elderly people and is
associated most closely with the hippocampus” (p. 260). The Cambridge Dictionary of
Psychology (2009) defines Fluid intelligence as “the form of intelligence associated with
learning new material, inductive reasoning, pattern detection, abstract reasoning, quantitative
reasoning, and problem-solving. It tends to peak at around age 25 and slowly decline thereafter.

FLUID AND CRYSTALLIZED G VS. M.I.: SEM OF HUMAN INTELLIGENCE 165
It is associated with the prefrontal and cingulate cortexes” (p. 260). The decision to collect
intelligence data from a sample between the ages of 18 and 25 was based on research reports
such as the definition. The ages tested in this research fall within the best for testing and
distinguishing between fluid and crystallized intelligence (Mage= 20.31; s.d.=2.1; Medage= 20.00;
Min.=18, Max.=25).
Other multivariate tests could have been run to analyze this data. Cluster analysis and
discriminant function analyses might create alternate visualizations of the data. The structural
equation modeling approach was preferred.
The models presented after the two traditional theories and some different perspectives of
them made some points as well. Intrapersonal Effectiveness statistically significantly negatively
correlates with g, and it is now argued that this indicator needs more exploration and does really
not even have sufficient face validity for human intelligence, even in a non-traditional theory.
Science interestingly had no statistically significant correlation with g. The modern term
‘science’ derives from the Latin term ‘scientia’ which derived from ‘scire’ meaning ‘to know’,
and it was passed from Latin to Old French to Middle English (Stevenson, 2015). According to
the Oxford Dictionary of English, science is defined as “the intellectual and practical activity
encompassing the systematic study of the structure and behaviour of the physical and natural
world through observation and experiment” (Stevenson, 2010, p. 1593). The background and
systematic methods applied in this research were scientific.
Carroll (1993) explains that Gardner’s theory of M.I. is similar to the three-stratum
theory. The three stratum theory puts narrow abilities at stratum I, broad abilities at stratum II,
and general abilities at stratum III. Carroll explains that linguistic intelligence is synonymous
with crystallized intelligence, musical intelligence with auditory perception ability, logical-

FLUID AND CRYSTALLIZED G VS. M.I.: SEM OF HUMAN INTELLIGENCE 166
mathematical with fluid intelligence, and spatial intelligence to visual perception. It was believed
in this study that fluid intelligence accounts for logical-mathematical and spatial intelligence.
Logical-mathematical self-reports correlated highest with measured fluid intelligence followed
closely with spatial intelligence. It was believed that naturalistic intelligence might follow a
scientific method type of personality; however, releasing the naturalist intelligence from the
model led to a better fit. That model is not shown, but it was tested. It was believed in this study
that crystallized intelligence accounts for linguistic intelligence, musical intelligence, and the
personal intelligences. These M.I. do create a good fit with a second-order factor alone; however,
when a measured ability tested vs. self-report measure indicators of crystallized intelligence are
added the personal intelligences vary much differently. It seems that the personal intelligences
would be the naturalistic intelligence from the fluid example. What is left is evidence for M.I.
theory and evidence for the theory of fluid and crystallized intelligence. Testing simple theory of
fluid and crystallized intelligence vs. extended theory or CHC theory has cause because
researchers consistently find relations between the extended and broad abilities (Kvist &
Gustafsson, 2008).
According to Carroll (1993), a speed factor is a confound. A speed factor in the fluid
intelligence tests was likely the reason for the added analysis of the normality of the partially
negatively skewed Sequences subtest. It is believed that speed would fall within the fluid factor,
and the R.A.I.T. is a timed test but not a speeded test, but the R.A.I.T. fluid subtests design do
seem to incorporate speed. Speed and/or practice effects caused a positive skewness in the SEQ
distribution. It is believed that only a few participants in the study relied on guessing. There were
not many score sheets with large sets of incorrect guessed at answers. Observation during
administration showed that most participants seemed to complete as many items as possible to

FLUID AND CRYSTALLIZED G VS. M.I.: SEM OF HUMAN INTELLIGENCE 167
the best of their ability in the allowed time, i.e. exerted sufficient effort. Thus those who
exhibited more speed of processing were able to complete more items and more correct items in
the time allotted. Only a few individuals completed all of the items on one or more of the
subtests. The highest scoring individuals did not complete all the items on more than two
subtests.
This research did not hypothesize any relations between Gardner’s theory of M.I.s or
Cattell’s theory of fluid and crystallized intelligence. The two theories are distinct. The study is
designed to add to the debate between the two theories. It is natural to ask questions when two
separate theories attempt to explain one construct. There are similarities within the theories, and
this study went ahead and compared some of them.
This research attempted to resolve the limitations of other similar research by using a
supported measure of M.I. theory. However, an implication, and, now, potential limitation, of
this research is again a better measure of M.I. theory. Results of other analyses found good
fitting models for adaptations of M.I. theory (Almeida et al., 2010; Castejon et al., 2010). This
research found similar results, but the results do not create a good fitting model, nonetheless a
better model than traditional intelligence.

FLUID AND CRYSTALLIZED G VS. M.I.: SEM OF HUMAN INTELLIGENCE 168
Conclusions
Fluid and Crystallized g vs. Multiple Intelligence: A Structural Equation Modeling Study
of Human Intelligence Theories took a “by the book” approach to properly reporting all the
proper statistics for conducting structural equation modeling. Kline (2011) suggests several
articles that review what should be reported in SEM studies, including DiStefano and Hess
(2005). DiStefano and Hess (2005) reviewed the contents of one-hundred and one educational
and psychological assessment studies in order to report what is and what should be included in
SEM analyses. Based on DiStefano and Hess’s (2005) recommendations, it is concluded that this
study was well designed and reported. According to DiStefano and Hess (2005), the majority of
studies test existing theory and modifications of them. Half of the studies utilized a subscale
score analysis while the other half utilize an item-level analysis (DisStefano & Hess, 2005). This
study utilized a raw subscale score analysis. With the >200 sample size recommendation
(n=287), the theory of fluid and crystallized intelligence analysis utilized a n:p ratio of >50:1
while at the same time the M.I. analysis utilized an 11:1 n:p ratio when a >5n:p ratio is
recommended (DiStefano & Hess, 2005). This study a priori stated that χ2 p-values >.05 and
recommended fit indices would lead analyses. The fit indices criterion cut-off levels match with
the suggestions continually reported in the extant literature, including seminal works. A
traditional ≥.90 and contemporary ≥.95 criterion for good fit led the model fit analyses. The
traditional criterion of ≥.90 was related to acceptable models in this analysis. The fluid and
crystallized intelligence analysis yielded non-significant χ2 p-values and contemporary fit
criterions while the M.I. analyses consistently yielded acceptable criterions. According to
DiStefano and Hess (2005), half of studies use a raw subscale score analysis similar to this

FLUID AND CRYSTALLIZED G VS. M.I.: SEM OF HUMAN INTELLIGENCE 169
analysis while the other half utilized an item-level analysis. Amos ML-estimation analyzes
covariance matrices.
Gardner’s (1983) “Theory of M.I.” is an accepted theory in the fields of intelligence,
education, and psychology. This study has confirmed through psychometrics the notions that
M.I. theory with certain modifications is an acceptable theory. In a psychometric framework,
M.I. Theory can be seen as a framework for traditional intelligence theory or as an extension of
it. The Gardner (1983) “Theory of M.I.” and Shearer (2007) “Multiple Intelligence
Developmental Assessment Scales (M.I.D.A.S.) provide an acceptable framework for low-stake
environments such as instructional strategy where the context is appropriate.
The Cattell (1943) “Theory of Fluid and Crystallized Intelligence” fits well with its
conceptualization, the common consensus, and the intelligence data collected in this research.
Reynold’s Adaptable Intelligence Test is a good measure of traditional human intelligence based
on the “Theory of Fluid and Crystallized Intelligence.” Cattell’s theories of intelligence are
consistently validated in measurement studies (Johnson, Bouchard, Krueger, McGue, M. &
Gottesman, 2004; Johnson, Nijenhuis, & Bouchard, 2008).
As stated in the introduction, many of the original Binet and the like indicators such as
bodily movements and coordination included the M.I. indicators. This analysis found that
personal, or social, indicators and naturalist indicators of intelligence either a) need refinement or
b) are not part of the definition of intelligence.
It seems that since the times of Plato, Aristotle, and Confucius education and societal
teachings and norms have become more and more incorporated into the definition of intelligence.
To the point of Terman, the concept of intelligence and its measurement was to
distinguish levels of the concept that is distinguishable. The theory of fluid and crystallized

FLUID AND CRYSTALLIZED G VS. M.I.: SEM OF HUMAN INTELLIGENCE 170
intelligence incorporates a crystallized concept that is argued by many to be too education
loaded. The theory of M.I. took a new framework to existing intelligence theory, but it is not
argued here that the theory lacked empirical evidence. The theory of M.I. has consistently been
found to be too complex. The likelihood of one to several human neuronal cells solely adapted
for the indicators of M.I. without any other functional ability is unseen without correlation thus
far. The likelihood of prodigies should be investigated further. The case of the lesioned patient
does need more empirical evidence.
Spearman’s goal was to further conceptualize intelligence into a practical entity.
Practicality and parsimony are essential to science. The human body is a science. The human
body is adapted to be an efficient system. The process of natural selection shows that non-
efficient systems at all levels have proven to die off in the evolutionary process. The human
brain is an evolved organ. The need for a valid measure was apparent. An efficient M.I. system
would be one that is correlative in nature. The theory of fluid and crystallized intelligence is a
highly overall valid and efficient theory.
A working theory is able to be applied, and applied in an efficient manner. M.I. theory
has shown practical validity in applied settings such as school and industry. This psychometric
research found that intelligence test items can be developed to relate to M.I. This was seen in the
description of the pictorial tasks in the fluid areas. Again, Cattell’s investment theory states that
natural problem-solving ability is invested into crystallized ability. The musicians with higher
intelligence were selected from a music classroom in Spearman’s study. The theory of “fluid and
crystallized intelligence” states that intelligence is composed of natural problem-solving and
learned abilities. If a combination of the two theories studied in this research were achievable,
then several modifications would have to be made to both. Tests of “fluid and crystallized

FLUID AND CRYSTALLIZED G VS. M.I.: SEM OF HUMAN INTELLIGENCE 171
intelligence” could conform more to the M.I. Tests and assessments of “M.I.” theory would have
to allow the correlations between the intelligences.

FLUID AND CRYSTALLIZED G VS. M.I.: SEM OF HUMAN INTELLIGENCE 172
Acknowledgements
I would like to thank Branton Shearer, Ph.D. for accepting my application for the M.I.
Developmental Assessment Scales (M.I.D.A.S.). Branton Shearer was a co-administrator of the
Online M.I.D.A.S. Scoring (OMS) system for participant M.I.D.A.S. profile generation.
Acknowledgement is provided to Psychological Assessment Resources (PAR) and Dr. Cecil
Reynolds whom were informed, and returned acknowledgement, that the Reynold’s Adaptable
Intelligence Test would be used in this thesis.

FLUID AND CRYSTALLIZED G VS. M.I.: SEM OF HUMAN INTELLIGENCE 173
References
Ackerman, P. L. (1996). A Theory of adult intellectual development: Process, personality,
interests, and knowledge. Intelligence, 22, 227–257. doi:10.1016/s0160-
2896(96)90016-1
Almeida, L. S., Prieto, M. D., Ferreira, A. I., Bermejo, M. R., Ferrando, M., & Ferrándiz, C.
(2010). Intelligence assessment: Gardner M.I. Theory as an alternative. Learning and
Individual Differences, 20, 225–230. doi:10.1016/j.lindif.2009.12.010
Allix, N. M. (2000). The Theory of M.I.: A case of missing cognitive matter. Australian Journal
of Education, 44, 272–288. doi:10.1177/000494410004400306
American Educational Research Association, American Psychological Association, & National
Council on Measurement in Education (1999). Standards for educational and
psychological testing. Washington, D.C.: American Educational Research Association.
Amodio, D. M., & Frith, C. D. (2006). Meeting of minds: the medial frontal cortex and social
cognition. Nature Reviews Neuroscience, 7, 268–277. doi:10.1038/nrn1884
Angulo-Perkins, A., Aubé, W., Peretz, I., Barrios, F. A., Armony, J. L., & Concha, L. (2014).
Music listening engages specific cortical regions within the temporal lobes: Differences
between musicians and non-musicians. Cortex, 59, 126–137.
doi:10.1016/j.cortex.2014.07.013
Anscombe, F. J., & Guttman, I. (1960). Rejection of Outliers. Technometrics, 2, 123–147.
doi:10.2307/1266540
Armony, J. L., Aubé, W., Angulo-Perkins, A., Peretz, I., & Concha, L. (2015). The specificity of
neural responses to music and their relation to voice processing: An fMRI-adaptation
study. Neuroscience Letters, 593, 35–39. doi:10.1016/j.neulet.2015.03.011

FLUID AND CRYSTALLIZED G VS. M.I.: SEM OF HUMAN INTELLIGENCE 174
Au, J., Sheehan, E., Tsai, N., Duncan, G. J., Buschkuehl, M., & Jaeggi, S. M. (2015). Improving
fluid intelligence with training on working memory: A meta-analysis. Psychonomic
bulletin & review, 22, 366-377
Bareš, M., Husárová, I., Filip, P., Mareček, R., Mikl, M., & Lungu, O. V. (2014). The
cerebellum, basal ganglia and motor timing in movement disorders. Behavioral and fMRI
study. Clinical Neurophysiology, 125, 39. doi:10.1016/j.clinph.2013.12.082
Basten, U., Biele, G., Heekeren, H. R., & Fiebach, C. J. (2010). How the brain integrates costs
and benefits during decision making. Proceedings of the National Academy of Sciences,
107, 21767–21772. doi:10.1073/pnas.0908104107
Bentler, P. M. (1990). Comparative fit indexes in structural models. Psychological Bulletin, 107,
238–246. doi:10.1037/0033-2909.107.2.238
Bentler, P. M., & Bonett, D. G. (1980). Significance tests and goodness of fit in the analysis of
covariance structures. Psychological Bulletin, 88, 588–606. doi:10.1037/0033-
2909.88.3.588
Binetti, N., Siegler, I. A., Bueti, D., & Doricchi, F. (2013). Adaptive tuning of perceptual timing
to whole body motion. Neuropsychologia, 51, 197–210.
doi:10.1016/j.neuropsychologia.2012.10.029
Binet, A., & Simon, T. (1916). The development of intelligence in children: The Binet-Simon
scale. Baltimore, MD: Williams & Wilkins Company.
Blunch, N. J. (2008). Introduction to structural equation modelling using SPSS and AMOS.
Thousand Oaks, CA.: Sage Publications.
Box, G. E. P. (1979). Robustness in the strategy of scientific model building. In Launer, R. L., &

FLUID AND CRYSTALLIZED G VS. M.I.: SEM OF HUMAN INTELLIGENCE 175
Wilkinson, G. N. (Eds.). (1979). Robustness in statistics. New York, NY: Academic
Press.
Brase, G. L., Fiddick, L., & Harries, C. (2006). Participant recruitment methods and statistical
reasoning performance. The Quarterly Journal of Experimental Psychology, 59, 965–
976. doi:10.1080/02724980543000132
Brodmann, K. (1909). Vergleichende lokalisationslehre der groshirnrinde. Leipzig, Germany:
Johann Ambrosius Barth.
Brown, T. (2015). Confirmatory factor analysis for applied research. New York, NY: Guilford
Press.
Burr, R. B., & Tsuruda, J. S. (2000). Use of a fMRI reading comprehension test supports the
Wernicke-Geschwind model of written language processing. NeuroImage, 11, S355.
doi:10.1016/s1053-8119(00)91286-2
Cappelletti, M., Barth, H., Fregni, F., Spelke, E. S., & Pascual-Leone, A. (2007). rTMS over the
intraparietal sulcus disrupts numerosity processing. Experimental Brain Research, 179,
631–642. doi:10.1007/s00221-006-0820-0
Carlson, J. F., Geisinger, K. F., & Jonson, J. L. (Eds.) (2014). The nineteenth mental
measurements yearbook with tests in print. Lincoln, NE: Buros Center for Testing.
Carroll, J. B. (1953). An analytical solution for approximating simple structure in factor analysis.
Psychometrika, 18, 23–38. doi:10.1007/bf02289025
Carroll, J. B. (1993). Human cognitive abilities: A survey of factor-analytic studies. New York,
NY: Cambridge University Press.
Castejon, J. L., Perez, A. M., & Gilar, R. (2010). Confirmatory factor analysis of Project

FLUID AND CRYSTALLIZED G VS. M.I.: SEM OF HUMAN INTELLIGENCE 176
Spectrum activities. A second-order g factor or M.I.? Intelligence, 38(5), 481–496.
doi:10.1016/j.intell.2010.07.002
Catani, M., Thiebaut de Schotten, M. (2012). Atlas of human brain connections. New York, NY:
Oxford University Press.
Cattell, J. M. (1890). Mental tests and measurements. The American Journal of Psychology, 3,
383. doi:10.2307/1411718
Cattell, R. B. (1940). A culture-free intelligence test I. Journal of Educational Psychology, 31,
161–179. doi: 10.1037/h0059043
Cattell, R. B. (1943). The measurement of adult intelligence. Psychological Bulletin, 40, 153–
193. doi:10.1037/h0059973
Cattell, R. B. (1963). Theory of Fluid and Crystallized intelligence: A critical experiment.
Journal of Educational Psychology, 54, 1–22. doi:10.1037/h0046743
Cattell, R. B. (Ed.). (1987). Intelligence: Its structure, growth and action. Amsterdam,
Netherlands: Elsevier Science Publishers.
Cattell, R. B., & Horn, J. L. (1978). A check on the Theory of Fluid and Crystallized intelligence
with description of new subtest designs. Journal of Educational Measurement, 15, 139–
164. doi:10.1111/j.1745-3984.1978.tb00065.x
Chen, J. (2009). China’s assimilation to MI Theory in education. In Chen, J., Moran, S., Gardner,
H. (2009). M.I. around the world. San Francisco, CA.: Jossey-Bass.
Chen, J., Moran, S., & Gardner, H. (2009). M.I. around the world. San Francisco, CA.: Jossey-
Bass.
Colom, R., Haier, R. J., Head, K., Álvarez-Linera, J., Quiroga, M. Á., Shih, P. C., & Jung, R. E.

FLUID AND CRYSTALLIZED G VS. M.I.: SEM OF HUMAN INTELLIGENCE 177
(2009). Gray matter correlates of Fluid, Crystallized, and spatial intelligence: Testing the
P-FIT model. Intelligence, 37, 124-135. doi: 10.1016/j.intell.2008.07.007
Compte, A. & Bridges, J.H. (Trans.). (2009). A general view of positivism. New York, NY:
Cambridge University Press.
Connell, M. W., Sheridan, K., & Gardner, H. (2003). On abilities and domains. In Sternberg,
R.J., & Grigorenko, E. L. (Eds.) (2003). The psychology of abilities, competencies, and
expertise. New York, NY: Cambridge University Press.
Conoley. J. C. & Impara, J. C. (Eds.). (1993). The twelfth mental measurements yearbook with
tests in print. Lincoln, NE: Buros Center for Testing.
Darwin, C., & Beer, G. (Ed.) (2008). On the origin of species. New York, NY: Oxford
University Press.
Deary, I. J., Penke, L., & Johnson, W. (2010). The neuroscience of human intelligence
differences. Nature Reviews. Neuroscience, 11, 201-211. doi:10.1038/nrn2793
Detterman, D. K. (1982). Does “g” exist? Intelligence, 6, 99–108. doi:10.1016/0160-
2896(82)90008-3
DiStefano, C. & Hess, B. (2005). Using confirmatory factor analysis for construct validation: An
empirical review. Journal of Psychoeducational Assessment, 23, 225–241.
doi:10.1177/073428290502300303
Douglas, O., Burton, K. S., & Reese-Durham, N. (2008). The effects of the M.I. teaching
strategy on the academic achievement of eighth grade math students. Journal of
Instructional Psychology, 35, 182-187.
Duckworth, A. L., Quinn, P. D., Lynam, D. R., Loeber, R., & Stouthamer-Loeber, M. (2011).

FLUID AND CRYSTALLIZED G VS. M.I.: SEM OF HUMAN INTELLIGENCE 178
Role of test motivation in intelligence testing. Proceedings of the National Academy of
Sciences, 108, 7716–7720. doi:10.1073/pnas.1018601108
EBSCO Publishing, Inc. (2016). EBSCOhost. [Web].
Ellis, R. J., Norton, A. C., Overy, K., Winner, E., Alsop, D. C., & Schlaug, G. (2012).
Differentiating maturational and training influences on fMRI activation during music
processing. NeuroImage, 60, 1902–1912. doi:10.1016/j.neuroimage.2012.01.138
Epstein, R. (1984). The principle of parsimony and some applications in psychology. The
Journal of Mind and Behavior, 5, 119-130
Epstein, R. (2008). Parahippocampal and retrosplenial contributions to human spatial
navigation. Trends in Cognitive Sciences, 12, 388–396. doi:10.1016/j.tics.2008.07.004
Epstein, R., Harris, A., Stanley, D., & Kanwisher, N. (1999). The parahippocampal place area:
Recognition, navigation, or encoding? Neuron, 23, 115-125. doi:10.1016/S0896-
6273(00)80758-8
Fedorenko, E., Duncan, J., & Kanwisher, N. (2012). Language-selective and domain-general
regions lie side by side within Broca’s area. Current Biology, 22, 2059–2062.
doi:10.1016/j.cub.2012.09.011
Feldman, D.H. (2003). The creation of M.I. Theory: A study in high-level
thinking. In Sawyer, R. K. (2003). Creativity and Development. New York, NY: OUP
Premium.
Flavell, J. H., Miller, P. H., & Miller, S. A. (2002). Cognitive development (4thed.). Upper
Saddle River, NJ: Prentice-Hall.
Flynn, J. R. (1998). IQ gains over time: Toward finding the causes. In Neisser, Ed. (1998). The

FLUID AND CRYSTALLIZED G VS. M.I.: SEM OF HUMAN INTELLIGENCE 179
Rising Curve: Long-Term Gains in IQ and Related Measures, 25–66. Washington, D.C.:
American Psychological Association.
Gagné, F., & St Père, F. (2002). When IQ is controlled, does motivation still predict
achievement? Intelligence, 30(1), 71–100. doi:10.1016/s0160-2896(01)00068-x
Gagné, R. M. (1972). Domains of learning. Interchange, 3, 1–8. doi:10.1007/bf02145939
Gardner, H. (1983). Frames of mind: The Theory of M.I. (1st Edition). New York, NY: Basic
Books.
Gardner (1995). Reflections on M.I.s: Myths and messages. The Phi Delta Kappan, 3, 200-203,
206-209.
Gardner, H. (1999). Intelligence Reframed: M.I. for the 21st Century. New York, NY, USA:
Basic Books.
Gardner, H. (2004). Debating the g Factor. Wilson Quarterly, 28(4), 4. Available from
http://www.ebscohost.com/.
Gardner, H. (2006). M.I.: New Horizons. New York: Basic Books.
Gardner, H. (2006). On failing to grasp the core of MI Theory: A response to Visser et al.
Intelligence, 34, 503–505. doi:10.1016/j.intell.2006.04.002
Gardner, H. (2011). Frames of mind: The Theory of M.I. (3rd Edition). New York, NY: Basic
Books.
Gardner, H., & Connell, M. (2000). Response to Nicholas Allix. Australian Journal of
Education, 44(3), 288. doi: 0.1177/000494410004400307
Gardner, H. & Krechevsky, M. (2006). Nurturing intelligence in early childhood. In Gardner
(2006). M.I.: New horizons. New York, NY: Basic Books.
Gardner, H., & Moran, S. (2006). The science of M.I. Theory: A response to Lynn Waterhouse.

FLUID AND CRYSTALLIZED G VS. M.I.: SEM OF HUMAN INTELLIGENCE 180
Educational Psychologist, 41, 227-232. doi:10.1207/s15326985ep4104_2
Geake, J. G., & Hansen, P. C. (2010). Functional neural correlates of fluid and crystallized
analogizing. NeuroImage, 49, 3489–3497. doi:10.1016/j.neuroimage.2009.09.008
Geisinger, K. F, Spies, R. A., Carlson, J. F., & Plake, B. S. (Eds.) (2007), The seventeenth mental
measurements yearbook with tests in print. Lincoln, NE: Buros Center for Testing.
Gerald, J. H., & George, S. H. (2010). Self-report: Psychology’s four-letter word.
American Journal of Psychology, 123, 181-188. doi: 10.5406/amerjpsyc.123.2.0181
Ghisletta, P., Rabbitt, P., Lunn, M., & Lindenberger, U. (2012). Two thirds of the age-based
changes in Fluid and Crystallized intelligence, perceptual speed, and memory in
adulthood are shared. Intelligence, 40, 260–268. doi:10.1016/j.intell.2012.02.008
Gignac, G. E. (2006). Evaluating subtest “g” saturation levels via the single trait-correlated
uniqueness (STCU) SEM approach: Evidence in favor of crystallized subtests as the best
indicators of “g.” Intelligence, 34(1), 29–46. doi:10.1016/j.intell.2005.06.001
Google (2015, 2016). Google Scholar. Retrieved from http://scholar.google.com/.
Gross, C. G. (1995). Aristotle on the brain. The Neuroscientist, 1, 245-250.
doi: 10.1177/107385849500100408
Guilford, J. P. (1956). The structure of intellect. Psychological Bulletin, 53, 267–293.
doi:10.1037/h0040755
Hafting, T., Fyhn, M., Molden, S., Moser, M.-B., & Moser, E. I. (2005). Microstructure of a
spatial map in the entorhinal cortex. Nature, 436, 801–806. doi:10.1038/nature03721
Hakstian, A. R., & Cattell, R. B. (1978). Higher-stratum ability structures on a basis of twenty
primary abilities. Journal of Educational Psychology, 70, 657. doi:
10.1037/0022-0663.70.5.657

FLUID AND CRYSTALLIZED G VS. M.I.: SEM OF HUMAN INTELLIGENCE 181
Henderson, J. M., Zhu, D. C., & Larson, C. L. (2011). Functions of parahippocampal place area
and retrosplenial cortex in real-world scene analysis: An fMRI study. Visual Cognition,
19, 910–927. doi:10.1080/13506285.2011.596852
Henson, R. K. & Roberts, J.K. (2006). Use of exploratory factor analysis in published research:
Common errors and some comment on improved practice. Educational and
Psychological Measurement, 66, 393–416. doi:10.1177/0013164405282485
Higgins, L. T., & Xiang, G. (2009). The development and use of intelligence tests in China.
Psychology & Developing Societies, 21, 257–275. doi:10.1177/097133360902100205
Hoelter, J. W. (1983). The analysis of covariance structures: Goodness-of-fit indices.
Sociological Methods & Research, 11, 325–344. doi:10.1177/0049124183011003003
Holzinger, K. J., & Swineford, F. (1937). The bi-factor method. Psychometrika, 2, 41–54.
doi:10.1007/bf02287965
Horn, J. L., & Cattell, R. B. (1966). Refinement and test of the Theory of Fluid and Crystallized
general intelligence. Journal of Educational Psychology, 57, 253-270.
doi:10.1037/h0023816
Horn, J. L., & Cattell, R. B. (1967). Age differences in fluid and crystallized intelligence. Acta
Psychologica, 26, 107–129. doi:10.1016/0001-6918(67)90011-x
Horn, J. L., & Noll, J. (1997). Human cognitive capabilities: Gf-Gc Theory. In Flanagan, D.P.
(Ed), Genshaft, J.L. (Ed), Harrison, P.L. (Ed) (1997). Contemporary intellectual
assessment: Theories, tests, and issues. (p. 53-91). New York, NY: Guilford Press.
Hu, L., & Bentler, P. M. (1999). Cutoff criteria for fit indexes in covariance structure analysis:
Conventional criteria versus new alternatives. Structural Equation Modeling: A
Multidisciplinary Journal, 6, 1–55. doi:10.1080/10705519909540118

FLUID AND CRYSTALLIZED G VS. M.I.: SEM OF HUMAN INTELLIGENCE 182
Hume, D. (2007). Enquiry concerning human understanding. Oxford, GB: Oxford University
Press.
IBM (2015). SPSS 23 premium statistics gradpack with AMOS.
Jackson, D. N., & Rushton, J. P. (2006). Males have greater g: Sex differences in general mental
ability from 100,000 17- to 18-year-olds on the Scholastic Assessment Test. Intelligence,
34, 479–486. doi:10.1016/j.intell.2006.03.005
Johnson, W. & Bouchard, T.J. (2005). The structure of human intelligence: It is verbal,
perceptual, and image rotation (VPR), not Fluid and Crystallized. Intelligence, 33, 393–
416. doi:10.1016/j.intell.2004.12.002
Johnson, W., Bouchard, T. J., Krueger, R. F., McGue, M., & Gottesman, I. I. (2004). Just one g:
consistent results from three test batteries. Intelligence, 32, 95–107.
doi:10.1016/s0160-2896(03)00062-x
Johnson, W., Nijenhuis, J. te, & Bouchard, T. J. (2008). Still just 1 g: Consistent results from
five test batteries. Intelligence, 36, 81–95. doi:10.1016/j.intell.2007.06.001
Jung, R. E., & Haier, R. J. (2007). The parieto-frontal integration Theory (P-FIT) of
intelligence: Converging neuroimaging evidence. Behavioral and Brain Sciences, 30,
135-154. doi:10.1017/s0140525x07001185
Kan, K.-J., Kievit, R. A., Dolan, C., & Van der Maas, H. (2011). On the interpretation of the
CHC factor Gc. Intelligence, 39, 292–302. doi:10.1016/j.intell.2011.05.003.
Kaufman, A. S., & Horn, J. L. (1996). Age changes on tests of Fluid and Crystallized ability for
women and men on the Kaufman adolescent and adult intelligence test (KAIT) at ages
17-94 years. Archives of Clinical Neuropsychology, 11, 97–121.
doi:10.1093/arclin/11.2.97

FLUID AND CRYSTALLIZED G VS. M.I.: SEM OF HUMAN INTELLIGENCE 183
Kaufman, A. S., & Kaufman, N. L. (1993). Kaufman adolescent and adult intelligence test. In
Conoley. J.C. & Impara, J.C. (Eds.). (1993). The twelfth mental measurements yearbook with
tests in print. Lincoln, NE: Buros Center for Testing.
Kaufman, A. S., Reynolds, C. R., & McLean, J. E. (1989). Age and WAIS-R intelligence in a
national sample of adults in the 20- to 74-year age range: A cross-sectional analysis with
educational level controlled. Intelligence, 13, 235–253. doi:10.1016/0160-
2896(89)90020-2
Keith, T. Z., & Reynolds, M. R. (2012). Using confirmatory factor analysis to aid in
understanding the constructs measured by intelligence tests. In Flanagan, D.P., Harrison,
P.L. (Eds.). (2012). Contempory intellectual assessment: theories, tests, and issues (3rd
edition). New York, NY.: Guilford Press.
Keith, T. Z., & Reynolds, M. R. (2010). Cattell–Horn–Carroll abilities and cognitive tests: What
we've learned from 20 years of research. Psychology in the Schools, 47, 635-650. doi:
10.1002/pits.20496
Kenny, D. A., Kashy, D., & Bolger, N. (1998). Data analysis in social psychology. In D. Gilbert,
S. Fiske, and G. Lindzey (Eds.), Handbook of social psychology (4th edition), pp. 233-
265). New York: McGraw-Hill.
Kline, R. B. (2011). Principles and practice of structural equation modeling, (3rd edition). New
York, NY: The Guilford Press.
Knutson, K. M., McClellan, E. M., & Grafman, J. (2008). Observing social gestures: An fMRI
study. Experimental Brain Research, 188, 187–198. doi:10.1007/s00221-008-1352-6
Kvist, A. V., & Gustafsson, J. E. (2008). The relation between fluid intelligence and the general

FLUID AND CRYSTALLIZED G VS. M.I.: SEM OF HUMAN INTELLIGENCE 184
factor as a function of cultural background: A test of Cattell's investment theory.
Intelligence, 36, 422-436. doi:10.1016/j.intell.2007.08.004
Lehalle, H. (2006). Cognitive development in adolescence: Thinking freed from concrete
constraints. In Jackson, S. & Gossens, L. (Eds.), Handbook of adolescent development.
New York, NY: Psychology Press.
Lieberman, M. D., Jarcho, J. M., & Satpute, A. B. (2004). Evidence-based and intuition-based
self-knowledge: an FMRI study. Journal of Personality and Social Psychology, 87, 421.
doi: 10.1037/0022-3514.87.4.421
Lewis, M., Jaskir, J., & Enright, M. K. (1986). The development of mental abilities in infancy.
Intelligence, 10, 331–354. doi:10.1016/0160-2896(86)90003-6
Lynn, R. (1994). Sex differences in intelligence and brain size: A paradox resolved. Personality
and Individual Differences, 17, 257–271. doi:10.1016/0191-8869(94)90030-2
Lynn, R. (1999). Sex differences in intelligence and brain size: A developmental theory.
Intelligence, 27, 1–12. doi:10.1016/s0160-2896(99)00009-4
MacCallum, R. C., Widaman, K. F., Zhang, S., & Hong, S. (1999). Sample size in factor
analysis. Psychological Methods, 4, 84–99. doi:10.1037/1082-989x.4.1.84
Mahalanobis, P. C. (1936). On the generalized distance in statistics. Proceedings of the National
Institute of Sciences (Calcutta), 2, 49-55.
Major, J. T., Johnson, W., & Deary, I. J. (2012). Comparing models of intelligence in Project
TALENT. Intelligence, 40, 543–559. doi:10.1016/j.intell.2012.07.006
Maruyama, G.M. (1998). Basics of structural equation modeling. Thousand Oaks, CA: Sage
Publications.
Marsh, H. W., & Hocevar, D. (1985). Application of confirmatory factor analysis to the study of

FLUID AND CRYSTALLIZED G VS. M.I.: SEM OF HUMAN INTELLIGENCE 185
self-concept: First- and higher order factor models and their invariance across groups.
Psychological Bulletin, 97, 562–582. doi:10.1037/0033-2909.97.3.562
Marsh, H. W., & Shavelson, R. (1985). Self-concept: Its multifaceted, hierarchical structure.
Educational Psychologist, 20, 107–123. doi:10.1207/s15326985ep2003_1
Maschke, M. (2003). Dysfunction of the basal ganglia, but not the cerebellum, impairs
kinaesthesia. Brain, 126, 2312–2322. doi:10.1093/brain/awg230
McGrew, K. S. (2009). CHC Theory and the human cognitive abilities project: Standing on the
shoulders of the giants of psychometric intelligence research. Intelligence, 37, 1-10.
doi:10.1016/j.intell.2008.08.004
McGrew, K. S., Flanagan, D. P., Keith, T. Z., & Vanderwood, M. (1997). Beyond g: The impact
of Gf-Gc specific cognitive abilities research on the future use and interpretation of
intelligence tests in the schools. School Psychology Review.
McKeachie, W. J. (1986). Teaching and learning in the college classroom: A review of the
research literature, 86. University of Michigan Press.
Mitchell, J. P., Banaji, M. R. & Macrae, C. N. (2005). General and specific contributions of the
medial prefrontal cortex to knowledge about mental states. Neuroimage 28, 757–762. doi:
10.1016/j.neuroimage.2005.03.011
Mitchell, J. P., Heatherton, T. F., & Macrae, C. N. (2002). Distinct neural systems subserve
person and object knowledge. Proceedings of the National Academy of Sciences, 99,
15238–15243. doi:10.1073/pnas.232395699
Nyborg, H. (2005). Sex-related differences in general intelligence g, brain size, and social status.
Personality and Individual Differences, 39, 497–509. doi:10.1016/j.paid.2004.12.011
O’Grady, W., Archibald, J., Aronoff, M., & Rees-Miller, J. (2010). Contemporary linguistics: An

FLUID AND CRYSTALLIZED G VS. M.I.: SEM OF HUMAN INTELLIGENCE 186
introduction (6th). Boston, MA: Bedford/St. Martin’s.
Organisation for Economic Co-operation and Development. (2007). Understanding the brain:
The birth of a learning science. Paris, France: Organisation for Economic Co-operation
and Development.
Peretz, I., Gagnon, L., Hebert, S., & Macoir, J. (2004). Singing in the brain: Insights
from cognitive neuropsychology. Music Perception, 21, 373–390.
doi:10.1525/mp.2004.21.3.373
Piaget, J. (1999). The psychology of intelligence. London, England: Routledge.
Pietschnig, J., & Voracek, M. (2015). One Century of Global IQ Gains: A Formal Meta-Analysis
of the Flynn Effect (1909-2013). Perspectives on Psychological Science, 10, 282–306.
doi:10.1177/1745691615577701
Princiotta, D., & Goldstein, S. (2014). Intelligence as a Conceptual Construct: The Philosophy of
Plato and Pascal. In Goldstein, S., Princiotta, D., Naglieri, J., (2014). Handbook of
Intelligence, New York, NY: Springer.
PsychTests AIM. Inc. (2011a). Assessment of Multiple Intelligence. In Carlson, J.F.,
Geisinger, K.F., & Jonson, J.L. (Eds.) (2014). The nineteenth mental measurements
yearbook with tests in print. Lincoln, NE: Buros Center for Testing.
PsychTests AIM Inc. (2011b). Multi-dimensional intelligence test. In Carlson, J.F.,
Geisinger, K.F., & Jonson, J.L. (Eds.) (2014). The nineteenth mental measurements
yearbook with tests in print. Lincoln, NE: Buros Center for Testing.
Ratcliff, R. (1993). Methods for dealing with reaction time outliers. Psychological Bulletin, 114,
510-532. doi:10.1037/0033-2909.114.3.510
Raykov, T., Marcoulides, G. A. (2008). An introduction to applied multivariate analysis. New

FLUID AND CRYSTALLIZED G VS. M.I.: SEM OF HUMAN INTELLIGENCE 187
York, NY: Routledge Taylor & Francis Group.
Rencher, A. C.; Christensen, W. F. (2012). Methods of Multivariate Analysis (3rd). Hoboken,
NJ: John Wiley & Sons, Inc.
Reynolds, C. R. (2014a). Reynolds Adaptable Intelligence Test. In Carlson, J.F.,
Geisinger, K. F., & Jonson, J. L. (Eds.) (2014). The twentieth mental measurements yearbook
with tests in print. Lincoln, NE: Buros Center for Testing.
Reynolds, C. R. (2014b). Reynolds Adaptable Intelligence Test: Professional Manual. Lutz, FL.:
PAR.
Roeckelein, J. (Ed.). (2006). Galton’s laws. Elsevier’s dictionary of psychological theories.
Oxford, U.K.: Elsevier Science & Technology.
Rodgers, J. L. (1998). A critique of the Flynn Effect: massive IQ gains, methodological artifacts,
or both? Intelligence, 26, 337–356. doi:10.1016/s0160-2896(99)00004-5
Salthouse, T. A., Pink, J. E., & Tucker-Drob, E. M. (2008). Contextual analysis of Fluid
intelligence. Intelligence, 36, 464–486. doi:10.1016/j.intell.2007.10.003
Schneider, P., Scherg, M., Dosch, H. G., Specht, H. J., Gutschalk, A., & Rupp, A. (2002).
Morphology of Heschl's gyrus reflects enhanced activation in the auditory cortex of
musicians. Nature Neuroscience, 5, 688-694.
Schrank, F. A., McGrew, K. S., Mather, N., Wendling, B. J., & Dailey, D. (2014). Woodcock-
Johnson IV. In Carlson, J.F., Geisinger, K.F., & Jonson, J.L. (Eds.) (2014). The twentieth
mental measurements yearbook with tests in print. Lincoln, NE: Buros Center for
Testing.
Schroeders, U., Schipolowski, S., & Wilhelm, O. (2015). Age-related changes in the mean and

FLUID AND CRYSTALLIZED G VS. M.I.: SEM OF HUMAN INTELLIGENCE 188
covariance structure of Fluid and Crystallized intelligence in childhood and adolescence.
Intelligence, 48, 15-29. doi: 10.1016/j.intell.2014.10.006
Shearer, C. B. (2005). Large scale factor analysis of the M.I.D.A.S... In Annual Meeting of the
American Educational Research Association (AERA). Montreal, Quebec, Canada.
Shearer, C. B. (2007). The M.I.D.A.S.: A professional manual. Kent, OH: M.I. Research and
Consulting.
Shearer, C. B. (2009). MI at 25: Assessing the impact and future of M.I. for teaching and
learning. New York, NY: Teachers College Press.
Shearer, C. B. (2011). M.I.D.A.S.: Multiple Intelligence Developmental Assessment Scales (The)
[Revised]. In Geisinger, K.F, Spies, R.A., Carlson, J.F. & Plake, B.S. (Eds.) (2007), The
seventeenth mental measurements yearbook with tests in print. Lincoln, NE: Buros
Center for Testing.
Shearer, C. B. (2012a). An inter-rater reliability study of a self-assessment for the M.I..
International Journal of Psychological Studies, 4. doi:10.5539/ijps.v4n3p131
Shearer, C. B. (2012b). Cross cultural factor analytic studies of a M.I. self-assessment.
International Journal of Educational and Psychological Assessment, 12.
Shearer, C. B., & Luzzo, D. A. (2009). Exploring the application of M.I. theory to career
counseling. Career Development Quarterly, 58, 3-13. doi:10.1002/j.2161-
0045.2009.tb00169.x
Shipley, W., Gruber, C., Martin, T., Klein, A. (2009). Shipley-2. In Spies, R. A., Carlson, J. F. &
Geisinger, K. F. (Eds.) (2010). The eighteenth mental measurements yearbook with tests
in print. Lincoln, NE: Buros Center for Testing.
Slevc, L. R., & Okada, B. M. (2015). Processing structure in language and music: A case for

FLUID AND CRYSTALLIZED G VS. M.I.: SEM OF HUMAN INTELLIGENCE 189
shared reliance on cognitive control. Psychonomic Bulletin & Review, 22, 637-652. doi:
10.3758/s13423-014-0712-4
Spearman, C. (1904). “General intelligence,” objectively determined and measured. The
American Journal of Psychology, 15, 201. doi:10.2307/1412107
Spearman, C. (1914). The Theory of two factors. Psychological Review, 21, 101.
doi:10.1037/h0070799
Spies, R. A. & Plake, B. S. (Eds.) (2005). The sixteenth mental measurements yearbook with
tests in print. Lincoln, NE: Buros Center for Testing.
Steinmayr, R., Beauducel, A., & Spinath, B. (2010). Do sex differences in a faceted model of
fluid and crystallized intelligence depend on the method applied? Intelligence, 38, 101–
110. doi:10.1016/j.intell.2009.08.001
Stern, W., Whipple, G. M. (Trans.). (1914). The psychological methods of testing intelligence.
Baltimore, MD: Warwick & York.
Sternberg, R. J. (1984). Toward a triarchic Theory of human intelligence. Behavior and Brain
Sciences, 7, 269. doi:10.1017/s0140525x00044629
Sternberg, R. J., Conway, B. E., Ketron, J. L., & Bernstein, M. (1981). People's conceptions of
intelligence. Journal of personality and social psychology, 41, 37.doi: 10.1037/0022-
3514.41.1.37
Sternberg, R. J. & Grigorenko, E. L. (2002). The general factor of intelligence: How general is
it? Mahwah, NJ: Lawrence Erlbaum.
Stevenson, A. (Ed.). (2010). Science. In Oxford Dictionary of English (3rd). New York, NY:
Oxford University Press.
Stockwell, C. (October 26, 2014). Same as it ever was: Top ten most popular college majors.

FLUID AND CRYSTALLIZED G VS. M.I.: SEM OF HUMAN INTELLIGENCE 190
USAToday.
Tabachnick, B. G., Fidell, L. S. (2013). Using multivariate statistics. Upper Saddle River,
NJ: Pearson.
Teele, S. (1992). Teele inventory for M.I.. In Spies, R.A. & Plake, B.S. (Eds.). (2005). The
sixteenth mental measurements yearbook with tests in print. Lincoln, NE: Buros Center
for Testing.
Teo, T., Tsai, L. T., & Yang, C.-C. (2013). Applying Structural Equation Modeling (SEM) in
Educational Research. In Khine, M.S. (Ed.) (2013) Application of Structural Equation
Modeling in Educational Research and Practice, 3–21. Rotterdam, The Netherlands:
Sense Publishers.
Thomas, G. (2007). Education and theory: Strangers in paradigms. Buckingham, GB: Open
University Press.
Thorndike, E. L. (1921). On the organization of intellect. Psychological Review, 28, 141-151.
doi: 10.1037/h0070821
Trahan, L. H., Stuebing, K. K., Fletcher, J. M., & Hiscock, M. (2014). The Flynn effect: A meta-
analysis. Psychological Bulletin, 140, 1332–1360. doi:10.1037/a0037173.
Trivers, R. L. (1971). The evolution of reciprocal altruism. Quarterly review of biology, 35-57.
doi: 10.1086/406755
Tucker, L. & Lewis, C. (1973). A reliability coefficient for maximum likelihood factor analysis.
Psychometrika, 38, 1–10. doi: 10.1007/bf02291170
Tucker-Drob, E. M. (2009). Differentiation of cognitive abilities across the life span.
Developmental Psychology, 45, 1097–1118. doi:10.1037/a0015864
Tucker-Drob, E. M., & Briley, D. A. (2014). Continuity of genetic and environmental influences

FLUID AND CRYSTALLIZED G VS. M.I.: SEM OF HUMAN INTELLIGENCE 191
on cognition across the life span: A meta-analysis of longitudinal twin and adoption
studies. Psychological Bulletin, 140, 949-979. doi:10.1037/a0035893
Urbina, S. (2011). Tests of intelligence. In Sternberg, R. J., & Kaufman, S. B. (Eds.) The
Cambridge Handbook of Intelligence, 20-38. New York, NY: Cambridge University
Press.
U.S. Department of Education, Institute of Education Sciences, National Center for Education
Statistics (n.d.). Statistical standards. [Web].
Vanutelli, M. E., & Balconi, M. (2015). Perceiving emotions in human–human and human–
animal interactions: Hemodynamic prefrontal activity (fNIRS) and empathic concern.
Neuroscience Letters, 605, 1–6. doi:10.1016/j.neulet.2015.07.020
Vernon, P. E. (1965). Ability factors and environmental influences. American Psychologist, 20,
723-377. doi: 10.1037/h0021472
Visser, B. A., Ashton, M. C., & Vernon, P. A. (2006a). Beyond g: Putting M.I. theory to the test.
Intelligence, 34, 487–502. doi:10.1016/j.intell.2006.02.004
Visser, B. A., Ashton, M. C., & Vernon, P. A. (2006b). G and the measurement of M.I.: A
response to Gardner. Intelligence, 34, 507–510.
doi:10.1016/j.intell.2006.04.006
Waterhouse, L. (2006a). Inadequate evidence for M.I., Mozart effect, and emotional intelligence
theories. Educational Psychologist, 41, 247–255. doi:10.1207/s15326985ep4104_5
Waterhouse, L. (2006b). M.I., the Mozart effect, and emotional intelligence: A critical review.
Educational Psychologist, 41, 207–225. doi:10.1207/s15326985ep4104_1
Wendelken, C. (2015). Meta-analysis: how does posterior parietal cortex contribute to
reasoning? Frontiers in Human Neuroscience, 8. doi:10.3389/fnhum.2014.01042.

FLUID AND CRYSTALLIZED G VS. M.I.: SEM OF HUMAN INTELLIGENCE 192
Willis, J. O., Dumont, R., & Kaufman, A. S. (2011). Factor-analytic models of intelligence. In
Sternberg, R. J., & Kaufman, S. B. (Eds.) (2011). The Cambridge Handbook of
Intelligence, 39–57. New York, NY: Cambridge University Press.
Wechsler, D. (1939). The measurement of adult intelligence. Philadelphia, PA: Williams &
Wilkins.
Wechsler, D. (1944). The measurement of adult intelligence (3rd ed.). Baltimore, MD, US:
Williams & Wilkins Co.
Wechsler, D. (2008). Wechsler adult intelligence scale—Fourth edition. San Antonio, TX:
Pearson.
Wheaton, B., Muthen, B., Alwin, D. F., & Summers, G. F. (1977). Assessing reliability and
stability in panel models. Sociological Methodology, 8, 84-136. doi:10.2307/270754
White, L. A. (2007). Evolution of culture: The development of civilization to the fall of
Rome. Walnut Creek, CA: Left Coast Press.
Wonderlic, E. F. (2002). Wonderlic personnel test. Libertyville, Ill: Wonderlic.
Woodcock, R. W., McGrew, K. S., Mather, N., & Schrank, F. A. (1977). In Plake, B.S., Impara,
J.C., & Spies, R.A. (Eds.) (2003). The fifteenth mental measurements yearbook.
Lincoln, NE: Buros Center for Testing.

FLUID AND CRYSTALLIZED G VS. M.I.: SEM OF HUMAN INTELLIGENCE 193