running head: corresponding author: address: telephone: email
TRANSCRIPT
1
Running Head:
The pollen tube actin fringe and pectin deposition
Corresponding Author:
Peter K. Hepler
Address:
Biology Department, University of Massachusetts, Amherst, MA 01003
Telephone:
413-545-2083
Email:
Research Area:
Cell Biology
Plant Physiology Preview. Published on July 18, 2014, as DOI:10.1104/pp.114.242974
Copyright 2014 by the American Society of Plant Biologists
www.plantphysiol.orgon February 1, 2018 - Published by Downloaded from Copyright © 2014 American Society of Plant Biologists. All rights reserved.
2
Title:
The apical actin fringe contributes to localized cell wall deposition and polarized growth in the lily
pollen tube
Authors:
Caleb M. Rounds,* Peter K. Hepler,* Lawrence J. Winship†
Institutions:
*Department of Biology, University of Massachusetts, Amherst, MA 01003
†School of Natural Science, Hampshire College, Amherst, MA 01002
One sentence summary:
Inhibition of lily pollen tube growth with three different agents, brefeldin A, latrunculin B and KCN
provides evidence that the apical actin fringe contributes to localized pectin deposition and polarized
cell growth.
www.plantphysiol.orgon February 1, 2018 - Published by Downloaded from Copyright © 2014 American Society of Plant Biologists. All rights reserved.
3
Footnote: This work was supported by the National Science Foundation (http://www.nsf.gov/)
(grant no. MCB-0847876 to P.K.H.). Corresponding author: Peter K. Hepler,
www.plantphysiol.orgon February 1, 2018 - Published by Downloaded from Copyright © 2014 American Society of Plant Biologists. All rights reserved.
4
Abstract
In Lilium formosanum pollen tubes pectin, a major component of the cell wall, is delivered through
regulated exocytosis. The targeted transport and secretion of the pectin containing vesicles may be
controlled by the cortical actin fringe at the pollen tube apex. Here we address the role of the actin
fringe using three different inhibitors of growth: brefeldin A (BFA), latrunculin B (LatB), and
potassium cyanide (KCN). BFA blocks membrane trafficking, and inhibits exocytosis in pollen
tubes; it also leads to the degradation of the actin fringe, and the formation of an aggregate of F-
actin at the base of the clear zone. LatB, which depolymerizes F-actin, markedly slows growth, but
allows focused pectin deposition to continue. Of note, the locus of deposition shifts frequently, and
correlates with changes in the direction of growth. Finally KCN, an electron transport chain
inhibitor, briefly stops growth while causing the actin fringe to completely disappear. Pectin
deposition continues, but lacks focus instead being delivered in a wide arc across the pollen tube tip.
These data support a model in which the actin fringe contributes to the focused secretion of pectin
to the apical cell wall, and thus to the polarized growth of the pollen tube.
www.plantphysiol.orgon February 1, 2018 - Published by Downloaded from Copyright © 2014 American Society of Plant Biologists. All rights reserved.
5
Introduction
Pollen tubes provide an excellent model for studying the molecular and physiological processes that
lead to polarized cell growth. Because all plant cell growth results from the regulated yielding of the
cell wall in response to uniform turgor pressure (Winship et al., 2010; Rojas et al., 2011) the cell wall
of the pollen tube must yield only at a particular spot: the cell apex, or tip. To accomplish the
extraordinary growth rates seen in many species, and to balance the thinning of the apical wall due
to rapid expansion, the pollen tube delivers prodigious amounts of wall material, largely
methoxylated pectins, to the tip in a coordinated manner. Recent studies suggest that the targeted
exocytosis increases the extensibility of the cell wall matrix at the tip, which then yields to the
existing turgor pressure, permitting the tip to extend or grow (McKenna et al., 2009; Hepler et al.,
2013). There are many factors that influence exocytosis in growing pollen tubes; in the current study
we investigate the role of the apical actin fringe.
For many years it has been known that an actin structure exists near the pollen tube tip, yet its exact
form has been a matter of some contention (Kost et al., 1998; Lovy-Wheeler et al., 2005; Wilsen et
al., 2006; Cheung et al., 2008; Vidali et al., 2009; Qu et al., 2013). The apical actin structure has been
variously described as a fringe, a basket, a collar or a mesh. Using rapid freeze fixation of lily pollen
tubes followed by staining with anti-actin antibodies, the structure appears as a dense fringe of
longitudinally oriented microfilaments, beginning 1-5 µm behind the apex and extending 5-10 µm
basally. The actin filaments are positioned in the cortical cytoplasm close to the plasma membrane
(Lovy-Wheeler et al., 2005). More recently we have used Lifeact-mEGFP, a probe that consistently
labels this palisade of longitudinally oriented microfilaments in living cells (Vidali et al., 2009) (Fig.
1A left column). For the purposes of this study, we will refer to this apical organization of actin as a
fringe.
Many lines of evidence demonstrate that actin is required for pollen tube growth. Latrunculin B
(LatB), which blocks actin polymerization, inhibits pollen tube growth and disrupts the cortical
fringe at concentrations as low as 2 nM. Higher concentrations are needed to block pollen grain
germination and cytoplasmic streaming (Gibbon et al., 1999; Vidali et al., 2001). Actin binding
proteins, including, ADF-cofilin, formin, profilin and villin, and signaling proteins, such as ROP
GTPases and their effectors (RICs), have also been shown to play critical roles in growth and
actin dynamics. (Fu et al., 2001; Vidali et al., 2001; Allwood et al., 2002; Chen et al., 2002;
www.plantphysiol.orgon February 1, 2018 - Published by Downloaded from Copyright © 2014 American Society of Plant Biologists. All rights reserved.
6
Cheung and Wu, 2004; McKenna et al., 2004; Gu et al., 2005; Ye et al., 2009; Cheung et al., 2010;
Staiger et al., 2010; Zhang et al., 2010a; van Gisbergen and Bezanilla, 2013; Qu et al., 2013).
Our understanding of the process of exocytosis and pollen tube elongation has been influenced by
ultrastructural images of pollen tube tips, which reveal an apical zone dense with vesicles (Cresti et
al., 1987; Heslop-Harrison, 1987; Lancelle et al., 1987; Steer and Steer, 1989; Lancelle and Hepler,
1992; Derksen et al., 1995). It has long been assumed that these represent exocytotic vesicles
destined to deliver new cell wall material. This model of polarized secretion has been challenged in
recent years in studies using FM dyes. Two groups have suggested that exocytosis occurs in a
circumpolar annular zone (Bove et al., 2008; Zonia and Munnik, 2008). However, other studies,
using fluorescent beads attached to the cell surface, indicate that the maximal rate of expansion, and
of necessity the greatest deposition of the cell wall material, occurs at the apex along the polar axis
of the tube (Dumais et al., 2006; Rojas et al., 2011). Similarly our experiments with propidium
iodide (PI) (1992; McKenna et al., 2009; Rounds et al., 2011a) and pectin methyl esterase fused to
GFP (McKenna et al., 2009) show that the wall is thickest at the very tip, and suggest that wall
materials are deposited at the polar axis consistent with the initial model of exocytosis (Lancelle and
Hepler, 1992). Experiments using tobacco pollen and a receptor-like-kinase fused to GFP, also
indicate that exocytosis occurs largely at the apical polar axis (Lee et al., 2008).
Many researchers argue that apical actin is critical for exocytosis (Lee et al., 2008; Cheung et al.,
2010; Qin and Yang, 2011; Yan and Yang, 2012). More specifically, recent work suggests that the
fringe participates in targeting vesicles, and thereby contributes to changes in growth direction.
(Kroeger et al., 2009; Bou Daher and Geitmann, 2011; Dong et al., 2012). In the current report,
using three different inhibitors, namely brefeldin A (BFA), latrunculin B (LatB) and potassium
cyanide (KCN), we test the hypothesis that polarized pectin deposition in pollen tubes requires the
actin fringe. Our data show that during normal growth pectin deposition is focused to the apex
along the polar axis of the tube. However, when growth is modulated different endpoints arise
depending on the inhibitor. With BFA, exocytosis completely stops, and the fringe disappears, with
the appearance of an actin aggregate at the base of the clear zone. LatB, as shown previously (Vidali
et al., 2009), incompletely degrades the actin fringe and leaves a rim of F-actin around the apical
dome. Here we show that in the presence of LatB pectin deposition continues with the focus of this
activity shifting in position frequently as the slowly elongating pollen tube changes direction. With
www.plantphysiol.orgon February 1, 2018 - Published by Downloaded from Copyright © 2014 American Society of Plant Biologists. All rights reserved.
7
KCN, the actin fringe degrades completely, but exocytosis continues, and becomes depolarized with
pectin deposits now occurring across a wide arc of the apical dome. This dome often swells as
deposition continues, only stopping once normal growth resumes. Taken together these results
support a role for the actin fringe in controlling the polarity of growth in the lily pollen tube.
Results
The fringe and the thickened tip are stable yet dynamic
Although the cell wall at the pollen tube tip oscillates in thickness (McKenna et al., 2009), it is
important to recognize, that even at its thinnest point the apical cell wall always remains thicker than
the cell wall along the shank. We monitor the changes in wall thickness using the fluorescent signal
from propidium iodide (PI), with which the pollen tubes have been stained. The efficacy of this
approach is based on the studies of McKenna et al. (2009) showing that the changes in PI
fluorescence are virtually identical to the changes in cell wall thickness measured by light microscopy
during oscillatory growth in the same lily pollen tubes. Subsequently the same group determined in
tobacco pollen tubes that the changes in PI fluorescence closely matched the fluorescent signal
derived from the secretion of pectin methyl esterase fused with GFP (McKenna et al., 2009).
Finally, in more recent work Rounds et al. (2011a) established that PI competes with Ca2+ in binding
to de-methoxylated pectin. We conclude from these studies that PI binds pectin and that it
faithfully indicates the appearance of new cell wall material. PI fluorescence thus serves as a
sensitive marker for pectin deposition in pollen tubes (Fig. 1A right column, Video S2) (Rounds et
al., 2011a).
As a first step in testing our hypothesis that the actin fringe regulates pectin deposition, we asked
whether there was a corresponding change in the fringe that reflected cell wall dynamics during
growth. To image actin in lily pollen tubes expressing Lifeact-mEGFP (Vidali et al., 2009), we used
spinning disc confocal microscopy. The improved time resolution of the spinning disc confocal
microscope relative to the conventional laser scanning confocal microscope permits us to obtain an
image of both the longitudinal filaments along the shank (Fig. 1 A left column, Video S1) and the
apical actin fringe at close time intervals. A kymographic analysis of the pollen tube shown in Fig.
www.plantphysiol.orgon February 1, 2018 - Published by Downloaded from Copyright © 2014 American Society of Plant Biologists. All rights reserved.
8
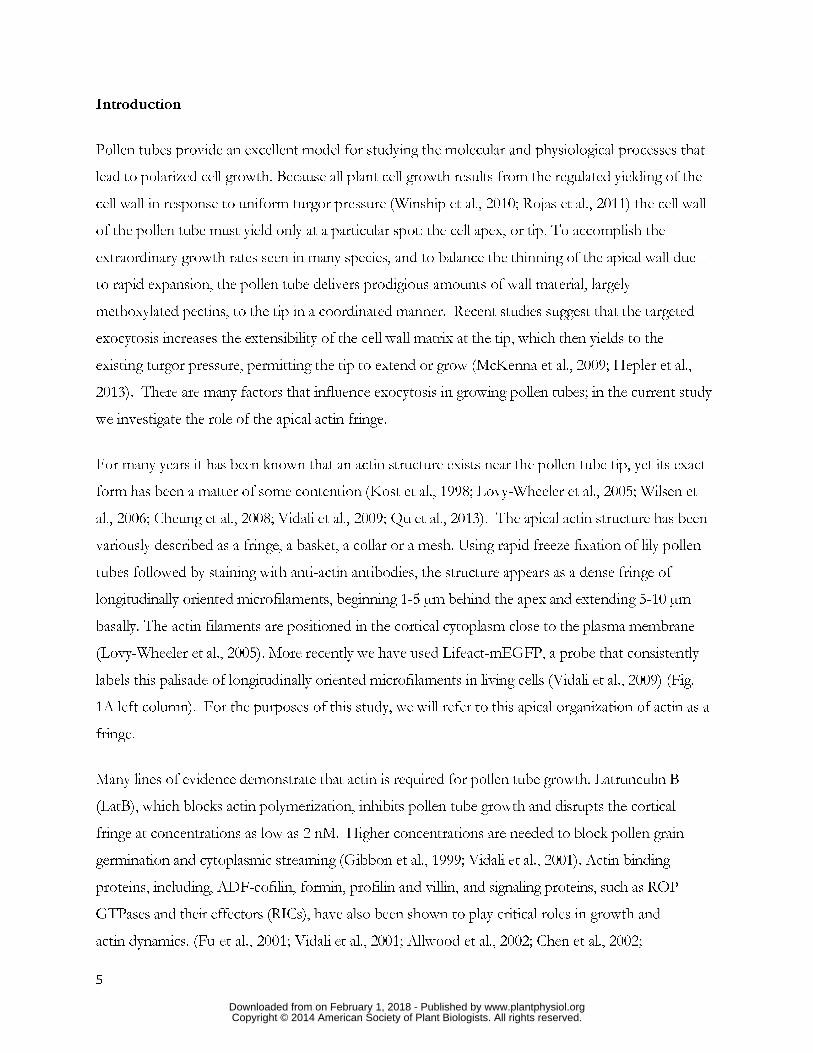
1B documents the constancy of the fringe over time. In the kymograph a subtle line runs
immediately behind the tip (Fig. 1B arrow). Its slope closely matches that of the tip itself, indicating
that the fringe maintains a stable position relative to the tip despite the constant growth.
Actin filaments have been shown to be dynamic in plant cells (Blanchoin et al., 2010). To examine
whether the actin fringe is composed of stable filaments, we overlaid the first three images of the
series shown in Figure 1A. Each image was given a different color, and then the images were
superimposed on one another. Areas with coincident actin appear white, whereas areas with no
coincident actin appear in one of the individual colors. Because very few white domains are seen,
we conclude that although the structure of the actin fringe as a whole is stable, the individual
microfilaments are constantly changing.
BFA blocks exocytosis and destroys the actin fringe
The fungal macrocyclic lactone brefeldin A (BFA) blocks the activity of an Arf GEF, ultimately
resulting in inhibition of membrane trafficking (Nebenführ et al., 2002). Previous studies on pollen
tubes have established that the drug halts pollen tube growth and dramatically alters vesicle
trafficking. Recent data in particular indicate that both endo- and exocytosis are affected (Rutten and
Knuiman, 1993; Parton et al., 2003; Hörmanseder et al., 2005; Wang et al., 2005; Zhang et al.,
2010b). None of these studies actually examined deposition, instead focusing on internal membrane
markers and membrane associated proteins. BFA also alters the actin cytoskeleton, specifically
disrupting the apical actin structure in Arabidopsis pollen tubes (Zhang et al., 2010b). Earlier work
on lily pollen tubes showed that the addition of BFA led to the appearance of a cytoplasmic
aggregate behind the tip, called the BFA Induced Aggregate, or BIA (Parton et al. 2001, 2003). It
was further shown that the formation of the BIA depended on an intact actin cytoskeleton, because
anti actin drugs, including cytochalasin and jasplakinolide, either blocked or dispersed the formation
of the BIA. Zhang et al. (2010b) describe a dissipation of apical actin, whereas Parton et al. (2003)
documented the appearance of an actin dependent structure. These two descriptions are in some
ways contradictory. We wished to further investigate the effects of BFA directly on the fringe in lily
pollen tubes.
We asked what happens to the structure and distribution of apical actin and to changes in cell wall
pectin deposition in pollen tubes treated with BFA. As the drug takes effect growth slows and PI
www.plantphysiol.orgon February 1, 2018 - Published by Downloaded from Copyright © 2014 American Society of Plant Biologists. All rights reserved.
9
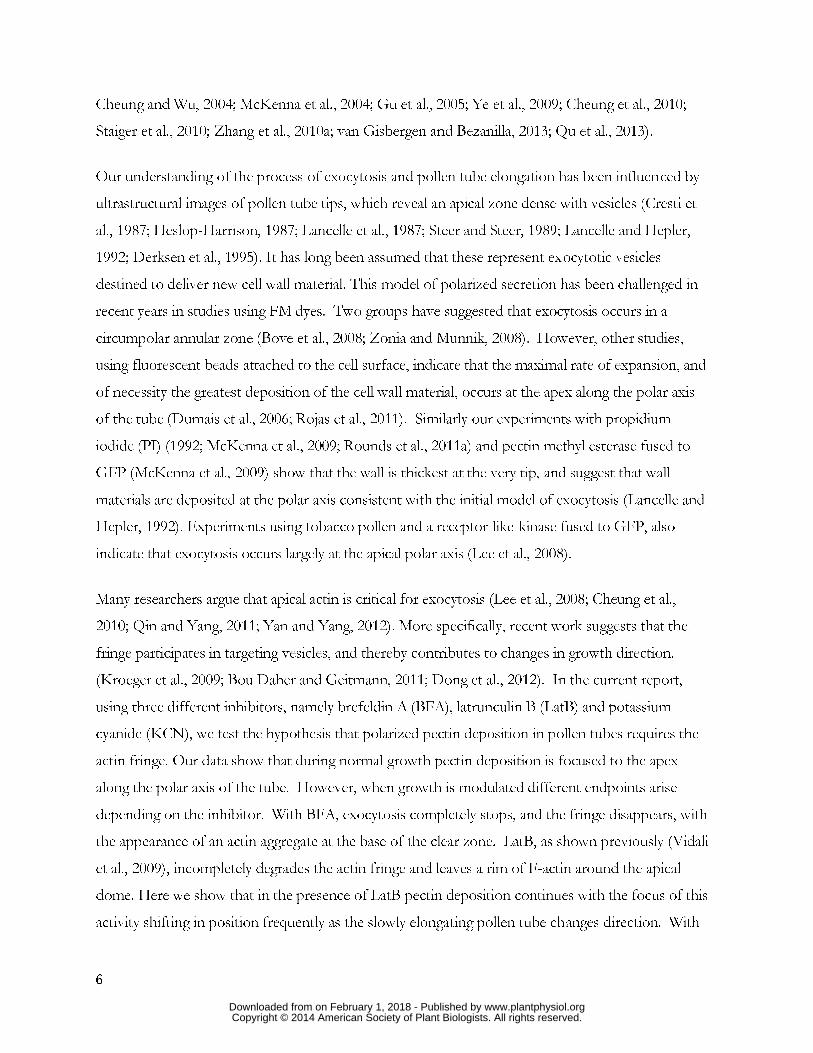
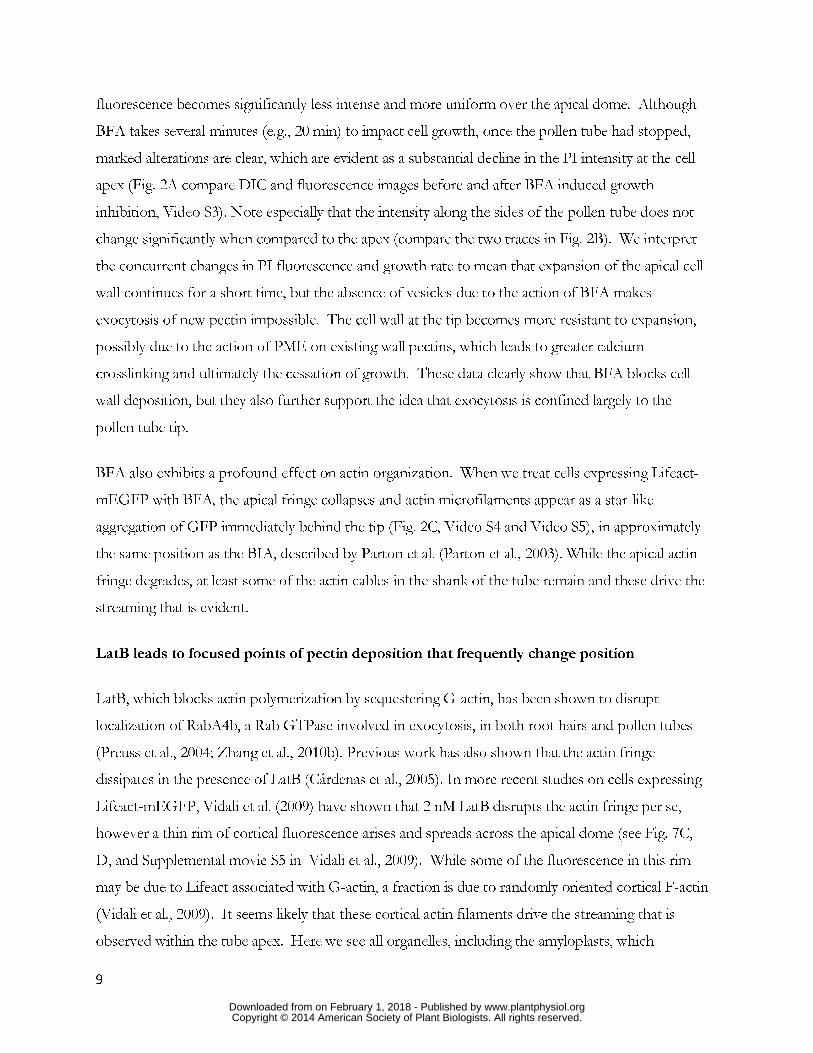
fluorescence becomes significantly less intense and more uniform over the apical dome. Although
BFA takes several minutes (e.g., 20 min) to impact cell growth, once the pollen tube had stopped,
marked alterations are clear, which are evident as a substantial decline in the PI intensity at the cell
apex (Fig. 2A compare DIC and fluorescence images before and after BFA induced growth
inhibition, Video S3). Note especially that the intensity along the sides of the pollen tube does not
change significantly when compared to the apex (compare the two traces in Fig. 2B). We interpret
the concurrent changes in PI fluorescence and growth rate to mean that expansion of the apical cell
wall continues for a short time, but the absence of vesicles due to the action of BFA makes
exocytosis of new pectin impossible. The cell wall at the tip becomes more resistant to expansion,
possibly due to the action of PME on existing wall pectins, which leads to greater calcium
crosslinking and ultimately the cessation of growth. These data clearly show that BFA blocks cell
wall deposition, but they also further support the idea that exocytosis is confined largely to the
pollen tube tip.
BFA also exhibits a profound effect on actin organization. When we treat cells expressing Lifeact-
mEGFP with BFA, the apical fringe collapses and actin microfilaments appear as a star-like
aggregation of GFP immediately behind the tip (Fig. 2C, Video S4 and Video S5), in approximately
the same position as the BIA, described by Parton et al. (Parton et al., 2003). While the apical actin
fringe degrades, at least some of the actin cables in the shank of the tube remain and these drive the
streaming that is evident.
LatB leads to focused points of pectin deposition that frequently change position
LatB, which blocks actin polymerization by sequestering G-actin, has been shown to disrupt
localization of RabA4b, a Rab GTPase involved in exocytosis, in both root hairs and pollen tubes
(Preuss et al., 2004; Zhang et al., 2010b). Previous work has also shown that the actin fringe
dissipates in the presence of LatB (Cárdenas et al., 2005). In more recent studies on cells expressing
Lifeact-mEGFP, Vidali et al. (2009) have shown that 2 nM LatB disrupts the actin fringe per se,
however a thin rim of cortical fluorescence arises and spreads across the apical dome (see Fig. 7C,
D, and Supplemental movie S5 in Vidali et al., 2009). While some of the fluorescence in this rim
may be due to Lifeact associated with G-actin, a fraction is due to randomly oriented cortical F-actin
(Vidali et al., 2009). It seems likely that these cortical actin filaments drive the streaming that is
observed within the tube apex. Here we see all organelles, including the amyloplasts, which
www.plantphysiol.orgon February 1, 2018 - Published by Downloaded from Copyright © 2014 American Society of Plant Biologists. All rights reserved.
10
heretofore had been excluded from the apical dome, moving through the apex obliterating the clear
zone.
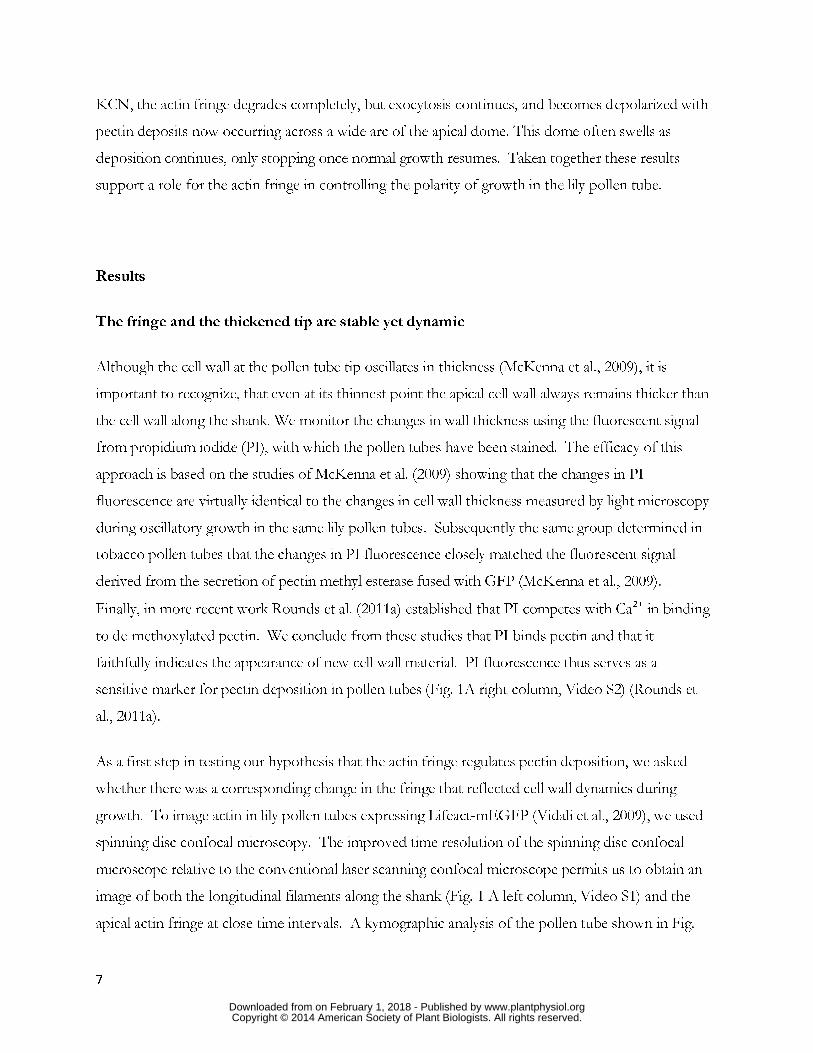
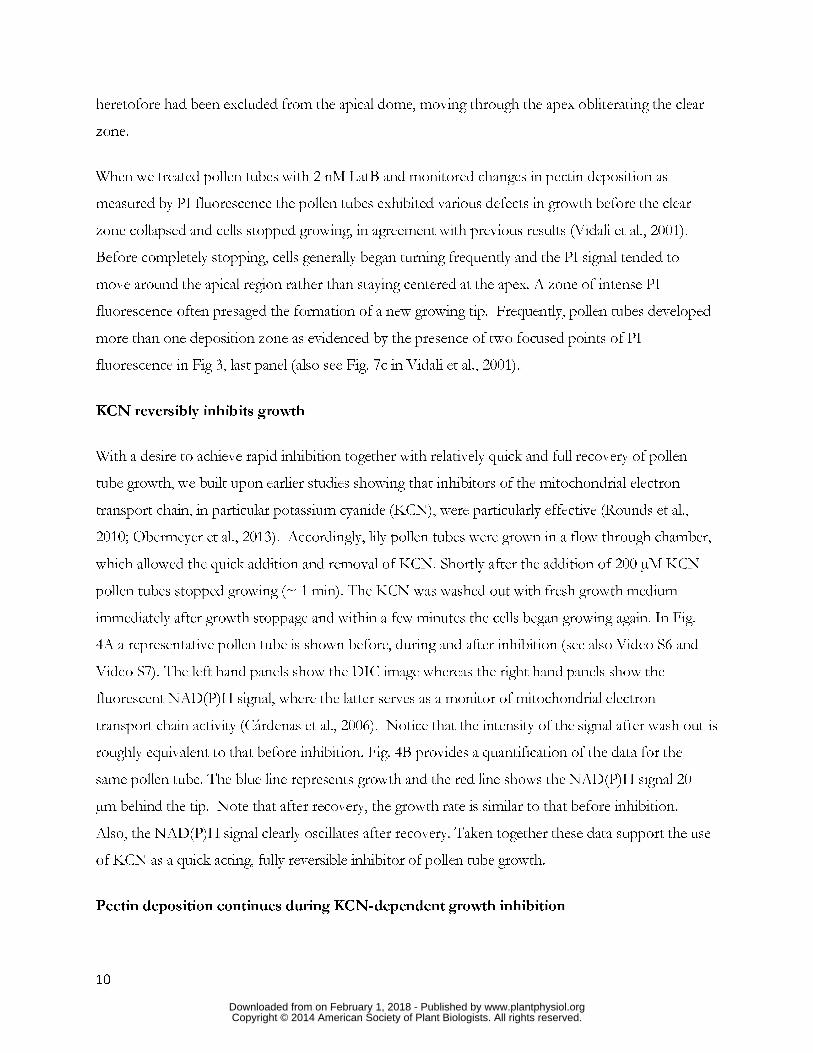
When we treated pollen tubes with 2 nM LatB and monitored changes in pectin deposition as
measured by PI fluorescence the pollen tubes exhibited various defects in growth before the clear
zone collapsed and cells stopped growing, in agreement with previous results (Vidali et al., 2001).
Before completely stopping, cells generally began turning frequently and the PI signal tended to
move around the apical region rather than staying centered at the apex. A zone of intense PI
fluorescence often presaged the formation of a new growing tip. Frequently, pollen tubes developed
more than one deposition zone as evidenced by the presence of two focused points of PI
fluorescence in Fig 3, last panel (also see Fig. 7c in Vidali et al., 2001).
KCN reversibly inhibits growth
With a desire to achieve rapid inhibition together with relatively quick and full recovery of pollen
tube growth, we built upon earlier studies showing that inhibitors of the mitochondrial electron
transport chain, in particular potassium cyanide (KCN), were particularly effective (Rounds et al.,
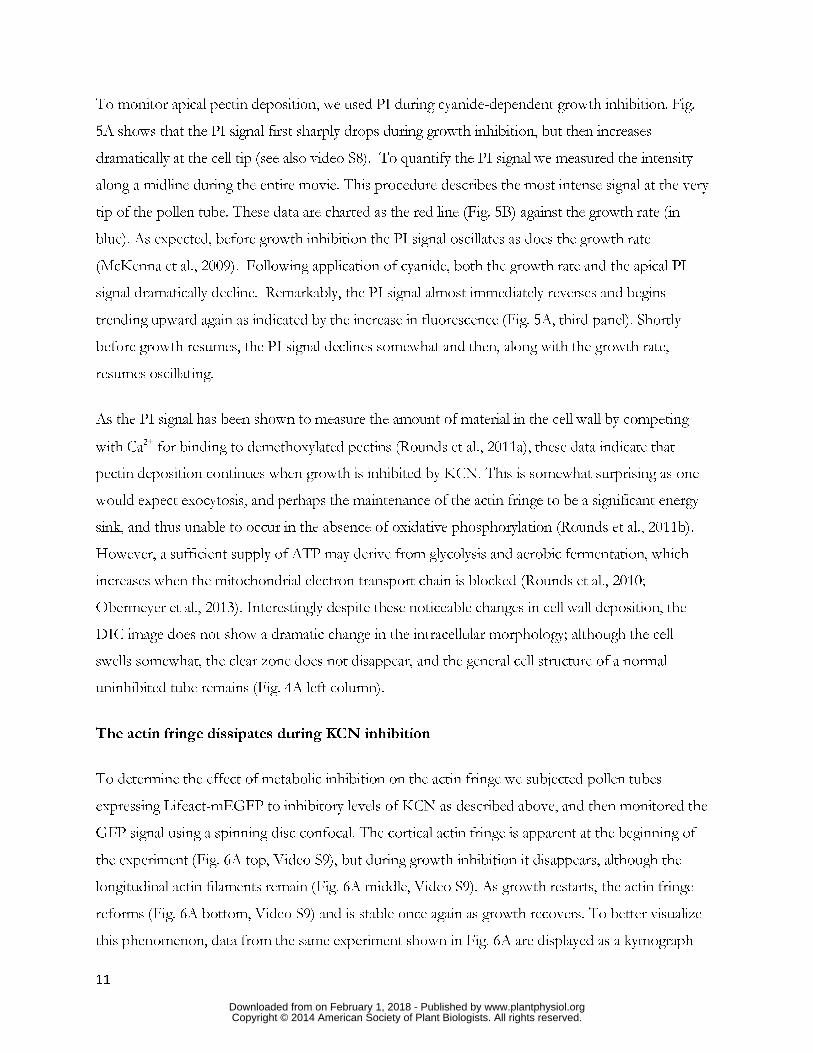
2010; Obermeyer et al., 2013). Accordingly, lily pollen tubes were grown in a flow through chamber,
which allowed the quick addition and removal of KCN. Shortly after the addition of 200 µM KCN
pollen tubes stopped growing (~ 1 min). The KCN was washed out with fresh growth medium
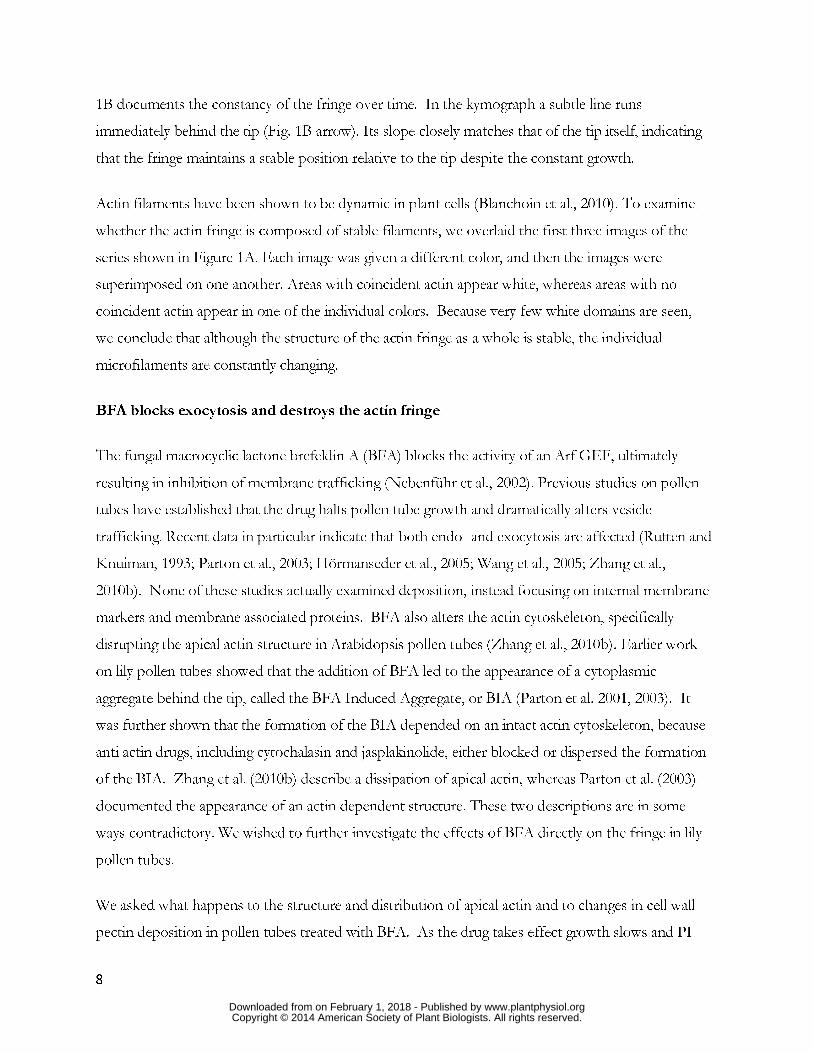
immediately after growth stoppage and within a few minutes the cells began growing again. In Fig.
4A a representative pollen tube is shown before, during and after inhibition (see also Video S6 and
Video S7). The left hand panels show the DIC image whereas the right hand panels show the
fluorescent NAD(P)H signal, where the latter serves as a monitor of mitochondrial electron
transport chain activity (Cárdenas et al., 2006). Notice that the intensity of the signal after wash out is
roughly equivalent to that before inhibition. Fig. 4B provides a quantification of the data for the
same pollen tube. The blue line represents growth and the red line shows the NAD(P)H signal 20
µm behind the tip. Note that after recovery, the growth rate is similar to that before inhibition.
Also, the NAD(P)H signal clearly oscillates after recovery. Taken together these data support the use
of KCN as a quick acting, fully reversible inhibitor of pollen tube growth.
Pectin deposition continues during KCN-dependent growth inhibition
www.plantphysiol.orgon February 1, 2018 - Published by Downloaded from Copyright © 2014 American Society of Plant Biologists. All rights reserved.
11
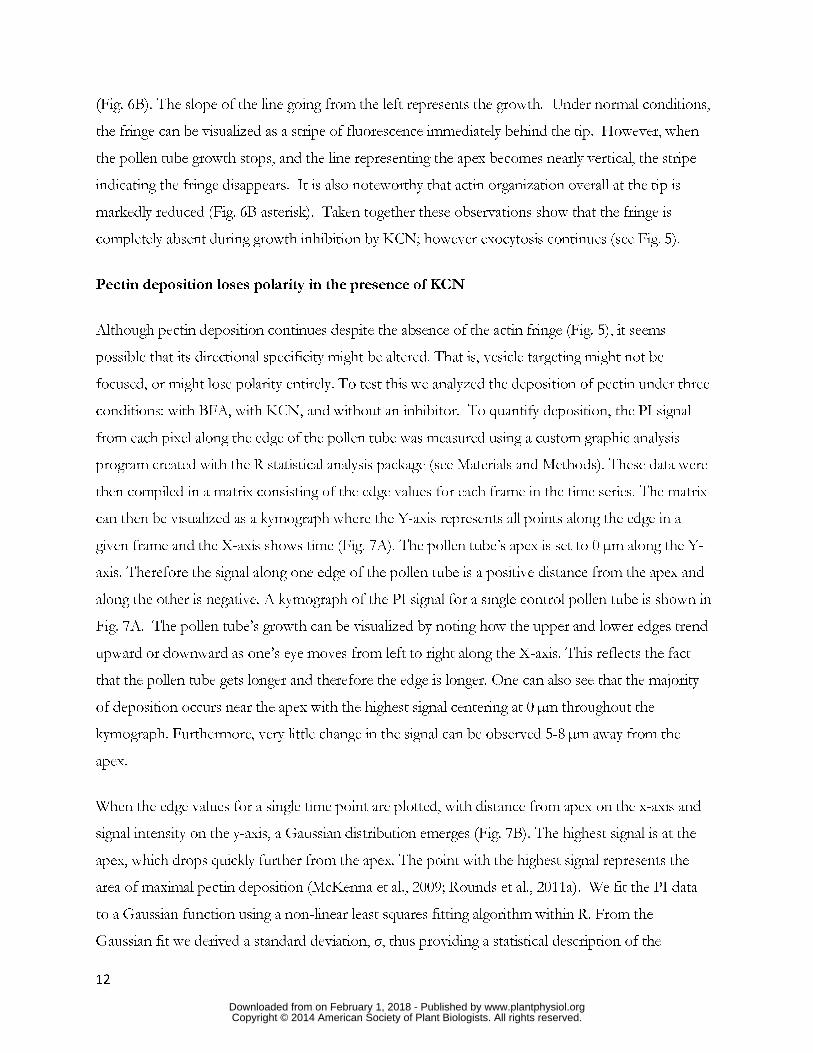
To monitor apical pectin deposition, we used PI during cyanide-dependent growth inhibition. Fig.
5A shows that the PI signal first sharply drops during growth inhibition, but then increases
dramatically at the cell tip (see also video S8). To quantify the PI signal we measured the intensity
along a midline during the entire movie. This procedure describes the most intense signal at the very
tip of the pollen tube. These data are charted as the red line (Fig. 5B) against the growth rate (in
blue). As expected, before growth inhibition the PI signal oscillates as does the growth rate
(McKenna et al., 2009). Following application of cyanide, both the growth rate and the apical PI
signal dramatically decline. Remarkably, the PI signal almost immediately reverses and begins
trending upward again as indicated by the increase in fluorescence (Fig. 5A, third panel). Shortly
before growth resumes, the PI signal declines somewhat and then, along with the growth rate,
resumes oscillating.
As the PI signal has been shown to measure the amount of material in the cell wall by competing
with Ca2+ for binding to demethoxylated pectins (Rounds et al., 2011a), these data indicate that
pectin deposition continues when growth is inhibited by KCN. This is somewhat surprising as one
would expect exocytosis, and perhaps the maintenance of the actin fringe to be a significant energy
sink, and thus unable to occur in the absence of oxidative phosphorylation (Rounds et al., 2011b).
However, a sufficient supply of ATP may derive from glycolysis and aerobic fermentation, which
increases when the mitochondrial electron transport chain is blocked (Rounds et al., 2010;
Obermeyer et al., 2013). Interestingly despite these noticeable changes in cell wall deposition, the
DIC image does not show a dramatic change in the intracellular morphology; although the cell
swells somewhat, the clear zone does not disappear, and the general cell structure of a normal
uninhibited tube remains (Fig. 4A left column).
The actin fringe dissipates during KCN inhibition
To determine the effect of metabolic inhibition on the actin fringe we subjected pollen tubes
expressing Lifeact-mEGFP to inhibitory levels of KCN as described above, and then monitored the
GFP signal using a spinning disc confocal. The cortical actin fringe is apparent at the beginning of
the experiment (Fig. 6A top, Video S9), but during growth inhibition it disappears, although the
longitudinal actin filaments remain (Fig. 6A middle, Video S9). As growth restarts, the actin fringe
reforms (Fig. 6A bottom, Video S9) and is stable once again as growth recovers. To better visualize
this phenomenon, data from the same experiment shown in Fig. 6A are displayed as a kymograph
www.plantphysiol.orgon February 1, 2018 - Published by Downloaded from Copyright © 2014 American Society of Plant Biologists. All rights reserved.
12
(Fig. 6B). The slope of the line going from the left represents the growth. Under normal conditions,
the fringe can be visualized as a stripe of fluorescence immediately behind the tip. However, when
the pollen tube growth stops, and the line representing the apex becomes nearly vertical, the stripe
indicating the fringe disappears. It is also noteworthy that actin organization overall at the tip is
markedly reduced (Fig. 6B asterisk). Taken together these observations show that the fringe is
completely absent during growth inhibition by KCN; however exocytosis continues (see Fig. 5).
Pectin deposition loses polarity in the presence of KCN
Although pectin deposition continues despite the absence of the actin fringe (Fig. 5), it seems
possible that its directional specificity might be altered. That is, vesicle targeting might not be
focused, or might lose polarity entirely. To test this we analyzed the deposition of pectin under three
conditions: with BFA, with KCN, and without an inhibitor. To quantify deposition, the PI signal
from each pixel along the edge of the pollen tube was measured using a custom graphic analysis
program created with the R statistical analysis package (see Materials and Methods). These data were
then compiled in a matrix consisting of the edge values for each frame in the time series. The matrix
can then be visualized as a kymograph where the Y-axis represents all points along the edge in a
given frame and the X-axis shows time (Fig. 7A). The pollen tube’s apex is set to 0 µm along the Y-
axis. Therefore the signal along one edge of the pollen tube is a positive distance from the apex and
along the other is negative. A kymograph of the PI signal for a single control pollen tube is shown in
Fig. 7A. The pollen tube’s growth can be visualized by noting how the upper and lower edges trend
upward or downward as one’s eye moves from left to right along the X-axis. This reflects the fact
that the pollen tube gets longer and therefore the edge is longer. One can also see that the majority
of deposition occurs near the apex with the highest signal centering at 0 µm throughout the
kymograph. Furthermore, very little change in the signal can be observed 5-8 µm away from the
apex.
When the edge values for a single time point are plotted, with distance from apex on the x-axis and
signal intensity on the y-axis, a Gaussian distribution emerges (Fig. 7B). The highest signal is at the
apex, which drops quickly further from the apex. The point with the highest signal represents the
area of maximal pectin deposition (McKenna et al., 2009; Rounds et al., 2011a). We fit the PI data
to a Gaussian function using a non-linear least squares fitting algorithm within R. From the
Gaussian fit we derived a standard deviation, σ, thus providing a statistical description of the
www.plantphysiol.orgon February 1, 2018 - Published by Downloaded from Copyright © 2014 American Society of Plant Biologists. All rights reserved.
13
dispersion of the PI signal around the tube tip. If we model the pollen tube apex as a circle, 2 X σ
describes an arc of the highest signal along this circle (Fig. 7B and Fig. 7C as well as Materials and
Methods). This arc represents the majority of the PI signal at the apex; that is, it is the area of
greatest deposition. As pollen tubes vary in diameter quite substantially, we chose to quantify PI
dispersion by calculating the subtended angle of this arc (Θ c.f. Fig. 7C). We calculated Θ for each
frame of the pollen tube used for 6A and plotted it against the time (Fig. 7D). This allows us to
compare Θ to the amplitude of PI fluorescence at the apex (Fig. 7D). Notice in particular that the
amplitude of the PI signal oscillates as expected (McKenna et al., 2009; Rounds et al., 2011a), as
does Θ. In untreated pollen tubes Θ oscillates around 62° (+/- 3° S.E. n=10).
We also analyzed the change in Θ and therefore the arc of pectin deposition using BFA and KCN.
We reasoned that because BFA abolishes all exocytosis, Θ should go from the control value of ~62°
to “0°” or an undefined angle. If KCN causes a loss of control over deposition, then the angle
should increase dramatically. We conducted trials using 10 control pollen tubes, 11 treated with
KCN and 5 with BFA, and then analyzed the results as with the control described above.
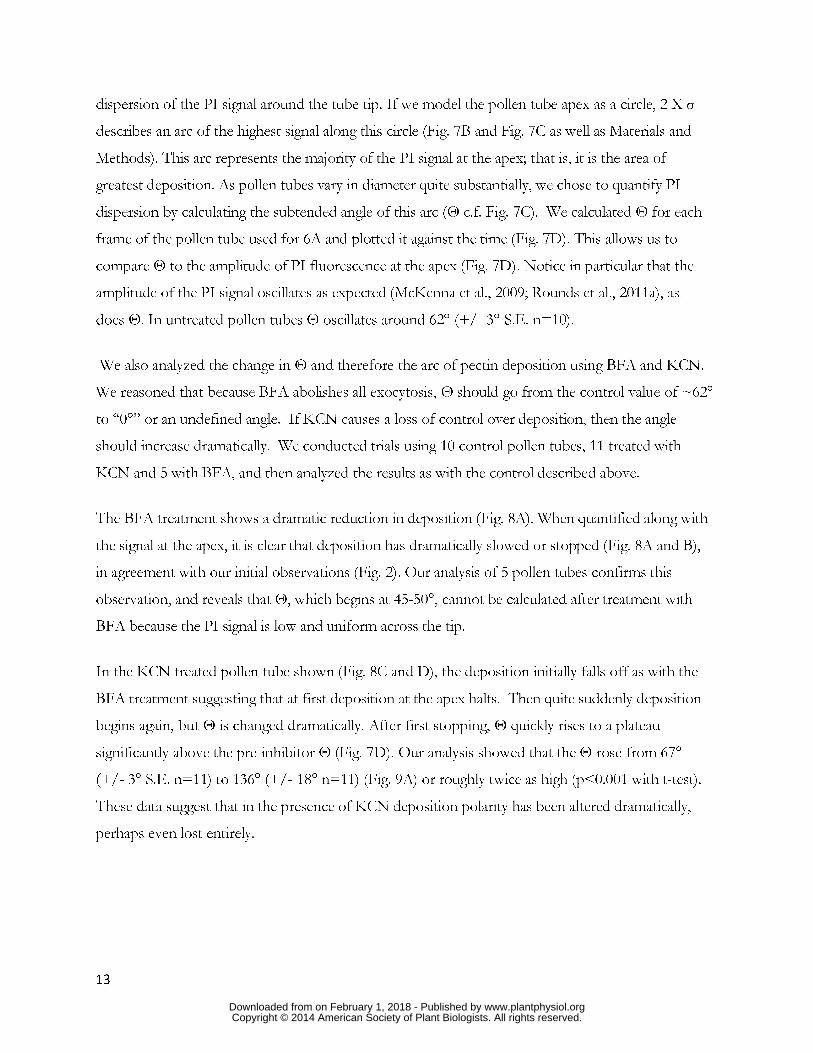
The BFA treatment shows a dramatic reduction in deposition (Fig. 8A). When quantified along with
the signal at the apex, it is clear that deposition has dramatically slowed or stopped (Fig. 8A and B),
in agreement with our initial observations (Fig. 2). Our analysis of 5 pollen tubes confirms this
observation, and reveals that Θ, which begins at 45-50°, cannot be calculated after treatment with
BFA because the PI signal is low and uniform across the tip.
In the KCN treated pollen tube shown (Fig. 8C and D), the deposition initially falls off as with the
BFA treatment suggesting that at first deposition at the apex halts. Then quite suddenly deposition
begins again, but Θ is changed dramatically. After first stopping, Θ quickly rises to a plateau
significantly above the pre-inhibitor Θ (Fig. 7D). Our analysis showed that the Θ rose from 67°
(+/- 3° S.E. n=11) to 136° (+/- 18° n=11) (Fig. 9A) or roughly twice as high (p<0.001 with t-test).
These data suggest that in the presence of KCN deposition polarity has been altered dramatically,
perhaps even lost entirely.
www.plantphysiol.orgon February 1, 2018 - Published by Downloaded from Copyright © 2014 American Society of Plant Biologists. All rights reserved.
14
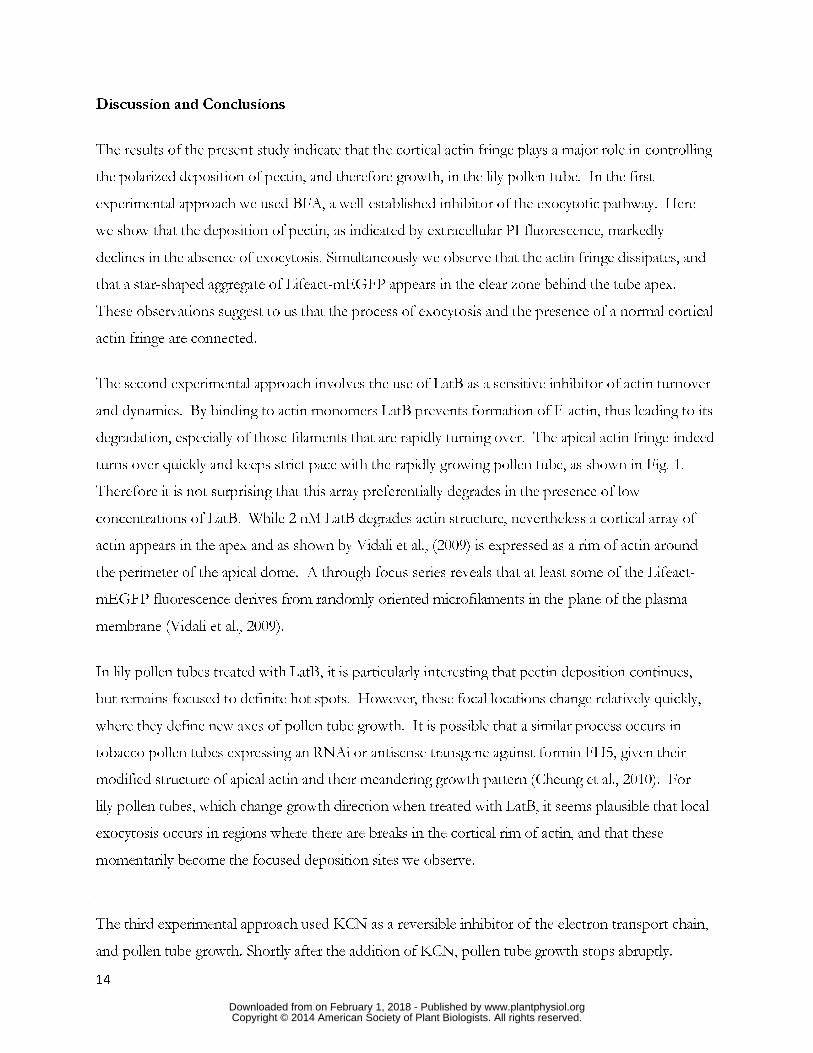
Discussion and Conclusions
The results of the present study indicate that the cortical actin fringe plays a major role in controlling
the polarized deposition of pectin, and therefore growth, in the lily pollen tube. In the first
experimental approach we used BFA, a well-established inhibitor of the exocytotic pathway. Here
we show that the deposition of pectin, as indicated by extracellular PI fluorescence, markedly
declines in the absence of exocytosis. Simultaneously we observe that the actin fringe dissipates, and
that a star-shaped aggregate of Lifeact-mEGFP appears in the clear zone behind the tube apex.
These observations suggest to us that the process of exocytosis and the presence of a normal cortical
actin fringe are connected.
The second experimental approach involves the use of LatB as a sensitive inhibitor of actin turnover
and dynamics. By binding to actin monomers LatB prevents formation of F-actin, thus leading to its
degradation, especially of those filaments that are rapidly turning over. The apical actin fringe indeed
turns over quickly and keeps strict pace with the rapidly growing pollen tube, as shown in Fig. 1.
Therefore it is not surprising that this array preferentially degrades in the presence of low
concentrations of LatB. While 2 nM LatB degrades actin structure, nevertheless a cortical array of
actin appears in the apex and as shown by Vidali et al., (2009) is expressed as a rim of actin around
the perimeter of the apical dome. A through focus series reveals that at least some of the Lifeact-
mEGFP fluorescence derives from randomly oriented microfilaments in the plane of the plasma
membrane (Vidali et al., 2009).
In lily pollen tubes treated with LatB, it is particularly interesting that pectin deposition continues,
but remains focused to definite hot spots. However, these focal locations change relatively quickly,
where they define new axes of pollen tube growth. It is possible that a similar process occurs in
tobacco pollen tubes expressing an RNAi or antisense transgene against formin FH5, given their
modified structure of apical actin and their meandering growth pattern (Cheung et al., 2010). For
lily pollen tubes, which change growth direction when treated with LatB, it seems plausible that local
exocytosis occurs in regions where there are breaks in the cortical rim of actin, and that these
momentarily become the focused deposition sites we observe.
The third experimental approach used KCN as a reversible inhibitor of the electron transport chain,
and pollen tube growth. Shortly after the addition of KCN, pollen tube growth stops abruptly.
www.plantphysiol.orgon February 1, 2018 - Published by Downloaded from Copyright © 2014 American Society of Plant Biologists. All rights reserved.
15
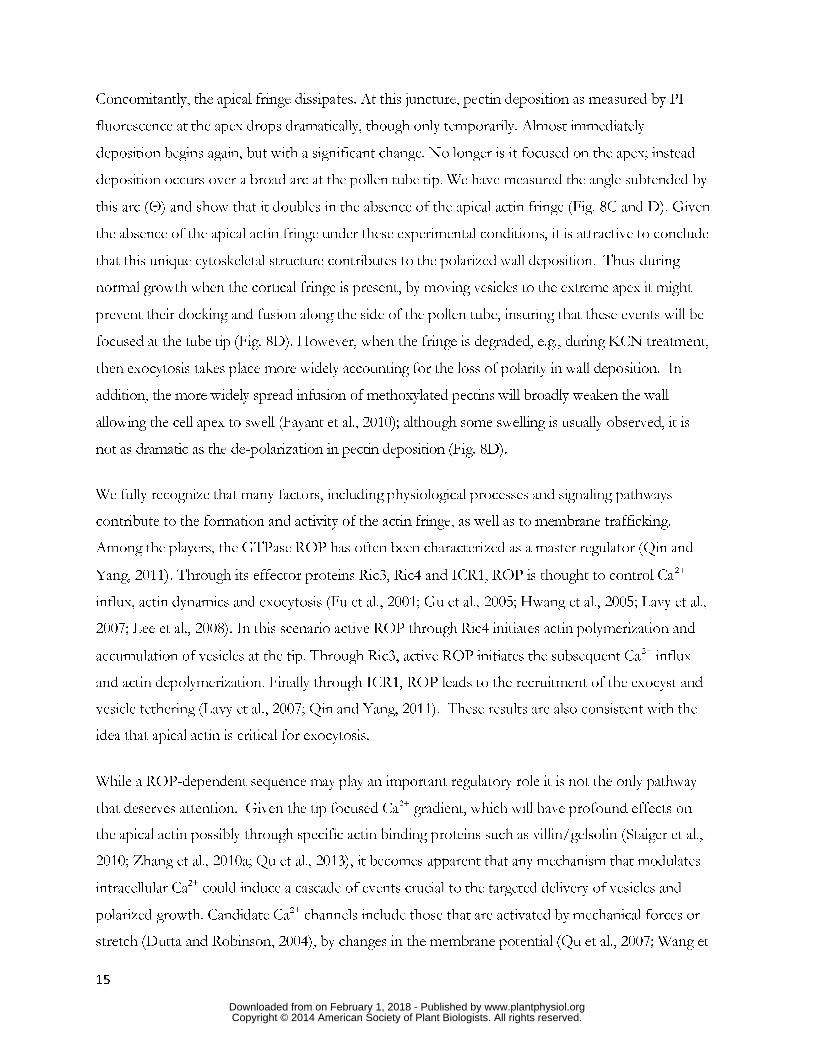
Concomitantly, the apical fringe dissipates. At this juncture, pectin deposition as measured by PI
fluorescence at the apex drops dramatically, though only temporarily. Almost immediately
deposition begins again, but with a significant change. No longer is it focused on the apex; instead
deposition occurs over a broad arc at the pollen tube tip. We have measured the angle subtended by
this arc (Θ) and show that it doubles in the absence of the apical actin fringe (Fig. 8C and D). Given
the absence of the apical actin fringe under these experimental conditions, it is attractive to conclude
that this unique cytoskeletal structure contributes to the polarized wall deposition. Thus during
normal growth when the cortical fringe is present, by moving vesicles to the extreme apex it might
prevent their docking and fusion along the side of the pollen tube, insuring that these events will be
focused at the tube tip (Fig. 8D). However, when the fringe is degraded, e.g., during KCN treatment,
then exocytosis takes place more widely accounting for the loss of polarity in wall deposition. In
addition, the more widely spread infusion of methoxylated pectins will broadly weaken the wall
allowing the cell apex to swell (Fayant et al., 2010); although some swelling is usually observed, it is
not as dramatic as the de-polarization in pectin deposition (Fig. 8D).
We fully recognize that many factors, including physiological processes and signaling pathways
contribute to the formation and activity of the actin fringe, as well as to membrane trafficking.
Among the players, the GTPase ROP has often been characterized as a master regulator (Qin and
Yang, 2011). Through its effector proteins Ric3, Ric4 and ICR1, ROP is thought to control Ca2+
influx, actin dynamics and exocytosis (Fu et al., 2001; Gu et al., 2005; Hwang et al., 2005; Lavy et al.,
2007; Lee et al., 2008). In this scenario active ROP through Ric4 initiates actin polymerization and
accumulation of vesicles at the tip. Through Ric3, active ROP initiates the subsequent Ca2+ influx
and actin depolymerization. Finally through ICR1, ROP leads to the recruitment of the exocyst and
vesicle tethering (Lavy et al., 2007; Qin and Yang, 2011). These results are also consistent with the
idea that apical actin is critical for exocytosis.
While a ROP-dependent sequence may play an important regulatory role it is not the only pathway
that deserves attention. Given the tip focused Ca2+ gradient, which will have profound effects on
the apical actin possibly through specific actin binding proteins such as villin/gelsolin (Staiger et al.,
2010; Zhang et al., 2010a; Qu et al., 2013), it becomes apparent that any mechanism that modulates
intracellular Ca2+ could induce a cascade of events crucial to the targeted delivery of vesicles and
polarized growth. Candidate Ca2+ channels include those that are activated by mechanical forces or
stretch (Dutta and Robinson, 2004), by changes in the membrane potential (Qu et al., 2007; Wang et
www.plantphysiol.orgon February 1, 2018 - Published by Downloaded from Copyright © 2014 American Society of Plant Biologists. All rights reserved.
16
al., 2004; Wu et al., 2010; Wu et al., 2007; Shang et al., 2005), or by the presence of a ligand such as
reactive oxygen species (Potocký et al., 2007; Wu et al., 2010), cyclic nucleotides (Frietsch et al.,
2007) or amino acids (Michard et al., 2011)(For a review see Hepler et al., 2011). In brief there is a
rich array of factors and mechanisms that could modulate Ca2+, and by extension the structure and
organization of the cortical actin fringe.
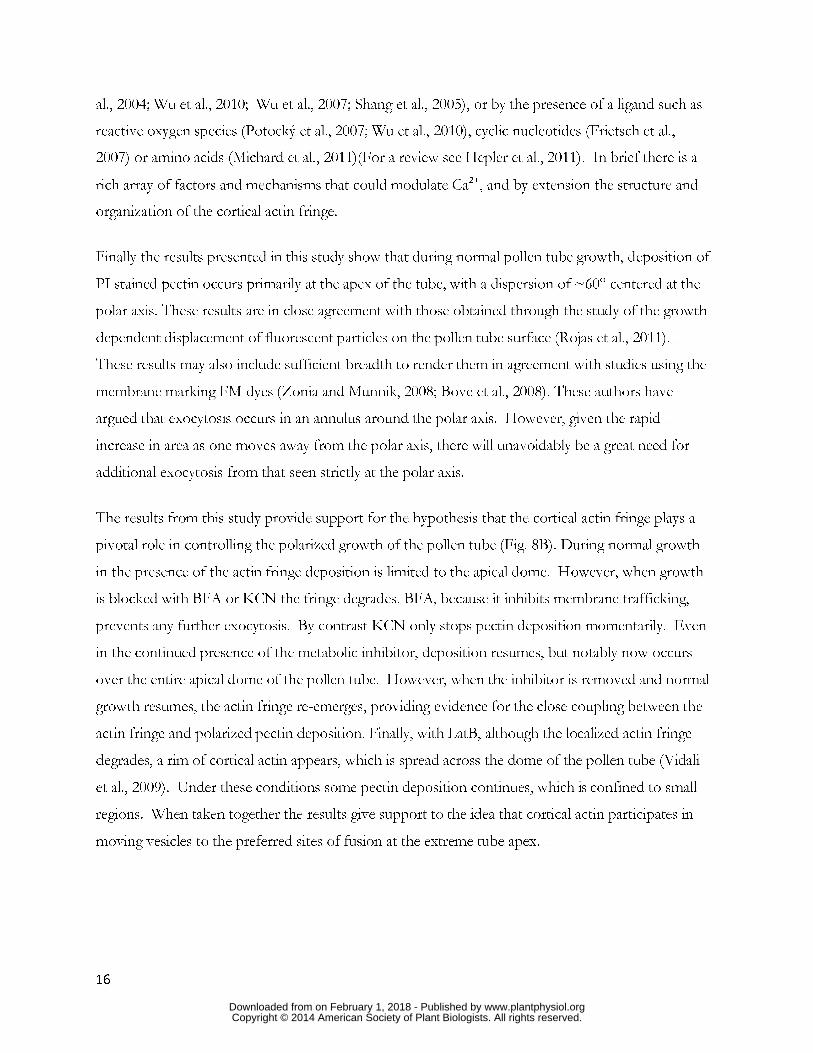
Finally the results presented in this study show that during normal pollen tube growth, deposition of
PI stained pectin occurs primarily at the apex of the tube, with a dispersion of ~60° centered at the
polar axis. These results are in close agreement with those obtained through the study of the growth-
dependent displacement of fluorescent particles on the pollen tube surface (Rojas et al., 2011).
These results may also include sufficient breadth to render them in agreement with studies using the
membrane marking FM-dyes (Zonia and Munnik, 2008; Bove et al., 2008). These authors have
argued that exocytosis occurs in an annulus around the polar axis. However, given the rapid
increase in area as one moves away from the polar axis, there will unavoidably be a great need for
additional exocytosis from that seen strictly at the polar axis.
The results from this study provide support for the hypothesis that the cortical actin fringe plays a
pivotal role in controlling the polarized growth of the pollen tube (Fig. 8B). During normal growth
in the presence of the actin fringe deposition is limited to the apical dome. However, when growth
is blocked with BFA or KCN the fringe degrades. BFA, because it inhibits membrane trafficking,
prevents any further exocytosis. By contrast KCN only stops pectin deposition momentarily. Even
in the continued presence of the metabolic inhibitor, deposition resumes, but notably now occurs
over the entire apical dome of the pollen tube. However, when the inhibitor is removed and normal
growth resumes, the actin fringe re-emerges, providing evidence for the close coupling between the
actin fringe and polarized pectin deposition. Finally, with LatB, although the localized actin fringe
degrades, a rim of cortical actin appears, which is spread across the dome of the pollen tube (Vidali
et al., 2009). Under these conditions some pectin deposition continues, which is confined to small
regions. When taken together the results give support to the idea that cortical actin participates in
moving vesicles to the preferred sites of fusion at the extreme tube apex.
www.plantphysiol.orgon February 1, 2018 - Published by Downloaded from Copyright © 2014 American Society of Plant Biologists. All rights reserved.
17
Materials and Methods: Pollen Tube Growth Conditions
Pollen was grown as described previously (Rounds et al., 2010). Briefly, all pollen was from lily
(Lilium formosanum) stocks stored at –80°C and germinated for 1 to 1.5 h on a rotator at room
temperature in a standard growth medium (LPGM): 7% (w/v) Sucrose, 1.6 mM H3BO3, 0.1 mM
CaCl2, and 15 mM MES buffer adjusted to pH 5.7 with 10 N KOH (a final concentration of K of
approximately 6 mM); all reagents were from Fisher Scientific unless otherwise noted. For
microscopic observations pollen was prepared one of two ways. For widefield epifluorescence
microscopy, a pollen suspension was spread on custom-made well slides with a growth medium
solution containing a final concentration of 0.7% (w/v) low-melting agarose (Sigma-Aldrich). The
immobilized pollen was then covered with fresh growth medium for imaging. Cells were allowed to
recover for at least 0.5 h before imaging or further manipulations. For spinning disc confocal
microscopy cells were cultured in agarose as described above or on slides coated with high molecular
weight (150-300 kD) poly-l-lysine. These slides were first cleaned in a Harrick Plasma cleaner PDC-
001 for 30 seconds. They were then coated in ~50 µL of 1 mg/mL poly-l-lysine/H2O solution and
allowed to dry. The slides were thoroughly rinsed in H2O then allowed to air dry before use.
PI Staining of Pollen Tubes
For PI staining of the primary cell wall, the growth medium covering the immobilized and recovered
cells on microscope slides was replaced with LPGM supplemented with 20 μM PI (Sigma). Cells
were imaged more than 10 min after addition of the stain.
Growth Inhibition with KCN, BFA and LatB
Cells were grown as described above. For inhibition with KCN, a two-tube peristaltic pump (Bio-
Rad) was used to add 200 μM KCN in LPGM. One tube was used to remove the growth media
from the slide under analysis, while the other added media with inhibitor. The rate was set to ~ 0.5
mL min−1 for the duration of the experiment. For experiments with either BFA, or LatB, cells were
www.plantphysiol.orgon February 1, 2018 - Published by Downloaded from Copyright © 2014 American Society of Plant Biologists. All rights reserved.
18
immobilized in agarose or on poly-l-lysine then a 200 μL of LPGM was added. Cells were allowed to
recover, then 200 μL of LPGM supplemented with either 30 μM BFA or 4 nM LatB was added to
yield a final concentration of 15 μM BFA or 2 nM LatB.
DIC and Epifluorescence Microscopy and Imaging
PI, NADH, and DIC images were acquired using a CCD camera (Quantix Cool Snap HQ; Roper
Scientific) attached to a Nikon TE300 inverted microscope (Nikon Instruments) with a 40x/1.3
numerical aperture oil-immersion objective lens. All the equipment was operated with
MetaMorph/MetaFluor (Molecular Devices) software. A filter wheel system (Λ10-2; Sutter
Instruments), mounted immediately before the CCD camera, controlled the position of a polarizing
filter for DIC or an emission filter for fluorescence imaging. Fluorescence excitation light was
provided by a 175-W ozone-free xenon lamp in a DG-4 switching system (Sutter Instruments).
Transmitted light was provided by a low-voltage halogen lamp. We used the following filter setup
for PI imaging: emission, 495 nm; a 565 nm dichroic long pass; and excitation 509 nm long pass (all
filters from Chroma). Exposure times varied but were generally approximately 10 ms for DIC and
approximately 800 ms for PI unless otherwise stated. We used the following filter setup for
NAD(P)H imaging: 360 nm (10 nm band-pass) as excitation filter, 380 nm dichroic, and 400 nm
long-pass emission filter (all filters were from Chroma). We employed an exposure time of 750 ms
and binned the images using ImageJ before analysis.
Spinning-disc confocal microscopy and imaging
For imaging of Lifeact-mEGFP, slides were prepared as described above and then were mounted on
an inverted microscope (model Ti-E; Nikon) equipped with a spinning disk head (model CSU-X1;
Yokogawa Corporation of America) and a 512 × 512 electron multiplying CCD camera (iXON;
Andor Technology). Images were collected with a 1.4 NA 60x oil immersion objective (Nikon) at
room temperature. 50% laser power was used with the 488 laser. The exposure time varied between
50 and 100 ms. Image acquisition process was controlled by MetaMorph software (Molecular
Devices). To create maximal projections, ImageJ (Abramoff et al., 2004) was used. Lifeact-mEGFP
kymographs were prepared using the multikymograph plugin for Image J with a 5 or 11 pixel-wide
scan along a hand selected midline.
www.plantphysiol.orgon February 1, 2018 - Published by Downloaded from Copyright © 2014 American Society of Plant Biologists. All rights reserved.
19
Growth Rate and NAD(P)H Fluorescence Measurements
Growth rate was measured using the tip-tracking feature of the MetaMorph software package
(Molecular Devices). The average NAD(P)H fluorescence was measured in a 10 μm2 box centered 5
μm from the pollen tube tip (Cárdenas et al., 2006) using a custom R script (Ihaka and Gentleman,
1996; Rounds et al., 2010).
Bombardment
Plasmid DNA for Lifeact-mEGFP was constructed as described (Vidali et al., 2009). Plasmid DNA
was prepared using alkaline lysis followed by precipitation with PEG and extraction with phenol-
chloroform. DNA was coated onto 1 to 3 mg of 1.1 µm diameter tungsten particles (Bio-Rad
Laboratories) according to the manufacturer's instructions. The coated microprojectiles were
aliquoted onto two macrocarriers (Bio-Rad Laboratories). Pollen was allowed to hydrate in 1 mL of
the appropriate growth media (see below) before being placed on a 25 mm MF-Millipore membrane
(Millipore), which in turn was set on Whatmann paper moistened with pollen growth media. The
macrocarrier assembly was positioned in the top slot of the PDS-1000/He biolistic system and the
sample assembly in the slot below (Bio-Rad). Pollen grains were bombarded twice (once with each
aliquot) using an 1100-psi rupture disc (Bio-Rad). After bombardment, pollen was transferred to a
microcentrifuge tube and incubated for 2 hours at room temperature with constant rotation. Cells
were then immobilized on a microscope slide in growth as described above.
Edge/midline detection and PI fluorescence along the edge
For each tiff image in a sequence, approximate cell edges were first estimated by segmentation and
Canny edge detection in ImageJ (Abramoff et al., 2004). The cell midline was drawn by eye using
smoothing splines then digitized. Approximated edges were digitized then used as input to an R
script that scanned the perimeter of each cell pixel by pixel, extending a sample line perpendicular to
the approximate edge trace (please see supplemental information). Bicubic interpolation along the
sample line provided pixel values that were used to determine the point of the maximum PI signal.
The X and Y locations of the maximum PI signal were used as first estimate of edge location. The
center of the tip was calculated as the intersection of the midline and the edge trace. Then distances
from the tip along the cell edge (S) were calculated for each frame in a sequence as the geometric
www.plantphysiol.orgon February 1, 2018 - Published by Downloaded from Copyright © 2014 American Society of Plant Biologists. All rights reserved.
20
distances between pairs of (X,Y) points. X and Y values were parameterized as smooth splines vs. S
and new X and Y coordinates for the smoothed edge were interpolated and used to determine the
PI value at each point from the original images. The location of the edge and the value of the PI
fluorescence at each location were saved for future analysis.
Kymographs
Kymographs were plotted using the kymo command in R.
Dispersion
For each image in a series PI fluorescence vs. S (with S=0 as the cell tip) data were first smoothed, a
minimum and maximum value determined, then the data normalized to the maximum PI value. The
resulting data were fit to a Gaussian function using the nls function (non-linear least squares) in R:
������
� �
�������
���
PInorm is the normalized PI fluorescence, S is the distance from the tip, µ is the location of the peak,
and σ is the standard deviation, e.g. the square root of the variance, a measure of the dispersion of
the function and of the PI signal.
To compare pollen tubes over time and treatment, we used σ to calculate the angle θ (degrees) as an
index of PI dispersion (Figure 4) as:
� ��
��360
Supplemental Materials
Supplemental Protocol 1: R script for generating kymographic data.
www.plantphysiol.orgon February 1, 2018 - Published by Downloaded from Copyright © 2014 American Society of Plant Biologists. All rights reserved.
21
Supplemental Protocol 2: R script for analyzing kymographic data to determine Θ
Supplemental Video S1: Lily pollen tube expressing Lifeact-mEGFP
Supplemental Video S2: PI labeling of lily pollen tube.
Supplemental Video S3: PI labeled pollen tube treated with BFA.
Supplemental Video S4: Lily pollen tube expressing Lifeact-mEGFP before BFA inhibition.
Supplemental Video S5: Same pollen tube as supplemental video S4 after BFA inhibition.
Supplemental Video S6: NAD(P)H auto-fluorescence in lily pollen tube treated with KCN.
Supplemental Video S7: DIC image of lily pollen tube treated with KCN.
Supplemental Video S8: PI labeled lily pollen tube treated with KCN.
Supplemental Video S9: Pollen tube expressing Lifeact-mEGFP treated with KCN.
Acknowledgements: We thank Dr. M. Bezanilla and Dr. T.I. Baskin and members of their
respective labs for helpful discussions.
www.plantphysiol.orgon February 1, 2018 - Published by Downloaded from Copyright © 2014 American Society of Plant Biologists. All rights reserved.
22
Literature Cited:
Abramoff MD, Magalhães PJ, Ram SJ (2004) Image processing with ImageJ. Biophot Inter 11: 36–42
Allwood EG, Anthony RG, Smertenko AP, Reichelt S, Drobak BK, Doonan JH, Weeds AG, Hussey PJ (2002) Regulation of the pollen-specific actin-depolymerizing factor LlADF1. Plant Cell 14: 2915–2927
Blanchoin L, Boujemaa-Paterski R, Henty JL, Khurana P, Staiger CJ (2010) Actin dynamics in plant cells: a team effort from multiple proteins orchestrates this very fast-paced game. Curr Opin Plant Biol 13: 714–723
Bou Daher FB, Geitmann A (2011) Actin is involved in pollen tube tropism through redefining the spatial targeting of secretory vesicles. Traffic 12: 1537–1551
Bove J, Vaillancourt B, Kroeger J, Hepler PK, Wiseman PW, Geitmann A (2008) Magnitude
and direction of vesicle dynamics in growing pollen tubes using spatiotemporal image correlation spectroscopy and fluorescence recovery after photobleaching. Plant Physiol 147: 1646–1658
Cárdenas L, Lovy-Wheeler A, Wilsen KL, Hepler PK (2005) Actin polymerization promotes the
reversal of streaming in the apex of pollen tubes. Cell Motil Cytoskel 61: 112–127
Cárdenas L, McKenna ST, Kunkel JG, Hepler PK (2006) NAD(P)H oscillates in pollen tubes
and is correlated with tip growth. Plant Physiol 142: 1460–1468
Chen CY, Wong EI, Vidali L, Estavillo A, Hepler PK, Wu H, Cheung AY (2002) The
regulation of actin organization by actin-depolymerizing factor in elongating pollen tubes. Plant Cell 14: 2175–2190
Cheung AY, Duan Q, Costa SS, de Graaf BHJ, Di Stilio VS, Feijo J, Wu H-M (2008) The
dynamic pollen tube cytoskeleton: live cell studies using actin-binding and microtubule- binding reporter proteins. Mol Plant 1: 686–702
Cheung AY, Niroomand S, Zou Y, Wu H-M (2010) A transmembrane formin nucleates
subapical actin assembly and controls tip-focused growth in pollen tubes. Proc Natl Acad Sci USA 107: 16390–16395
Cheung AY, Wu H (2004) Overexpression of an Arabidopsis formin stimulates supernumerary
actin cable formation from pollen tube cell membrane. Plant Cell 16: 257–269
Cresti M, Lancelle SA, Hepler PK (1987) Structure of the generative cell wall complex after freeze
substitution in pollen tubes of Nicotiana and Impatiens. J Cell Sci 88: 373–378
Derksen J, Rutten T, Van Amstel T, De Win A, Doris F, Steer M (1995) Regulation of pollen
tube growth. Acta Bot Neerl 44: 93-119
www.plantphysiol.orgon February 1, 2018 - Published by Downloaded from Copyright © 2014 American Society of Plant Biologists. All rights reserved.
23
Dong H, Pei W, Haiyun R (2012) Actin fringe is correlated with tip growth velocity of pollen tubes. Mol Plant 5: 1160–1162
Dumais J, Shaw SL, Steele CR, Long SR, Ray PM (2006) An anisotropic-viscoplastic model of plant cell morphogenesis by tip growth. Inter J Devel Biol 50: 209–222
Dutta R, Robinson KR (2004) Identification and characterization of stretch-activated ion channels
in pollen protoplasts. Plant Physiol 135: 1398-1406 Fayant P, Girlanda O, Chebli Y, Aubin C-E, Villemure I, Geitmann A. (2010) Finite element
model of polar growth in pollen tubes. Plant Cell 22: 2579-2593
Frietsch S, Wang YF, Sladek C, Poulsen LR, Romanowsky SM, Schroeder JI, Harper JF (2007) A cyclic nucleotide-gated channel is essential for polarized tip growth of pollen. Proc
Natl Acad Sci U S A 104: 14531-14536
Fu Y, Wu G, Yang Z (2001) Rop GTPase-dependent dynamics of tip-localized F-actin controls tip growth in pollen tubes. J Cell Biol 152: 1019–1032
Gibbon BC, Kovar DR, Staiger CJ (1999) Latrunculin B has different effects on pollen germination and tube growth. Plant Cell 11: 2349–2363
Gisbergen PACvan, Bezanilla M (2013) Plant formins: membrane anchors for actin polymerization. Trends Cell Biol 23: 227–233
Gu Y, Fu Y, Dowd P, Li S, Vernoud V, Gilroy S, Yang Z (2005) A Rho family GTPase controls
actin dynamics and tip growth via two counteracting downstream pathways in pollen tubes. J Cell Biol 169: 127–138
Hepler PK, Kunkel JG, Rounds CM, Winship LJ (2012) Calcium entry into pollen tubes. Trend
Plant Sci 17: 32-38
Hepler PK, Rounds CM, Winship LJ (2013) Control of cell wall extensibility during pollen tube
growth. Molec Plant 6: 998-1017
Heslop-Harrison J (1987) Pollen germination and pollen-tube growth. Inter Rev Cytol 107: 1-78
Hörmanseder K, Obermeyer G, Foissner I (2005) Disturbance of endomembrane trafficking by
brefeldin A and calyculin A reorganizes the actin cytoskeleton of Lilium longiflorum pollen tubes. Protoplasma 227: 25–36
Hwang J-U, Gu Y, Lee Y-J, Yang Z (2005) Oscillatory ROP GTPase activation leads the
oscillatory polarized growth of pollen tubes. Mol Biol Cell 16: 5385–5399
Ihaka R, Gentleman R (1996) R: A Language for Data Analysis and Graphics. J Comput Graph Stat 5: 299–314
www.plantphysiol.orgon February 1, 2018 - Published by Downloaded from Copyright © 2014 American Society of Plant Biologists. All rights reserved.
24
Kost B, Spielhofer P, Chua NH (1998) A GFP-mouse talin fusion protein labels plant actin filaments in vivo and visualizes the actin cytoskeleton in growing pollen tubes. Plant J 16: 393–401
Kroeger JH, Bou Daher FB, Grant M, Geitmann A (2009) Microfilament orientation constrains
vesicle flow and spatial distribution in growing pollen tubes. Biophys J 97: 1822–1831
Lancelle SA, Cresti M, Hepler PK (1987) Ultrastructure of the cytoskeleton in freeze-substituted pollen tubes of Nicotiana alata. Protoplasma 140: 141–150
Lancelle SA, Hepler PK (1992) Ultrastructure of freeze-substituted pollen tubes of Lilium longiflorum. Protoplasma 167: 215–230
Lavy M, Bloch D, Hazak O, Gutman I, Poraty L, Sorek N, Sternberg H, Yalovsky S (2007) A novel ROP/RAC effector links cell polarity, root-meristem maintenance, and vesicle trafficking. Curr Biol 17: 947–952
Lee YJ, Szumlanski A, Nielsen E, Yang Z (2008) Rho-GTPase–dependent filamentous actin dynamics coordinate vesicle targeting and exocytosis during tip growth. J Cell Biol 181: 1155–1168
Lovy-Wheeler A, Wilsen KL, Baskin TI, Hepler PK (2005) Enhanced fixation reveals the apical cortical fringe of actin filaments as a consistent feature of the pollen tube. Planta 221: 95– 104
McKenna ST, Kunkel JG, Bosch M, Rounds CM, Vidali L, Winship LJ, Hepler PK (2009) Exocytosis precedes and predicts the increase in growth in oscillating pollen tubes. Plant Cell 21: 3026–3040
McKenna ST, Vidali L, Hepler PK (2004) Profilin inhibits pollen tube growth through actin- binding, but not poly-L-proline-binding. Planta 218: 906–915
Michard E, Lima PT, Borges F, Silva AC, Portes MT, Carvalho JE, Gilliham M, Liu LH, Obermeyer G, Feijó JA (2011) Glutamate receptor-like genes form Ca2+ channels in pollen tubes and are regulated by pistil D-serine. Science 332: 434-437
Nebenführ A, Ritzenthaler C, Robinson DG (2002) Brefeldin A: deciphering an enigmatic
inhibitor of secretion. Plant Physiol 130: 1102–1108
Obermeyer G, Fragner L, Lang V, Weckwerth W (2013) Dynamic adaption of metabolic
pathways during germination and growth of lily pollen tubes after inhibition of the electron transport chain. Plant Physiol 162: 1822-1833
Parton RM, Fischer-Parton S, Watahiki MK, Trewavas AJ (2001) Dynamics of the apical vesicle
accumulation and the rate of growth are related in individual pollen tubes. J Cell Sci 114: 2685-2695
Parton RM, Fischer-Parton S, Trewavas AJ, Watahiki MK (2003) Pollen tubes exhibit regular periodic membrane trafficking events in the absence of apical extension. J Cell Sci 116: 2707–2719
www.plantphysiol.orgon February 1, 2018 - Published by Downloaded from Copyright © 2014 American Society of Plant Biologists. All rights reserved.
25
Potocký M, Jones MA, Bezvoda R, Smirnoff N, Žárský V (2007) Reactive oxygen species
produced by NADPH oxidase are involved in pollen tube growth. New Phytol 174: 742-751
Preuss ML, Serna J, Falbel TG, Bednarek SY, Nielsen E (2004) The Arabidopsis rab GTPase
rabA4b localizes to the tips of growing root hair cells. Plant Cell 16: 1589–1603
Qin Y, Yang Z (2011) Rapid tip growth: insights from pollen tubes. Sem Cell Dev Biol 22: 816–824
Qu HY, Shang ZL, Zhang SL, Liu LM, Wu JY (2007) Identification of hyperpolarization- activated calcium channels in apical pollen tubes of Pyrus pyrifolia. New Phytol 174: 524-536
Qu X, Zhang H, Xie Y, Wang J, Chen N, Huang S (2013) Arabidopsis villins promote actin turnover at pollen tube tips and facilitate the construction of actin collars. Plant Cell. 25: 1803-1817
Rojas ER, Hotton S, Dumais J (2011) Chemically mediated mechanical expansion of the pollen tube cell wall. Biophys J 101: 1844–1853
Rounds CM, Hepler PK, Fuller SJ, Winship LJ (2010) Oscillatory growth in lily pollen tubes
does not require aerobic energy metabolism. Plant Physiol 152: 736–746
Rounds CM, Lubeck E, Hepler PK, Winship LJ (2011a) Propidium iodide competes with Ca2+
to label pectin in pollen tubes and arabidopsis root hairs. Plant Physiol 157: 175-187
Rounds CM, Winship LJ, Hepler PK (2011b) Pollen tube energetics: respiration, fermentation and the race to the ovule. AoB Plants. doi: 10.1093/aobpla/plr019
Rutten TL, Knuiman B (1993) Brefeldin A effects on tobacco pollen tubes. Eur J Cell Biol 61: 247–255
Shang ZL, Ma LG, Zhang HL, He RR, Wang XC, Cui SJ, Sun DY (2005) Ca2+ influx into lily
pollen grains through a hyperpolarization-activated Ca2+-permeable channel which can be
regulated by extracellular CaM. Plant Cell Physiol 46: 598-608
Staiger CJ, Poulter NS, Henty JL, Franklin-Tong VE, Blanchoin L (2010) Regulation of actin dynamics by actin-binding proteins in pollen. J Exp Bot 61: 1969 –1986
Steer MW, Steer JM (1989) Pollen tube growth. New Phytol 111: 323-358
Vidali L, McKenna ST, Hepler PK (2001) Actin polymerization is essential for pollen tube
growth. Mol Biol Cell 12: 2534–2545
Vidali L, Rounds CM, Hepler PK, Bezanilla M (2009) Lifeact-mEGFP reveals a dynamic apical
F-actin network in tip growing plant cells. PLOS One 4: e5744
Wang Q, Kong L, Hao H, Wang X, Lin J, Samaj J, Baluška F (2005) Effects of brefeldin a on pollen germination and tube growth. Antagonistic effects on endocytosis and secretion. Plant Physiol 139: 1692-1703
www.plantphysiol.orgon February 1, 2018 - Published by Downloaded from Copyright © 2014 American Society of Plant Biologists. All rights reserved.
26
Wang YF, Fan LM, Zhang WZ, Zhang W, Wu WH (2004) Ca2+-permeable channels in the
plasma membrane of arabidopsis pollen are regulated by actin microfilaments. Plant Physiol 136: 3892-3904
Wilsen KL, Lovy-Wheeler A, Voigt B, Menzel D, Kunkel JG, Hepler PK (2006) Imaging the
actin cytoskeleton in growing pollen tubes. Sex Plant Reprod 19: 51-62
Winship LJ, Obermeyer G, Geitmann A, Hepler PK (2010) Under pressure, cell walls set the
pace. Trends Plant Sci 15: 363-369
Wu J, Shang Z, Jiang X, Moschou PN, Sun W, Roubelakis-Angelakis KA, Zhang S (2010) Spermidine oxidase-derived HO regulates pollen plasma membrane hyperpolarization-
activated Ca2+-permeable channels and pollen tube growth. Plant J 63: 1042-1053
Wu Y, Xu X, Li S, Liu T, Ma L, Shang Z (2007) Heterotrimeric G-protein participation in Arabidopsis pollen germination through modulation of a plasmamembrane hyperpolarization-activated Ca2+-permeable channel. New Phytol 176: 550-559
Yan A, Yang Z (2012) FRAP-based analysis of rho GTPase-dependent polar exocytosis in pollen tubes. In F Rivero, JM Walker, eds, Rho GTPases. Springer New York, pp 393–401
Ye J, Zheng Y, Yan A, Chen N, Wang Z, Huang S, Yang Z (2009) Arabidopsis formin3 directs
the formation of actin cables and polarized growth in pollen tubes. Plant Cell 21: 3868–3884
Zhang H, Qu X, Bao C, Khurana P, Wang Q, Xie Y, Zheng Y, Chen N, Blanchoin L, Staiger
CJ, Huang S (2010a) Arabidopsis VILLIN5, an actin filament bundling and severing protein, is necessary for normal pollen tube growth. Plant Cell 22: 2749–2767
Zhang Y, He J, Lee D, McCormick S (2010b) Interdependence of endomembrane trafficking and actin dynamics during polarized growth of Arabidopsis pollen tubes. Plant Physiol 152: 2200–2210
Zonia L, Munnik T (2008) Vesicle trafficking dynamics and visualization of zones of exocytosis
and endocytosis in tobacco pollen tubes. J Exp Bot 59: 861–873
www.plantphysiol.orgon February 1, 2018 - Published by Downloaded from Copyright © 2014 American Society of Plant Biologists. All rights reserved.
27
Figure Legends
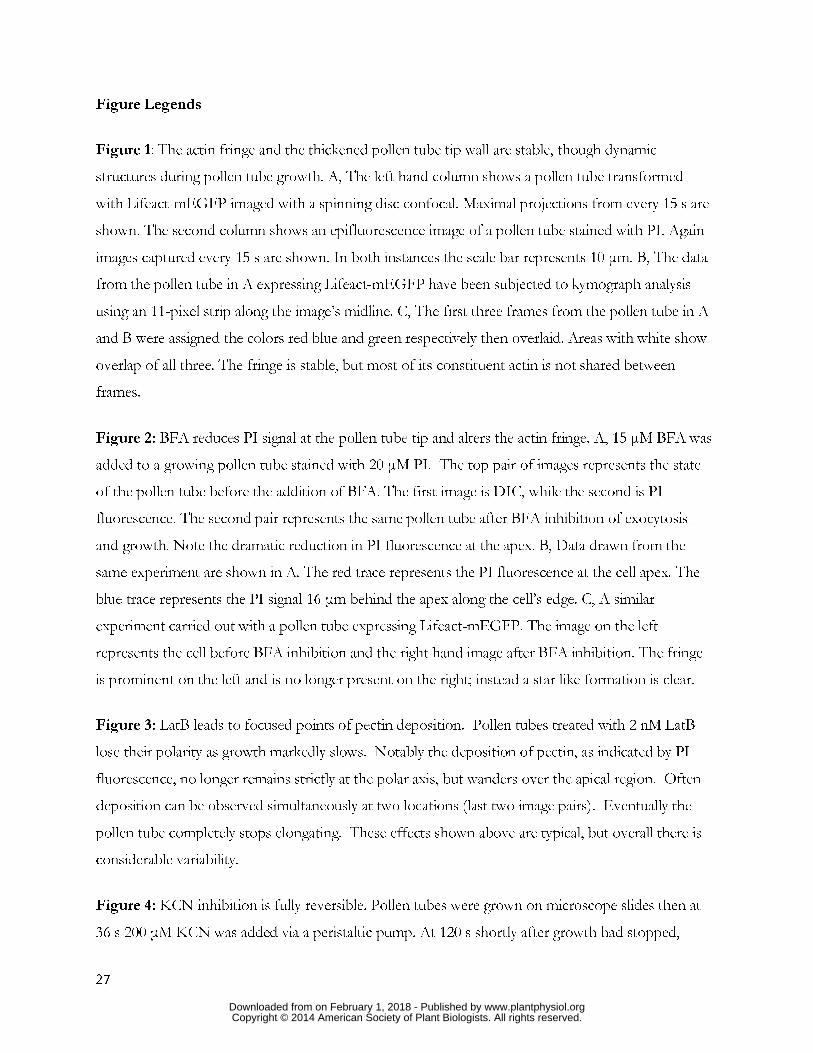
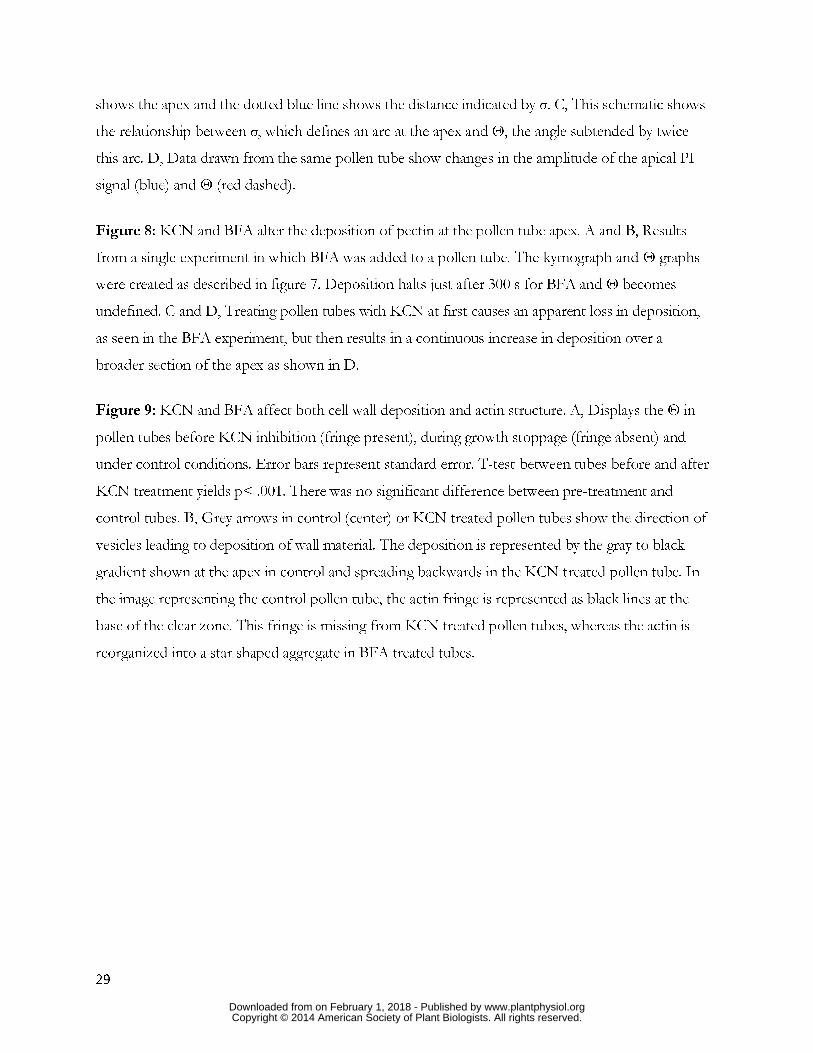
Figure 1: The actin fringe and the thickened pollen tube tip wall are stable, though dynamic
structures during pollen tube growth. A, The left hand column shows a pollen tube transformed
with Lifeact-mEGFP imaged with a spinning disc confocal. Maximal projections from every 15 s are
shown. The second column shows an epifluorescence image of a pollen tube stained with PI. Again
images captured every 15 s are shown. In both instances the scale bar represents 10 μm. B, The data
from the pollen tube in A expressing Lifeact-mEGFP have been subjected to kymograph analysis
using an 11-pixel strip along the image’s midline. C, The first three frames from the pollen tube in A
and B were assigned the colors red blue and green respectively then overlaid. Areas with white show
overlap of all three. The fringe is stable, but most of its constituent actin is not shared between
frames.
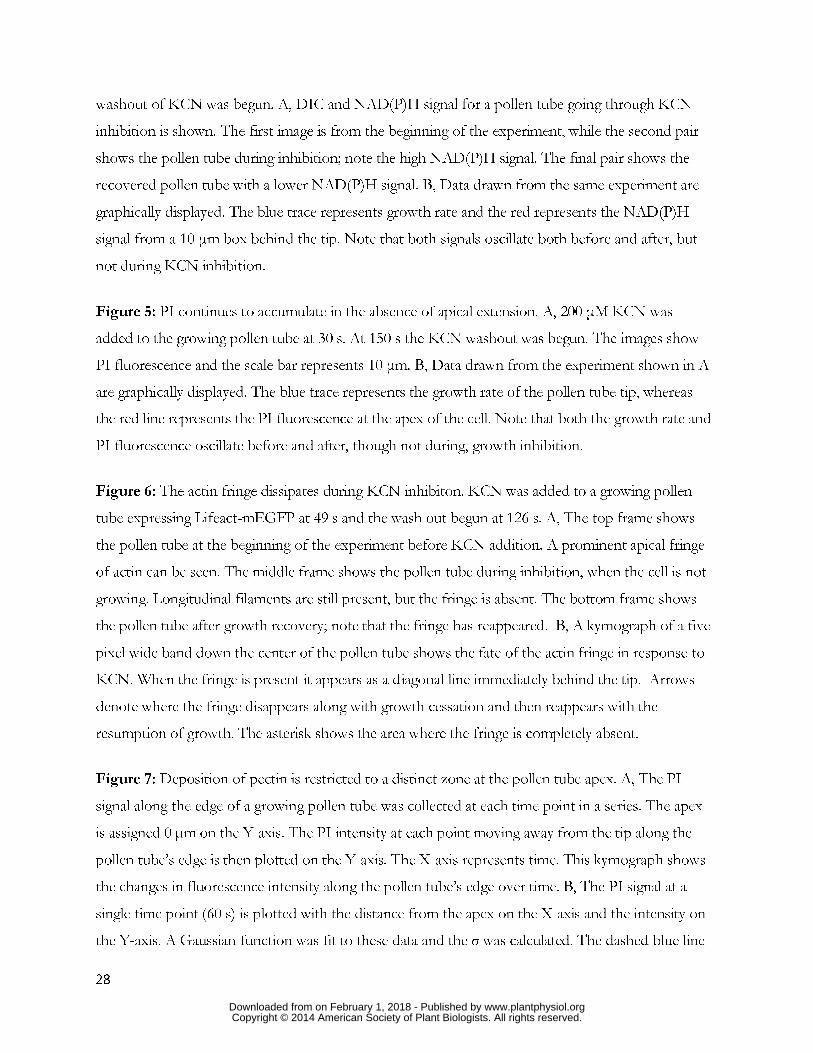
Figure 2: BFA reduces PI signal at the pollen tube tip and alters the actin fringe. A, 15 μM BFA was
added to a growing pollen tube stained with 20 μM PI. The top pair of images represents the state
of the pollen tube before the addition of BFA. The first image is DIC, while the second is PI
fluorescence. The second pair represents the same pollen tube after BFA inhibition of exocytosis
and growth. Note the dramatic reduction in PI fluorescence at the apex. B, Data drawn from the
same experiment are shown in A. The red trace represents the PI fluorescence at the cell apex. The
blue trace represents the PI signal 16 μm behind the apex along the cell’s edge. C, A similar
experiment carried out with a pollen tube expressing Lifeact-mEGFP. The image on the left
represents the cell before BFA inhibition and the right hand image after BFA inhibition. The fringe
is prominent on the left and is no longer present on the right; instead a star like formation is clear.
Figure 3: LatB leads to focused points of pectin deposition. Pollen tubes treated with 2 nM LatB
lose their polarity as growth markedly slows. Notably the deposition of pectin, as indicated by PI
fluorescence, no longer remains strictly at the polar axis, but wanders over the apical region. Often
deposition can be observed simultaneously at two locations (last two image pairs). Eventually the
pollen tube completely stops elongating. These effects shown above are typical, but overall there is
considerable variability.
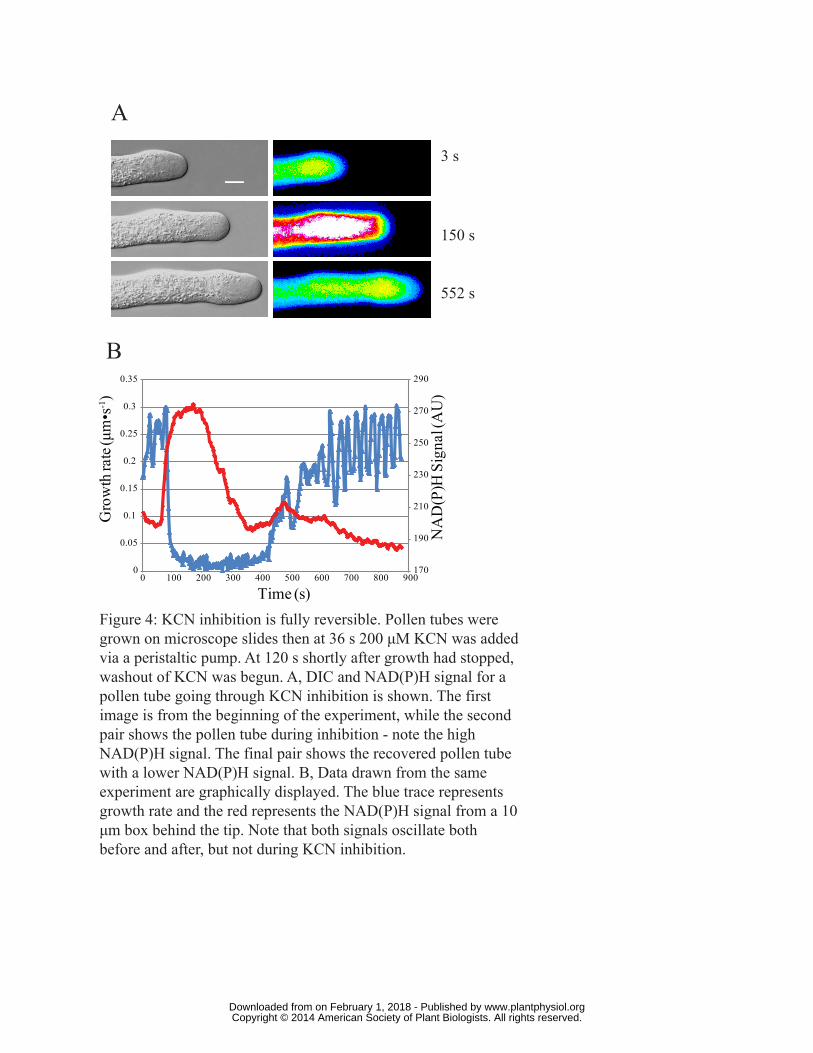
Figure 4: KCN inhibition is fully reversible. Pollen tubes were grown on microscope slides then at
36 s 200 μM KCN was added via a peristaltic pump. At 120 s shortly after growth had stopped,
www.plantphysiol.orgon February 1, 2018 - Published by Downloaded from Copyright © 2014 American Society of Plant Biologists. All rights reserved.
28
washout of KCN was begun. A, DIC and NAD(P)H signal for a pollen tube going through KCN
inhibition is shown. The first image is from the beginning of the experiment, while the second pair
shows the pollen tube during inhibition; note the high NAD(P)H signal. The final pair shows the
recovered pollen tube with a lower NAD(P)H signal. B, Data drawn from the same experiment are
graphically displayed. The blue trace represents growth rate and the red represents the NAD(P)H
signal from a 10 μm box behind the tip. Note that both signals oscillate both before and after, but
not during KCN inhibition.
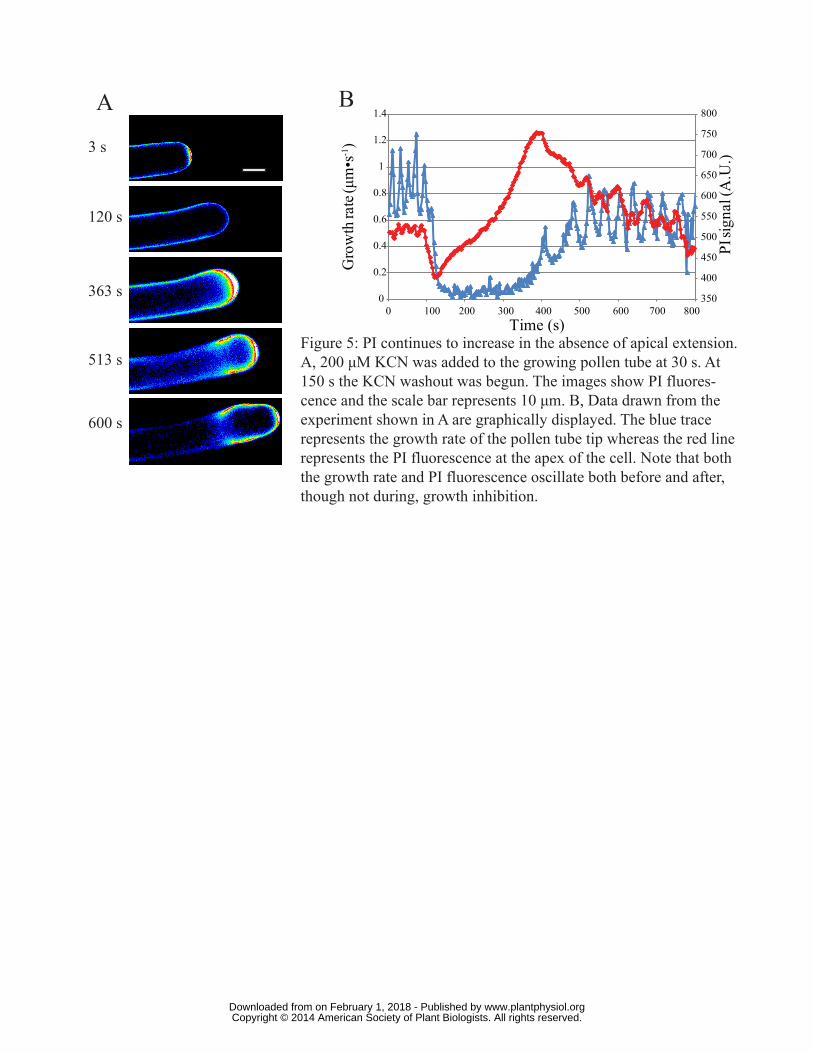
Figure 5: PI continues to accumulate in the absence of apical extension. A, 200 μM KCN was
added to the growing pollen tube at 30 s. At 150 s the KCN washout was begun. The images show
PI fluorescence and the scale bar represents 10 μm. B, Data drawn from the experiment shown in A
are graphically displayed. The blue trace represents the growth rate of the pollen tube tip, whereas
the red line represents the PI fluorescence at the apex of the cell. Note that both the growth rate and
PI fluorescence oscillate before and after, though not during, growth inhibition.
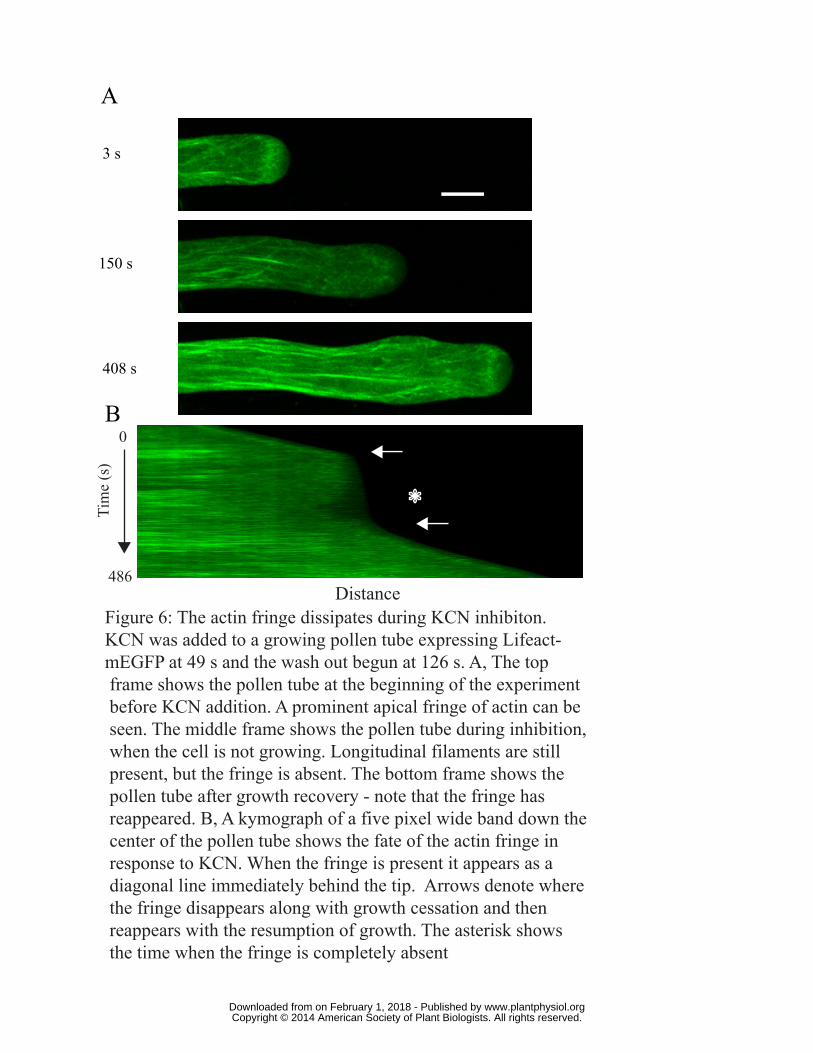
Figure 6: The actin fringe dissipates during KCN inhibiton. KCN was added to a growing pollen
tube expressing Lifeact-mEGFP at 49 s and the wash out begun at 126 s. A, The top frame shows
the pollen tube at the beginning of the experiment before KCN addition. A prominent apical fringe
of actin can be seen. The middle frame shows the pollen tube during inhibition, when the cell is not
growing. Longitudinal filaments are still present, but the fringe is absent. The bottom frame shows
the pollen tube after growth recovery; note that the fringe has reappeared. B, A kymograph of a five
pixel wide band down the center of the pollen tube shows the fate of the actin fringe in response to
KCN. When the fringe is present it appears as a diagonal line immediately behind the tip. Arrows
denote where the fringe disappears along with growth cessation and then reappears with the
resumption of growth. The asterisk shows the area where the fringe is completely absent.
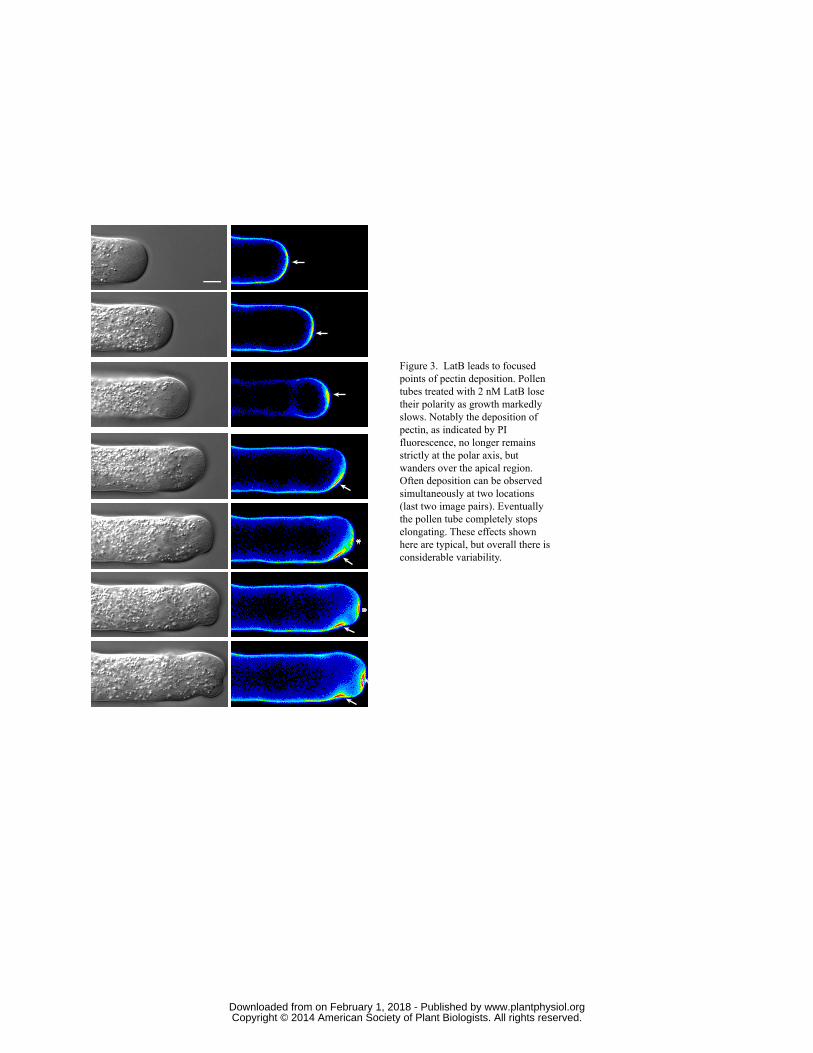
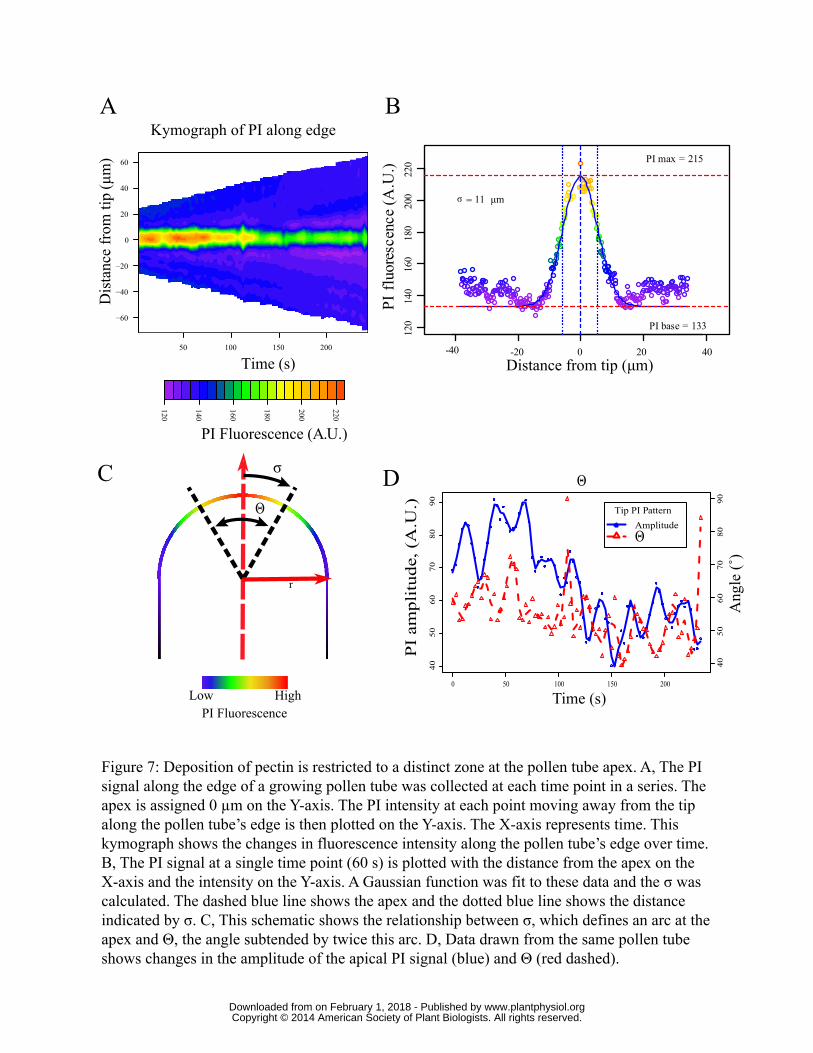
Figure 7: Deposition of pectin is restricted to a distinct zone at the pollen tube apex. A, The PI
signal along the edge of a growing pollen tube was collected at each time point in a series. The apex
is assigned 0 µm on the Y-axis. The PI intensity at each point moving away from the tip along the
pollen tube’s edge is then plotted on the Y-axis. The X-axis represents time. This kymograph shows
the changes in fluorescence intensity along the pollen tube’s edge over time. B, The PI signal at a
single time point (60 s) is plotted with the distance from the apex on the X-axis and the intensity on
the Y-axis. A Gaussian function was fit to these data and the σ was calculated. The dashed blue line
www.plantphysiol.orgon February 1, 2018 - Published by Downloaded from Copyright © 2014 American Society of Plant Biologists. All rights reserved.
29
shows the apex and the dotted blue line shows the distance indicated by σ. C, This schematic shows
the relationship between σ, which defines an arc at the apex and Θ, the angle subtended by twice
this arc. D, Data drawn from the same pollen tube show changes in the amplitude of the apical PI
signal (blue) and Θ (red dashed).
Figure 8: KCN and BFA alter the deposition of pectin at the pollen tube apex. A and B, Results
from a single experiment in which BFA was added to a pollen tube. The kymograph and Θ graphs
were created as described in figure 7. Deposition halts just after 300 s for BFA and Θ becomes
undefined. C and D, Treating pollen tubes with KCN at first causes an apparent loss in deposition,
as seen in the BFA experiment, but then results in a continuous increase in deposition over a
broader section of the apex as shown in D.
Figure 9: KCN and BFA affect both cell wall deposition and actin structure. A, Displays the Θ in
pollen tubes before KCN inhibition (fringe present), during growth stoppage (fringe absent) and
under control conditions. Error bars represent standard error. T-test between tubes before and after
KCN treatment yields p< .001. There was no significant difference between pre-treatment and
control tubes. B, Grey arrows in control (center) or KCN treated pollen tubes show the direction of
vesicles leading to deposition of wall material. The deposition is represented by the gray to black
gradient shown at the apex in control and spreading backwards in the KCN treated pollen tube. In
the image representing the control pollen tube, the actin fringe is represented as black lines at the
base of the clear zone. This fringe is missing from KCN treated pollen tubes, whereas the actin is
reorganized into a star shaped aggregate in BFA treated tubes.
www.plantphysiol.orgon February 1, 2018 - Published by Downloaded from Copyright © 2014 American Society of Plant Biologists. All rights reserved.

www.plantphysiol.orgon February 1, 2018 - Published by Downloaded from Copyright © 2014 American Society of Plant Biologists. All rights reserved.
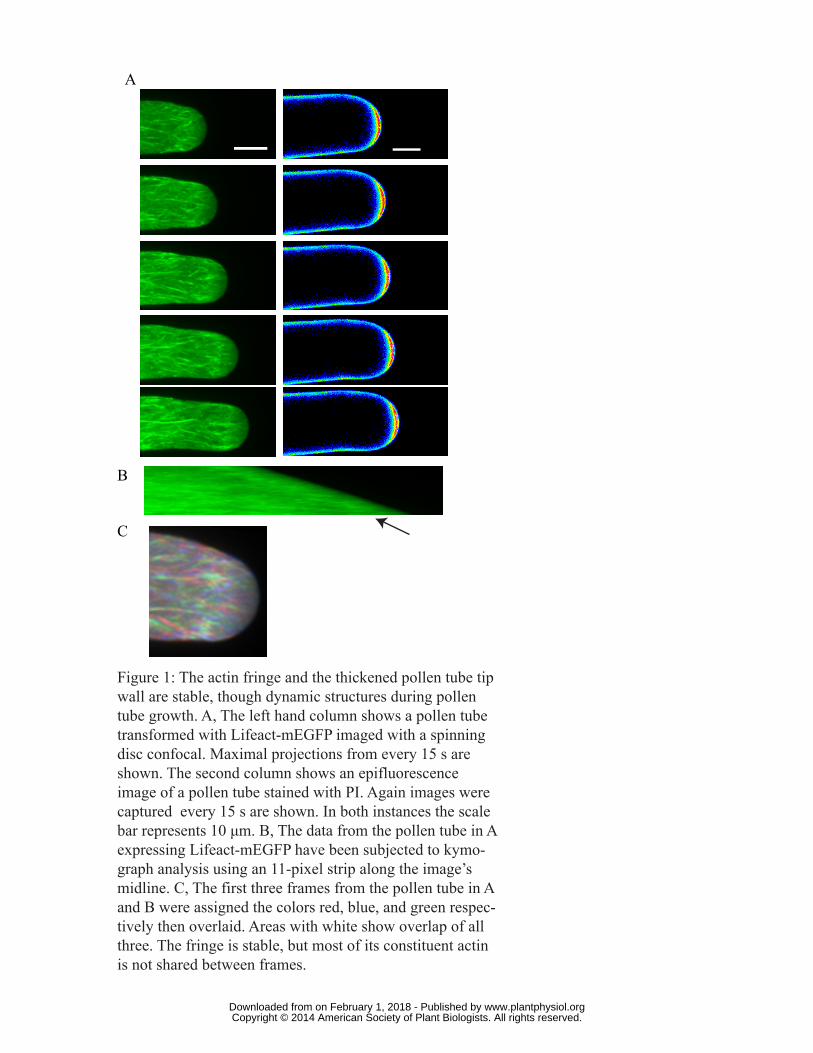
Figure 1: The actin fringe and the thickened pollen tube tip wall are stable, though dynamic structures during pollen tube growth. A, The left hand column shows a pollen tube transformed with Lifeact-mEGFP imaged with a spinning disc confocal. Maximal projections from every 15 s are shown. The second column shows an epifluorescence image of a pollen tube stained with PI. Again images were captured every 15 s are shown. In both instances the scale bar represents 10 μm. B, The data from the pollen tube in A expressing Lifeact-mEGFP have been subjected to kymo-graph analysis using an 11-pixel strip along the image’s midline. C, The first three frames from the pollen tube in A and B were assigned the colors red, blue, and green respec-tively then overlaid. Areas with white show overlap of all three. The fringe is stable, but most of its constituent actin is not shared between frames.
A
B
C
www.plantphysiol.orgon February 1, 2018 - Published by Downloaded from Copyright © 2014 American Society of Plant Biologists. All rights reserved.
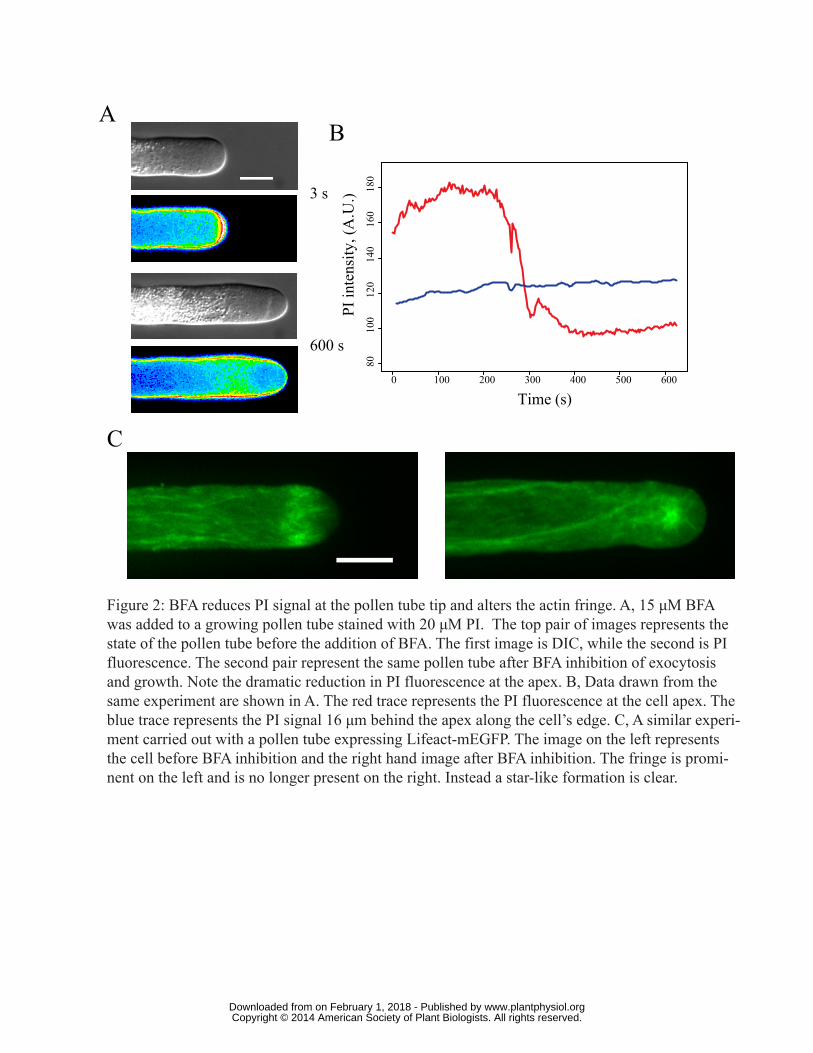
Figure 2: BFA reduces PI signal at the pollen tube tip and alters the actin fringe. A, 15 μM BFA was added to a growing pollen tube stained with 20 μM PI. The top pair of images represents the state of the pollen tube before the addition of BFA. The first image is DIC, while the second is PI fluorescence. The second pair represent the same pollen tube after BFA inhibition of exocytosis and growth. Note the dramatic reduction in PI fluorescence at the apex. B, Data drawn from the same experiment are shown in A. The red trace represents the PI fluorescence at the cell apex. The blue trace represents the PI signal 16 μm behind the apex along the cell’s edge. C, A similar experi-ment carried out with a pollen tube expressing Lifeact-mEGFP. The image on the left represents the cell before BFA inhibition and the right hand image after BFA inhibition. The fringe is promi-nent on the left and is no longer present on the right. Instead a star-like formation is clear.
0 100 200 300 400 500 60080
100
120
140
160
180
Time (s)
PI in
tens
ity, (
A.U
.)
AB
C
3 s
600 s
www.plantphysiol.orgon February 1, 2018 - Published by Downloaded from Copyright © 2014 American Society of Plant Biologists. All rights reserved.
*
*
*
Figure 3. LatB leads to focused points of pectin deposition. Pollen tubes treated with 2 nM LatB lose their polarity as growth markedly slows. Notably the deposition of pectin, as indicated by PI fluorescence, no longer remains strictly at the polar axis, but wanders over the apical region. Often deposition can be observed simultaneously at two locations (last two image pairs). Eventually the pollen tube completely stops elongating. These effects shown here are typical, but overall there is considerable variability.
www.plantphysiol.orgon February 1, 2018 - Published by Downloaded from Copyright © 2014 American Society of Plant Biologists. All rights reserved.
170
190
210
230
250
270
290
0
0.05
0.1
0.15
0.2
0.25
0.3
0.35
0 100 200 300 400 500 600 700 800 900
NA
D(P
)H S
igna
l (A
U)
Time (s)Figure 4: KCN inhibition is fully reversible. Pollen tubes were grown on microscope slides then at 36 s 200 μM KCN was added via a peristaltic pump. At 120 s shortly after growth had stopped, washout of KCN was begun. A, DIC and NAD(P)H signal for a pollen tube going through KCN inhibition is shown. The first image is from the beginning of the experiment, while the second pair shows the pollen tube during inhibition - note the high NAD(P)H signal. The final pair shows the recovered pollen tube with a lower NAD(P)H signal. B, Data drawn from the same experiment are graphically displayed. The blue trace represents growth rate and the red represents the NAD(P)H signal from a 10 μm box behind the tip. Note that both signals oscillate both before and after, but not during KCN inhibition.
A
B
Gro
wth
rate
(μm
•s-1)
3 s
150 s
552 s
www.plantphysiol.orgon February 1, 2018 - Published by Downloaded from Copyright © 2014 American Society of Plant Biologists. All rights reserved.
350
400
450
500
550
600
650
700
750
800
0
0.2
0.4
0.6
0.8
1
1.2
1.4
0 100 200 300 400 500 600 700 800
PI si
gnal
(A.U
.)
Gro
wth
rate
(μm
•s-1)
Time (s)Figure 5: PI continues to increase in the absence of apical extension. A, 200 μM KCN was added to the growing pollen tube at 30 s. At 150 s the KCN washout was begun. The images show PI fluores-cence and the scale bar represents 10 μm. B, Data drawn from the experiment shown in A are graphically displayed. The blue trace represents the growth rate of the pollen tube tip whereas the red line represents the PI fluorescence at the apex of the cell. Note that both the growth rate and PI fluorescence oscillate both before and after, though not during, growth inhibition.
3 s
120 s
363 s
513 s
600 s
A B
www.plantphysiol.orgon February 1, 2018 - Published by Downloaded from Copyright © 2014 American Society of Plant Biologists. All rights reserved.
Distance
Tim
e (s
)
0
486
Figure 6: The actin fringe dissipates during KCN inhibiton. KCN was added to a growing pollen tube expressing Lifeact-mEGFP at 49 s and the wash out begun at 126 s. A, The top frame shows the pollen tube at the beginning of the experiment before KCN addition. A prominent apical fringe of actin can be seen. The middle frame shows the pollen tube during inhibition, when the cell is not growing. Longitudinal filaments are still present, but the fringe is absent. The bottom frame shows the pollen tube after growth recovery - note that the fringe has reappeared. B, A kymograph of a five pixel wide band down the center of the pollen tube shows the fate of the actin fringe in response to KCN. When the fringe is present it appears as a diagonal line immediately behind the tip. Arrows denote where the fringe disappears along with growth cessation and then reappears with the resumption of growth. The asterisk shows the time when the fringe is completely absent
*
A
3 s
150 s
408 s
B
www.plantphysiol.orgon February 1, 2018 - Published by Downloaded from Copyright © 2014 American Society of Plant Biologists. All rights reserved.
PI FluorescenceHighLow
r
σ
Figure 7: Deposition of pectin is restricted to a distinct zone at the pollen tube apex. A, The PI signal along the edge of a growing pollen tube was collected at each time point in a series. The apex is assigned 0 µm on the Y-axis. The PI intensity at each point moving away from the tip along the pollen tube’s edge is then plotted on the Y-axis. The X-axis represents time. This kymograph shows the changes in fluorescence intensity along the pollen tube’s edge over time. B, The PI signal at a single time point (60 s) is plotted with the distance from the apex on the X-axis and the intensity on the Y-axis. A Gaussian function was fit to these data and the σ was calculated. The dashed blue line shows the apex and the dotted blue line shows the distance indicated by σ. C, This schematic shows the relationship between σ, which defines an arc at the apex and Θ, the angle subtended by twice this arc. D, Data drawn from the same pollen tube shows changes in the amplitude of the apical PI signal (blue) and Θ (red dashed).
DC
BA
Ang
le (˚
)
Tip PI PatternAmplitudeΘ
0 50 100 150 200
4050
6070
8090Θ
Θ
PI
ampl
itud
e, (
A.U
.)
Time (s)40
5060
7080
90
PI Fluorescence (A.U.)
120
140
160
180
200
220
50 100 150 200
−60
−40
−20
0
20
40
60
Kymograph of PI along edge
Time (s)
Dis
tanc
e fr
om ti
p (μ
m)
-40 -20 0 20 40
120
140
160
180
200
220
PI fl
uore
scen
ce (A
.U.)
PI max = 215
PI base = 133
= 11 μmσ
Distance from tip (μm)
www.plantphysiol.orgon February 1, 2018 - Published by Downloaded from Copyright © 2014 American Society of Plant Biologists. All rights reserved.
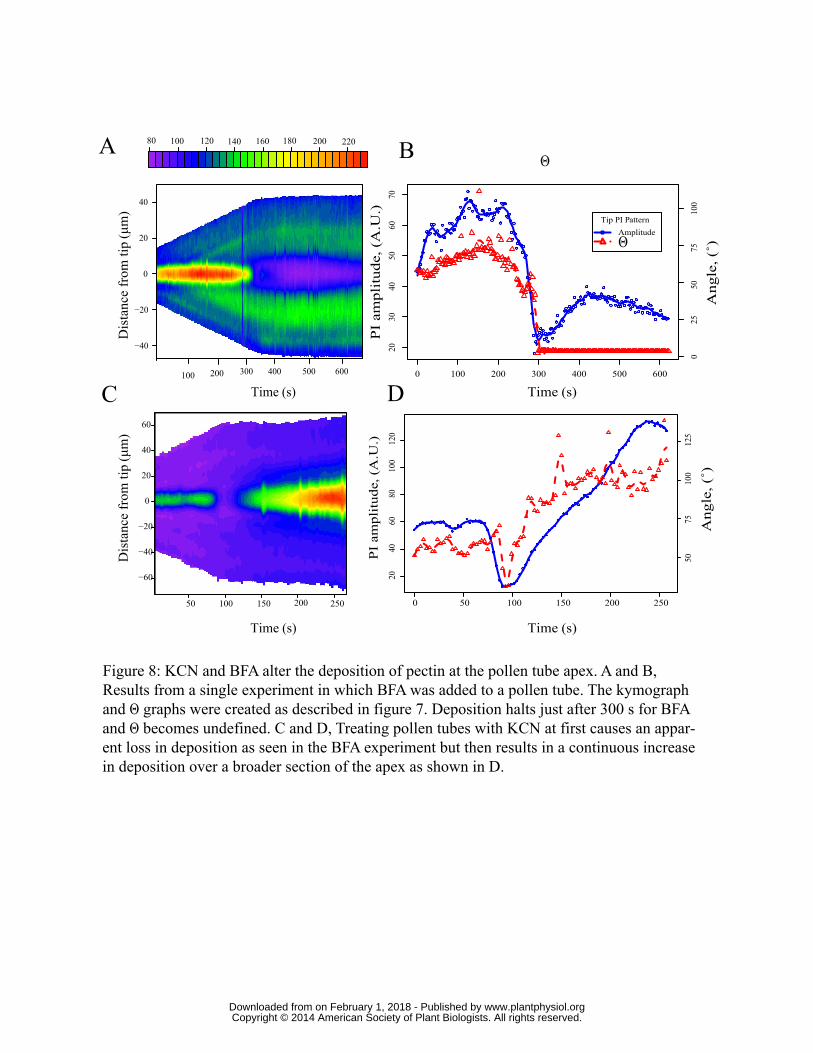
0 100 200 300 400 500 600
2030
4050
6070
Time (s)
025
5075
100
Tip PI PatternAmplitudeΘ
0 50 100 150 200 250
2040
6080
100
120
5075
100
125
Time, s
PI a
mpl
itude
, (A
.U.)
PI Dispersion
Time (s)
Ang
le, (˚)
PI
ampl
itud
e, (
A.U
.)
Ang
le, (˚)
50 100 150 200 250
−60
−40
−20
0
20
40
60
Time (s)
200100
angl
e (˚
)
300 400 500 600
−40
−20
0
20
40
Time (s)
Dis
tanc
e fr
om ti
p (μ
m)
Dis
tanc
e fr
om ti
p (μ
m)
80 100 120 140 160 180 200 220A
C
B
D
Figure 8: KCN and BFA alter the deposition of pectin at the pollen tube apex. A and B, Results from a single experiment in which BFA was added to a pollen tube. The kymograph and Θ graphs were created as described in figure 7. Deposition halts just after 300 s for BFA and Θ becomes undefined. C and D, Treating pollen tubes with KCN at first causes an appar-ent loss in deposition as seen in the BFA experiment but then results in a continuous increase in deposition over a broader section of the apex as shown in D.
Θ
www.plantphysiol.orgon February 1, 2018 - Published by Downloaded from Copyright © 2014 American Society of Plant Biologists. All rights reserved.
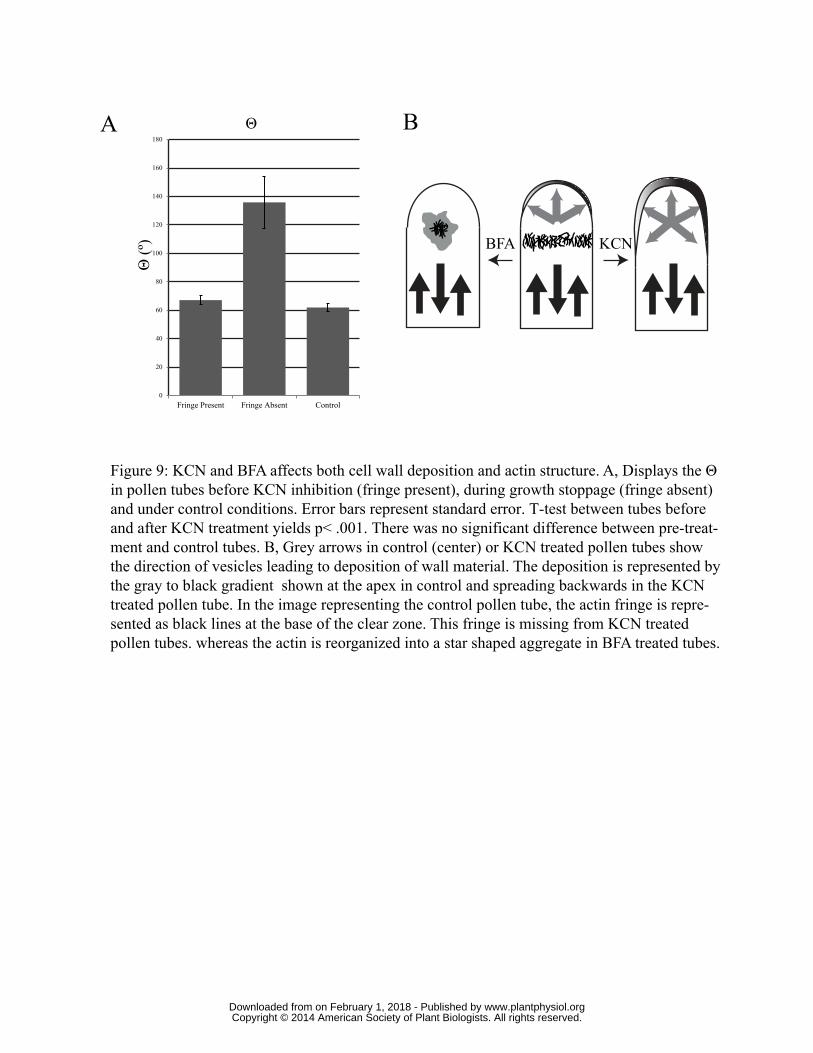
Figure 9: KCN and BFA affects both cell wall deposition and actin structure. A, Displays the Θ in pollen tubes before KCN inhibition (fringe present), during growth stoppage (fringe absent) and under control conditions. Error bars represent standard error. T-test between tubes before and after KCN treatment yields p< .001. There was no significant difference between pre-treat-ment and control tubes. B, Grey arrows in control (center) or KCN treated pollen tubes show the direction of vesicles leading to deposition of wall material. The deposition is represented by the gray to black gradient shown at the apex in control and spreading backwards in the KCN treated pollen tube. In the image representing the control pollen tube, the actin fringe is repre-sented as black lines at the base of the clear zone. This fringe is missing from KCN treated pollen tubes. whereas the actin is reorganized into a star shaped aggregate in BFA treated tubes.
BFA KCN
0
20
40
60
80
100
120
140
160
180
Fringe Present Fringe Absent Control
Θ (º
)ΘA B
www.plantphysiol.orgon February 1, 2018 - Published by Downloaded from Copyright © 2014 American Society of Plant Biologists. All rights reserved.