rto information - jetset training college · name donrose pty ltd t/as jetset training college...
TRANSCRIPT

RTO Information
This report presents summary information about the Registered Training Organisation
Name Donrose Pty Ltd t/as Jetset Training College
Street AddressLevel 6461 Bourke St
City/town/suburb Melbourne
State VIC
Post code 3000
NTIS number 20864

Summary ReportThe Summary Report provides information about the RTO and a snapshot of results for the scales measured by theLearner Questionnaire (LQ) and Employer Questionnaire (EQ).
For each scale, the Summary Report presents information about the:
count of responses used to calculate the scale score;average scale score; andvariation in scale scores.
Scores are reported on the response scale of 0 to 100, where 0 means 'strongly disagree' and 100 means 'stronglyagree'.
Results are provided for learners and/or employers depending on the data entered into SMART.
This Summary Report can be used to analyse the number, average and variation of the survey responses.Comparisons can be made across scales, to previous reports, or between learners and employers.
Summary statistics
Learners Employers
Scale Responsecount
Averagescore
Averagevariation
Responsecount
Averagescore
Averagevariation
Trainer Quality 58 93.2 9.0
Effective Assessment 58 92.3 10.0
Clear Expectations 58 91.0 10.3
Learning Stimulation 58 91.2 10.1
Training Relevance 58 92.7 10.7
Competency Development 58 92.0 9.7
Training Resources 58 91.8 10.9
Effective Support 58 90.6 10.8
Active Learning 58 89.6 11.9
Overall Satisfaction 58 94.1 8.6

Respondent ReportThe Respondent Report provides summary information about learner demographics and training characteristics.
For each characteristic, the Respondent Report presents the:
number of learners/employers in the population;number of survey respondents; andpercentage of respondents.
Results are provided for learners and/or employers depending on the data entered into SMART.
This Respondent Report can be used to analyse the distribution of survey respondents across the RTO learnerand/or employer population. It provides information on the representativeness and hence generalisability of thesurvey responses.

Characteristic
Learners Employers
Populationcount
Respondentcount
Responseper cent
Populationcount
Respondentcount
Responseper cent
Field ofeducation
Natural and physicalsciences
Informationtechnology
Engineering andrelated technologies
Architecture andbuilding
Agriculture,environmental andrelated studies
Health
Education
Management andcommerce
Society and culture
Creative arts
Food, hospitalityand personalservices
Other
TOTAL 0 54 0.0 0 0 0.0
Qualificationlevel
Certificate I
Certificate II
Certificate III
Certificate IV
Certificate levelunknown
Diploma
Advanced diploma
Associate degree
Degree
Short course orstatement ofattainment
VET GraduateCertificate orDiploma
Other qualificationor training
Do not know
Total 0 54 0.0

Item ReportThe Item Report presents information about learner and employer responses to individual items on the LearnerQuestionnaire (LQ) and/or Employer Questionnaire (EQ).
For each item, the Item Report presents information on the:
number of valid responses to each response category 'strongly disagree' (SD), 'disagree' (D), 'agree' (A),'strongly agree' (SA), the number of 'agreement' (AG) responses, and the number of missing (MI)responses;percentage of valid responses to each response category 'strongly disagree' (SD), 'disagree' (D), 'agree' (A),'strongly agree' (SA), the number of 'agreement' (AG) responses, and the number of missing (MI)responses;average score; andvariation in scores.
Scores are reported on the response scale of 0 to 100, where 0 means 'strongly disagree' and 100 means 'stronglyagree'.
Results are provided for learners and/or employers depending on the data entered into SMART.
This Item Report can be used to analyse feedback on phenomenon measured by each LQ and/or EQ item. Itprovides detailed information that can be used to address specific aaspects of education and training.

LQ response category numbers
Item SD D A SA AG MI
LQ1 Trainers encouraged learners to ask questions. 0 0 14 44 58 0
LQ2 Trainers made the subject as interesting as possible. 0 0 12 46 58 0
LQ3 Trainers had an excellent knowledge of the subject content. 0 0 12 46 58 0
LQ4 Trainers explained things clearly. 0 0 9 49 58 0
LQ5 Overall, I am satisfied with the training. 0 0 16 42 58 0
LQ6 I would recommend the training to others. 0 0 4 54 58 0
LQ7 I would recommend the training organisation to others. 0 0 11 47 58 0
LQ8 I received useful feedback on my assessments. 0 1 12 45 57 0
LQ9 Assessments were based on realistic activities. 0 0 11 46 57 1
LQ10 The way I was assessed was a fair test of my skills and knowledge. 0 0 14 44 58 0
LQ11 The training organisation gave appropriate recognition of existingknowledge and skills.
0 0 14 43 57 1
LQ12 It was always easy to know the standards expected. 0 0 14 44 58 0
LQ13 I usually had a clear idea of what was expected of me. 0 0 19 39 58 0
LQ14 Trainers made it clear right from the start what they expected from me. 0 0 14 44 58 0
LQ15 I was given enough material to keep up my interest. 0 0 11 47 58 0
LQ16 The amount of work I had to do was reasonable. 0 0 18 40 58 0
LQ17 The training was at the right level of difficulty for me. 0 0 17 41 58 0
LQ18 The training focused on relevant skills. 0 0 13 45 58 0
LQ19 The training prepared me well for work. 0 0 14 43 57 1
LQ20 The training had a good mix of theory and practice. 0 1 9 48 57 0
LQ21 I developed the skills expected from this training. 0 0 10 48 58 0
LQ22 I learned to work with people. 0 0 15 43 58 0
LQ23 I identified ways to build on my current knowledge and skills. 0 0 11 47 58 0
LQ24 I developed the knowledge expected from this training. 0 0 15 43 58 0
LQ25 I learned to plan and manage my work. 0 2 15 41 56 0
LQ26 Training resources were available when I needed them. 0 0 16 42 58 0
LQ27 The training used up-to-date equipment, facilities and materials. 0 0 12 45 57 1
LQ28 Training facilities and materials were in good condition. 0 0 13 44 57 1
LQ29 Training organisation staff respected my background and needs. 0 0 16 42 58 0
LQ30 The training was flexible enough to meet my needs. 0 0 13 45 58 0
LQ31 The training organisation had a range of services to support learners. 0 1 17 39 56 1
LQ32 I set high standards for myself in this training. 0 0 18 40 58 0
LQ33 I pushed myself to understand things I found confusing. 0 0 13 44 57 1
LQ34 I looked for my own resources to help me learn. 0 2 21 35 56 0
LQ35 I approached trainers if I needed help. 0 0 16 42 58 0

LQ response category percentages
Item SD D A SA AG MI
LQ1 Trainers encouraged learners to ask questions. 0.0 0.0 24.1 75.9 100.0 0.0
LQ2 Trainers made the subject as interesting as possible. 0.0 0.0 20.7 79.3 100.0 0.0
LQ3 Trainers had an excellent knowledge of the subject content. 0.0 0.0 20.7 79.3 100.0 0.0
LQ4 Trainers explained things clearly. 0.0 0.0 15.5 84.5 100.0 0.0
LQ5 Overall, I am satisfied with the training. 0.0 0.0 27.6 72.4 100.0 0.0
LQ6 I would recommend the training to others. 0.0 0.0 6.9 93.1 100.0 0.0
LQ7 I would recommend the training organisation to others. 0.0 0.0 19.0 81.0 100.0 0.0
LQ8 I received useful feedback on my assessments. 0.0 1.7 20.7 77.6 98.3 0.0
LQ9 Assessments were based on realistic activities. 0.0 0.0 19.3 80.7 100.0 1.7
LQ10 The way I was assessed was a fair test of my skills and knowledge. 0.0 0.0 24.1 75.9 100.0 0.0
LQ11 The training organisation gave appropriate recognition of existingknowledge and skills.
0.0 0.0 24.6 75.4 100.0 1.7
LQ12 It was always easy to know the standards expected. 0.0 0.0 24.1 75.9 100.0 0.0
LQ13 I usually had a clear idea of what was expected of me. 0.0 0.0 32.8 67.3 100.0 0.0
LQ14 Trainers made it clear right from the start what they expected from me. 0.0 0.0 24.1 75.9 100.0 0.0
LQ15 I was given enough material to keep up my interest. 0.0 0.0 19.0 81.0 100.0 0.0
LQ16 The amount of work I had to do was reasonable. 0.0 0.0 31.0 69.0 100.0 0.0
LQ17 The training was at the right level of difficulty for me. 0.0 0.0 29.3 70.7 100.0 0.0
LQ18 The training focused on relevant skills. 0.0 0.0 22.4 77.6 100.0 0.0
LQ19 The training prepared me well for work. 0.0 0.0 24.6 75.4 100.0 1.7
LQ20 The training had a good mix of theory and practice. 0.0 1.7 15.5 82.8 98.3 0.0
LQ21 I developed the skills expected from this training. 0.0 0.0 17.3 82.8 100.0 0.0
LQ22 I learned to work with people. 0.0 0.0 25.9 74.1 100.0 0.0
LQ23 I identified ways to build on my current knowledge and skills. 0.0 0.0 19.0 81.0 100.0 0.0
LQ24 I developed the knowledge expected from this training. 0.0 0.0 25.9 74.1 100.0 0.0
LQ25 I learned to plan and manage my work. 0.0 3.5 25.9 70.7 96.6 0.0
LQ26 Training resources were available when I needed them. 0.0 0.0 27.6 72.4 100.0 0.0
LQ27 The training used up-to-date equipment, facilities and materials. 0.0 0.0 21.1 79.0 100.0 1.7
LQ28 Training facilities and materials were in good condition. 0.0 0.0 22.8 77.2 100.0 1.7
LQ29 Training organisation staff respected my background and needs. 0.0 0.0 27.6 72.4 100.0 0.0
LQ30 The training was flexible enough to meet my needs. 0.0 0.0 22.4 77.6 100.0 0.0
LQ31 The training organisation had a range of services to support learners. 0.0 1.8 29.8 68.4 98.3 1.7
LQ32 I set high standards for myself in this training. 0.0 0.0 31.0 69.0 100.0 0.0
LQ33 I pushed myself to understand things I found confusing. 0.0 0.0 22.8 77.2 100.0 1.7
LQ34 I looked for my own resources to help me learn. 0.0 3.5 36.2 60.4 96.6 0.0
LQ35 I approached trainers if I needed help. 0.0 0.0 27.6 72.4 100.0 0.0
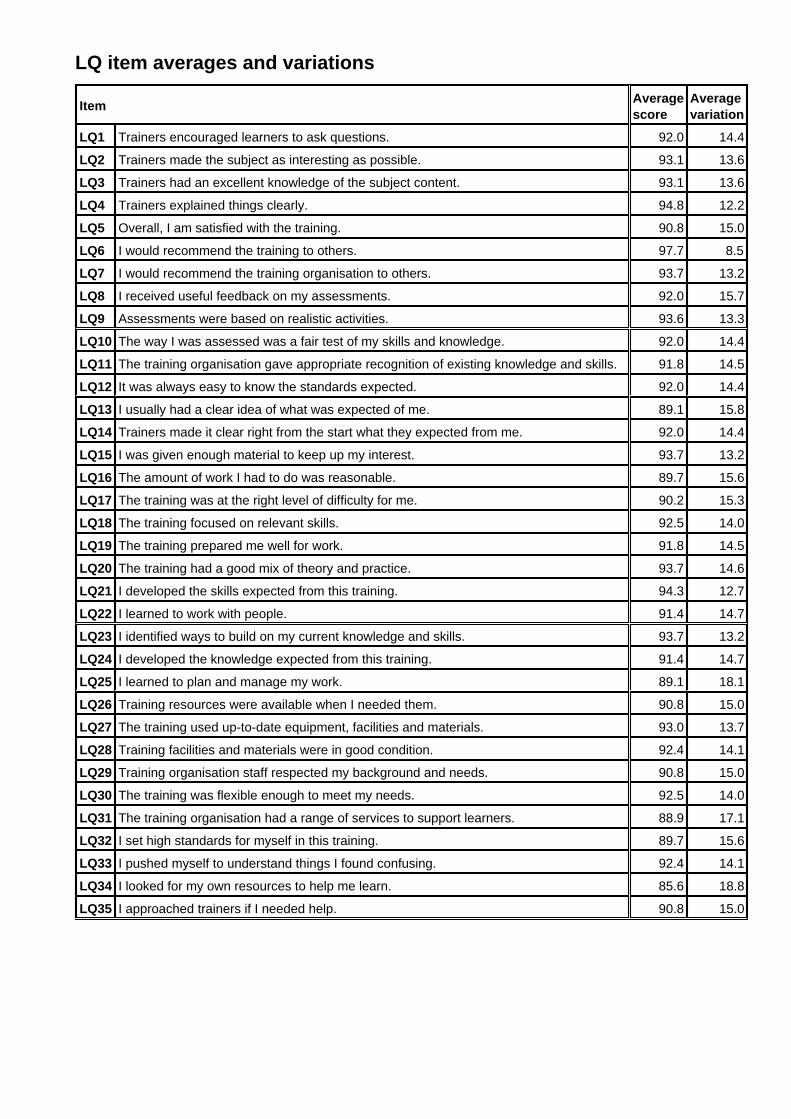
LQ item averages and variations
Item Averagescore
Averagevariation
LQ1 Trainers encouraged learners to ask questions. 92.0 14.4
LQ2 Trainers made the subject as interesting as possible. 93.1 13.6
LQ3 Trainers had an excellent knowledge of the subject content. 93.1 13.6
LQ4 Trainers explained things clearly. 94.8 12.2
LQ5 Overall, I am satisfied with the training. 90.8 15.0
LQ6 I would recommend the training to others. 97.7 8.5
LQ7 I would recommend the training organisation to others. 93.7 13.2
LQ8 I received useful feedback on my assessments. 92.0 15.7
LQ9 Assessments were based on realistic activities. 93.6 13.3
LQ10 The way I was assessed was a fair test of my skills and knowledge. 92.0 14.4
LQ11 The training organisation gave appropriate recognition of existing knowledge and skills. 91.8 14.5
LQ12 It was always easy to know the standards expected. 92.0 14.4
LQ13 I usually had a clear idea of what was expected of me. 89.1 15.8
LQ14 Trainers made it clear right from the start what they expected from me. 92.0 14.4
LQ15 I was given enough material to keep up my interest. 93.7 13.2
LQ16 The amount of work I had to do was reasonable. 89.7 15.6
LQ17 The training was at the right level of difficulty for me. 90.2 15.3
LQ18 The training focused on relevant skills. 92.5 14.0
LQ19 The training prepared me well for work. 91.8 14.5
LQ20 The training had a good mix of theory and practice. 93.7 14.6
LQ21 I developed the skills expected from this training. 94.3 12.7
LQ22 I learned to work with people. 91.4 14.7
LQ23 I identified ways to build on my current knowledge and skills. 93.7 13.2
LQ24 I developed the knowledge expected from this training. 91.4 14.7
LQ25 I learned to plan and manage my work. 89.1 18.1
LQ26 Training resources were available when I needed them. 90.8 15.0
LQ27 The training used up-to-date equipment, facilities and materials. 93.0 13.7
LQ28 Training facilities and materials were in good condition. 92.4 14.1
LQ29 Training organisation staff respected my background and needs. 90.8 15.0
LQ30 The training was flexible enough to meet my needs. 92.5 14.0
LQ31 The training organisation had a range of services to support learners. 88.9 17.1
LQ32 I set high standards for myself in this training. 89.7 15.6
LQ33 I pushed myself to understand things I found confusing. 92.4 14.1
LQ34 I looked for my own resources to help me learn. 85.6 18.8
LQ35 I approached trainers if I needed help. 90.8 15.0
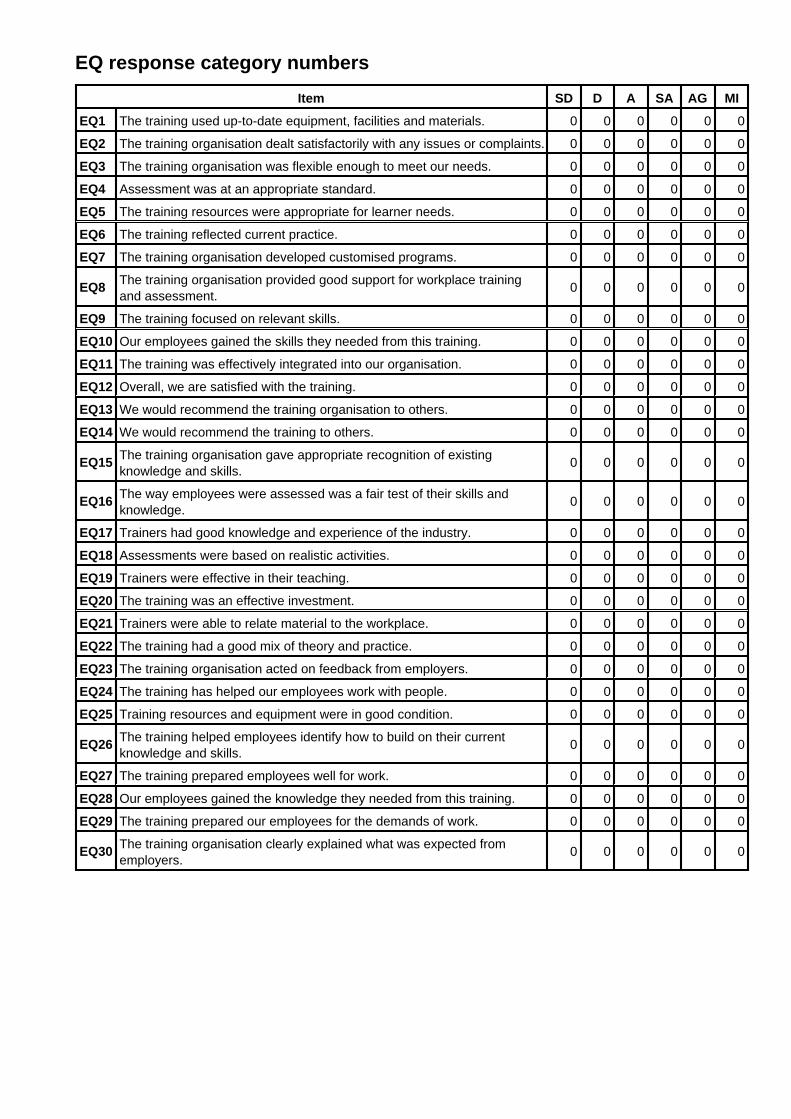
EQ response category numbers
Item SD D A SA AG MI
EQ1 The training used up-to-date equipment, facilities and materials. 0 0 0 0 0 0
EQ2 The training organisation dealt satisfactorily with any issues or complaints. 0 0 0 0 0 0
EQ3 The training organisation was flexible enough to meet our needs. 0 0 0 0 0 0
EQ4 Assessment was at an appropriate standard. 0 0 0 0 0 0
EQ5 The training resources were appropriate for learner needs. 0 0 0 0 0 0
EQ6 The training reflected current practice. 0 0 0 0 0 0
EQ7 The training organisation developed customised programs. 0 0 0 0 0 0
EQ8 The training organisation provided good support for workplace trainingand assessment.
0 0 0 0 0 0
EQ9 The training focused on relevant skills. 0 0 0 0 0 0
EQ10 Our employees gained the skills they needed from this training. 0 0 0 0 0 0
EQ11 The training was effectively integrated into our organisation. 0 0 0 0 0 0
EQ12 Overall, we are satisfied with the training. 0 0 0 0 0 0
EQ13 We would recommend the training organisation to others. 0 0 0 0 0 0
EQ14 We would recommend the training to others. 0 0 0 0 0 0
EQ15 The training organisation gave appropriate recognition of existingknowledge and skills.
0 0 0 0 0 0
EQ16 The way employees were assessed was a fair test of their skills andknowledge.
0 0 0 0 0 0
EQ17 Trainers had good knowledge and experience of the industry. 0 0 0 0 0 0
EQ18 Assessments were based on realistic activities. 0 0 0 0 0 0
EQ19 Trainers were effective in their teaching. 0 0 0 0 0 0
EQ20 The training was an effective investment. 0 0 0 0 0 0
EQ21 Trainers were able to relate material to the workplace. 0 0 0 0 0 0
EQ22 The training had a good mix of theory and practice. 0 0 0 0 0 0
EQ23 The training organisation acted on feedback from employers. 0 0 0 0 0 0
EQ24 The training has helped our employees work with people. 0 0 0 0 0 0
EQ25 Training resources and equipment were in good condition. 0 0 0 0 0 0
EQ26 The training helped employees identify how to build on their currentknowledge and skills.
0 0 0 0 0 0
EQ27 The training prepared employees well for work. 0 0 0 0 0 0
EQ28 Our employees gained the knowledge they needed from this training. 0 0 0 0 0 0
EQ29 The training prepared our employees for the demands of work. 0 0 0 0 0 0
EQ30 The training organisation clearly explained what was expected fromemployers.
0 0 0 0 0 0
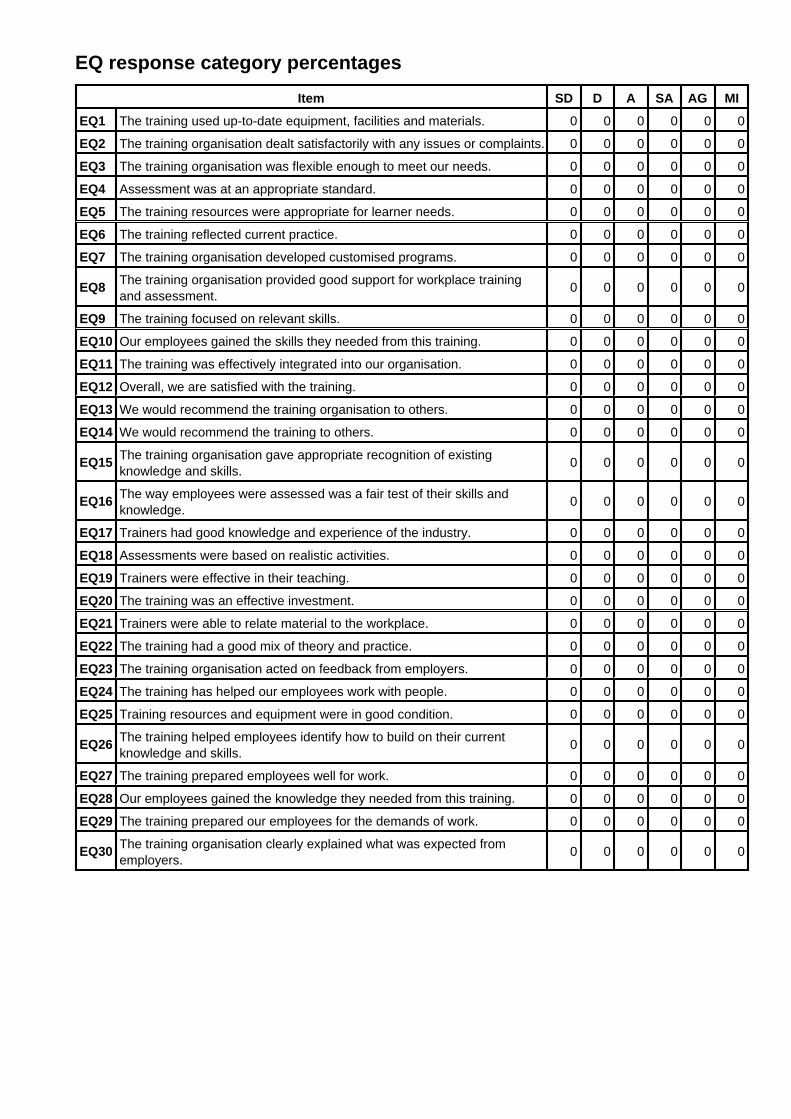
EQ response category percentages
Item SD D A SA AG MI
EQ1 The training used up-to-date equipment, facilities and materials. 0 0 0 0 0 0
EQ2 The training organisation dealt satisfactorily with any issues or complaints. 0 0 0 0 0 0
EQ3 The training organisation was flexible enough to meet our needs. 0 0 0 0 0 0
EQ4 Assessment was at an appropriate standard. 0 0 0 0 0 0
EQ5 The training resources were appropriate for learner needs. 0 0 0 0 0 0
EQ6 The training reflected current practice. 0 0 0 0 0 0
EQ7 The training organisation developed customised programs. 0 0 0 0 0 0
EQ8 The training organisation provided good support for workplace trainingand assessment.
0 0 0 0 0 0
EQ9 The training focused on relevant skills. 0 0 0 0 0 0
EQ10 Our employees gained the skills they needed from this training. 0 0 0 0 0 0
EQ11 The training was effectively integrated into our organisation. 0 0 0 0 0 0
EQ12 Overall, we are satisfied with the training. 0 0 0 0 0 0
EQ13 We would recommend the training organisation to others. 0 0 0 0 0 0
EQ14 We would recommend the training to others. 0 0 0 0 0 0
EQ15 The training organisation gave appropriate recognition of existingknowledge and skills.
0 0 0 0 0 0
EQ16 The way employees were assessed was a fair test of their skills andknowledge.
0 0 0 0 0 0
EQ17 Trainers had good knowledge and experience of the industry. 0 0 0 0 0 0
EQ18 Assessments were based on realistic activities. 0 0 0 0 0 0
EQ19 Trainers were effective in their teaching. 0 0 0 0 0 0
EQ20 The training was an effective investment. 0 0 0 0 0 0
EQ21 Trainers were able to relate material to the workplace. 0 0 0 0 0 0
EQ22 The training had a good mix of theory and practice. 0 0 0 0 0 0
EQ23 The training organisation acted on feedback from employers. 0 0 0 0 0 0
EQ24 The training has helped our employees work with people. 0 0 0 0 0 0
EQ25 Training resources and equipment were in good condition. 0 0 0 0 0 0
EQ26 The training helped employees identify how to build on their currentknowledge and skills.
0 0 0 0 0 0
EQ27 The training prepared employees well for work. 0 0 0 0 0 0
EQ28 Our employees gained the knowledge they needed from this training. 0 0 0 0 0 0
EQ29 The training prepared our employees for the demands of work. 0 0 0 0 0 0
EQ30 The training organisation clearly explained what was expected fromemployers.
0 0 0 0 0 0

EQ item averages and variations
Item Averagescore
Averagevariation
EQ1 The training used up-to-date equipment, facilities and materials.
EQ2 The training organisation dealt satisfactorily with any issues or complaints.
EQ3 The training organisation was flexible enough to meet our needs.
EQ4 Assessment was at an appropriate standard.
EQ5 The training resources were appropriate for learner needs.
EQ6 The training reflected current practice.
EQ7 The training organisation developed customised programs.
EQ8 The training organisation provided good support for workplace training and assessment.
EQ9 The training focused on relevant skills.
EQ10 Our employees gained the skills they needed from this training.
EQ11 The training was effectively integrated into our organisation.
EQ12 Overall, we are satisfied with the training.
EQ13 We would recommend the training organisation to others.
EQ14 We would recommend the training to others.
EQ15 The training organisation gave appropriate recognition of existing knowledge and skills.
EQ16 The way employees were assessed was a fair test of their skills and knowledge.
EQ17 Trainers had good knowledge and experience of the industry.
EQ18 Assessments were based on realistic activities.
EQ19 Trainers were effective in their teaching.
EQ20 The training was an effective investment.
EQ21 Trainers were able to relate material to the workplace.
EQ22 The training had a good mix of theory and practice.
EQ23 The training organisation acted on feedback from employers.
EQ24 The training has helped our employees work with people.
EQ25 Training resources and equipment were in good condition.
EQ26 The training helped employees identify how to build on their current knowledge andskills.
EQ27 The training prepared employees well for work.
EQ28 Our employees gained the knowledge they needed from this training.
EQ29 The training prepared our employees for the demands of work.
EQ30 The training organisation clearly explained what was expected from employers.

Characteristics ReportThe Characteristics Report presents information about learner responses to the scales measured by the LearnerQuestionnaire (LQ).
For each scale, the Characteristics Report presents information on the:
number of valid responses;average scale score; andaverage variation in scores.
Scores are reported on the response scale of 0 to 100, where 0 means 'strongly disagree' and 100 means 'stronglyagree'.
A separate Characteristics Report is provided for each of the scales measured by the LQ.
Scale scores are only computed for respondents who provided valid responses to all but two of the items in eachscale.
Results are shown at the organisation level, and then broken down by any training or demographic characteristicsthat were entered along with survey data.
The Characteristics Report can be used to analyse feedback on each of the targeted scales measured by the LQ.This information is more reliable than results for individual items.
Trainer Quality
Training characteristics
CharacteristicLearners
Count Average Variation
Provider Total 58 93.2 9.0
Qualification Level
Certificate I
Certificate II
Certificate III
Certificate IV 54 94.1 8.0
Certificate level unknown
Diploma
Advanced diploma
Associate degree
Degree
Short course or statement ofattainment
VET Graduate Certificate orDiploma
Other qualification or training
Do not know
Total 54 94.1 8.0

CharacteristicLearners
Count Average Variation
Provider Total 58 93.2 9.0
Field of education
Natural and physical sciences
Information technology
Engineering and relatedtechnologies
Architecture and building
Agriculture, environmental andrelated studies
Health
Education
Management and commerce
Society and culture
Creative arts
Food, hospitality and personalservices
54 94.1 8.0
Other
Total 54 94.1 8.0

CharacteristicLearners
Count Average Variation
Training start month
January
February 36 93.3 7.7
March
April 18 95.8 8.7
May
June
July
August
September
October
November
December
Do not know
Training start year
2011
2010 54 94.1 8.0
2009
2008
2007
2006
2005
2004
2003
2002
2001
2000
1999
Apprenticeship or traineeshipApprenticeship or traineeship
Not apprenticeship or traineeship 54 94.1 8.0
Recognition of prior learningRecognition of prior learning
No recognition of prior learning 54 94.1 8.0

Learner characteristics
CharacteristicLearners
Count Average Variation
Learner sex
Female 43 93.6 8.3
Male 10 95.8 7.1
Total 53 94.0 8.1
Learner age
Under 15
15 to 19 16 95.8 8.6
20 to 24 33 92.7 8.0
25 to 34 4 97.9 4.2
35 to 44
45 to 54
55 to 64
65 or over
Total 53 94.0 8.1
Aboriginal or Torres Strait Islanderorigin
No 53 94.0 8.1
Yes, Aboriginal
Yes, Torres Strait Islander
Yes, both Aboriginal and TorresStrait Islander
Total 53 94.0 8.1
Home language
English 52 94.6 7.2
Language other than English 1 66.7 0.0
Total 53 94.0 8.1
Permanent residency orcitizenship
Australian 50 94.5 7.3
Not Australian 2 83.3 23.6
Total 52 94.1 8.1
Disability status
Disability identified
No disability identified 52 94.1 8.1
Total 52 94.1 8.1
Groups1 58 93.2 9.0
Total 58 93.2 9.0

Effective Assessment
Training characteristics
CharacteristicLearners
Count Average Variation
Provider Total 58 92.3 10.0
Qualification Level
Certificate I
Certificate II
Certificate III
Certificate IV 54 93.1 9.8
Certificate level unknown
Diploma
Advanced diploma
Associate degree
Degree
Short course or statement ofattainment
VET Graduate Certificate orDiploma
Other qualification or training
Do not know
Total 54 93.1 9.8

CharacteristicLearners
Count Average Variation
Provider Total 58 92.3 10.0
Field of education
Natural and physical sciences
Information technology
Engineering and relatedtechnologies
Architecture and building
Agriculture, environmental andrelated studies
Health
Education
Management and commerce
Society and culture
Creative arts
Food, hospitality and personalservices
54 93.1 9.8
Other
Total 54 93.1 9.8

CharacteristicLearners
Count Average Variation
Training start month
January
February 36 92.4 8.5
March
April 18 94.4 12.1
May
June
July
August
September
October
November
December
Do not know
Training start year
2011
2010 54 93.1 9.8
2009
2008
2007
2006
2005
2004
2003
2002
2001
2000
1999
Apprenticeship or traineeshipApprenticeship or traineeship
Not apprenticeship or traineeship 54 93.1 9.8
Recognition of prior learningRecognition of prior learning
No recognition of prior learning 54 93.1 9.8

Learner characteristics
CharacteristicLearners
Count Average Variation
Learner sex
Female 43 92.6 10.5
Male 10 94.2 6.9
Total 53 92.9 9.9
Learner age
Under 15
15 to 19 16 91.7 11.0
20 to 24 33 92.7 9.7
25 to 34 4 100.0 0.0
35 to 44
45 to 54
55 to 64
65 or over
Total 53 92.9 9.9
Aboriginal or Torres Strait Islanderorigin
No 53 92.9 9.9
Yes, Aboriginal
Yes, Torres Strait Islander
Yes, both Aboriginal and TorresStrait Islander
Total 53 92.9 9.9
Home language
English 52 93.4 9.2
Language other than English 1 66.7 0.0
Total 53 92.9 9.9
Permanent residency orcitizenship
Australian 50 93.7 9.0
Not Australian 2 70.8 5.9
Total 52 92.8 9.9
Disability status
Disability identified
No disability identified 52 92.8 9.9
Total 52 92.8 9.9
Groups1 58 92.3 10.0
Total 58 92.3 10.0

Clear Expectations
Training characteristics
CharacteristicLearners
Count Average Variation
Provider Total 58 91.0 10.3
Qualification Level
Certificate I
Certificate II
Certificate III
Certificate IV 54 92.0 9.8
Certificate level unknown
Diploma
Advanced diploma
Associate degree
Degree
Short course or statement ofattainment
VET Graduate Certificate orDiploma
Other qualification or training
Do not know
Total 54 92.0 9.8

CharacteristicLearners
Count Average Variation
Provider Total 58 91.0 10.3
Field of education
Natural and physical sciences
Information technology
Engineering and relatedtechnologies
Architecture and building
Agriculture, environmental andrelated studies
Health
Education
Management and commerce
Society and culture
Creative arts
Food, hospitality and personalservices
54 92.0 9.8
Other
Total 54 92.0 9.8

CharacteristicLearners
Count Average Variation
Training start month
January
February 36 91.4 9.2
March
April 18 93.2 10.9
May
June
July
August
September
October
November
December
Do not know
Training start year
2011
2010 54 92.0 9.8
2009
2008
2007
2006
2005
2004
2003
2002
2001
2000
1999
Apprenticeship or traineeshipApprenticeship or traineeship
Not apprenticeship or traineeship 54 92.0 9.8
Recognition of prior learningRecognition of prior learning
No recognition of prior learning 54 92.0 9.8

Learner characteristics
CharacteristicLearners
Count Average Variation
Learner sex
Female 43 91.2 10.2
Male 10 94.4 7.9
Total 53 91.8 9.8
Learner age
Under 15
15 to 19 16 91.0 10.9
20 to 24 33 91.6 9.6
25 to 34 4 97.2 5.6
35 to 44
45 to 54
55 to 64
65 or over
Total 53 91.8 9.8
Aboriginal or Torres Strait Islanderorigin
No 53 91.8 9.8
Yes, Aboriginal
Yes, Torres Strait Islander
Yes, both Aboriginal and TorresStrait Islander
Total 53 91.8 9.8
Home language
English 52 92.3 9.2
Language other than English 1 66.7 0.0
Total 53 91.8 9.8
Permanent residency orcitizenship
Australian 50 92.4 9.1
Not Australian 2 72.2 7.9
Total 52 91.7 9.8
Disability status
Disability identified
No disability identified 52 91.7 9.8
Total 52 91.7 9.8
Groups1 58 91.0 10.3
Total 58 91.0 10.3
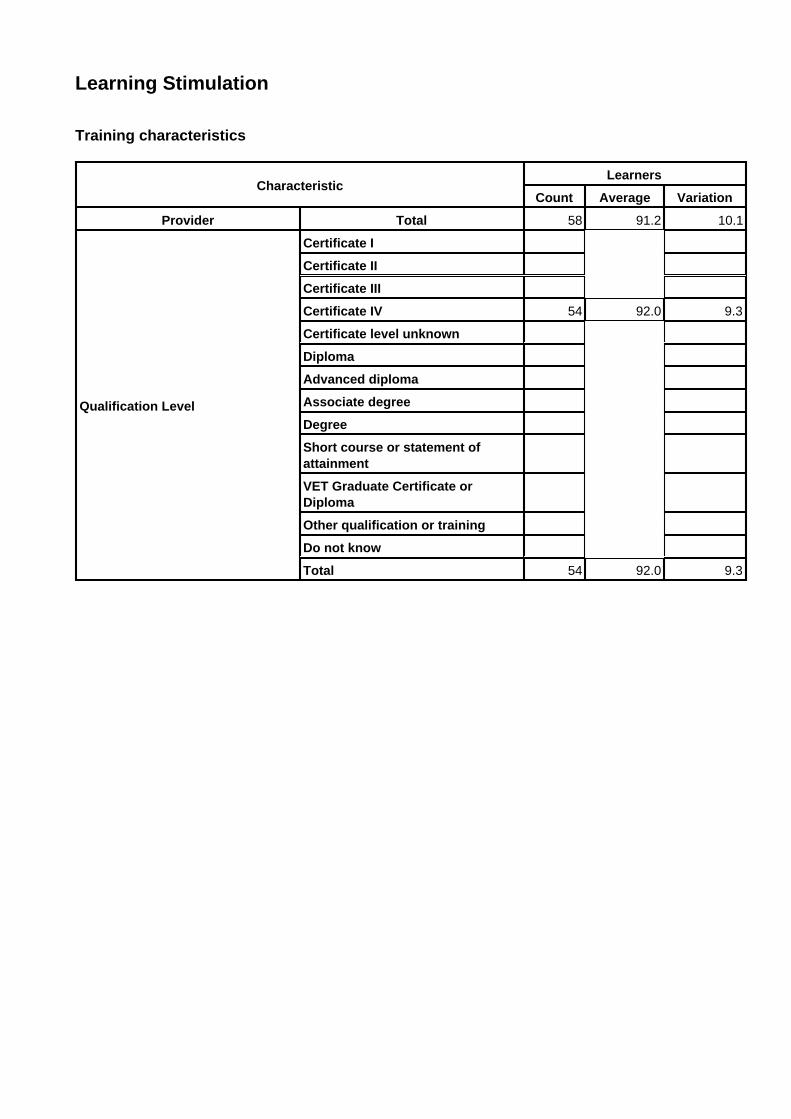
Learning Stimulation
Training characteristics
CharacteristicLearners
Count Average Variation
Provider Total 58 91.2 10.1
Qualification Level
Certificate I
Certificate II
Certificate III
Certificate IV 54 92.0 9.3
Certificate level unknown
Diploma
Advanced diploma
Associate degree
Degree
Short course or statement ofattainment
VET Graduate Certificate orDiploma
Other qualification or training
Do not know
Total 54 92.0 9.3

CharacteristicLearners
Count Average Variation
Provider Total 58 91.2 10.1
Field of education
Natural and physical sciences
Information technology
Engineering and relatedtechnologies
Architecture and building
Agriculture, environmental andrelated studies
Health
Education
Management and commerce
Society and culture
Creative arts
Food, hospitality and personalservices
54 92.0 9.3
Other
Total 54 92.0 9.3
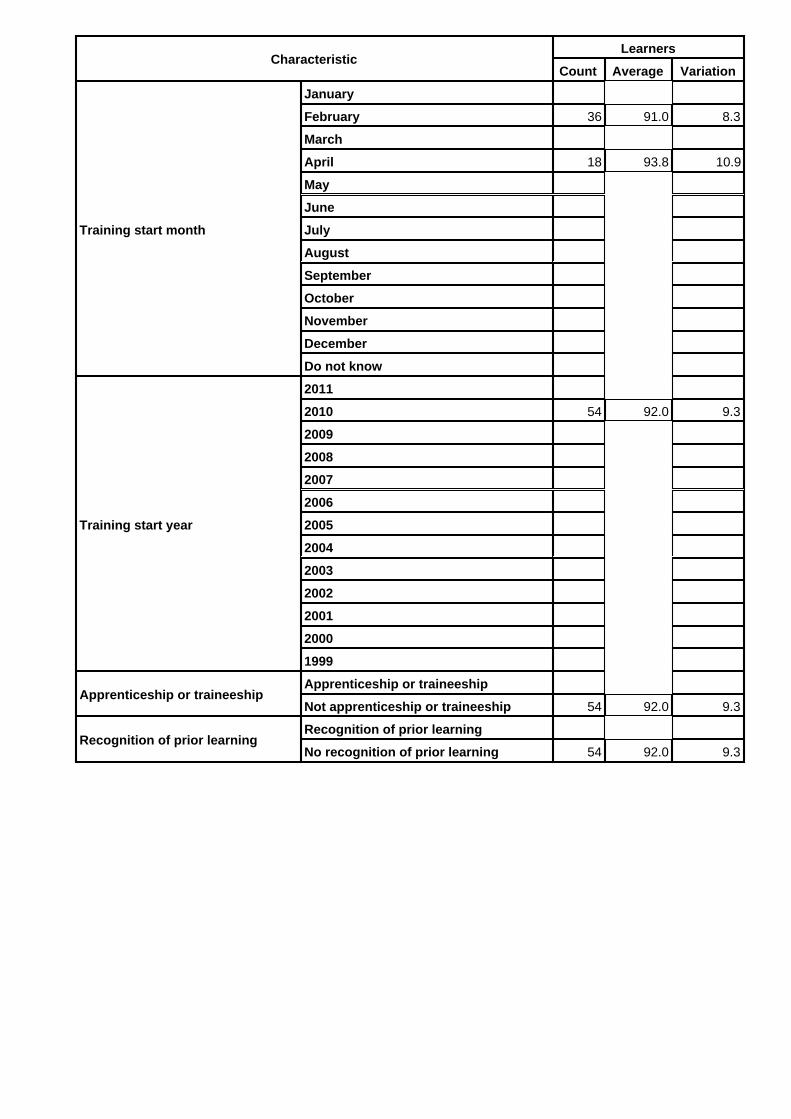
CharacteristicLearners
Count Average Variation
Training start month
January
February 36 91.0 8.3
March
April 18 93.8 10.9
May
June
July
August
September
October
November
December
Do not know
Training start year
2011
2010 54 92.0 9.3
2009
2008
2007
2006
2005
2004
2003
2002
2001
2000
1999
Apprenticeship or traineeshipApprenticeship or traineeship
Not apprenticeship or traineeship 54 92.0 9.3
Recognition of prior learningRecognition of prior learning
No recognition of prior learning 54 92.0 9.3

Learner characteristics
CharacteristicLearners
Count Average Variation
Learner sex
Female 43 92.2 9.6
Male 10 90.0 8.2
Total 53 91.8 9.3
Learner age
Under 15
15 to 19 16 91.7 9.5
20 to 24 33 91.2 9.5
25 to 34 4 97.2 5.6
35 to 44
45 to 54
55 to 64
65 or over
Total 53 91.8 9.3
Aboriginal or Torres Strait Islanderorigin
No 53 91.8 9.3
Yes, Aboriginal
Yes, Torres Strait Islander
Yes, both Aboriginal and TorresStrait Islander
Total 53 91.8 9.3
Home language
English 52 92.3 8.7
Language other than English 1 66.7 0.0
Total 53 91.8 9.3
Permanent residency orcitizenship
Australian 50 92.4 8.8
Not Australian 2 77.8 15.7
Total 52 91.9 9.4
Disability status
Disability identified
No disability identified 52 91.9 9.4
Total 52 91.9 9.4
Groups1 58 91.2 10.1
Total 58 91.2 10.1

Training Relevance
Training characteristics
CharacteristicLearners
Count Average Variation
Provider Total 58 92.7 10.7
Qualification Level
Certificate I
Certificate II
Certificate III
Certificate IV 54 93.6 9.8
Certificate level unknown
Diploma
Advanced diploma
Associate degree
Degree
Short course or statement ofattainment
VET Graduate Certificate orDiploma
Other qualification or training
Do not know
Total 54 93.6 9.8

CharacteristicLearners
Count Average Variation
Provider Total 58 92.7 10.7
Field of education
Natural and physical sciences
Information technology
Engineering and relatedtechnologies
Architecture and building
Agriculture, environmental andrelated studies
Health
Education
Management and commerce
Society and culture
Creative arts
Food, hospitality and personalservices
54 93.6 9.8
Other
Total 54 93.6 9.8

CharacteristicLearners
Count Average Variation
Training start month
January
February 36 93.8 9.0
March
April 18 93.2 11.5
May
June
July
August
September
October
November
December
Do not know
Training start year
2011
2010 54 93.6 9.8
2009
2008
2007
2006
2005
2004
2003
2002
2001
2000
1999
Apprenticeship or traineeshipApprenticeship or traineeship
Not apprenticeship or traineeship 54 93.6 9.8
Recognition of prior learningRecognition of prior learning
No recognition of prior learning 54 93.6 9.8

Learner characteristics
CharacteristicLearners
Count Average Variation
Learner sex
Female 43 93.3 10.6
Male 10 95.6 5.7
Total 53 93.7 9.9
Learner age
Under 15
15 to 19 16 92.4 9.7
20 to 24 33 93.9 10.4
25 to 34 4 97.2 5.6
35 to 44
45 to 54
55 to 64
65 or over
Total 53 93.7 9.9
Aboriginal or Torres Strait Islanderorigin
No 53 93.7 9.9
Yes, Aboriginal
Yes, Torres Strait Islander
Yes, both Aboriginal and TorresStrait Islander
Total 53 93.7 9.9
Home language
English 52 94.2 9.2
Language other than English 1 66.7 0.0
Total 53 93.7 9.9
Permanent residency orcitizenship
Australian 50 94.4 9.0
Not Australian 2 72.2 7.9
Total 52 93.6 9.9
Disability status
Disability identified
No disability identified 52 93.6 9.9
Total 52 93.6 9.9
Groups1 58 92.7 10.7
Total 58 92.7 10.7
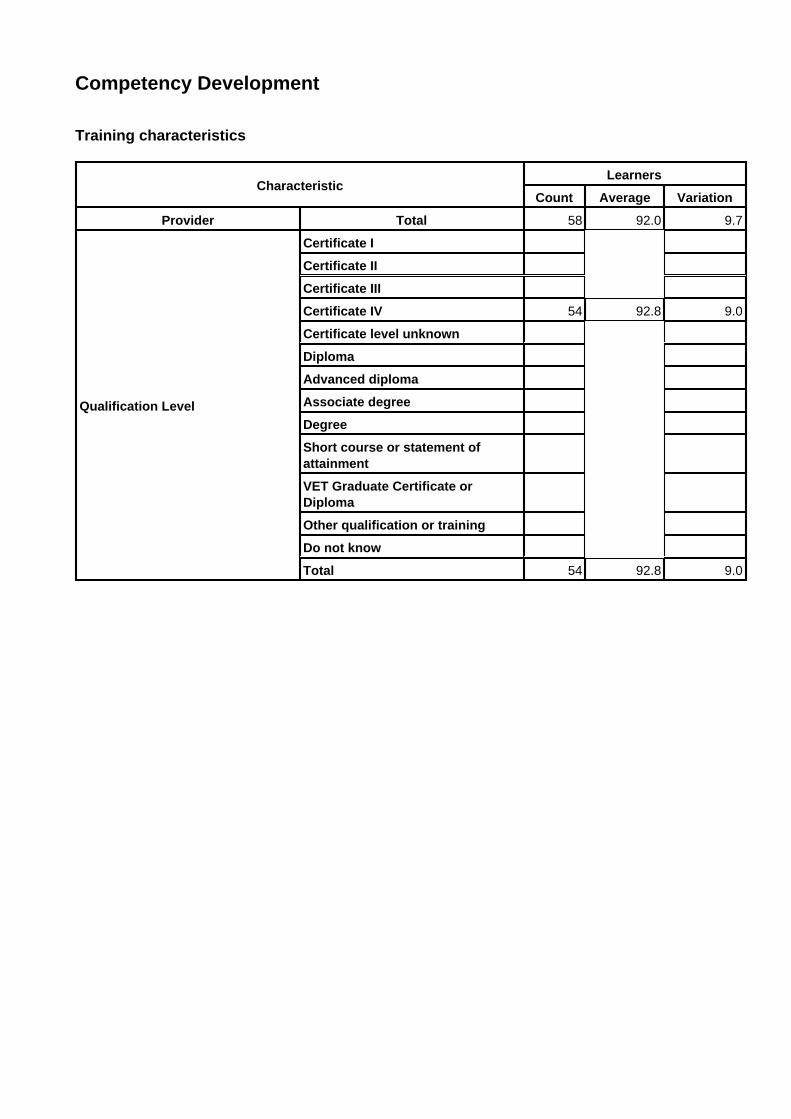
Competency Development
Training characteristics
CharacteristicLearners
Count Average Variation
Provider Total 58 92.0 9.7
Qualification Level
Certificate I
Certificate II
Certificate III
Certificate IV 54 92.8 9.0
Certificate level unknown
Diploma
Advanced diploma
Associate degree
Degree
Short course or statement ofattainment
VET Graduate Certificate orDiploma
Other qualification or training
Do not know
Total 54 92.8 9.0

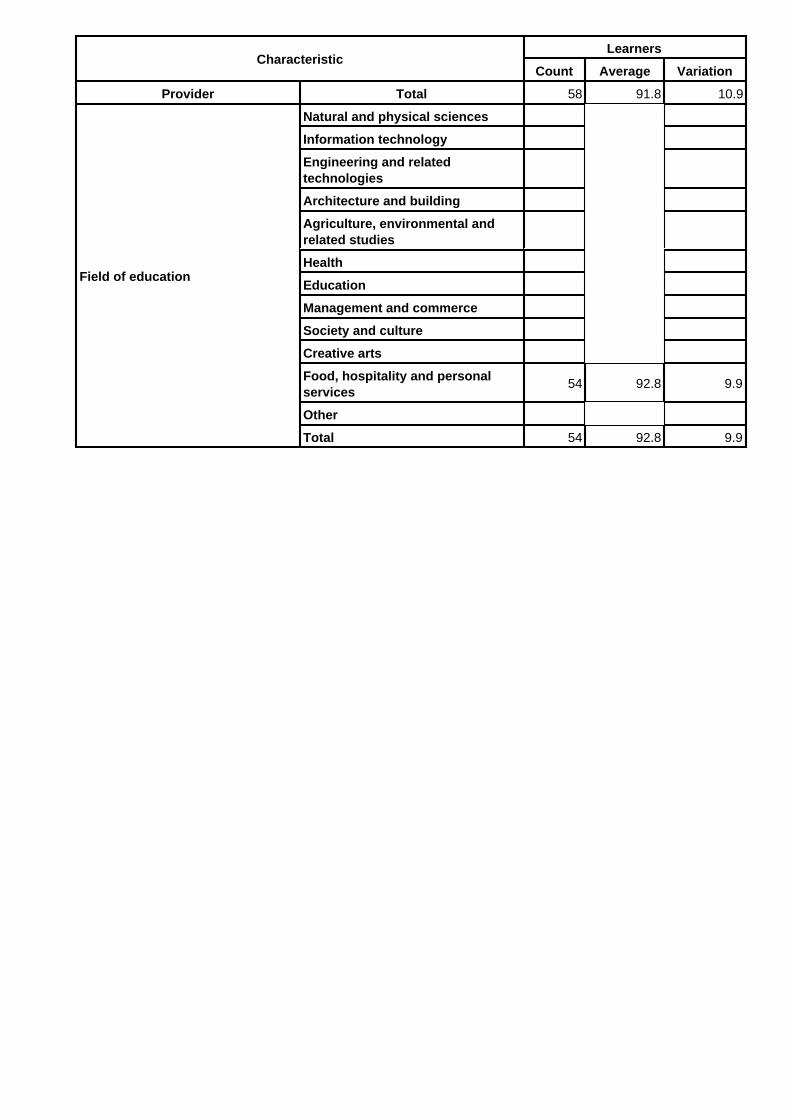
CharacteristicLearners
Count Average Variation
Provider Total 58 92.0 9.7
Field of education
Natural and physical sciences
Information technology
Engineering and relatedtechnologies
Architecture and building
Agriculture, environmental andrelated studies
Health
Education
Management and commerce
Society and culture
Creative arts
Food, hospitality and personalservices
54 92.8 9.0
Other
Total 54 92.8 9.0

CharacteristicLearners
Count Average Variation
Training start month
January
February 36 93.5 7.4
March
April 18 91.5 11.6
May
June
July
August
September
October
November
December
Do not know
Training start year
2011
2010 54 92.8 9.0
2009
2008
2007
2006
2005
2004
2003
2002
2001
2000
1999
Apprenticeship or traineeshipApprenticeship or traineeship
Not apprenticeship or traineeship 54 92.8 9.0
Recognition of prior learningRecognition of prior learning
No recognition of prior learning 54 92.8 9.0

Learner characteristics
CharacteristicLearners
Count Average Variation
Learner sex
Female 43 92.2 9.4
Male 10 94.7 6.9
Total 53 92.7 9.0
Learner age
Under 15
15 to 19 16 92.9 10.2
20 to 24 33 92.7 8.6
25 to 34 4 91.7 10.0
35 to 44
45 to 54
55 to 64
65 or over
Total 53 92.7 9.0
Aboriginal or Torres Strait Islanderorigin
No 53 92.7 9.0
Yes, Aboriginal
Yes, Torres Strait Islander
Yes, both Aboriginal and TorresStrait Islander
Total 53 92.7 9.0
Home language
English 52 93.2 8.3
Language other than English 1 66.7 0.0
Total 53 92.7 9.0
Permanent residency orcitizenship
Australian 50 93.6 8.0
Not Australian 2 70.0 4.7
Total 52 92.7 9.1
Disability status
Disability identified
No disability identified 52 92.7 9.1
Total 52 92.7 9.1
Groups1 58 92.0 9.7
Total 58 92.0 9.7

Training Resources
Training characteristics
CharacteristicLearners
Count Average Variation
Provider Total 58 91.8 10.9
Qualification Level
Certificate I
Certificate II
Certificate III
Certificate IV 54 92.8 9.9
Certificate level unknown
Diploma
Advanced diploma
Associate degree
Degree
Short course or statement ofattainment
VET Graduate Certificate orDiploma
Other qualification or training
Do not know
Total 54 92.8 9.9
CharacteristicLearners
Count Average Variation
Provider Total 58 91.8 10.9
Field of education
Natural and physical sciences
Information technology
Engineering and relatedtechnologies
Architecture and building
Agriculture, environmental andrelated studies
Health
Education
Management and commerce
Society and culture
Creative arts
Food, hospitality and personalservices
54 92.8 9.9
Other
Total 54 92.8 9.9

CharacteristicLearners
Count Average Variation
Training start month
January
February 36 92.6 9.6
March
April 18 93.2 10.9
May
June
July
August
September
October
November
December
Do not know
Training start year
2011
2010 54 92.8 9.9
2009
2008
2007
2006
2005
2004
2003
2002
2001
2000
1999
Apprenticeship or traineeshipApprenticeship or traineeship
Not apprenticeship or traineeship 54 92.8 9.9
Recognition of prior learningRecognition of prior learning
No recognition of prior learning 54 92.8 9.9

Learner characteristics
CharacteristicLearners
Count Average Variation
Learner sex
Female 43 93.0 10.3
Male 10 91.1 8.8
Total 53 92.7 10.0
Learner age
Under 15
15 to 19 16 94.4 9.9
20 to 24 33 91.6 10.4
25 to 34 4 94.4 6.4
35 to 44
45 to 54
55 to 64
65 or over
Total 53 92.7 10.0
Aboriginal or Torres Strait Islanderorigin
No 53 92.7 10.0
Yes, Aboriginal
Yes, Torres Strait Islander
Yes, both Aboriginal and TorresStrait Islander
Total 53 92.7 10.0
Home language
English 52 93.2 9.4
Language other than English 1 66.7 0.0
Total 53 92.7 10.0
Permanent residency orcitizenship
Australian 50 92.9 9.5
Not Australian 2 83.3 23.6
Total 52 92.5 10.0
Disability status
Disability identified
No disability identified 52 92.5 10.0
Total 52 92.5 10.0
Groups1 58 91.8 10.9
Total 58 91.8 10.9

Effective Support
Training characteristics
CharacteristicLearners
Count Average Variation
Provider Total 58 90.6 10.8
Qualification Level
Certificate I
Certificate II
Certificate III
Certificate IV 54 92.0 9.5
Certificate level unknown
Diploma
Advanced diploma
Associate degree
Degree
Short course or statement ofattainment
VET Graduate Certificate orDiploma
Other qualification or training
Do not know
Total 54 92.0 9.5

CharacteristicLearners
Count Average Variation
Provider Total 58 90.6 10.8
Field of education
Natural and physical sciences
Information technology
Engineering and relatedtechnologies
Architecture and building
Agriculture, environmental andrelated studies
Health
Education
Management and commerce
Society and culture
Creative arts
Food, hospitality and personalservices
54 92.0 9.5
Other
Total 54 92.0 9.5

CharacteristicLearners
Count Average Variation
Training start month
January
February 36 91.0 8.3
March
April 18 93.8 11.6
May
June
July
August
September
October
November
December
Do not know
Training start year
2011
2010 54 92.0 9.5
2009
2008
2007
2006
2005
2004
2003
2002
2001
2000
1999
Apprenticeship or traineeshipApprenticeship or traineeship
Not apprenticeship or traineeship 54 92.0 9.5
Recognition of prior learningRecognition of prior learning
No recognition of prior learning 54 92.0 9.5

Learner characteristics
CharacteristicLearners
Count Average Variation
Learner sex
Female 43 92.2 10.2
Male 10 90.0 6.3
Total 53 91.8 9.5
Learner age
Under 15
15 to 19 16 92.4 10.5
20 to 24 33 91.2 9.5
25 to 34 4 94.4 6.4
35 to 44
45 to 54
55 to 64
65 or over
Total 53 91.8 9.5
Aboriginal or Torres Strait Islanderorigin
No 53 91.8 9.5
Yes, Aboriginal
Yes, Torres Strait Islander
Yes, both Aboriginal and TorresStrait Islander
Total 53 91.8 9.5
Home language
English 52 92.3 8.9
Language other than English 1 66.7 0.0
Total 53 91.8 9.5
Permanent residency orcitizenship
Australian 50 92.0 9.0
Not Australian 2 83.3 23.6
Total 52 91.7 9.6
Disability status
Disability identified
No disability identified 52 91.7 9.6
Total 52 91.7 9.6
Groups1 58 90.6 10.8
Total 58 90.6 10.8

Active Learning
Training characteristics
CharacteristicLearners
Count Average Variation
Provider Total 58 89.6 11.9
Qualification Level
Certificate I
Certificate II
Certificate III
Certificate IV 54 90.6 11.0
Certificate level unknown
Diploma
Advanced diploma
Associate degree
Degree
Short course or statement ofattainment
VET Graduate Certificate orDiploma
Other qualification or training
Do not know
Total 54 90.6 11.0

CharacteristicLearners
Count Average Variation
Provider Total 58 89.6 11.9
Field of education
Natural and physical sciences
Information technology
Engineering and relatedtechnologies
Architecture and building
Agriculture, environmental andrelated studies
Health
Education
Management and commerce
Society and culture
Creative arts
Food, hospitality and personalservices
54 90.6 11.0
Other
Total 54 90.6 11.0
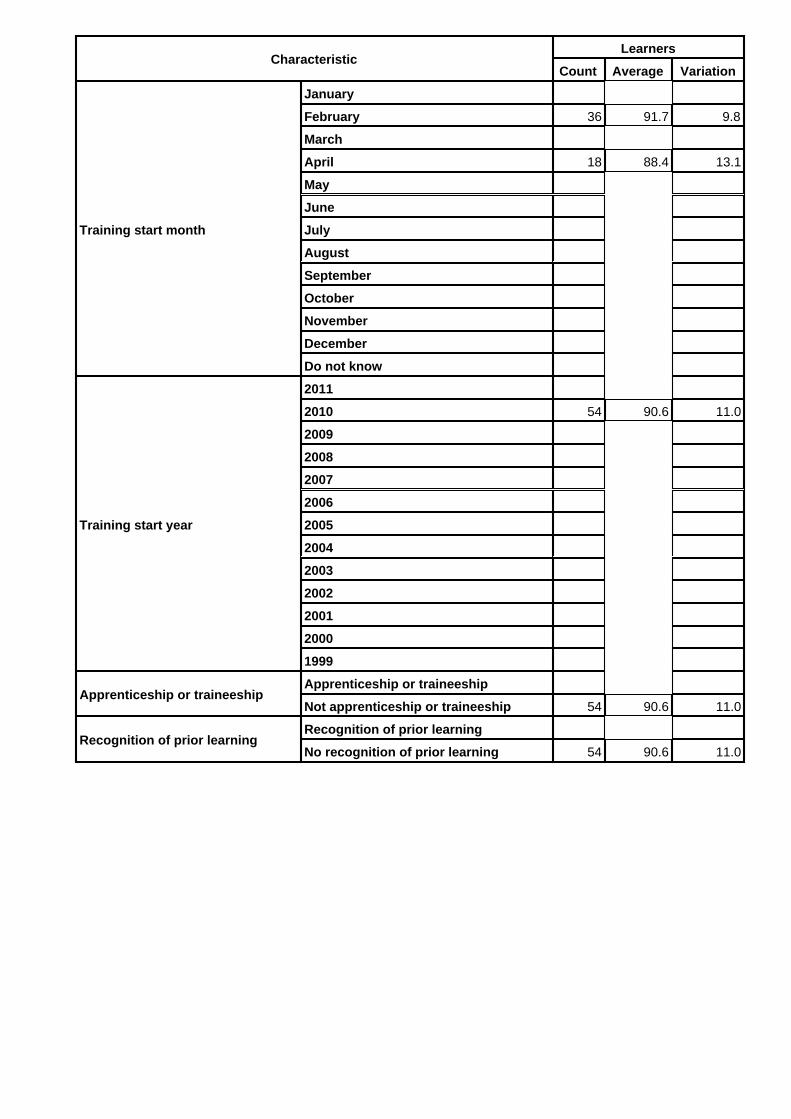
CharacteristicLearners
Count Average Variation
Training start month
January
February 36 91.7 9.8
March
April 18 88.4 13.1
May
June
July
August
September
October
November
December
Do not know
Training start year
2011
2010 54 90.6 11.0
2009
2008
2007
2006
2005
2004
2003
2002
2001
2000
1999
Apprenticeship or traineeshipApprenticeship or traineeship
Not apprenticeship or traineeship 54 90.6 11.0
Recognition of prior learningRecognition of prior learning
No recognition of prior learning 54 90.6 11.0

Learner characteristics
CharacteristicLearners
Count Average Variation
Learner sex
Female 43 91.0 11.1
Male 10 90.0 11.7
Total 53 90.8 11.1
Learner age
Under 15
15 to 19 16 91.7 11.4
20 to 24 33 90.5 11.1
25 to 34 4 89.6 12.5
35 to 44
45 to 54
55 to 64
65 or over
Total 53 90.8 11.1
Aboriginal or Torres Strait Islanderorigin
No 53 90.8 11.1
Yes, Aboriginal
Yes, Torres Strait Islander
Yes, both Aboriginal and TorresStrait Islander
Total 53 90.8 11.1
Home language
English 52 91.2 10.7
Language other than English 1 66.7 0.0
Total 53 90.8 11.1
Permanent residency orcitizenship
Australian 50 91.4 10.8
Not Australian 2 75.0 11.8
Total 52 90.8 11.2
Disability status
Disability identified
No disability identified 52 90.8 11.2
Total 52 90.8 11.2
Groups1 58 89.6 11.9
Total 58 89.6 11.9

Overall Satisfaction
Training characteristics
CharacteristicLearners
Count Average Variation
Provider Total 58 94.1 8.6
Qualification Level
Certificate I
Certificate II
Certificate III
Certificate IV 54 94.2 8.6
Certificate level unknown
Diploma
Advanced diploma
Associate degree
Degree
Short course or statement ofattainment
VET Graduate Certificate orDiploma
Other qualification or training
Do not know
Total 54 94.2 8.6

CharacteristicLearners
Count Average Variation
Provider Total 58 94.1 8.6
Field of education
Natural and physical sciences
Information technology
Engineering and relatedtechnologies
Architecture and building
Agriculture, environmental andrelated studies
Health
Education
Management and commerce
Society and culture
Creative arts
Food, hospitality and personalservices
54 94.2 8.6
Other
Total 54 94.2 8.6

CharacteristicLearners
Count Average Variation
Training start month
January
February 36 92.9 8.5
March
April 18 96.9 8.4
May
June
July
August
September
October
November
December
Do not know
Training start year
2011
2010 54 94.2 8.6
2009
2008
2007
2006
2005
2004
2003
2002
2001
2000
1999
Apprenticeship or traineeshipApprenticeship or traineeship
Not apprenticeship or traineeship 54 94.2 8.6
Recognition of prior learningRecognition of prior learning
No recognition of prior learning 54 94.2 8.6
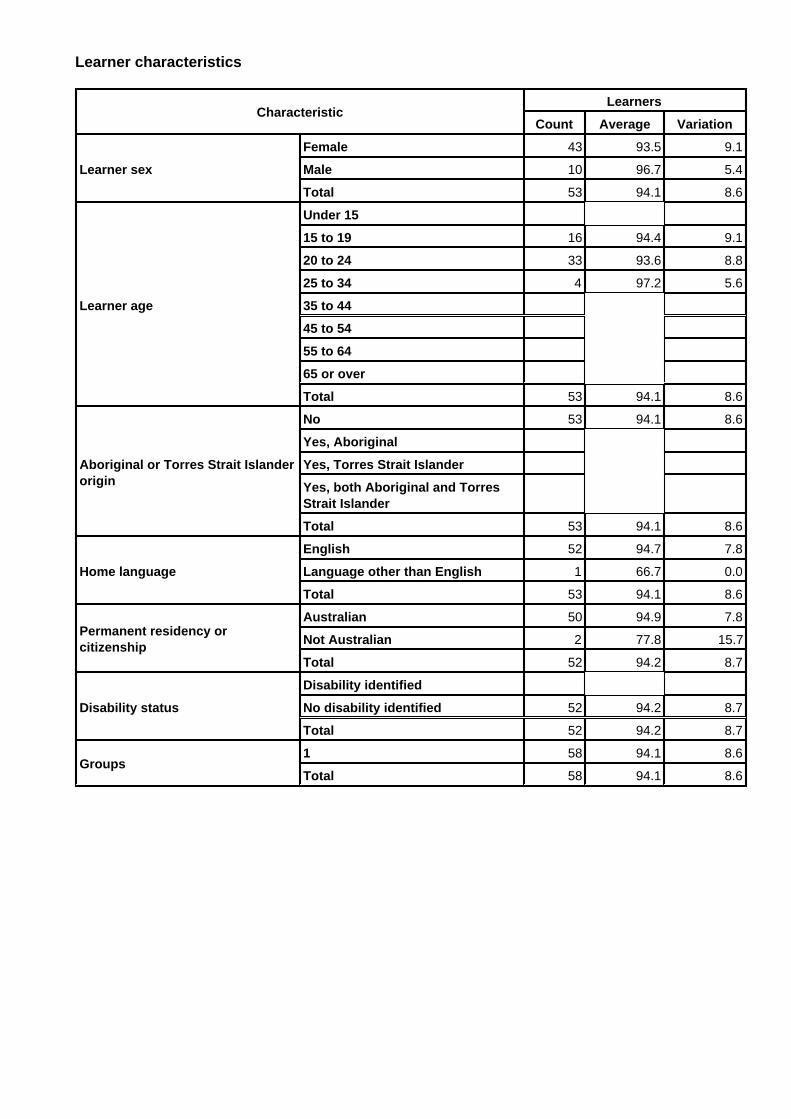
Learner characteristics
CharacteristicLearners
Count Average Variation
Learner sex
Female 43 93.5 9.1
Male 10 96.7 5.4
Total 53 94.1 8.6
Learner age
Under 15
15 to 19 16 94.4 9.1
20 to 24 33 93.6 8.8
25 to 34 4 97.2 5.6
35 to 44
45 to 54
55 to 64
65 or over
Total 53 94.1 8.6
Aboriginal or Torres Strait Islanderorigin
No 53 94.1 8.6
Yes, Aboriginal
Yes, Torres Strait Islander
Yes, both Aboriginal and TorresStrait Islander
Total 53 94.1 8.6
Home language
English 52 94.7 7.8
Language other than English 1 66.7 0.0
Total 53 94.1 8.6
Permanent residency orcitizenship
Australian 50 94.9 7.8
Not Australian 2 77.8 15.7
Total 52 94.2 8.7
Disability status
Disability identified
No disability identified 52 94.2 8.7
Total 52 94.2 8.7
Groups1 58 94.1 8.6
Total 58 94.1 8.6

Group ReportThe Group Report provides information about each nominated group and a snapshot of results for the scalesmeasured by the Learner Questionnaire (LQ) and Employer Questionnaire (EQ).
For each scale, the Group Report presents information about the:
count of responses used to calculate the scale score;average scale score; andvariation in scale scores.
Scores are reported on the response scale of 0 to 100, where 0 means 'strongly disagree' and 100 means 'stronglyagree'.
Results are provided for learners and/or employers depending on the data entered into SMART.
This Group Report can be used to analyse the number, average and variation of the survey responses.Comparisons can be made across scales, to previous reports, or between learners and employers.
Group 1
Learners Employers
Scale Average score Average variation Average score Average variation
Trainer Quality 93.2 9.0
Effective Assessment 92.3 10.0
Clear Expectations 91.0 10.3
Learning Stimulation 91.2 10.1
Training Relevance 92.7 10.7
Competency Development 92.0 9.7
Training Resources 91.8 10.9
Effective Support 90.6 10.8
Active Learning 89.6 11.9
Overall Satisfaction 94.1 8.6

Comments ReportThe Comments Report lists the comments provided to the two open-ended questions on the Learner Questionnaire(LQ) and/or Employer Questionnaire (EQ).
Both the LQ and EQ contain questions that seek information about the best aspects of training, and about theaspects of training most in need of improvement. The report provides a print out of these.
LQ best aspects
Educational and Computer Training
Enjoyed all aspects
Enjoyed it all
Everything
Everything was awesome
Everything was awesome
Everything! Especially the teachers
Friendly college
Going to china hands on experience
Good environment
Good trainers
I loved the great atmosphere
Staff were clear and friendly Patrick always greeting everyone when arrived. Staff helped motivate me
The educational
The fun loving environment
The teachers really made mu training enjoyable as well as my classmates
all good
all the students and trainers - had fun
computer training
computer training was very good
everything! especially the teachers
excellent classrooms
excellent course
excellent facilities
excellent lecturers
friendliness, agreeable staff
friendly staff
good atmosphere for training
good hours
learning new places and facts
life skills
loved it all
nice rooms
nice trainers
practical training was very good
teachers

the course information
the practical work experience
the slide shows and teachers
the trainers
the trainers
training all very good
understanding teachers
very good lecturers
very hands on, but had heaps of help when needed
very will run course

LQ needs improvement
Computers internet kept not working
Galileo e training
NONE
Sabre working
galileo
galileo e training
galileo modules
more holidays
more work experience would have been good
nil
nil
nil
nil
nil
none
none
none
none
none
none
not a thing
nothing
nothing
nothing I can think of
nothing stands out
sabre computers
the movies

EQ best aspects

EQ needs improvement

Administration ReportThe Administration Report provides information provided by the training organisation on survey management. Itprovides a print out of responses entered into the SMART system.
Learner survey feedback
Staff days spent managing learner survey
Cost of direct expenses of learner survey
Problems encountered during learner survey
Employer survey feedback
Staff days spent managing employer survey
Cost of direct expenses of employer survey
Problems encountered during employersurvey

Registering body report04 Jul 2011
RTO Information
NTIS number 20864
Name Donrose Pty Ltd t/as Jetset Training College
Street AddressLevel 6461 Bourke St
City/town/suburb Melbourne
State VIC
Post code 3000
Learner and employer response
Learners Employers
Response count (number) 58 0
Population count (number)
Response rate (per cent)
Learner and employer feedback
Learners Employers
Scale Averagescore
Averagevariation
Averagescore
Averagevariation
All scales 91.9 14.6
Trainer Quality 93.2 9.0
Effective Assessment 92.3 10.0
Clear Expectations 91.0 10.3
Learning Stimulation 91.2 10.1
Training Relevance 92.7 10.7
Competency Development 92.0 9.7
Training Resources 91.8 10.9
Effective Support 90.6 10.8
Active Learning 89.6 11.9
Overall Satisfaction 94.1 8.6
Survey contexts and use
Completion of this section is optional and may be used by the RTO to provide information and an explanation of thedata provided.
Information Explanatory notes
Specific contexts to consider wheninterpreting survey results
Main ways data has been used forcontinuous improvement