rti: reasons, practices, systems, & considerations
DESCRIPTION
RTI: Reasons, Practices, Systems, & Considerations. George Sugai OSEP Center on PBIS University of Connecticut December 6, 2007 www.pbis.org www.cber.org [email protected]. My “Task”. STUDENT ACHIEVEMENT. Good Teaching. Social Behavior Support. - PowerPoint PPT PresentationTRANSCRIPT
RTI: Reasons, Practices, Systems, &
ConsiderationsGeorge Sugai
OSEP Center on PBIS
University of ConnecticutDecember 6, 2007
www.pbis.org www.cber.org
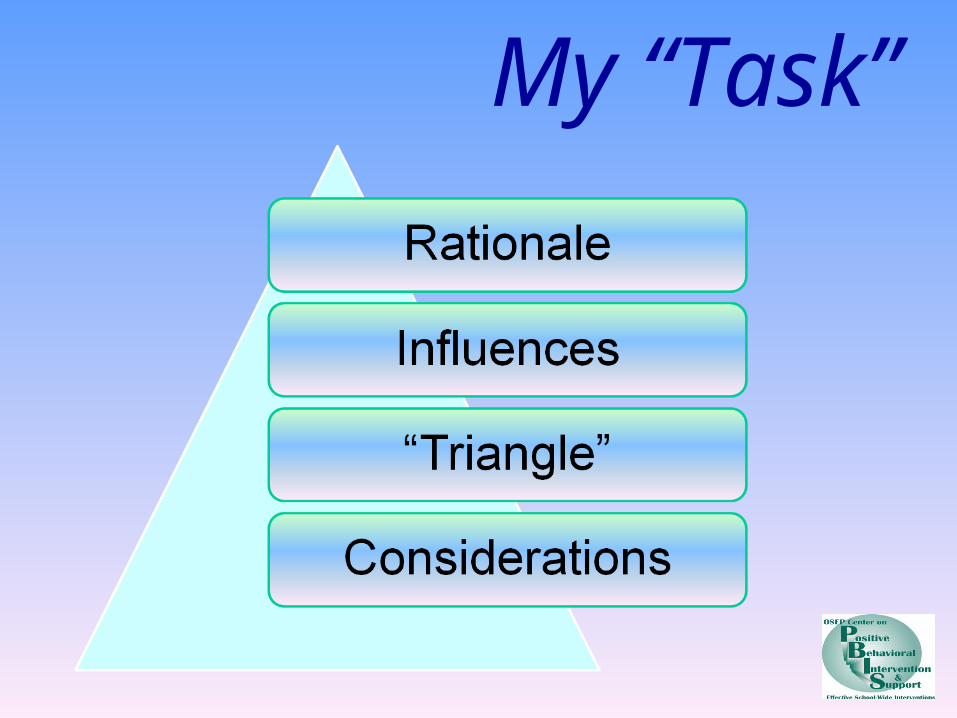
My “Task”
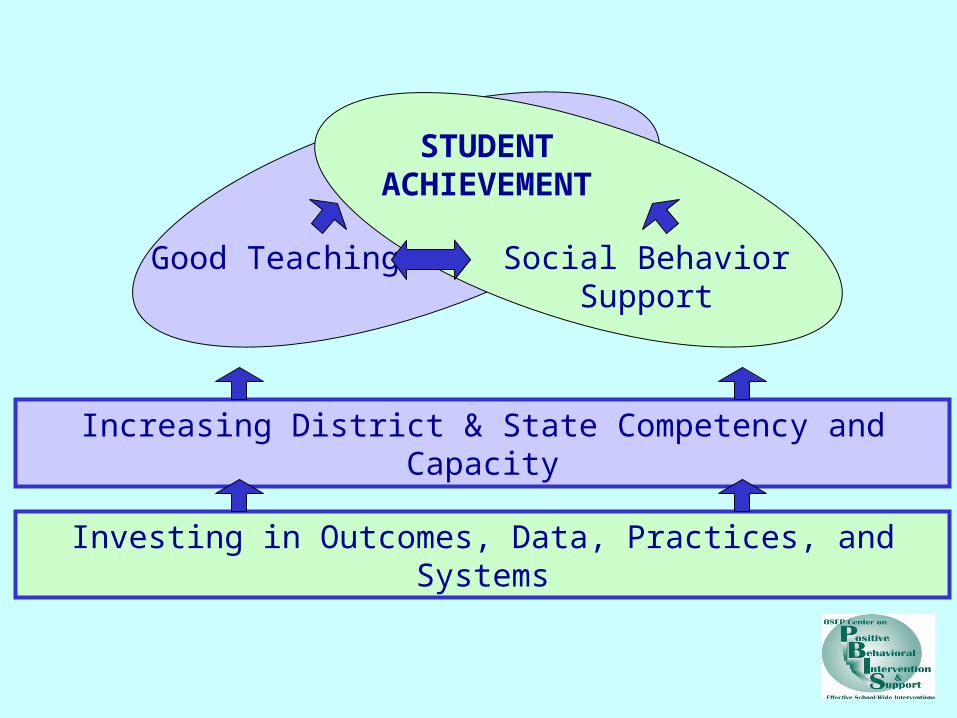
Good Teaching Social Behavior Support
STUDENT ACHIEVEMENT
Increasing District & State Competency and Capacity
Investing in Outcomes, Data, Practices, and Systems


RtI: Good “IDEiA” PolicyApproach for redesigning &
establishing teaching & learning environments that are effective, efficient, relevant, & durable for
all students, families & educators
• NOT program, curriculum, strategy, intervention
• NOT limited to special education
• NOT new

RtI
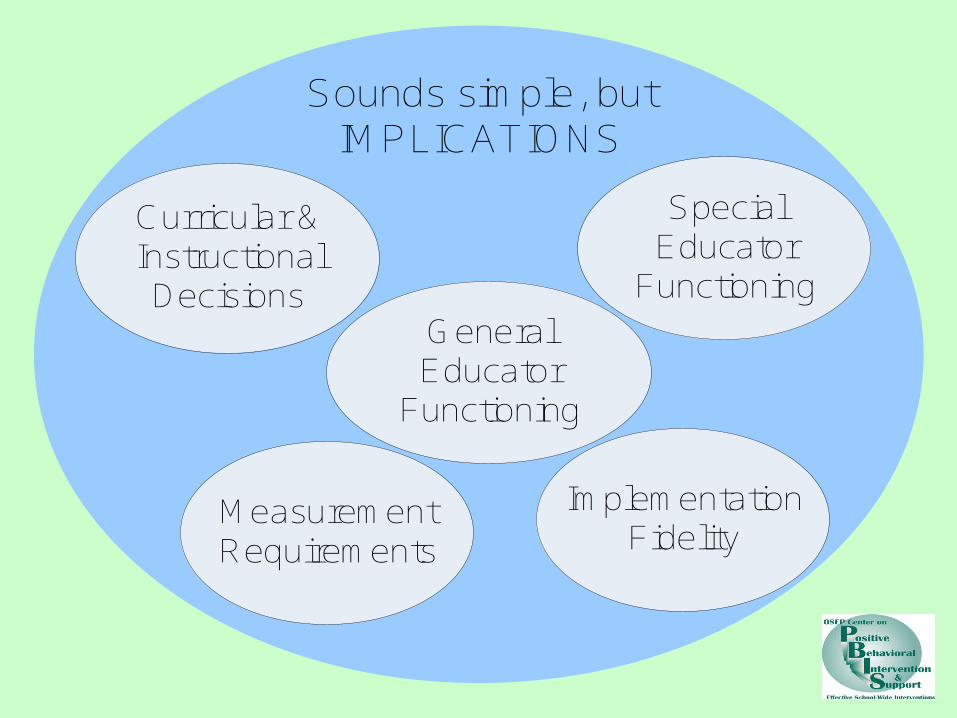
Sounds simple, but IMPLICATIONS
General Educator
Functioning
Special Educator
Functioning
Implementation Fidelity
Measurement Requirements
Curricular & Instructional Decisions
Where’d “triangle” come from….a
PBIS perspective?

“Triangle” ?’s
• Why triangle?
• Why not pyramid or octagon?
• Why not 12 tiers? 2 tiers?
• What’s it got to do w/ education?
• Where’d those %’s come from?

Specialized Individual Interventions(Individual StudentSystem)
Continuum of Effective BehaviorSupport
Specialized GroupInterventions(At-Risk System)
Universal Interventions (School-Wide SystemClassroom System)
Studentswithout SeriousProblemBehaviors (80 -90%)
Students At-Risk for Problem Behavior(5-15%)
Students withChronic/IntenseProblem Behavior(1 - 7%)
Primary Prevention
Secondary Prevention
Tertiary Prevention
All Students in SchoolCirca 1994
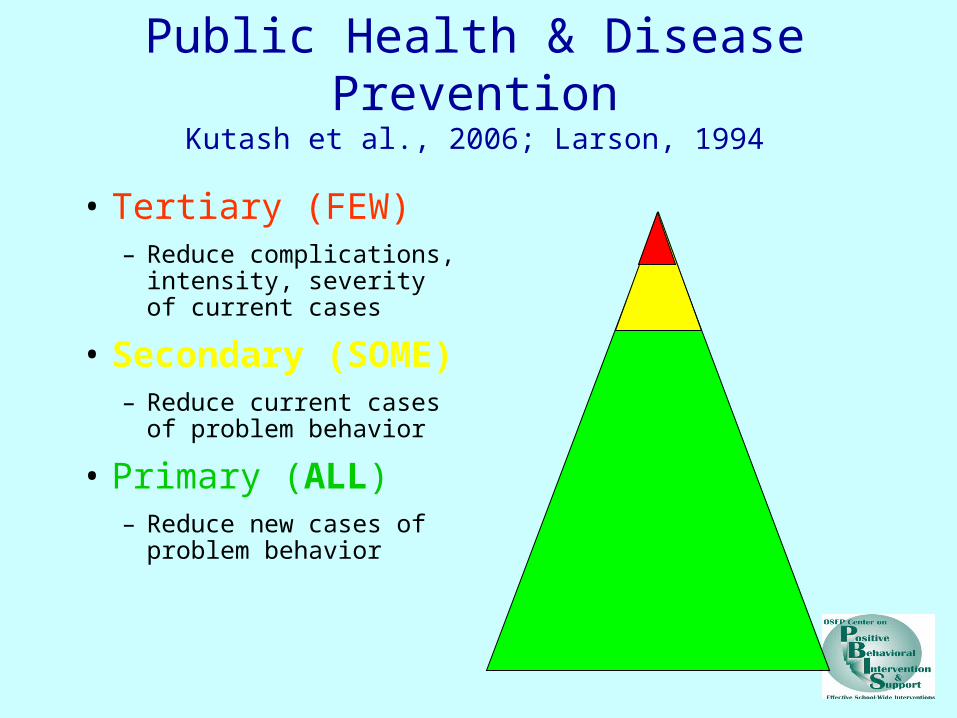
Public Health & Disease PreventionKutash et al., 2006; Larson, 1994
• Tertiary (FEW)– Reduce complications,
intensity, severity of current cases
• Secondary (SOME)– Reduce current cases of
problem behavior
• Primary (ALL)– Reduce new cases of
problem behavior


Primary Prevention:School-/Classroom-Wide Systems for
All Students,Staff, & Settings
Secondary Prevention:Specialized Group
Systems for Students with At-Risk Behavior
Tertiary Prevention:Specialized
IndividualizedSystems for Students
with High-Risk Behavior
~80% of Students
~15%
~5%
CONTINUUM OFSCHOOL-WIDE
INSTRUCTIONAL & POSITIVE BEHAVIOR
SUPPORT

1-5% 1-5%
5-10% 5-10%
80-90% 80-90%
Intensive, Individual Interventions•Individual Students•Assessment-based•High Intensity
Intensive, Individual Interventions•Individual Students•Assessment-based•Intense, durable procedures
Targeted Group Interventions•Some students (at-risk)•High efficiency•Rapid response
Targeted Group Interventions•Some students (at-risk)•High efficiency•Rapid response
Universal Interventions•All students•Preventive, proactive
Universal Interventions•All settings, all students•Preventive, proactive
Designing School-Wide Systems for Student Success
Academic Systems Behavioral Systems
Circa 1996
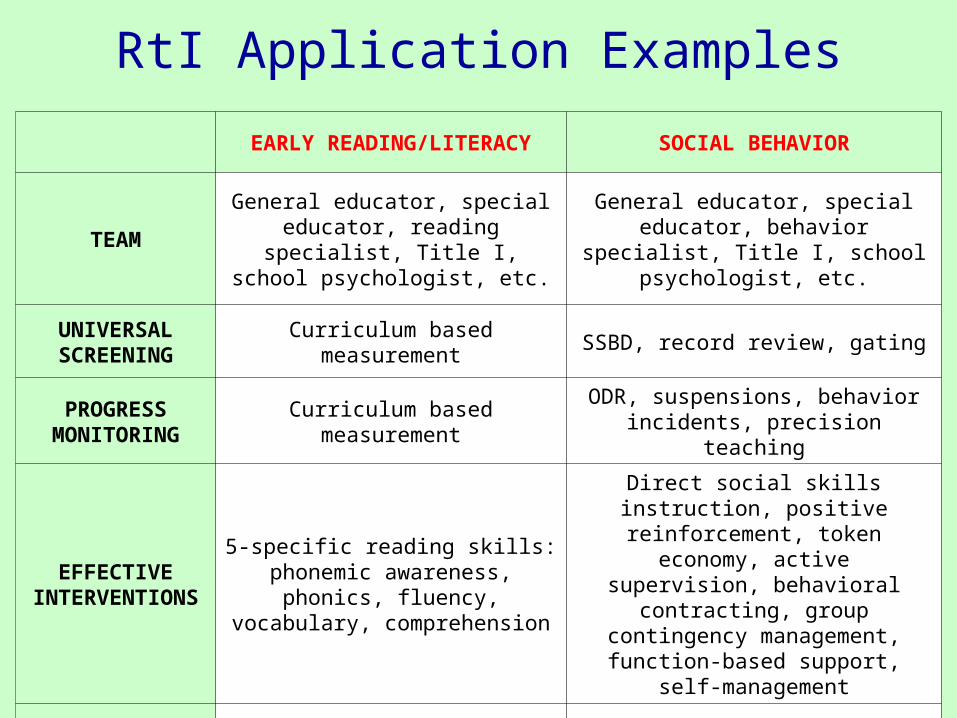
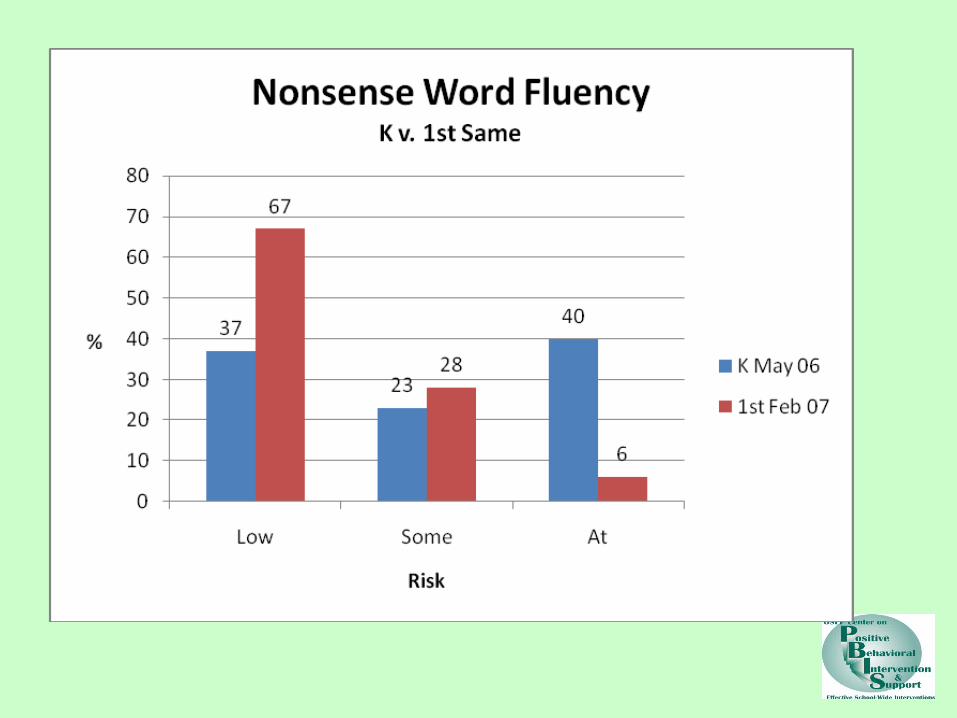
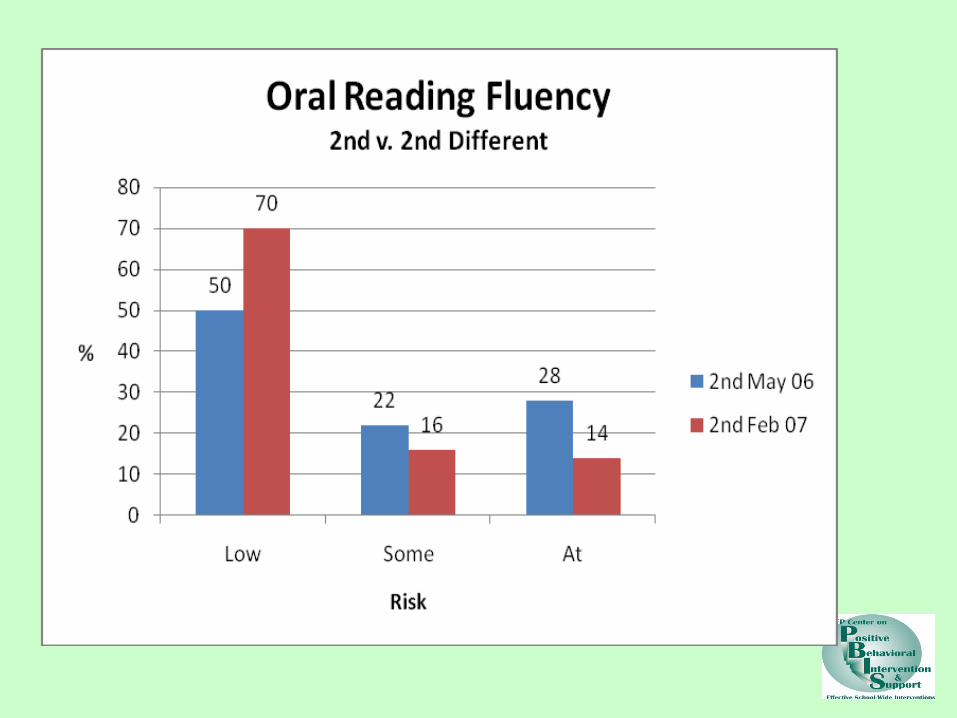
RtI Application Examples
EARLY READING/LITERACY SOCIAL BEHAVIOR
TEAMGeneral educator, special
educator, reading specialist, Title I, school psychologist, etc.
General educator, special educator, behavior specialist, Title I, school
psychologist, etc.
UNIVERSAL SCREENING
Curriculum based measurement SSBD, record review, gating
PROGRESS MONITORING
Curriculum based measurementODR, suspensions, behavior incidents, precision teaching
EFFECTIVE INTERVENTIONS
5-specific reading skills: phonemic awareness, phonics, fluency, vocabulary, comprehension
Direct social skills instruction, positive reinforcement, token economy, active supervision, behavioral contracting,
group contingency management, function-based support, self-
management
DECISION MAKING RULES
Core, strategic, intensive Primary, secondary, tertiary tiers

Responsiveness to Intervention
Academic+
Social Behavior

All
Some
Few RTIA Continuum of Support for All
Dec 6, 2007

0%
10%
20%
30%
40%
50%
60%
70%
80%
90%
100%
Major Office Discipline Referrals (05-06)
0-1 '2-5 '6+
3%8%
89%
10%
16%
74%
11%
18%
71%
K=6 (N = 1010) 6-9 (N = 312) 9-12 (N = 104)
Mean Proportion of Students
ODR rates vary by level
0%
10%
20%
30%
40%
50%
60%
70%
80%
90%
100%
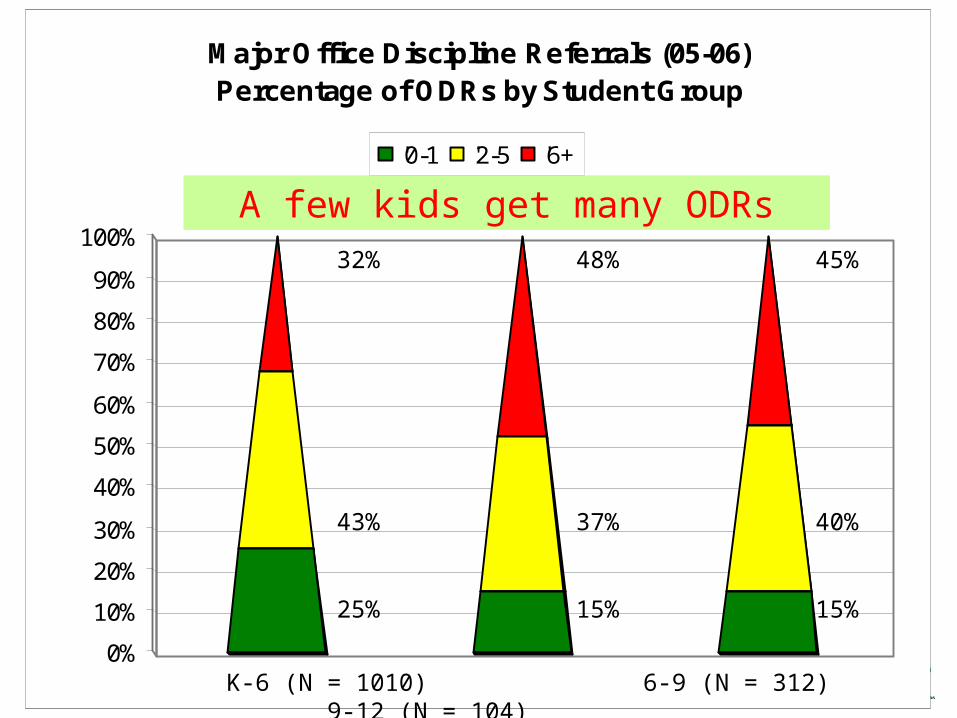
Major Office Discipline Referrals (05-06)Percentage of ODRs by Student Group
'0-1 '2-5 '6+
K-6 (N = 1010) 6-9 (N = 312) 9-12 (N = 104)
32%
43%
25%
48%
37%
15%
45%
40%
15%
A few kids get many ODRs

Has triangle been useful?

0
0.2
0.4
0.6
0.8
1
Mea
n P
ropo
rtio
n of
S
tude
nts
Met SET (N = 23) Not Met SET (N =12)
Central Illinois Elem, Middle SchoolsTriangle Summary 03-04
6+ ODR
2-5 ODR
0-1 ODR
84% 58%
11%
22%
05%20%
SWPBS schools are more preventive
0
0.2
0.4
0.6
0.8
1
Mea
n P
ropo
rtio
n of
S
tude
nts
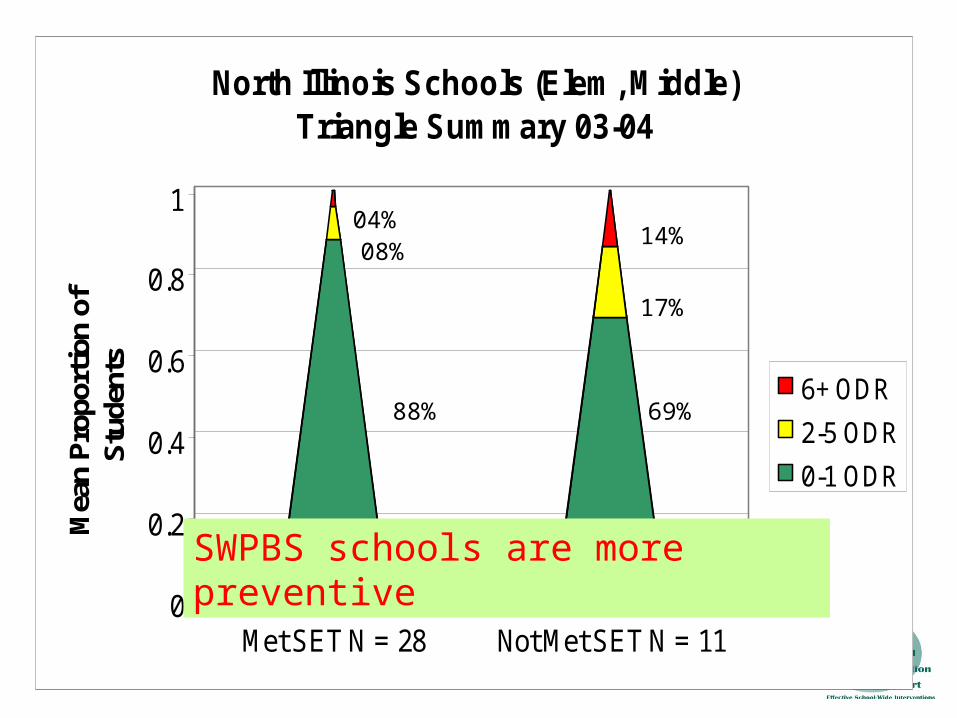
Met SET N = 28 Not Met SET N = 11
North Illinois Schools (Elem, Middle) Triangle Summary 03-04
6+ ODR
2-5 ODR
0-1 ODR
88% 69%
08%
17%
04%14%
SWPBS schools are more preventive
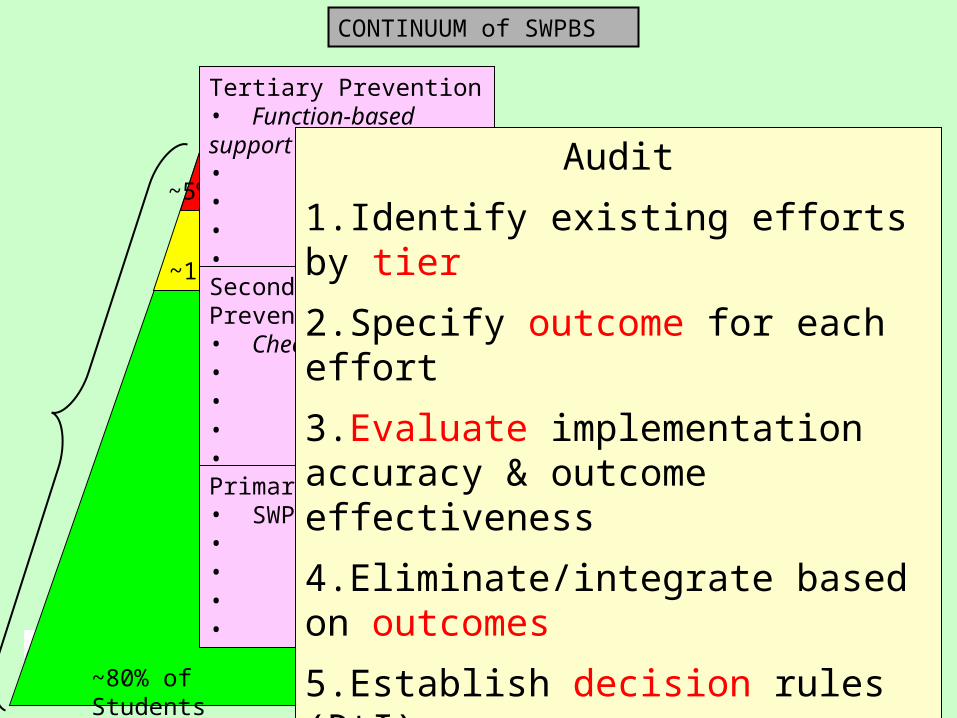
~80% of Students
~15%
~5%
CONTINUUM of SWPBS
Tertiary Prevention• Function-based support• • • •
Secondary Prevention• Check in/out• • • •
Primary Prevention• SWPBS• • • •
Audit
1.Identify existing efforts by tier
2.Specify outcome for each effort
3.Evaluate implementation accuracy & outcome effectiveness
4.Eliminate/integrate based on outcomes
5.Establish decision rules (RtI)


RtI Systems & Considerations?

Quotable Fixsen • “Policy is
– allocation of limited resources for unlimited needs”
– Opportunity, not guarantee, for good action”
• “Training does not predict action”
– “Manualized treatments have created overly rigid & rapid applications”
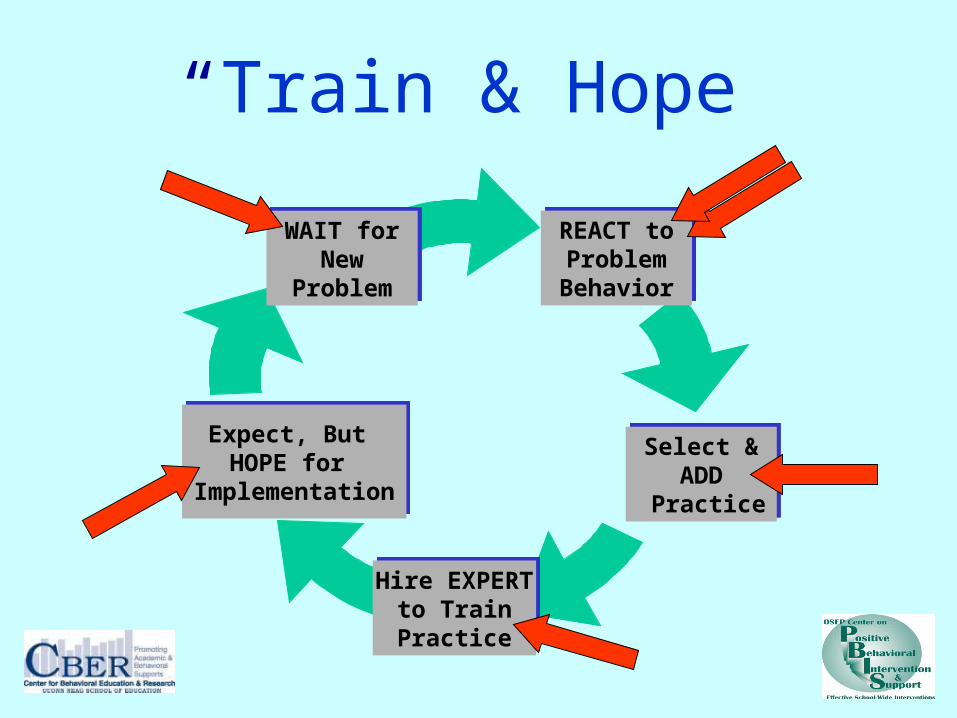
“Train & Hope”
REACT toProblemBehavior
REACT toProblemBehavior
Select &ADD
Practice
Select &ADD
Practice
Hire EXPERTto TrainPractice
Hire EXPERTto TrainPractice
WAIT forNew
Problem
WAIT forNew
Problem
Expect, But HOPE for
Implementation
Expect, But HOPE for
Implementation

Possible RtI OutcomesGresham, 2005
Responder Non-Responder
High Risk
False +Adequate response
True +Inadequate response
No Risk
True –Adequate response
False –Inadequate response

Avoiding False +/-

Still not so simple: EBD?
Gresham 2005
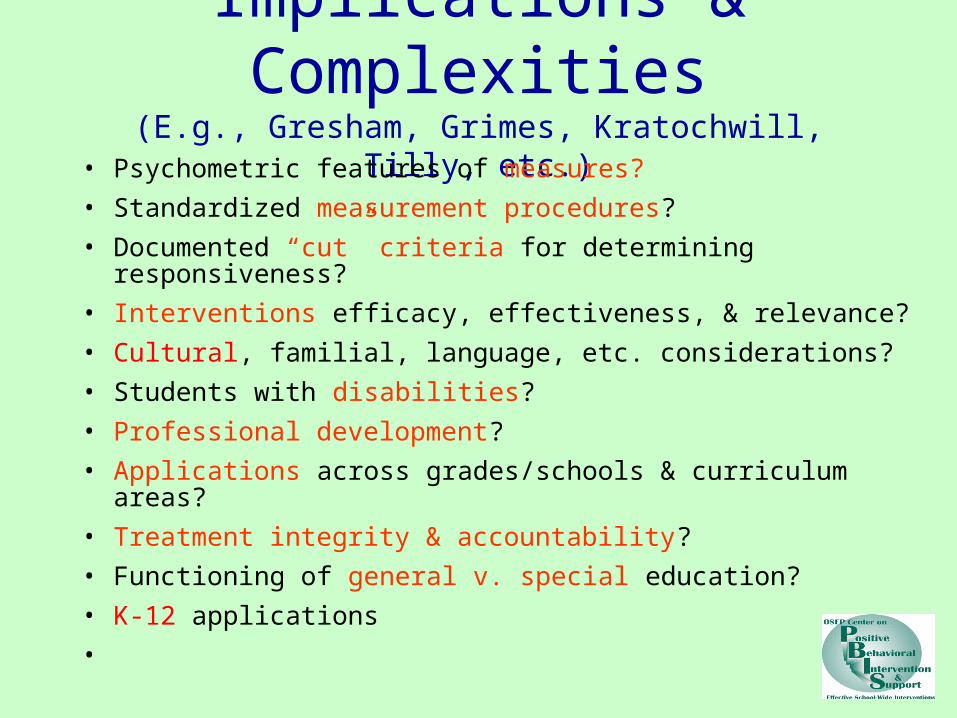
Implications & Complexities(E.g., Gresham, Grimes, Kratochwill, Tilly, etc.)
• Psychometric features of measures?
• Standardized measurement procedures?
• Documented “cut” criteria for determining responsiveness?
• Interventions efficacy, effectiveness, & relevance?
• Cultural, familial, language, etc. considerations?
• Students with disabilities?
• Professional development?
• Applications across grades/schools & curriculum areas?
• Treatment integrity & accountability?
• Functioning of general v. special education?
• K-12 applications
•

SYST
EMS
PRACTICES
DATASupportingStaff Behavior
SupportingStudent Behavior
OUTCOMES
Supporting Social Competence &Academic Achievement
SupportingDecisionMaking
Simple Systems Elements
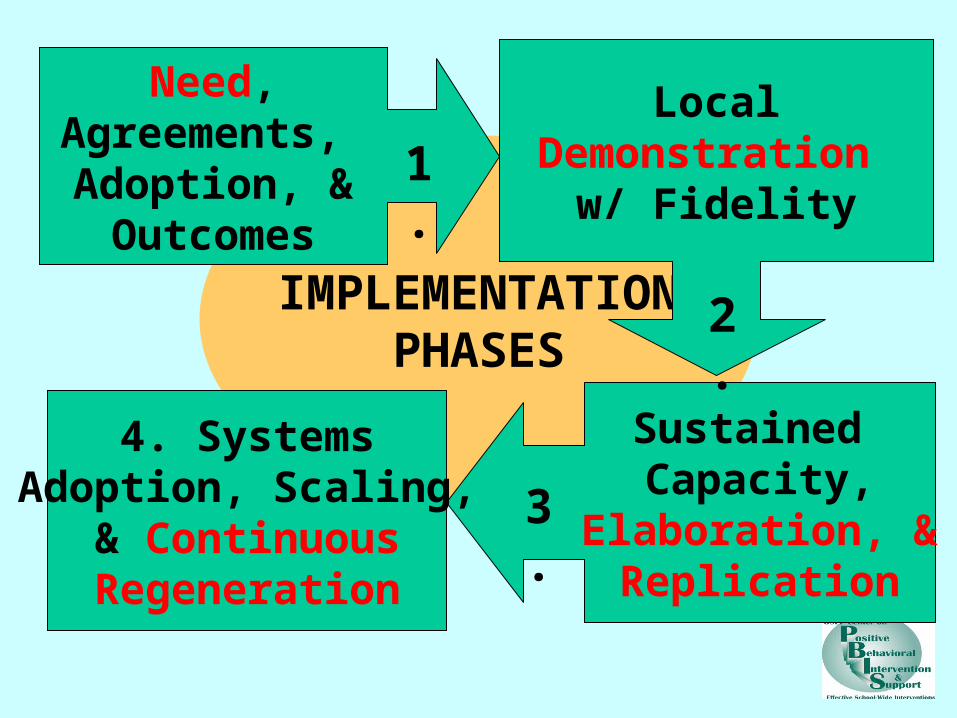
IMPLEMENTATIONPHASES
Need,Agreements, Adoption, &Outcomes
LocalDemonstration
w/ Fidelity
Sustained Capacity,
Elaboration, &Replication
4. SystemsAdoption, Scaling,
& ContinuousRegeneration
2.
3.
1.
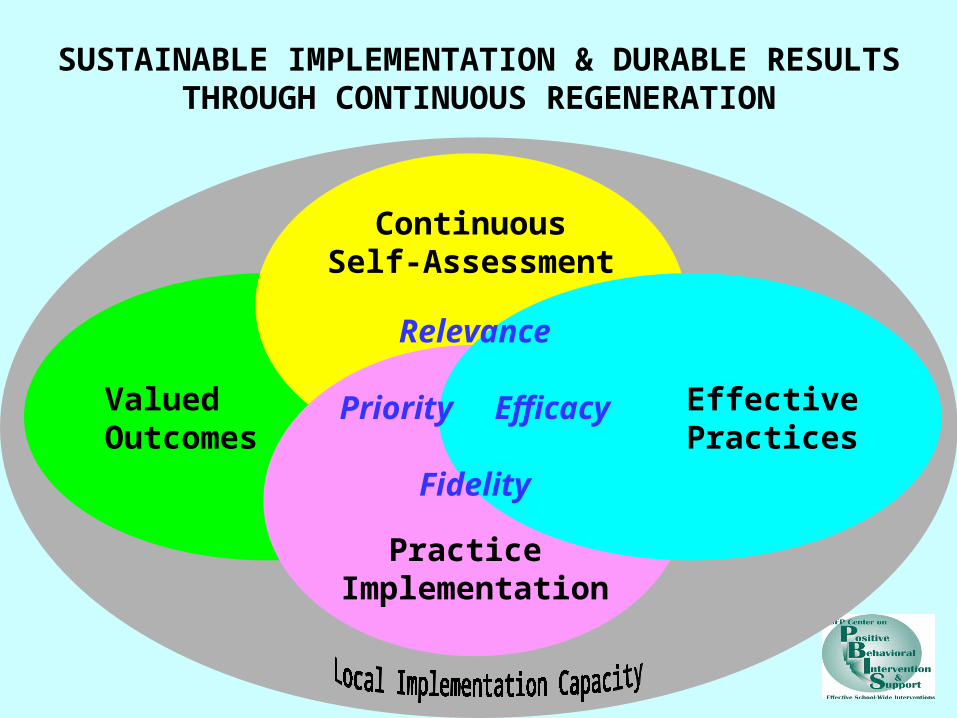
ValuedOutcomes
ContinuousSelf-Assessment
Practice Implementation
EffectivePractices
Relevance
Priority Efficacy
Fidelity
SUSTAINABLE IMPLEMENTATION & DURABLE RESULTS THROUGH CONTINUOUS REGENERATION

Future: Document…• Technical adequacy of RtI components
(measurement, decision rules, etc.)
• Full implementation across range of contexts
• Impact & relationship of academic & social behavior interaction
• Systems, resources, competence needed to maintain effects, support high fidelity of implementation, expand applications, & sustain implementation of practices

Messages
• RtI logic is “good thing” for all students, families, & schools
• Still some work to refine technology, practices, & systems
• Consider implications & complexities for practice & systems implementation
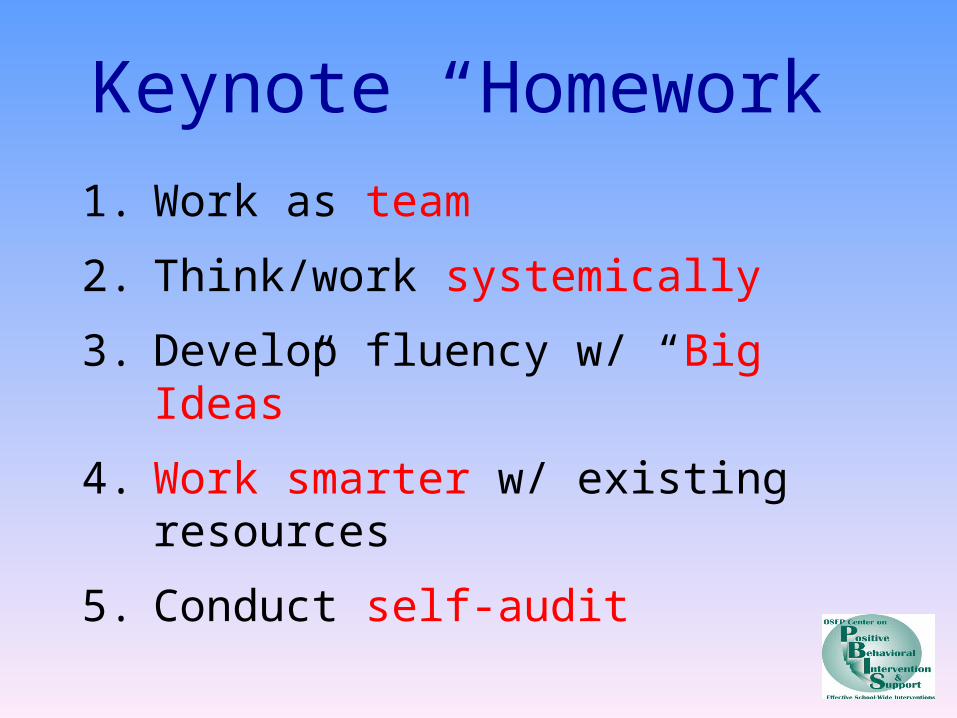
Keynote “Homework”
1. Work as team
2. Think/work systemically
3. Develop fluency w/ “Big Ideas”
4. Work smarter w/ existing resources
5. Conduct self-audit
