rr212 - practical solutions to noise problems in agriculture · practical solutions to noise...
TRANSCRIPT

HSE Health & Safety
Executive
Practical solutions to noise problems in agriculture
Prepared by Silsoe Research Institute and RMS Vibration Test Laboratory for the
Health and Safety Executive 2004
RESEARCH REPORT 212

HSE Health & Safety
Executive
Practical solutions to noise problems in agriculture
J P Evans, R T Whyte, J S Price, J M Bacon,
D A Semple, A J Scarlett
Silsoe Research Institute Wrest Park, Silsoe
Bedford MK45 4HS
R M Stayner RMS Vibration Test Laboratory
26 Coder Road Ludlow Business Park
Ludlow, Shropshire SY8 1XE
Trends in farm practices and machinery development are reviewed, and information sources searched for data on noise exposure on farms that can be associated with machinery, equipment or farm animals. Noise control techniques and legislation are reviewed in relation to recent developments and their applicability to on-farm conditions. The control of noise sources that expose operators to daily personal noise exposures (LEP, d) of 89 – 104 dB(A) is discussed and seven examples are selected for use as demonstration projects. Seven case studies are undertaken to determine if cost effective solutions can be implemented utilising on-farm labour and low cost materials. The case studies demonstrate that a useful reduction in the daily noise exposure values can be achieved by the selected solutions, in the range 3 – 16 dB(A), although additional personal hearing protection may still be required in certain situations.
This report and the work it describes were funded by the Health and Safety Executive (HSE). Its contents, including any opinions and/or conclusions expressed, are those of the authors alone and do not necessarily reflect HSE policy.
HSE BOOKS

© Crown copyright 2004
First published 2004
ISBN 0 7176 2826 4
All rights reserved. No part of this publication may bereproduced, stored in a retrieval system, or transmitted inany form or by any means (electronic, mechanical,photocopying, recording or otherwise) without the priorwritten permission of the copyright owner.
Applications for reproduction should be made in writing to:Licensing Division, Her Majesty's Stationery Office, St Clements House, 2-16 Colegate, Norwich NR3 1BQ or by e-mail to [email protected]
ii

ACKNOWLEDGEMENTS
Silsoe Research Institute gratefully acknowledges the assistance provided by the Agricultural Engineers Association and Trelleborg Industrial AVS. We are also indebted to the large number of farmers who willingly participated in the study: without their assistance and patience this investigation would not have been possible.
iii

iv

CONTENTS
ACKNOWLEDGEMENTS iiiCONTENTS vEXECUTIVE SUMMARY vii1 INTRODUCTION 1
1.1 BACKGROUND 11.2 REGULATIONS AND HEARING PROTECTION 4
2 IDENTIFICATION OF NOISE PROBLEMS 72.1 LITERATURE SEARCH 72.2 STATIONARY MACHINERY 82.3 MOBILE MACHINERY 92.4 LIVESTOCK 122.5 IDENTIFICATION OF POTENTIAL EXAMPLES FOR NOISE REDUCTION
TREATMENT 133 NOISE REDUCTION TECHNIQUES 15
3.1 BASIC CONTROL TECHNIQUES OR STRATEGIES 153.2 RECENT DEVELOPMENTS IN NOISE CONTROL PRODUCTS AND
TECHNIQUES 173.3 COMMERCIAL PRODUCTS FOR APPLICATION IN OTHER INDUSTRIES 193.4 COMPATIBILITY WITH AGRICULTURAL CONDITIONS 203.5 SUMMARY OF RELEVANT TECHNIQUES 20
4 ASSESSMENT OF EXAMPLE NOISE PROBLEMS 214.1 GENERAL APPROACH 214.2 SUGAR BEET CLEANER / LOADERS AND POTATO
HARVESTERS / GRADERS 214.3 CHAINSAWS AND BRUSH-CUTTERS 214.4 TURKEY PLUCKING MACHINES AND NOISE IN TURKEY HOUSES 224.5 TRACKLAYING TRACTORS 224.6 AIR-BLAST (ORCHARD) SPRAYERS 234.7 GRAIN DRIERS 244.8 ANIMAL FEED PREPARATION MACHINERY (MILLING / MIXING PLANT) 254.9 MAN-CARRIED MACHINE – BLOWER DUSTER 254.10 HOP MACHINERY (PICKERS AND CLEANERS) 254.11 TRACTOR PTO-POWERED MACHINERY 254.12 VEGETABLE PACKING SHEDS 264.13 SELF-PROPELLED MACHINERY: SPRAYER / DIGGER / DUMPER 274.14 WORKSHOP ANGLE GRINDER 274.15 WOOD CHIPPERS 284.16 MOBILE SAW-BENCHES 284.17 PIG HUSBANDRY 284.18 CABS OF MOBILE MACHINES WITH INADEQUATE OR DAMAGED
ACOUSTIC MATERIALS 295 NOISE REDUCTION CASE STUDIES 31
5.1 FARM-SCALE POTATO GRADING LINE 335.2 GRAIN DRIERS 345.3 ANIMAL FEED PREPARATION MACHINERY 385.4 TRACTOR (PTO) – POWERED MACHINES 435.5 FARM-SCALE VEGETABLE HANDLING / PROCESSING LINE 465.6 ANIMAL VOCALISATION DURING FEEDING 495.7 CABS OF MOBILE MACHINES 51
v

6 DISCUSSION / CONCLUSIONS 557 REFERENCES 578 APPENDICES 59
APPENDIX 1 SUMMARY OF AGRICULTURAL ACTIVITIES AND ASSOCIATEDNOISE LEVELS DERIVED FROM TALAMO ET AL. (1988) 59
APPENDIX 2 CASE STUDY NOISE SPECTRA 62
vi
EXECUTIVE SUMMARY
A review of trends in farm practices and machinery development is undertaken, based on a search of literature and electronic information sources for published data on noise exposure in agriculture. That search yielded rather little to add to a report produced for the HSE in 1988, but resulting information has been included in selecting a primary list of 27 example noise problems for which treatment could be considered. These examples are associated with operator daily exposure (LEP, d) of between 89 dB(A) and 104 dB(A). They are drawn from a range of stationary and mobile machinery, as well as animal handling activities.
Noise control techniques and legislation are reviewed, with emphasis on recent developments and on applicability to on-farm conditions. In many cases it was found that there have been no revolutions in materials and techniques. Rather there has been steady improvement in consistency and durability of products, with a marked increase in the availability of materials and equipment for noise control. In most cases there is little to deter the use of these on farms, other than cost.
Each of the potential example noise problems in the primary list is considered in relation to possible noise control treatments. Several, such as portable powered equipment, are eliminated as being suitable only for use with Personal Protective Equipment (hearing defenders). The following seven cases were selected as suitable for further consideration:
o Farm-scale potato pre-cleaning / grading line; o Grain drier; o Animal feed preparation machinery (milling / mixing); o Tractor (PTO)-powered machine; o Vegetable packing shed; o Animal vocalisation during feeding; o Cabs of mobile machines with inadequate or damaged acoustic materials
Each case is investigated with the view to demonstrating practical and economic noise reduction techniques in an agricultural situation, and in six of the cases an appropriate noise reduction solution is implemented either by SRI or farm staff. The results of the noise measurements before and after treatment are given, along with the recorded noise spectra, and all demonstrate an improvement between 3 - 16 dB(A) in the ambient / operator noise level, equivalent to a reduction in 3 – 16 dB(A) in the daily noise exposure.
vii

vi

1 INTRODUCTION
1.1 BACKGROUND
Thirty years ago the noise exposure of farm workers was dominated by what they received when operating tractors (Matthews, 1971; Tomlinson, 1970), but work had already started to control this (Matthews & Talamo, 1970). The resulting Quite (Q)-cabs introduced from 1974 have reached such a state of development that exposure to noise from other sources on the farm may in many cases exceed that from tractor operations. In parallel with this, there has been a trend towards increasing worker protection through reducing action levels for noise exposure (e.g. European Parliament (2002)). It is therefore appropriate to consider ways in which the exposure of farm workers to noise from other sources can be reduced.
This report has been prepared with the aim of assisting that end by identifying examples of farm machinery, equipment or operations that can provide demonstration material for noise reduction methods that are suitable for application on farms. It comprises the results of a search of information sources to collate data on noise exposure from all sources on the farm, together with a brief review of noise control techniques, including recent developments and some assessment of applicability to farm conditions. The noisiest sources are then discussed in relation to the possibility of treatment, and a number are selected as candidates for demonstration case studies. Each of these case studies details the selection of a suitable noise reduction method(s), the materials used and typical costs, and the benefits achieved, in terms of the reduction of ambient/operator noise levels.
A recent survey of noise exposure and hearing damage (Palmer et al, 2001) for the population as a whole did include farm workers, but the number was small, and effectively the most recent survey of agricultural worker exposure was that of Talamo et al (1988), carried out during 1985-1987. Since that time a number of changes have occurred, both regarding UK agriculture and the machinery used by it: this is considered first, by way of introduction.
Figure 1 clearly illustrates that during the 1987 – 2000 period, the number of UK agricultural holdings has diminished significantly, across both arable and livestock sectors: however, those remaining have increased in both size (see Figure 2) and productivity. Farm enterprise structure has also changed, with moves towards “operational” amalgamation of individual enterprises, as typified by corporate / contract farming in the arable sector, in order to optimise utilisation of larger, more productive machinery and spread labour costs over larger cropped areas, thereby reducing Fixed Costs. However, during the period in question, farm labour force reductions have not been restricted to the arable sector; the number of workers employed in the industry having reduced by 35% (DEFRA, 2001)
These changes have, to an extent, been offset by corresponding changes in agricultural machinery and associated working practices. Agricultural tractor sales are recognised by the industry as an accurate indicator of mechanisation trends, particularly in the arable sector. The 1987 – 2000 period witnessed a substantial reduction in unit sales (see Figure 3), but this was largely offset by significant rise in the average size of vehicle sold (see Figure 4), indicating that today’s agricultural industry uses fewer, larger, more productive machines, frequently selected to enable labour force reductions. Whilst such equipment generally embodies higher technological content and improved levels of operator comfort, its higher purchase price necessitates greater annual usage in order to offset depreciation costs. Although independent data is not available to support the view, it is widely recognised within the agricultural engineering industry that annual, and particularly daily, usage levels of higher capacity / higher
1

cost machines has increased significantly, especially given that many customers are large farming enterprises and/or agricultural contractors. To illustrate the point, today many front line agricultural tractors complete 2000 hours per year, whereas a couple of decades ago usage exceeding 1000 hours per year was considered intense. Another example would be a contractor who would now wish to operate a self-propelled sugar beet harvester for at least 70 hours per week during the October – February period.
-70
-60
-50
-40
-30
-20
-10
0
10
% C
hang
e: 1
987
- 200
0
Crops & Cereals Oilseed Potatoes Sugar Beet Dairy Cows Beef Breeding Breeding Broilers Grass Rape Sheep Pigs
Figure 1 Change in number of UK agricultural holdings: 1987-2000
0
10
20
30
40
50
60
70
80
90
% C
hang
e: 1
987
- 200
0
100
110
120
130
Crops & Cereals Oilseed Potatoes Sugar Beet Dairy Cows Beef Breeding Breeding Broilers Grass Rape Sheep Pigs
Figure 2 Change in UK holding average cropped area / herd size: 1987-2000
Whilst these trends typify the large farm enterprise / contractor sector, the bulk of UK agriculture is still represented by family-owned units employing small numbers of staff, often on a casual basis. Whilst such enterprises probably use the services of agricultural contractors for specific tasks (e.g. harvesting, silage making), day-to-day operation has remained largely unchanged, particularly if livestock form part of the enterprise. The size / capacity of equipment used may well have increased and numbers reduced correspondingly, but the type of machinery, its general method of operation and hence its ability to generate noise have not changed significantly, although this is discussed in more detail in Section 2. Livestock
2

enterprises have increased in size (see Figure 2), but once more, with the possible exceptions of greater agricultural contractor utilisation and/or intermittent hire of higher capacity machines from machinery pools, etc, for use by on-farm staff, the basic operations which are undertaken
Ave
rage
hor
sepo
wer
of t
ract
ors
> 40
hp
Trac
tors
sal
es>
40 h
p (th
ousa
nds)
and the machines which perform them have changed little.
25
20
15
10
5
0 1988 1989 1990 1991 1992 1993 1994 1995 1996 1997 1998 1999 2000
Year of manufacture
Figure 3 UK sales of agricultural tractors (above 40 hp)
130
120
110
100
90
80
70
60 1988 1989 1990 1991 1992 1993 1994 1995 1996 1997 1998 1999 2000
Year of manufacture
Figure 4 Average engine power of tractors (above 40 hp) sold in the UK
In the following discussion of individual types of noise source, some attempt has been made to include the possible impact of these changes. However, in many cases this amounts to a situation in which fewer workers are exposed to noise sources for longer durations.
3

1.2 REGULATIONS AND HEARING PROTECTION
It has been widely accepted for some years that exposure to loud noise can cause loss of hearing or tinnitus (ringing in the ears), or both. Noise-induced hearing loss is additional to the natural and progressive loss of hearing with advancing age. Consequently, a relatively small loss of hearing acuity of, e.g.30dB, which may not cause an impairment that is noticeable to someone aged 25 years, can bring forward by more than a decade the age at which the overall effect does become a handicap.
It has been well established that the effects of noise on hearing are predicted by a value of dB(A) averaged over the working day (Leq). The daily exposure value is also adjusted for the length of the working day, according to the equal energy principle, to give a level for a nominal 8-hour day (La8 or LEP, d). In any regulations or legislation, Action Levels or Limit Levels are assumed to be expressed in dB(A) (LEP, d).
The UK has had its own regulations to control the exposure of workers to noise for some years (Noise at Work Regulations, 1989). The salient points of these are outlined below, followed by the important changes that the new Directive will introduce.
The present UK Regulations prescribe two Action Levels. The first Action Level is at 85 dB(A), and the second Action Level at 90 dB(A). A peak pressure of 200 Pascals carries the same requirements as the Second Action Level, even when the LEP,d is less than 90 dB(A).
Whatever the level of daily exposure, employers are required to reduce the risk of hearing damage to the lowest level reasonably practicable. They are also required to assess whether any of their workers are likely to be exposed to such an extent as to be presented with a possible risk to their hearing. If this is likely to be the case, they have to use appropriate means (usually measurements and calculations based on known work patterns) to compare exposures with the two Action Levels, and they have to keep records of these assessments and any subsequent ones.
Where the First Action Level is exceeded, workers must have the risk explained to them, be provided with regular checks of hearing health, and be offered hearing protection (which they are not required to accept). Where the Second Action Level is exceeded there is a duty on the employer to reduce the exposure, so far as is reasonably practicable, by means other than hearing protection. This may involve a programme of physical measures to reduce noise levels and management measures to reduce exposure time. Further to this, any places where employees have to wear hearing defenders must be clearly marked as “ear protection zones”. The use of hearing protection is mandatory until exposures have been reduced to below the Second Action Level
Other European countries have their own noise regulations that are more or less similar. Since these have all been in force for more than a decade, it was thought that it was time to introduce a new Directive to reflect the lower noise levels that are now possible in many industries, and to provide more effective protection for workers. Differences between the Directive and the present UK Regulation are broadly as follows.
4
1 The First Action Level is lowered from 85 dB(A) to 80 dB(A).
2 The Second Action Level is lowered from 90 dB(A) to 85 dB(A).
3 A Limit Level is introduced, that must not be exceeded. This is set lower than the present UK Second Action Level, at 87 dB(A). This value is allowed to take into account the “assumed attenuation” of hearing protectors, which must of course be worn if they are necessary to achieve compliance.
4. Peak pressure levels are prescribed, equivalent to both Action levels and the Limit level, as follows: First Action Level 112 Pascals (135 dB) Second Action Level 140 Pascals (137 dB) Limit Level 200 Pascals (140 dB)
In some “duly justified” circumstances, it may be allowed to use a dB(A) value that is averaged over a week.
The requirements at the first and second Action Levels are broadly similar to those at each of the two UK Action levels:
When the First Action Level is exceeded: x Workers must be provided with information and training x Workers must be offered hearing protectors x Audiometric testing must be available
When the Second Action level is exceeded: x There must be a programme of technical and organisational measures aimed at reducing
exposure to noise. x Areas of high noise level must be marked and delimited, and access must be restricted. x The use of hearing protectors is mandatory. x Workers must have the right to hearing checks by a doctor.
The lowering of the First Action Level is likely to bring many more workplaces within the scope of the regulation, including those in the farming industry.
The inclusion of an enforceable Limit Level is likely to have an effect in some industries. The setting of this Limit Level just 2 dB(A) above the Second Action Level may lead to some difficulties in interpreting what is intended. In essence, when the noise environment leads to exposure above the Second Action Level, and until such time as other measures have been put in place successfully to reduce the exposure, hearing defenders must be worn. These hearing defenders should bring the exposure below 85 dB(A) (LEP,d). However, because the exposure inside the hearing protectors can be estimated only by using an assumed value of attenuation which is not known precisely for each particular environment, the Limit Value is relaxed by 2 dB(A). In any case, the use of hearing protection does not remove the duty to introduce technical and organisational measures aimed at reducing the noise exposure.
In agriculture, the wearing of suitable hearing defenders would be enough to bring daily exposure below 85 dB(A). However, and in addition to the requirement to reduce exposure by other means, the frequent presence of dusty environments and the need to use auditory monitoring of machines and processes often renders hearing defenders uncomfortable or
5

impractical. The new Directive is therefore going to require farmers to make more effort to control noise at source than has previously been the case.
6

2 IDENTIFICATION OF NOISE PROBLEMS
2.1 LITERATURE SEARCH
The bibliographic databases that have been searched are summarised in Table 1, and, where possible, the search was extended back to 1985. Silsoe Research Institute’s (formerly the National Institute of Agricultural Engineering) own publications record indicates that research into agricultural noise and agriculture worker hearing damage extends back to at least 1964. Searches of the bibliographic databases indicate that little research into agricultural noise has been carried out after 1987. However more recently, surveys of reduction of hearing acuity and incidence of tinnitus have been carried out in Japan (Miyakita and Ueda, 1997), the USA (Beckett et al., 2000) and the UK (Palmer et al., 2001). In a series of studies on high school farm students, the significant hearing loss found in adult farmers was considered to begin in childhood (Broste et al., 1989).
Table 1 Summary of internet literature search (Keywords: noise and agriculture)
Database searched
Details of search Number of responses
Comments
Zetoc 1985 to present 17 References of little use to this project
CAB abstracts 1973 to present 18 Relevant citations but little present that will expand our knowledge
Ingenta 1988 to present 2 Nothing that adds to our knowledge
OCLC 1992 - 2001 28 1 reference to the application of noise control on farms
Ergonomic Abstracts
Whole database 56 6 possibly useful references
Web of Science Whole database 27 4 possibly useful references
Google Search Engine for >24,000 Results too diverse. Rearrangement of the the internet keywords to the phrase ‘agricultural noise’
produced 0 responses. NASD website 2 down- Of limited use
loaded
The most recent extensive survey of worker exposure to agricultural machinery noise was carried out by Talamo et al. (1988) in 1985-7, whose purpose was to estimate the levels of worker noise dose for the whole agricultural year, rather than to identify machinery from which excessive noise emanated. The structure of the survey, however, allowed a breakdown of the noise exposure from various types of machinery that included stationary, man-carried, tractor drawn and/or powered, and self-propelled. In the past 15 years there have been developments in agricultural machinery that have made some of the machinery encountered then obsolete, and others that have required the use of more powerful tractors that are fitted with Q-cabs. However, some types of machinery encountered in 1985 to 1986 will still be in use today, because of the general longevity of agricultural machinery and because of little or no change in machinery design where it was found to be effective. A breakdown of the noise dose levels according to machinery type encountered in the survey is presented in Appendix 1.
7
In the following sections, agricultural machinery noise sources have been sub-divided into the following categories:-
x Stationary Machinery; x Mobile Machinery; x Livestock.
Because of the comprehensive extent of the 1985-87 survey by Talamo et al. (1988), the results obtained are taken as reference values and compared with the proposed Second Action Level of 85 dB(A) (EU Physical Agents (Noise) Directive, 2002). Where more recent literature emphasises, contradicts or shows a change in the noise dose from the same category of machinery it too has been included, together with some sources not covered by Talamo et al. (1988). Values for LEP, d are rounded to the nearest integer dB, regardless of the implied precision of the data from which they have been taken.
2.2 STATIONARY MACHINERY
Stationary machinery describes all machinery that is either fixed in one location, generally because of its size or weight and the purpose for which it is used, such as a hammer mill, or machinery that can be moved from one location to another, but is used in a fixed place, such as a conveyor. For convenience, some machinery that tends to be used in a fixed location, such as angle grinders in a workshop, are included in this section.
2.2.1 Grain driers: The number of years of grain drier use was found to have a significant relationship with hearing loss in New York farmers (Beckett et al., 2000). The LEP, d (equivalent 8 hour average exposure level) for exposure to grain drier noise in the UK in 1985 was 92 and 96 dB(A) for cascade and cross flow driers respectively; well above the proposed Second Action Level of 85 dB(A): the major noise source within grain driers being axial fans. Average LEP, d noise exposure while working with green crop driers was 91 dB(A).
2.2.2 Feed milling equipment: Animal feed preparation technology has changed little in the last 20 years. Working with hammer mills and roller/crusher mills was found to give noise exposure levels of 87 and 95 dB(A) respectively. No further more recently published literature has been found which indicates likely current noise exposure levels for this type of machinery.
2.2.3 Hop machinery: The number of farmers producing hops in the UK has fallen from 380 in 1985-7 to 200 in 1995, and to less than 180 in 2001. The number of agricultural workers operating hop pickers and cleaners, and driers where noise exposure levels of 94 and 89 dB(A) respectively were measured (in 1985-7), is likely to have fallen. No further more recently published literature has been found which indicates likely current noise exposure levels for this type of machinery.
2.2.4 Vegetable packing stations: These are more akin to factories as they contain a variety of machinery designed for the cleaning, grading and packing of a variety of vegetables either in bulk or supermarket-ready form, in conventional or high quality packaging. All the machinery is housed under one roof and comprises a number of lines for different vegetables, sometimes housed in different rooms. The cleaning, processing and packaging is normally a continuous process. In the 1985-7 study, highest noise exposure levels of 92 dB(A) were encountered in the general operating area where pneumatically-powered automated packaging equipment was used. Noise exposure of workers working next to packer/weighers which operated using pneumatic valves and rams, also exceeded the action level at 89 dB(A). Much of
8

the engineering found in these plants is manufactured in-house without regard to the siting of components that are noise emitters. Stainless steel sheet is commonly utilised for discharge chutes, and in general these are not damped and so emit high reverberant noise levels with vegetable impact.
2.2.5 Workshop tools: The action of angle grinders gave rise to average noise exposure levels of 91 dB(A). No developments are apparent that will reduce the noise exposure without changing their modus operandi.
2.3 MOBILE MACHINERY
This category encompasses all farm machinery that is mobile. It includes self- propelled vehicles, trailed powered machinery, horticultural machines including those that are used in a stationary location but are tractor mounted such as a wood chipper, and man-carried machinery such as chain saws and brush cutters.
2.3.1 Effect of age on Q-cab noise attenuation: In an investigation of the effect of ageing on tractor cab noise attenuation (Talamo et al., 1990) 46 tractors were subdivided into 4 groups, according to similarity of model, and 5 & 10 years nominal age. Sound pressure measurements were made in the cab at the drivers ear position, whilst the tractor was subjected to maximum and light power take off (PTO) loading, at both 540 and 1000 rpm respectively. Visual assessments were made of the cabs’ conditions including presence of doors and window glass, condition of door and window seals, control seals, floor mats and acoustic linings, and rated between 1 & 5. The cabs’ anti-vibration mountings were examined for damage, whilst mounting brackets and bolts were examined for signs of fatigue. While the results of this study showed only a weak correlation between tractor age and noise level at the drivers ear, a negative correlation was indicted when all the tractor types and age were included. These results indicated the difficulty in using the same fault scoring system between different designs of cab. For example, a major fault in a cab seal might have achieved a score of one and greatly reduced noise attenuation, but its effect on the overall fault score would have been minimised if all the other aspects of cab condition were good and received high scores. More quantitative methods such as measuring the differential pressure between the inside and outside of the cab when fully shut per length of seal might have provided more useful information, or alternatively treating the different methods of noise attenuation present separately. The presence of cabs on many types of self-propelled machines, as well as tractors, both of which may remain in use for many years, makes their contribution to protecting workers’ hearing particularly important. It also makes advice as to how to prolong their effectiveness particularly valuable. An article in PROFI International (Renfert-Deitermann, 2000) describes practical work to repair relevant parts of cabs, but gives no values for the improvements likely to be obtained.
2.3.2 Self propelled harvesting machines: The average noise exposure for workers operating self-propelled mobile machinery exceeded 85 dB(A) for all combine harvester categories, potato and sugar beet harvesters, self-propelled forage harvesters, swathers and pea viners, generally fitted with cabs. The beet harvesters gave rise to the greatest noise exposure at 91 dB(A). Early combine harvesters were not fitted with cabs and there are still a number in use. Early cabs fitted to combine harvesters and other mobile machinery were not effective Qcabs, but rather weather protection cabs. The continued use of this type of cab cannot be ruled out. No further, more recently published literature has been found which indicates likely current noise exposure levels for this type of machinery.
9
2.3.3 Tracklaying tractors: The 1985-7 survey encountered tracklaying tractors of a wide age range, both with and without cabs, which gave rise to average noise dose exposures of 96 and 98 dB(A). This range includes some new tracklaying tractors which were found not to have cabs. Generally, the vehicles encountered had weather cabs only, mounted directly to and/or around the transmission casing. Again, no further, more recently published literature has been found which indicates likely current noise exposure levels for this type of machinery. Fitting Qcabs retrospectively on old types of this machine is problematic, because of the control levers for steering and other mechanisms.
2.3.4 PTO-powered machinery: Trailed or mounted machinery that is powered by the tractor PTO, gives rise to noise levels that are effectively attenuated by a closed Q-cab. However the values of average dose exposure in the 1985-87 survey for many types of the trailed, PTO-powered machinery (see Appendix 1) exceeded 85 dB(A). In the cases of forage harvesters, disc mowers, and balers, where the average noise exposure ranged from 87 to 91 dB(A), this was indicative of operating the machinery with either window or doors open in warm weather for thermal comfort. In a limited study of comparing noise levels while operating trailed machinery with the cab open or closed, Stiles et al. (1994) found differences of between 7.6 and 12.6 dB(A) for disc mowers (average maximum of 93 dB(A)), which are comparable with the results of Talamo et al. (1988). The noise exposures for rotary cultivators measured in both of these two studies were also similar at between 82.5 and 85. dB(A). However, Talamo et al. (1988) found that noise exposure from forage harvesters were on average 3 dB(A) more than those measured by Stiles et al. (1994), with the cab open. In other instances, where secondary cultivation equipment was used (e.g. rotary harrows), the rear window was occasionally left open to gain visual inspection of the results, despite the dust that was sometimes created.
Other tractor mounted machinery, such as hedge cutters, was often mounted on small to medium size tractors, frequently fitted with weather cabs, which afforded protection from flying debris. A great deal of this equipment has increased in size, which necessitates mounting on a larger tractor, which are generally fitted with Q-cabs. The increase in size of trailed, PTOdriven equipment such as high-density balers and trailed sugar beet harvesters, also has necessitated the use of larger tractors, generally fitted with Q-cabs. While the average noise dose from tractor mounted sprayers and trailed seed drills surveyed in 1985-7 were below 85 dB(A), these have increased in size and frequently use pneumatic systems to assist application of spray or to effect seed transport. No information to quantify the noise dose from such equipment has been found.
2.3.5 Orchard sprayers: An exception to the above are air-assisted or air blast orchard sprayers. These use axial fans to propel spray droplets into fruit trees and other orchard / vineyard crops. Because of limited inter-row width and overhanging foliage, narrow tractors fitted with weather-shield cabs, are often used. Consequently operator exposure to noise is high, an average noise dose of 97 dB(A) having been measured in 1985-7. Although current narrow tractors can be fitted with Q-cabs, the space inside is very restricted, making it difficult for the operator of an orchard sprayer to carry out his job effectively. For that reason it is suspected that the tractors currently used for orchard spraying are not all fitted with Q-cabs.
2.3.6 Vegetable cleaners: A number of agricultural operations depend upon manual recognition and labour to identify and remove foreign bodies from crops such as clods and large stones in harvested sugar beet. These operations require the conveying of the crop on web belts in order to remove excess soil and to see and remove the foreign bodies. The noise generated by the drive to the belts has resulted in noise exposure doses as high as 104 dB(A) to the operators working on these machines, who are generally only shielded from the weather.
10

Although the number of this type of machine that are manned may be relatively small, they are still manufactured.
2.3.7 Horticultural machines: A number of horticultural machines in the 1985-7 survey were encountered in local council amenity services. Rotary mowers caused the greatest noise exposure, doses of 87 dB(A) for pedestrian operated to 92 dB(A) for ride-on machines being measured. With increasing diversification in agriculture, to attract the urban population to the countryside, more horticultural machines are likely to be used by farm workers. However, the time spent using them is likely to be small.
Some machines used in market gardening activities gave high noise exposures, including a hoecultivator and a potato lifter, at 88 and 93 dB(A) respectively. However, these two machines were used for short periods and had insignificant effect upon the daily noise exposure dose. Growth in organic enterprises and niche market specialists during the last decade, have probably increased the use of horticultural machinery. No information to quantify the noise dose from horticultural machinery currently in use has been found.
2.3.8 Wood chippers: Wood chippers were not examined during the 1985-7 survey. They have proliferated in domestic, amenity, forestry, highway and agricultural environments. Lines and Lee (1991) made noise measurements on a wood chipper, powered by a 13.4 kW engine, when chipping lengths of yew, 50x50 mm in cross section. Noise pressure levels approximating to the position of an operators ear were 120 dB(A) when chipping wood at maximum engine speed, and 101 dB(A) without wood engaged in the machine.
2.3.9 Mobile saw benches: Mobile saw benches may be tractor powered, or stand-alone units powered by integral diesel engines or electric motors. The latter are restricted in their mobility, but are very much quieter. Operator ear position working sound pressure levels have been measured at 100 dB(A) for a diesel powered unit and 92 dB(A) for an electrically powered unit (Stayner, private communication).
2.3.10 Man-carried machinery: The noise generated from man-carried machinery is mainly generated by a two-stroke petrol engine in close proximity to the operator. The average noise exposure doses ranged from 90 dB(A) for blower/dusters, 94 dB(A) for hedge cutters and 101 dB(A) for chain saws. It is unlikely that these values will have changed much since the 1985-7 survey.
11

2.4 LIVESTOCK
2.4.1 Cattle feeding: The noise exposure dose of 88 dB(A) during cattle feeding primarily resulted from the noise emitted from feeder wagons.
2.4.2 Pig husbandry: Pig vocalisation noise levels measured in the 1985-7 survey of 89 dB(A) compare with those recorded by Talling et al. (1998), although the latter’s measurements of noise did not use the ‘A’ weighting. Crutchfield and Sparks (1991) reported on noise in pig breeding and growing facilities in Scandinavia, where the noise levels between the feed alleys ranged from 95 to 104 dB(A) for two 45 minute periods per day. The noise levels generated by the power units of high pressure cleaning sprayers on the pig farms ranged from 98 to 105 dB(A). Many pig farms use permanently installed pressure lines for high pressure cleaning sprayers, so the noise generated will be considerably less. Estimates of exposure time for pressure cleaning range from 1 to 3 hours a week.
2.4.3 Milking parlours: Although milking parlour noise exposure measured in the 1985-7 survey was low, only one sample was taken. There is no reason to suppose that it is not typical of milking parlours in general.
2.4.4 Seasonal turkey production: The average noise exposure from turkey dry pluckers was found to be high at 99 dB(A), and probably in part originates from the fan used to blow feathers away from the machine. These machines are still manufactured for farm gate sales of turkey, although locating this machinery is proving to be difficult, as a significant proportion of birds are plucked by hand. High levels of noise exposure were also experienced in turkey housing at 94 dB(A) and was most likely to have arisen from turkey vocalisation.
2.4.5 Farriers: Farriers were not examined during the 1985-7 survey. Although it is arguable that they are generally associated with the agricultural community, it may be more appropriate to class them with the leisure industry that encompasses other activities outside agriculture. However, noise measurements of hammering on anvils during final shoe fitting ranged from 98 to 120 dB(A), with the majority of readings above 108 dB(A). The ringing of an anvil was considered to be a continuous noise, as the hammer blows were less than a second apart. Up to two hours a day were spent shoeing horses, without the use of hearing defenders (Crutchfield and Sparks, 1991).
12
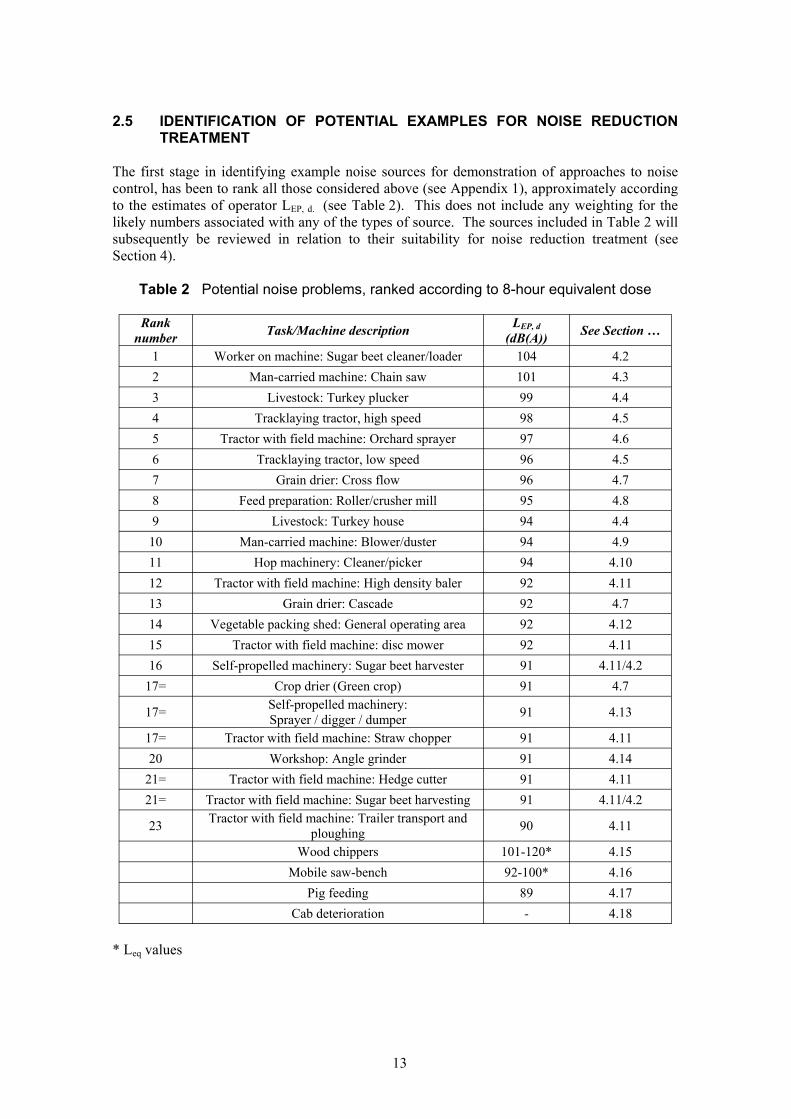
2.5 IDENTIFICATION OF POTENTIAL EXAMPLES FOR NOISE REDUCTION TREATMENT
The first stage in identifying example noise sources for demonstration of approaches to noise control, has been to rank all those considered above (see Appendix 1), approximately according to the estimates of operator LEP, d. (see Table 2). This does not include any weighting for the likely numbers associated with any of the types of source. The sources included in Table 2 will subsequently be reviewed in relation to their suitability for noise reduction treatment (see Section 4).
Table 2 Potential noise problems, ranked according to 8-hour equivalent dose
Rank number Task/Machine description LEP, d
(dB(A)) See Section …
1 Worker on machine: Sugar beet cleaner/loader 104 4.2 2 Man-carried machine: Chain saw 101 4.3 3 Livestock: Turkey plucker 99 4.4 4 Tracklaying tractor, high speed 98 4.5 5 Tractor with field machine: Orchard sprayer 97 4.6 6 Tracklaying tractor, low speed 96 4.5 7 Grain drier: Cross flow 96 4.7 8 Feed preparation: Roller/crusher mill 95 4.8 9 Livestock: Turkey house 94 4.4
10 Man-carried machine: Blower/duster 94 4.9 11 Hop machinery: Cleaner/picker 94 4.10 12 Tractor with field machine: High density baler 92 4.11 13 Grain drier: Cascade 92 4.7 14 Vegetable packing shed: General operating area 92 4.12 15 Tractor with field machine: disc mower 92 4.11 16 Self-propelled machinery: Sugar beet harvester 91 4.11/4.2
17= Crop drier (Green crop) 91 4.7
17= Self-propelled machinery: Sprayer / digger / dumper 91 4.13
17= Tractor with field machine: Straw chopper 91 4.11 20 Workshop: Angle grinder 91 4.14
21= Tractor with field machine: Hedge cutter 91 4.11 21= Tractor with field machine: Sugar beet harvesting 91 4.11/4.2
23 Tractor with field machine: Trailer transport and ploughing 90 4.11
Wood chippers 101-120* 4.15 Mobile saw-bench 92-100* 4.16
Pig feeding 89 4.17 Cab deterioration - 4.18
* Leq values
13

14
3 NOISE REDUCTION TECHNIQUES
In this section there follows a brief outline of the most common noise reduction techniques and strategies, followed by a discussion how these have been enhanced by recent developments. There is also included an indication of what is available commercially, a discussion of what techniques are likely to be compatible with agricultural conditions, and finally a summary of techniques likely to be relevant to the control of noise on farms.
3.1 BASIC CONTROL TECHNIQUES OR STRATEGIES
All noise reaches the human ear through the air, but in the course of transmission to the ear there are two possible phases: airborne and structure borne, and each requires separate control strategies and products. The available methods of noise reduction, which apply to both airborne noise and to structure borne noise, may be listed as follows:
x Reduction at source x Sound Barrierx Vibration reduction x Sound Absorption x Silencers (special use of absorption) x Active cancellation
There are in addition special types of product for dealing with noise in hydraulic and pneumatic systems, which may not be considered here.
3.1.1 Reduction at source
Ideally the source of the noise problem should be designed out of the machinery when developing the machine in the first instance. However this is not always a commercial consideration, as noise reduction can involve higher costs and is usually only applied when the legislation requires certain limits. Also noise is often found to be a problem when the main design parameters have been chosen and it is too late to make the desired changes to the source. An example of noise reduction in the design stage is the selection of fans for low noise and in particular identifying where axial flow fans can be replaced with centrifugal type fans.
3.1.2 Sound barrier (airborne noise)
The purpose of sound barrier materials is to reduce transmission of airborne noise. Barrier materials may include wood, metals, glass, concrete and plastic or composite sheet, the choice depending on the industry or application involved. The denser the material, the more the sound transmission is reduced. The ideal material would be in the form of a dense, non-resonant sheet, sometimes described as a “limp mass”. To provide maximum acoustical effectiveness it is necessary for the enclosure to be as well-sealed as possible - if an enclosure is formed with 10%-15% open for noise transmission, up to 50% of the generated noise will escape. Where total containment is not possible, the placement of the barrier in direct line of sight between noise source and receiver is the next best alternative.
15
3.1.3 Vibration reduction (structure borne noise)
Structural borne noise can be a major problem in mechanically connected or welded machinery and structures. It can be treated by either isolation or damping, or a combination of both. Isolation involves use of mounts or pads to de-couple the vibrating source from the surrounding structures, thereby preventing energy from being transmitted to other locations from which it can be radiated as airborne noise. Common applications are engine mounts in cars, other vehicles and machines powered by internal combustion engines, and cab mounts for tractors and other vehicles. Designs of mount include rubber-in-shear, spring type or moulded polyurethane elastomer.
Damping refers to the process of removing vibration energy from stiff panel surfaces, such as sheet metal, wood or reinforced plastics. Drumming and ringing noise is reduced by applying sheets of damping material to selected locations, such as car door panels, boat hulls or bulkhead areas. Damping sheets can also be sandwiched between layers, e.g. of plywood, to make a quiet construction panel, sometimes known as “constrained layer” damping. Because isolation treatments are only partially effective, damping is often required to achieve desired noise and vibration reductions.
3.1.4 Sound absorption (airborne noise)
Sound absorption is a means of using materials to reduce reflected noise and hence reverberant build-up. Porous materials such as foam or fibreglass, soak up the noise inside tractor cabs and similar applications. Wood-wool, perforated panels and panels with backing voids perform a similar function in building construction. However, in room acoustics, it is often the furnishings that provide most of the absorption. Absorbent materials are best used in close proximity to the sound sources and are not effective for transmission reduction, i.e. they should not be used as shields, barriers or enclosure walls.
3.1.5 Silencers
Silencers or mufflers are a special case of absorption and reduce acoustic pressure fluctuations in streams of air or other fluid. There are two basic types of silencer: absorptive and reactive. Absorptive silencers reduce reflections from the walls of the tube or duct that contains the stream of fluid, and may be augmented by additional “splitters” placed within the stream. Reactive silencers depend on the reflection or expansion of sound waves with self-destruction as the basic noise-reduction mechanism.
Automotive applications, such as car or tractor exhaust systems, usually use a combination of both absorptive and reactive techniques. Heating, ventilation and air conditioning (HVAC) systems use absorptive, duct silencers which are incorporated in bends and louvers, and which may be applicable to fan and airflow noise in farm building applications.
3.1.6 Active cancellation
The idea of generating sound whose pressure fluctuations are directly in opposition to a received noise has been tested in various applications for some years. It works best where there is either a source that approximates to a point source, or a single receiver, so that the measured sound pressure can be reproduced accurately. It is relatively complex, involving system components for measurement, computation and sound generation. Applications in agriculture have been investigated by Silsoe Research Institute without much success (Talamo & Peachey, 1985).
16

3.2 RECENT DEVELOPMENTS IN NOISE CONTROL PRODUCTS AND TECHNIQUES
Throughout the last few decades, growing interest in controlling noise, be it in the built environment, for greater “quality” in cars and other consumer products, or for worker protection, has led to continuous improvement in the materials and components available for its achievement.
3.2.1 Barrier materials
One particular development in the field of barrier materials to reduce transmission of airborne noise, has been in heavy, flexible sheet material, in which high mass density is achieved without the use of lead loading. This does not make the material significantly more effective than leadloaded sheet, but it makes it both cheaper and safer. There have also been developments in mouldable barrier materials.
3.2.2 Absorbent materials
Production quality has steadily improved the consistency of foam materials, but of equal or greater practical significance has been the improvement in methods of applying partially porous “skins”, often by melting into the surface instead of glueing on. A common disadvantage of earlier types of absorbers with perforated covers was that the glue blocked the perforations, rendering the entire material quite ineffective. In the built environment, there are now some spray-on materials which, while not having great efficiency, especially at low frequencies, do make a significant contribution to reducing reverberation, if they can be applied over large areas.
3.2.3 Materials for panel damping
More effective panel damping, and better resistance to environmental influences, have been achieved through developments in chemical engineering, particularly increasing the loss factors of the materials, and improving the quality of adhesives.
3.2.4 Composite materials
Materials are now available that combine layers of barrier, damping and absorbent material, in thicknesses that can be tailored to suit many applications. These make the construction of noise enclosures more effective, and improve partial treatments of machines in many ways.
3.2.4 Seals
Sealing strips for doors and other openings in enclosures, cabs, etc. have also been improved by advances in chemical engineering. These have provided softer sections, for better sealing, that are also more durable than in the past. Used in conjunction with appropriate structural components, they can greatly improve the efficiency of noise enclosures.
3.2.5 Vibration isolation (anti-vibration mounts)
For automotive use, such as mounts for engines or tractor cabs, where elastomers are still favoured, developments have included the addition of internal damping in which fluid is pumped between two moulded chambers, and the use of secondary or two-stage systems. Both of these can be tuned to increase efficiency at selected frequencies. Mounts for large machines may be combinations of steel, rubber or air springs with fluid damping. They can also include
17
levelling facilities for sensitive machinery. The main advances are in fact the availability and selection of the most appropriate mounts, rather that any specific technology.
3.2.6 Silencers
The basic techniques for silencer design have been known for many years. Improvements have generally resulted from the availability of materials (for absorption types) that are more durable, or have more consistent properties.
3.2.7 Hydraulic and pneumatic systems
These have been the subject of focused R&D over the last 2 or 3 decades, resulting in knowledge of how to eliminate internal sources of noise, e.g. by better design of valves and the development of specific components such as silencers for air outlets.
3.2.8 Better by design
In many applications, noise reduction has in the past been hampered by shortcomings of the machine or equipment in question. Vibration can be transmitted along control linkages and hydraulic pipes; airborne noise can be difficult to stop if there are many existing points of entry into an enclosure for different services, and the poor location of noisy components near to the operator can all limit the potential for improvement. By taking factors such as these into account at an early stage of design, it is often possible to make better use of the specific materials that are available for noise reduction. This is one of the advances that have been taking place in recent years.
There have been advances in the field of building and civil engineering, by sealing, isolation and reduction of flanking noise paths, a good example within agriculture has been the development of tractor cabs. Over a 25 year period they have improved from a situation where 90 dB(A) could just be achieved at the driver’s ear, to one in which 70 dB(A) is now possible. As outlined below, contributory factors have been:
Isolation materials: The cab needs isolation mounts to prevent noise being transmitted from engine and transmission directly into the cab enclosure. These are normally elastomers, but for better efficiency, composite designs are sometimes used with internal fluid damping. The structural design of the chassis and cab are considered, in the specification of isolation mounts, to optimize the mechanical impedances and so maximize mount efficiency.
Barrier materials: Panel surfaces inside the cab are covered with mass-loaded rubber mats to minimise transmission via this route. The panels themselves are designed to eliminate resonance at normal excitation frequencies.
Seals: Door seals are particularly important for preventing the ingress of sound. The improved performance of materials, as described above, is further enhanced by better quality control during production, which results in more consistent widths of gap to be sealed, and the use of steel sections that treat sealing strips favourably. Windows which are not required to open (e.g. car rear three-quarter), can be bonded in place, thereby optimising the seal between different sections of the vehicle structure.
Damping compounds: Damping compounds are used in conjunction with structural methods of eliminating panel resonance, on the larger cab panels, and also within the underbonnet area. Under the bonnet, and below the cab, they may be combined with absorbent layers to control reverberant amplification.
18

Absorption materials: These are actually used more sparingly than in early Q-cabs, because of the success of the techniques mentioned above. Surface or cover material have changed from perforated PVC, which was often not as effective as it should have been in reducing in-cab reverberation, to actual or simulated cloth. Low frequency absorption has been enhanced by means of internal roof panels with backing voids.
3.3 COMMERCIAL PRODUCTS FOR APPLICATION IN OTHER INDUSTRIES
In parallel with the advances in materials and control techniques, and reflecting the growth of the market for such products, there has been an increase in the number of suppliers. The Buyer's Guide of the Institute of Acoustics includes over 100, mostly UK companies offering everything from basic materials for absorption, barriers, panel damping and seals, to full installation of acoustic cover systems with built in silencers for cooling air flow. In the UK there are probably as many more companies that are not in this particular guide.
Many of the leaders in noise control are based in the building or architectural contracting, aircraft and car sectors, where there are not only legislative requirements to reduce noise levels, but pressure from the consumer requiring a quieter product or environment. Typically a company may specialize in one or two products, such as a heavy, limp mass barrier sheet and a composite of the same barrier sheet with an absorbent or soft “scrim” layer and a layer of aluminium foil. The former is marketed for use as roll-away curtains, and cross-talk barriers; the latter for pipe and duct lagging and for lining equipment enclosures.
Some companies specialize in “conversion” of open and closed cell foam. This may be combined in layers with barrier and damping sheets, for lining engine compartments, equipment enclosures or vehicle cabs. It may be formed into wedges for use in recording studios, or it may be covered, e.g. with cloth, and made into suspended units for wall panels or hanging baffles, for use in a wide range of rooms from auditoriums to manufacturing plant. Other suppliers specialize in the design and fabrication of enclosures, maybe with their own particular materials or components, but generally offering steel sheets on a framework, with absorbent lining, seals for openings, and sometimes optional vibration isolation.
19

3.4 COMPATIBILITY WITH AGRICULTURAL CONDITIONS
The most common type of noise control actually found on farms is the tractor Q-cab, available for all new tractors since 1976. Elements of the design and construction of these are obviously applicable to other self-propelled machines. A very suitable noise control material that is available on farms, at least for temporary use, is the straw bale. Bale stacks provide a combination of high transmission loss and broad-band absorption, and have been used successfully to enclose mobile, diesel-powered drying fans, and to reduce environmental nuisance for several decades. The drawbacks are that they suffer from degradation from weathering and vermin, and they are combustible. Such disadvantages also may apply to many of the materials and components that could be transferred from other industries, together with the adverse effect of other attributes of farm conditions, such as effluents which, although not strongly corrosive, do attack many materials over the medium to long term. Nevertheless, there are several examples in which industrial style enclosures, for either machine or operator, could be useful. These might include providing control rooms in large drying installations, or covers for engines or drive trains close to operator stations on some larger machines.
The handling of materials, such as produce impacting on chutes, is little different from similar situations in other industries, in which instances noise reductions can be made by attaching materials that provide panel damping and reduction of the efficiency of panels as radiators of sound. The use of porous acoustic absorbers could be limited by the fire risk, particularly in conditions in which they may attract dust, such as in drying and milling / mixing installations, and by the needs of hygiene in food processing areas. However, with suitable choice of cover materials now available, they could be useful in highly reverberant situations. They could also be useful in the large silencers needed for the high volume fans found in some installations.
There should be no problems in using industrial anti-vibration mounts, where appropriate, in farm conditions, and these are generally not expensive items. On the other hand, the cost and complexity of active cancellation systems places these beyond consideration for agricultural applications at their present stage of development.
3.5 SUMMARY OF RELEVANT TECHNIQUES
Techniques or strategies likely to be useful in combating operator noise exposure in on-farm conditions include the following:-
a) Noise enclosures for source or operator, including partial barriers or baffles; b) Refurbishment of cabs of mobile machines (including older tractors); c) Anti-vibration mounts in extensive machine structures; d) Vibration damping on panels, chutes etc;e) Reverberation control e.g. in processing halls, packing sheds; f) Pneumatic system design, components;g) Silencing for fans.
20

4 ASSESSMENT OF EXAMPLE NOISE PROBLEMS
4.1 GENERAL APPROACH
A number of work environments have been identified above for which daily noise exposures (LEP, d) have been estimated to exceed 85 dB(A). In the following sections, each of these is reviewed, initially to suggest a suitable approach to reducing operator noise exposure. Factors affecting the cost of the appropriate treatment, and the likely benefit are also discussed, with particular reference to technical feasibility, economic considerations and practicability in an onfarm situation. Each situation is also categorised according to whether the proposed solution is either one which is already familiar in the farm context, or whether it is familiar in other industries and could be applied in agriculture. A third category contains those examples for which no practical noise reduction solutions can be proposed, and for which the use of Personal Protective Equipment (PPE - Hearing Defenders) remains the only viable approach.
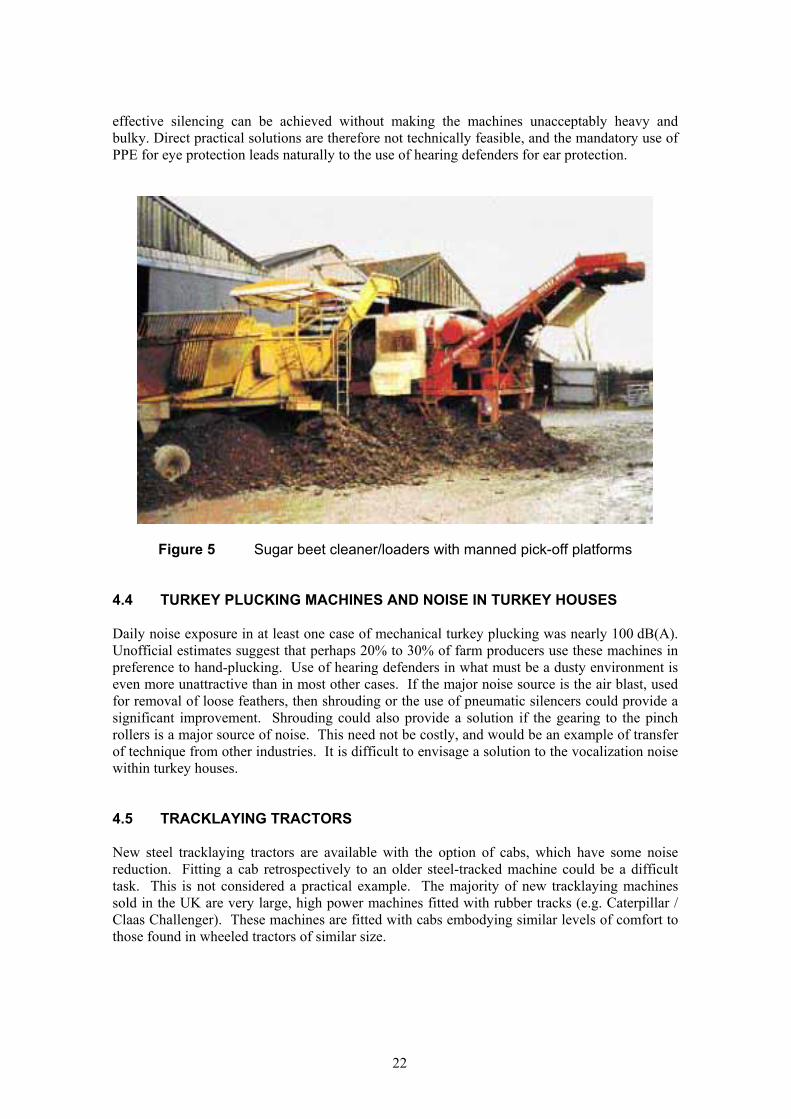
4.2 SUGAR BEET CLEANER / LOADERS AND POTATO HARVESTERS / GRADERS
Although these are apparently different machines, and include both stationary and mobile designs, the operating principles are similar, as are the noise sources. One particular example of sugar beet cleaner/loader (similar to those shown in Figure 5), generated enough noise for an operator LEP, d in excess of 100 dB(A) to be estimated, although levels of 88-91 dB(A) may be more usual (see Appendix 1). The main noise sources are the engine, which is usually a separate unit, distinct from the motive power for locomotion, and the conveyor flights and their drive mechanisms. The latter are believed to be the principal source in the noisiest example encountered during the 1985-87 survey.
Treatment for the engine noise can be by improved exhaust silencing, in conjunction with cover panels that provide better absorption and increase transmission loss over the basic elements usually provided. This follows the techniques used on mobile compressors, and may use similar materials. Treatment of particularly noisy conveyors and their drives may be more difficult. Substitution of materials, although initially attractive, may be impractical because of the highly abrasive conditions in which these machines sometimes have to operate. This leaves the possibility of baffles between the main sources and the operator positions. The practicality of this will depend on the layout of specific machines, and needs further investigation.
Both of these approaches could be applied using farm workshop facilities, as long as information was available on sourcing materials. The effectiveness cannot be predicted without further knowledge of the specific machines. The material costs would be small in comparison to the cost of the machines themselves, probably only a few hundred pounds at most. As indicated, both approaches can be categorized as transfer of expertise from other industries.
4.3 CHAINSAWS AND BRUSH-CUTTERS
These can generate sufficient noise for a daily exposure to approach, or even exceed 100 dB(A). The main source of noise is the two-stroke engine, and although electrically powered machines may be substituted in some locations, in most situations the portability and independence of engine-powered units is an overriding advantage. Neither alternative forms of engine, nor more
21
effective silencing can be achieved without making the machines unacceptably heavy and bulky. Direct practical solutions are therefore not technically feasible, and the mandatory use of PPE for eye protection leads naturally to the use of hearing defenders for ear protection.
Figure 5 Sugar beet cleaner/loaders with manned pick-off platforms
4.4 TURKEY PLUCKING MACHINES AND NOISE IN TURKEY HOUSES
Daily noise exposure in at least one case of mechanical turkey plucking was nearly 100 dB(A). Unofficial estimates suggest that perhaps 20% to 30% of farm producers use these machines in preference to hand-plucking. Use of hearing defenders in what must be a dusty environment is even more unattractive than in most other cases. If the major noise source is the air blast, used for removal of loose feathers, then shrouding or the use of pneumatic silencers could provide a significant improvement. Shrouding could also provide a solution if the gearing to the pinch rollers is a major source of noise. This need not be costly, and would be an example of transfer of technique from other industries. It is difficult to envisage a solution to the vocalization noise within turkey houses.
4.5 TRACKLAYING TRACTORS
New steel tracklaying tractors are available with the option of cabs, which have some noise reduction. Fitting a cab retrospectively to an older steel-tracked machine could be a difficult task. This is not considered a practical example. The majority of new tracklaying machines sold in the UK are very large, high power machines fitted with rubber tracks (e.g. Caterpillar / Claas Challenger). These machines are fitted with cabs embodying similar levels of comfort to those found in wheeled tractors of similar size.
22

4.6 AIR-BLAST (ORCHARD) SPRAYERS
These machines, illustrated in Figure 6, have been found with daily exposure as high as 97 dB(A). The dominant noise sources are the air blast nozzle and high speed fan blades. Two possible solutions suggest themselves for this type of equipment. The simpler is a basic noise baffle, mounted at a suitable point on the machine, to reduce direct radiation towards the operator. Of more technical interest is the design of the air-blast outlet for smoother airflow. With regard to technical feasibility, the former might be restricted by the low profile required for these machines to pass amongst tree rows, whereas the potential for the latter is an unknown quantity. Both solution would be relatively inexpensive, however, although the former should be relatively easy to construct on-farm, the latter requires technical development that would be well beyond the scope of a purely farming enterprise.
The use of a simple noise baffle is probably best categorized as being “imported” from other industries. However, experiment may show that it does not provide adequate protection, and in that case the use of PPE (Hearing Defenders) again provides the only realistic protection.
Figure 6 Tractor and air-blast orchard sprayer
23
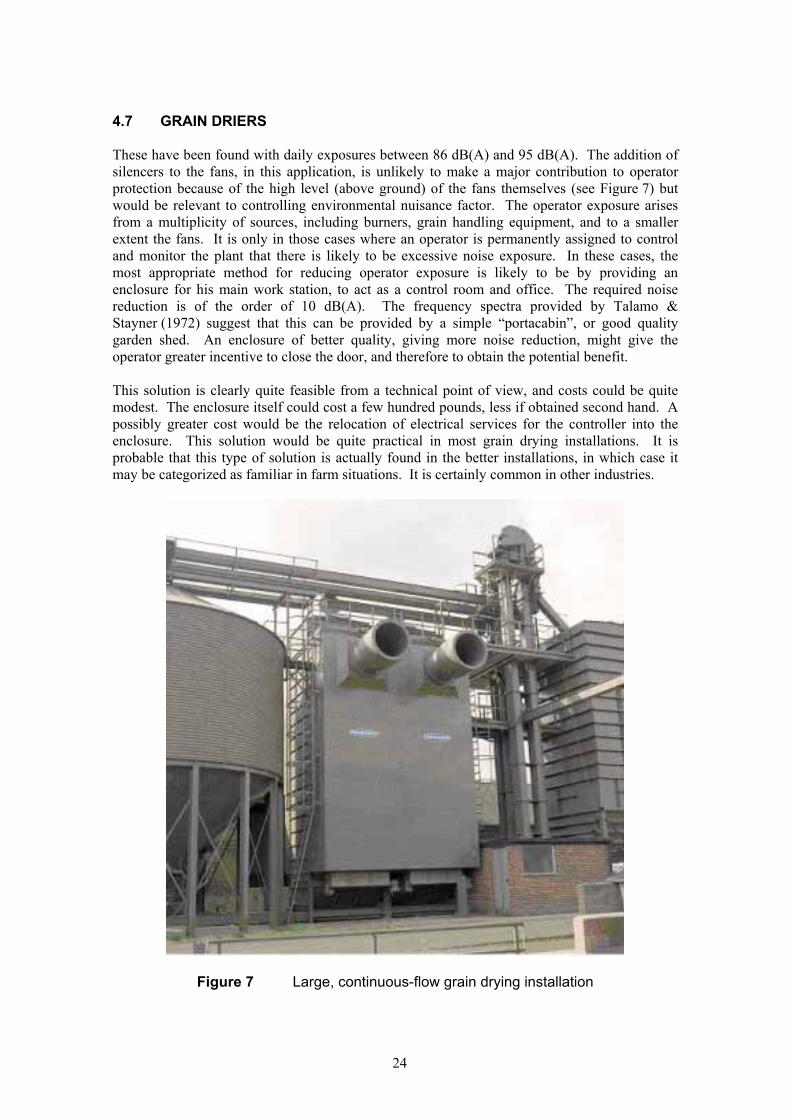
4.7 GRAIN DRIERS
These have been found with daily exposures between 86 dB(A) and 95 dB(A). The addition of silencers to the fans, in this application, is unlikely to make a major contribution to operator protection because of the high level (above ground) of the fans themselves (see Figure 7) but would be relevant to controlling environmental nuisance factor. The operator exposure arises from a multiplicity of sources, including burners, grain handling equipment, and to a smaller extent the fans. It is only in those cases where an operator is permanently assigned to control and monitor the plant that there is likely to be excessive noise exposure. In these cases, the most appropriate method for reducing operator exposure is likely to be by providing an enclosure for his main work station, to act as a control room and office. The required noise reduction is of the order of 10 dB(A). The frequency spectra provided by Talamo & Stayner (1972) suggest that this can be provided by a simple “portacabin”, or good quality garden shed. An enclosure of better quality, giving more noise reduction, might give the operator greater incentive to close the door, and therefore to obtain the potential benefit.
This solution is clearly quite feasible from a technical point of view, and costs could be quite modest. The enclosure itself could cost a few hundred pounds, less if obtained second hand. A possibly greater cost would be the relocation of electrical services for the controller into the enclosure. This solution would be quite practical in most grain drying installations. It is probable that this type of solution is actually found in the better installations, in which case it may be categorized as familiar in farm situations. It is certainly common in other industries.
Figure 7 Large, continuous-flow grain drying installation
24

4.8 ANIMAL FEED PREPARATION MACHINERY (MILLING / MIXING PLANT)
The basic elements of hammer mills and roller mills, as used for cracking and crushing cereal grains for farm animal feed, are inevitably sources of noise and, where workers have to be in the vicinity of such machines, daily exposures can be as high as 95 dB(A). The possibility of enclosing the machines is of limited application because of the potential risk of concentrating an combustible dust, but nonetheless may be worthy of consideration.
In general, there is no requirement for continuous, close supervision of these machines, which often run unattended for long periods. Therefore simple modifications such as removing switches and controls to positions that are shielded from direct noise radiation, can be used to reduce residual exposure. Also, if bagging-off is required, it should be possible to arrange for this to be done through a wall or other form of acoustic shield. These are techniques that should be practicable in the farm situation. In the case of large installations that do require continuous manning, the approach of an enclosure for the operator as for grain driers (see Section 4.7) should be contemplated.
4.9 MAN-CARRIED MACHINE – BLOWER DUSTER
In common with other portable powered machines where the power source is a light, 2-stroke internal combustion engine, there is little that can be done without rendering the machine impracticable. PPE is probably the best solution unless an alternative to the activity itself can be found.
4.10 HOP MACHINERY (PICKERS AND CLEANERS)
An example of these machines has been found that exposes the operator to an estimated LEP, d in excess of 93 dB(A) (see Appendix 1). It is understood that the main source of noise is the pneumatic conveying. This may be amenable to treatments by baffles or by modifying air nozzles to reduce noise from expansion or turbulence.
The potential noise reduction cannot be estimated without more detailed knowledge of the machines, but the techniques should be directly applicable from other industries, and should not involve large items of expenditure. In relation to reducing airflow noise directly, some research time may be needed to identify the relevant techniques and sources of materials or components used in other industries, but this investment would not affect the eventual on-farm costs.
4.11 TRACTOR PTO-POWERED MACHINERY
Forage harvesters are probably the noisiest machines to be used immediately behind tractors. Other potential candidates include disc mowers and power harrows. These do not pose any problem as long as the attached tractors are fitted with effective “Q-cabs” and are used with the rear windows closed. Historically, direct mechanical controls required that the rear window be open (see Figure 8), but modern practice is to use remote electric or hydraulic controls, and there is no need for this.
25

It may be that an instructive example could be made by showing the effect, on operator noise exposure, of closing the rear window when using these machines. Cost of “solution” would be nil, and the method is clearly both technically feasible and available on the farm. (See also Section 4.18: “cabs of mobile machines with inadequate or damaged acoustic materials” below).
Figure 8 Tractor PTO-powered trailed forage harvester with mechanical controls
4.12 VEGETABLE PACKING SHEDS
Vegetable packing sheds have provided estimates of operator LEP, d ranging from 85 dB(A) to 92 dB(A). The noise sources are potentially many and diffuse, and it is probable that individual exposures are raised by the effect of having a number of machines operating together within a large, reverberant building (see Figure 9). If this is the case, the solution is to apply techniques well-known in the manufacturing industry, involving location of individual machines (where practicable), introduction of noise screens, and application of absorbent material or panels, e.g. suspended in ceiling spaces, to reduce reverberant build-up. These methods would have to be tailored for specific enterprises, but would be both technically feasible and reasonably costeffective.
There is also a suggestion that air-blast selection and cleaning of some crops could raise the exposure levels at some work stations. If that is the case, the solution of localized baffles, together with aligning the nozzles away from operators may be practicable. It should be noted that noise from these devices can include very high pressure pulses. However, radiation from them can also be strongly directional, and therefore operator exposure can be controlled relatively easily.
26

In this case we have the possibility to transfer expertise from other industries that is technically feasible and inexpensive to realize.
Figure 9 Potato grading / packing hall
4.13 SELF-PROPELLED MACHINERY: SPRAYER / DIGGER / DUMPER
This case is thought to have been dominated by a dumper, which is outside the present area of interest, being essentially an earthmoving machine.
4.14 WORKSHOP ANGLE GRINDER
This is considered to be a tool for which PPE, in the form of eye protection is essential, and for which ear defenders would be the best available solution at present.
27

4.15 WOOD CHIPPERS
We do not have LEP, d values for wood chippers, but operator’s ear noise can reach 120 dB(A) when operating. The main noise source is the chipping action itself, magnified by resonance of the enclosing panels. It is not clear what proportions are directly radiated from the feed opening and what from panel radiation. However, assuming the latter is the more important, there is potentially some benefit to be had from the application of damping material to the exterior of the panels, possibly enhanced by a second, outer layer of steel sheet to provide “constrained layer” damping.
Material costs would be low, and the method could be applied on the farm. However, the effective noise reduction is unlikely to be sufficient to bring operator LEP, d below 85 dB(A). In that case PPE (Hearing Defenders) would be the necessary solution. The damping method could be categorized as applying an approach from other industries, but it may be that we cannot propose a full practical solution.
4.16 MOBILE SAW-BENCHES
Noise levels at the operator’s ear for these machines range from 92 dB(A) for electrically powered units, to 100 dB(A) for diesel powered units. These are Leq values during typical work cycles. There are therefore two main sources for the diesel machines, only one of which is relevant in the case of the electrically powered units. These are (1) the radiation from the saw blade itself, and (2) diesel engine noise, itself made up of exhaust noise and combustion noise radiated directly from the engine structure.
The solution of a hinged hood to cover the blade has a value that is limited by the need for access to feed the material, which is generally logs that may be fed longitudinally (for splitting) or transversely (for cutting to length). In either case, the hood would remain open in the direction of the operator. The diesel type of unit could be replaced in workplaces with electrical supply, but would still be required for operations at more remote sites, common in forestry, and not uncommon on farms. Improved exhaust silencing and acoustic panel covers could probably bring the operator ear noise level down to approximate to that of the electric machines. However, there would remain a requirement for hearing defenders, and as PPE is required for these machines in any case (face masks or eye protection), it is not clear that a direct solution is feasible.
4.17 PIG HUSBANDRY
Pig feeding is almost unique in farming operations, being one in which very short exposures only once or twice a day can lead to LEP, d values of 90 dB(A). The source, although being the vocal chords of the pigs themselves, is in fact set off by the arrival of the human presence. The solution, proposed 30 years ago (Talamo, private communication) was to provide feeding by mechanical delivery. Whether this should be ad-lib or to a timed programme is a matter for animal husbandry. The solution is technically feasible, and uses techniques well-known in farming. Its economic feasibility depends on considerations of animal husbandry. There is a strong possibility that there are examples of what we would propose already in existence on many farms, so the exercise would simply be one of measurement on two farms with different systems.
28
The exposure component that is associated with the use of pressure washers can possibly be reduced by converting to plumbed systems, instead of mobile units. This could also be tested by finding farms currently using each system. However, with extensive pig units becoming more common, the option of plumbed systems may not be widely applicable.
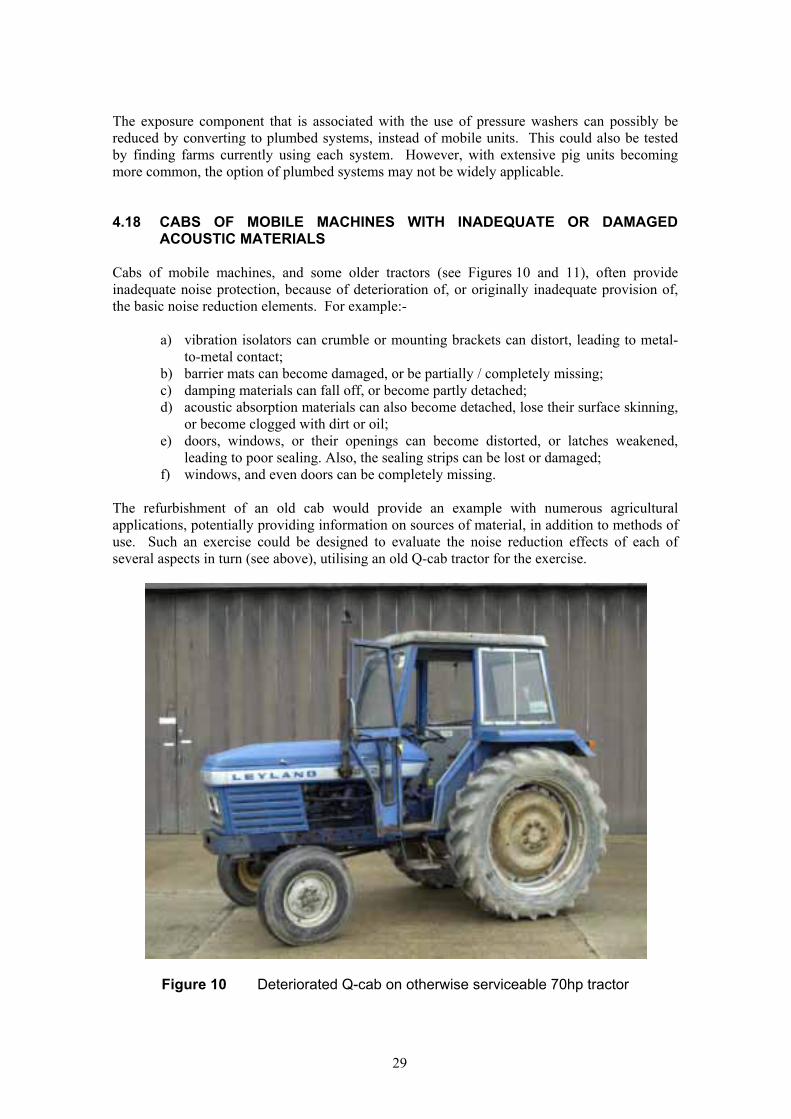
4.18 CABS OF MOBILE MACHINES WITH INADEQUATE OR DAMAGED ACOUSTIC MATERIALS
Cabs of mobile machines, and some older tractors (see Figures 10 and 11), often provide inadequate noise protection, because of deterioration of, or originally inadequate provision of, the basic noise reduction elements. For example:-
a) vibration isolators can crumble or mounting brackets can distort, leading to metal-to-metal contact;
b) barrier mats can become damaged, or be partially / completely missing; c) damping materials can fall off, or become partly detached; d) acoustic absorption materials can also become detached, lose their surface skinning,
or become clogged with dirt or oil; e) doors, windows, or their openings can become distorted, or latches weakened,
leading to poor sealing. Also, the sealing strips can be lost or damaged; f) windows, and even doors can be completely missing.
The refurbishment of an old cab would provide an example with numerous agricultural applications, potentially providing information on sources of material, in addition to methods of use. Such an exercise could be designed to evaluate the noise reduction effects of each of several aspects in turn (see above), utilising an old Q-cab tractor for the exercise.
Figure 10 Deteriorated Q-cab on otherwise serviceable 70hp tractor
29
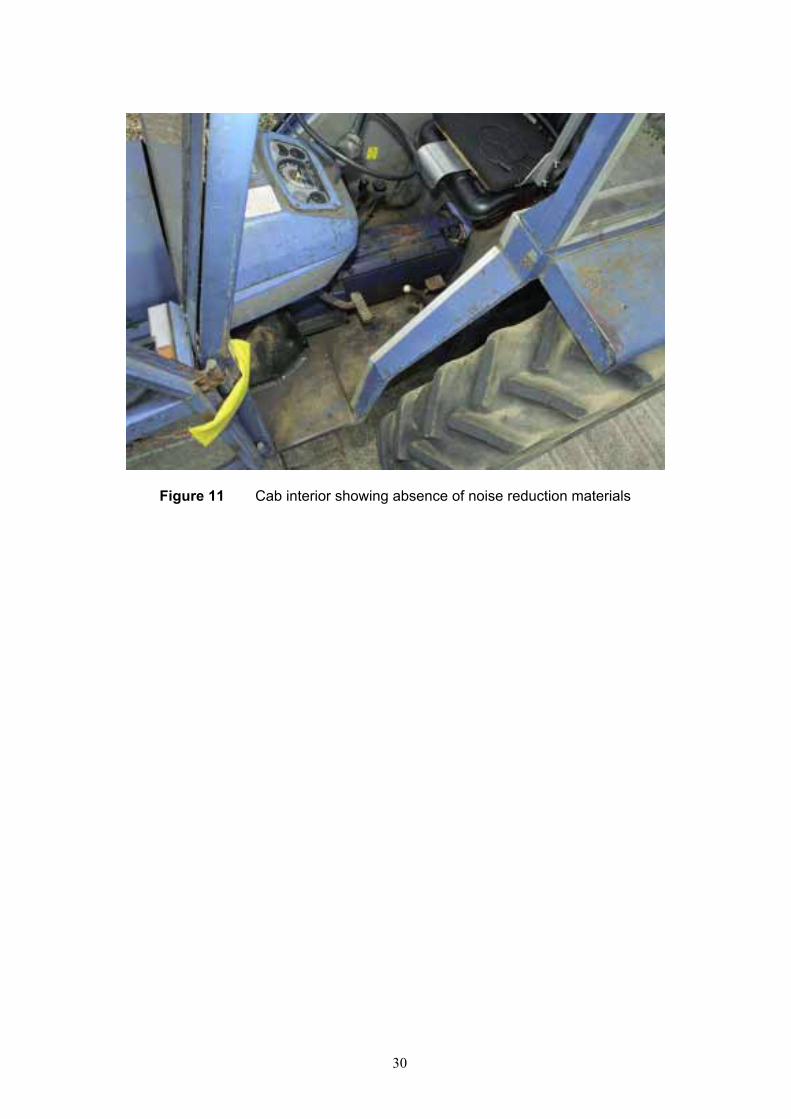
Figure 11 Cab interior showing absence of noise reduction materials
30

5 NOISE REDUCTION CASE STUDIES
Following consideration of the 17 different examples discussed in Section 4, and consultation with HSE Project Officers, 7 of the examples, deemed the most widely applicable, were selected for practical on-farm demonstration of noise reduction techniques:
1) Farm-scale potato pre-cleaning / grading line: Masking of driving gear (and possibly power unit) noise at operators’ position;
2) Grain drier: Example of noise enclosure for operator’s work area;
3) Animal feed preparation machinery (milling / mixing): Relocation of controls so that the operator does not need to approach the noisy parts of the installation, or acoustic isolation of the latter;
4) Tractor (PTO)-powered machine: This would be a demonstration of the need to keep cab windows closed (and maintain sealing & glazing integrity). One example would cover a wide range of tractor (PTO)-powered equipment;
5) Vegetable packing shed: This could be an example of several techniques:-o reduction of reverberation, with suspended absorbent panels; o partial enclosure or shielding of noisy conveyor drives;o optimizing layout of workplaces and noise sources; o shielding or silencing of air-blast nozzles;
6) Animal vocalisation during feeding: As the noise source (animals) cannot easily be modified or enclosed this case study would investigate the noise levels / daily noise dose of stockmen working on two similar livestock enterprises, one using manual feeding and one with an automatic feeding system;
7) Cabs of mobile machines with inadequate or damaged acoustic materials: A controlled study of the effect of each of 6 components (e.g. replacement of degraded / missing noise reduction materials, cab sealing, anti-vibration mountings, etc).
In accordance with the original investigation proposal, each example was investigated by application of the following methodology:-
1) Location and initial inspection of the (on-farm) noise problem;2) Detailed measurement of pertinent noise levels prior to treatment, including calculation
of worker maximum daily exposure time in accordance with EU PA(N)D; 3) Proposal and selection of an appropriate noise reduction solution; 4) Practical implementation (by SRI personnel), or supervision of implementation (by farm
staff), of chosen noise reduction method; 5) Detailed measurement of pertinent noise levels post-treatment, including calculation of
revised maximum daily exposure time; 6) Detailed documentation and reporting of the noise problem, the treatment applied, and
the degree of success achieved.
31

As detailed in the following Sections all of the on-farm examples located, apart from the Farmscale potato grading line, displayed noise levels above the action value(s) prior to treatment. As no examples of excessively noisy potato grading lines were located, after extensive investigation, no case study was able to be undertaken for this example.
Two case studies were undertaken as part of the Animal feed preparation machinery example, as two individual noise sources were located within the same farm building, both of which were above the noise limit value.
Noise spectra were also recorded for each of the case studies and these are given in Appendix 2.
32
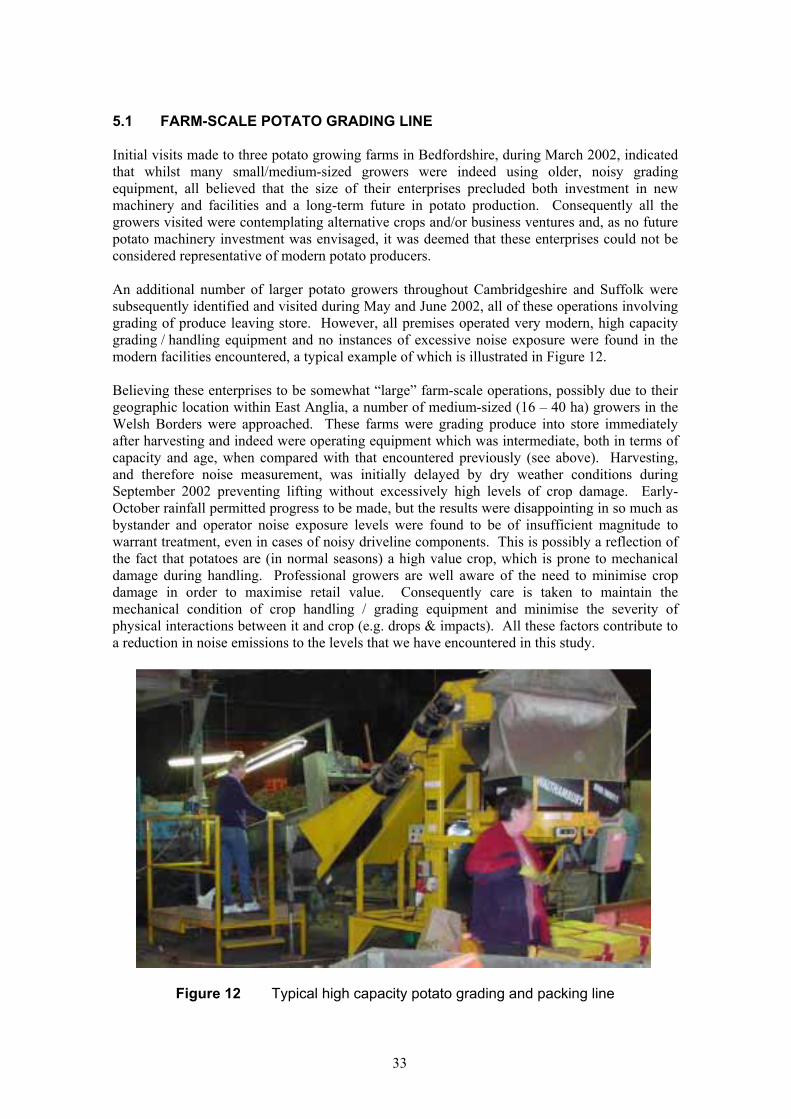
5.1 FARM-SCALE POTATO GRADING LINE
Initial visits made to three potato growing farms in Bedfordshire, during March 2002, indicated that whilst many small/medium-sized growers were indeed using older, noisy grading equipment, all believed that the size of their enterprises precluded both investment in new machinery and facilities and a long-term future in potato production. Consequently all the growers visited were contemplating alternative crops and/or business ventures and, as no future potato machinery investment was envisaged, it was deemed that these enterprises could not be considered representative of modern potato producers.
An additional number of larger potato growers throughout Cambridgeshire and Suffolk were subsequently identified and visited during May and June 2002, all of these operations involving grading of produce leaving store. However, all premises operated very modern, high capacity grading / handling equipment and no instances of excessive noise exposure were found in the modern facilities encountered, a typical example of which is illustrated in Figure 12.
Believing these enterprises to be somewhat “large” farm-scale operations, possibly due to their geographic location within East Anglia, a number of medium-sized (16 – 40 ha) growers in the Welsh Borders were approached. These farms were grading produce into store immediately after harvesting and indeed were operating equipment which was intermediate, both in terms of capacity and age, when compared with that encountered previously (see above). Harvesting, and therefore noise measurement, was initially delayed by dry weather conditions during September 2002 preventing lifting without excessively high levels of crop damage. Early-October rainfall permitted progress to be made, but the results were disappointing in so much as bystander and operator noise exposure levels were found to be of insufficient magnitude to warrant treatment, even in cases of noisy driveline components. This is possibly a reflection of the fact that potatoes are (in normal seasons) a high value crop, which is prone to mechanical damage during handling. Professional growers are well aware of the need to minimise crop damage in order to maximise retail value. Consequently care is taken to maintain the mechanical condition of crop handling / grading equipment and minimise the severity of physical interactions between it and crop (e.g. drops & impacts). All these factors contribute to a reduction in noise emissions to the levels that we have encountered in this study.
Figure 12 Typical high capacity potato grading and packing line
33

5.2 GRAIN DRIERS
5.2.1 Introduction
Following visits to four farm enterprises operating continuous flow grain drying systems, one farm was selected, approached, and was prepared to be the subject of a case study. Initial operational noise levels were recorded, albeit without the presence of crop, and potential staff noise exposure levels calculated from known on-site working practices. A package of noise reduction measures was subsequently proposed and accepted by the farm owner.
With the possible exception of very modern, automated plants, on-farm continuous flow grain drying installations usually require the permanent presence of an operator, if only to identify and rectify system malfunctions. The same person would normally also monitor and record the delivery of grain to the installation. Principal sources of noise in such situations include the drier burner units, associated grain handling equipment (elevators, conveyors, augers) and, to a smaller extent, the drier fan(s). A popular means of operator noise protection is the provision of an operator cabin, to act as an office and work station, frequently sited within the building which contains the drier. This primitive solution can in fact be a very effective method of reducing operator noise exposure.
A form of operator cabin was indeed present at the case study farm, but its acoustic effectiveness was severely reduced due to the absence of a suitable door. This was due to a combination of practical limitations and the personal preference of the drier operator / farm owner, but, upon further investigation, the issues restricting implementation of a noise reduction solution were identified and suitable solutions found. The main restriction was the drier operator’s desire to identify system problems, audibly from his work station / office - hence the absence of a door on the cabin. The most frequently occurring problem was excessive supply of grain to the drier, an occurrence identified by the flow of excess grain back to the reception hopper via an overflow duct. This grain flow could be heard by the operator, thereby prompting remedial action. The problem was solved by installation of a simple microphone / loudspeaker system between the grain overflow duct and the operator workstation. The acoustic (noise reduction) effectiveness of the operator cabin was subsequently improved by additional sealing and provision of a door, reducing interior noise levels and operator noise exposure. This solution operated effectively throughout the 2002 Harvest.
34
5.2.2 CASE STUDY: Continuous flow grain drier
Installation details Location: Bedfordshire
Business details: 2000 ha arable farm
Target machine: Continuous flow grain drier
Noise source / level
In common with many of material handling installations, continuous flow grain driers have a number of noise sources. The principal sources in this case included the drier burner units, associated grain handling equipment (elevators, conveyors, augers) and, to a smaller extent, the drier fan(s). The ambient noise level with the drier running was recorded at 82 dB(A). As the operator typically worked a 14 hour shift during the harvest season this noise level related to LEP, d of 84 dB(A)
Possible Noise Reduction Solutions
An operator booth was already in existence as part of this installation, to provide a protected environment for the operator. However, no door was fitted, greatly reducing the noise reduction within the control booth. The door was absent as the operator preferred to hear certain changes in the drier running noise, which would indicate a blockage or overload in the drier. The proposed solution for this situation was to install a door in the operator booth and provide some other means of identifying blockages / overloads. Fitting a door to the booth also had the added advantage of minimising dust ingress into the main operator work area.
Three methods were proposed as detailed below:
Option Advantages Disadvantages
Mechanical overflow sensor Robust Difficult to install Probably exceed £500 budget
CC tv camera monitoring Could be easily expanded Relatively complicated overflow to cover other areas solution
Probably exceed £500 budget Would require constant visual monitoring
Microphone and Relatively robust amplifier / loudspeaker Non obtrusive to original machinery Simple installation
Audible warning enables operator to multitask
The microphone and amplifier / loudspeaker was selected as the most appropriate system
35

_____________________________________________________________________________
_____________________________________________________________________________________
_____________________________________________________________________________
Construction / Installation
The sound system, illustrated in Figure 13, was constructed from component parts by SRI Instrumentation Department (similar specification proprietary units and screened signal cable can be obtained from numerous electronic / electrical suppliers). The microphone was encased in a plastic box to protect it from dust and the box was fitted with a metal mounting bracket. This was then screwed to a wooden partition, adjacent to the drier overflow pipe, leaving approximately 5 mm clearance between the microphone and the overflow pipe (see Figure 13). The signal cable was then securely routed back to the control booth where it connected to the amplifier / loud speaker unit. The control booth door was installed by farm staff, who also relocated a light which had been previously fitted across the control booth access, as shown in Figure 14.
Figure 13 Sound system components (left) and microphone mounting position (right)
Results
The noise measurements taken before and after the control booth door was fitted, are given in Table 3. As previously stated 14 hour shifts were not uncommon and so LEP, d are also given. As can be seen the selected solution was beneficial with an 6 dB(A) reduction in the noise level inside the operator control booth.
Table 3 Operator noise levels
Measurement Control booth Control booth / Condition without door with door fitted
Leq (dB(A)) 82 76
LEP, d (dB(A)) 84 78
36

Figure 14 Control booth access without door (left) and with door fitted (right)
37

5.3 ANIMAL FEED PREPARATION MACHINERY
5.3.1 Introduction
Initial fact-finding visits were undertaken to three farm enterprises, from which one was identified as being a suitable case study for further treatment. This enterprise, a large mixed farm incorporating a dedicated pig unit, utilised an electrically-powered hammer mill and a separate electrically-powered cubing machine to produce its own animal feedstuffs (see Figure 15).
Figure 15 General view of animal feed preparation building with hammer mill shown in the foreground
A number of visits were made to the farm to determine existing noise emission and exposure levels, the latter being dependent upon working practices / patterns. A number of potential noise reduction treatments were proposed for both the hammer mill and the cuber, these being considered as two separate case studies despite their common location. Whilst different solutions were initially proposed for these examples, cost and complexity of installation restricted the range of available options. Consequently noise reduction enclosures, made from plywood lined with acoustic foam, were constructed for both machines. These items, detailed in the relevant case studies, were constructed and installed, and have been in daily use on the farm in question since September 2002.
38
5.3.2 CASE STUDY: Animal feed preparation machinery (hammer mill)
Installation details Location: Feed preparation building Business details: Large arable / pig farm Target machine: Hammer mill used for the preparation of animal feeds
Noise source / level
The electrically-driven hammer mill had no anti-vibration mounts or sound absorption cladding with the result that, with the machine was running, noise levels of 93 & 88 dB(A) were recorded at 1.2 m & 4.6 m distance respectively.
Possible Noise Reduction Solutions
As pedestrian access was required to the sides of this location and access to the hammer mill was also required for regular servicing / maintenance, only one design was considered suitable:
Option Advantages Disadvantages:
Close fitting enclosure Easy to build Air vent required for motor Self standing cooling and dust expulsion Could be built away from site
Relatively inexpensive Simple construction materials
Construction / Installation
The enclosure was constructed from a frame built from 50 x 50 mm wooden battens and clad in 19 mm plywood sheeting, glued and screwed together. The enclosure was designed to be self standing and allowed a minimum gap of 100 mm between the motor and the internal surfaces. Air vents were left at the front and rear (motor end) of the enclosure to ensure an air flow over the motor, with a stepped-baffle fitted to the rear air vent to minimise any noise seepage. The enclosure was assembled at SRI with an estimated materials cost of £40. The only adjustments that had to be made on site during installation was the addition of a clearance hole to the bottom of the sliding door for the electricity supply and a clearance hole for the ducting running up the grain input pipe.
It was intended to glue acoustic foam lining (25 mm thick acoustic poly-urethane (P.U.) foam, fire-retardant grade, with PVC skin) inside the enclosure, approximate cost £30, but this was delayed until after the initial installation. This enabled comparative noise levels to be recorded both with and without the addition of a foam layer inside the enclosure, as detailed below in Table 4. The foam was simply cut to fit with a Stanley knife and glued with aerosol spray adhesive to the inside of the plywood cladding.
Alternative sound absorption materials, such as rockwool or fibreglass, could be used instead of the PU foam. However, the thickness of the sound absorption material, and therefore the enclosure dimensions, may have to be increased to achieve the same level of attenuation.
39

_____________________________________________________________________________
_____________________________________________________________________________________
_____________________________________________________________________________
Results
The noise measurements taken before and after the enclosure was fitted, as illustrated in Figure 16, are detailed in Table 4. As can be seen the selected solution was beneficial with an 8 dB(A) reduction in the bystander noise levels
Figure 16 Hammer mill installation, before (left) and after (right) noise reduction treatment
Table 4 Bystander noise levels
Distance from Initial level Enclosure without Final enclosure hammer mill (m) (dB(A)) PU foam (dB(A)) with PU foam (dB(A))
1.2 93 87 85 4.6 88 84 80
40
5.3.3 CASE STUDY: Animal feed preparation machinery (cuber)
Installation details Location: Feed preparation building Business details: Large arable / pig farm Target machine: Lister cuber used for the preparation of animal feeds
Noise source / level
The electrically-driven cuber was mounted on an RSJ steel frame to give clearance for a discharge chute. Neither the machine chassis or the RSJ frame had anti-vibration mounts and no sound absorption cladding was evident, with the result that, the operational machine produced noise levels up to 92 dB(A).
Possible Noise Reduction Solutions
Any proposed solution for this machine had to enable good access as the die inside the cuber required regular maintenance. Access to the drive belts and operating lever, on the side of the cuber, was also required and no restriction to the cuber overflow flap would be allowed. Three solutions were proposed as detailed below:
Option Advantages Disadvantages:
Flexible PVC Curtain Easy to fit Exceeded £500 budget Good sound reduction
Non-obtrusive
Erect partition & door Simple design Significant construction time Simple construction materials Probably exceed £500 budget
Permanent fixture less attractive to owner Dust trap
Close fitting enclosure Relatively easy to build Must be fully removable Simple construction materials Adequate ventilation required
Relatively inexpensive Could be built away from site
The close fitting enclosure was selected as the most cost effective solution.
Construction / Installation
To provide the required access to the cuber, the enclosure was constructed in two sections, each mounted on a common support frame (built from 100 x 100 mm wooden battens). The enclosure sections each consisted of a frame built from 25 x 50 mm & 25 x 75 mm wooden battens, clad in 19 mm plywood sheeting, glued and screwed together. Steel brackets were screwed to the frames to provide additional rigidity and an acoustic foam lining was glued to the inside of the plywood to enhance the noise reduction. The enclosure was assembled at SRI with an estimated materials cost of £120.
41

_____________________________________________________________________________
_____________________________________________________________________________________
_____________________________________________________________________________
The original design had allowed for both enclosure sections to hinge from the support frame to gain full access to the cuber. However, upon first fitting, it was discovered that left hand side opening was restricted by colliding with an adjacent auger, so the design was modified with the LHS altered to a lift off section, located by dowels and over-centre catches.
Results
The noise measurements taken before and after the enclosure was fitted, as illustrated in Figure 17, are detailed in Table 5. As can be seen the selected solution was beneficial with a 5 8 dB(A) reduction in the bystander noise levels.
Figure 17 Animal feed cubing machine installation, before (left) and after (right) noise reduction treatment (noise reduction enclosure shown open for machine maintenance)
Table 5 Bystander noise levels
Measurement Initial level With enclosure fitted Position / Condition (dB(A)) (dB(A))
1.8 m from cuber 89 82 At power controls on wall 92 84 Normal work area 85 80
42
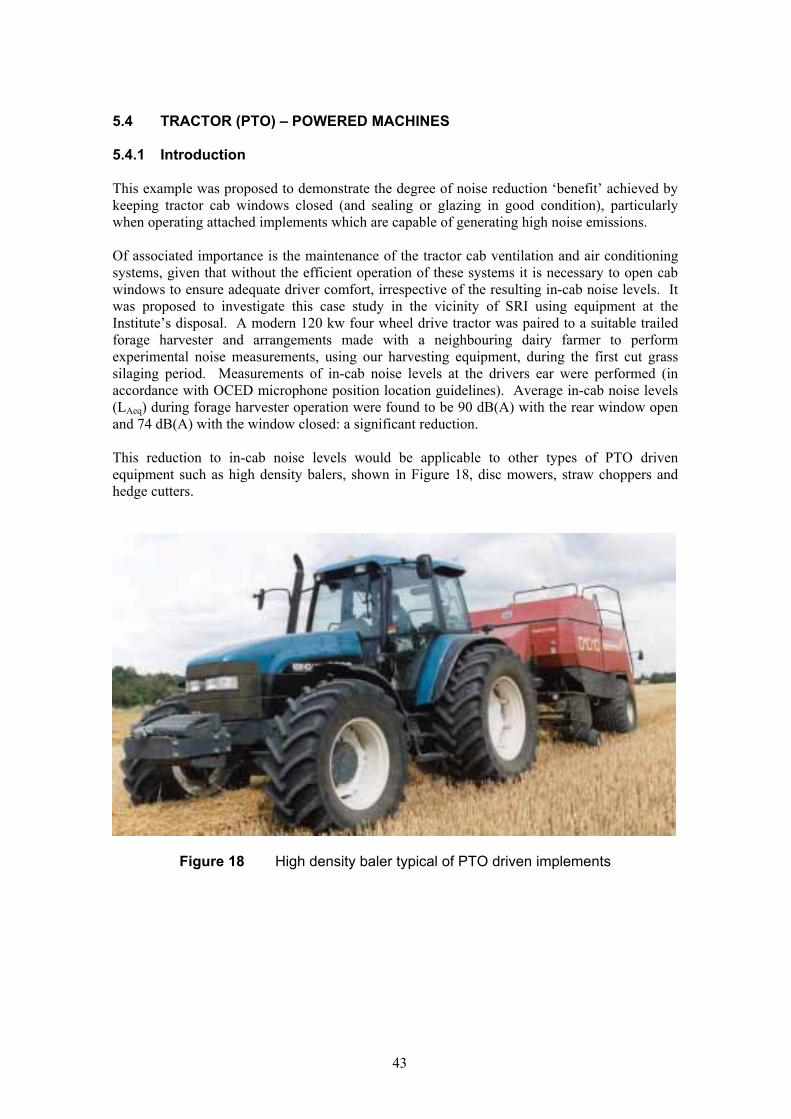
5.4 TRACTOR (PTO) – POWERED MACHINES
5.4.1 Introduction
This example was proposed to demonstrate the degree of noise reduction ‘benefit’ achieved by keeping tractor cab windows closed (and sealing or glazing in good condition), particularly when operating attached implements which are capable of generating high noise emissions.
Of associated importance is the maintenance of the tractor cab ventilation and air conditioning systems, given that without the efficient operation of these systems it is necessary to open cab windows to ensure adequate driver comfort, irrespective of the resulting in-cab noise levels. It was proposed to investigate this case study in the vicinity of SRI using equipment at the Institute’s disposal. A modern 120 kw four wheel drive tractor was paired to a suitable trailed forage harvester and arrangements made with a neighbouring dairy farmer to perform experimental noise measurements, using our harvesting equipment, during the first cut grass silaging period. Measurements of in-cab noise levels at the drivers ear were performed (in accordance with OCED microphone position location guidelines). Average in-cab noise levels (LAeq) during forage harvester operation were found to be 90 dB(A) with the rear window open and 74 dB(A) with the window closed: a significant reduction.
This reduction to in-cab noise levels would be applicable to other types of PTO driven equipment such as high density balers, shown in Figure 18, disc mowers, straw choppers and hedge cutters.
Figure 18 High density baler typical of PTO driven implements
43

_____________________________________________________________________________
_____________________________________________________________________________________
_____________________________________________________________________________
5.4.2 CASE STUDY: Tractor and trailed forage harvester
Installation details Location: Bedfordshire
Business details: Large dairy / arable farm
Target machine: Tractor & trailed forage harvester
Noise source / level
A number of PTO driven implements are relatively loud noise sources, with the trailed forage harvester typical of this type of implement. The combination of high speed rotating components and high throughput of crop material resulted in an average recorded noise level of 90 dB(A), recorded in-cab at the operators ear with the tractor rear window open.
Possible Noise Reduction Solutions
In this case the simple solution was to close the windows of the tractor cab. However, for this to be effective in practice, the windows / doors must be undamaged and correctly fitted (see Section 5.7) and there must be sufficient ventilation / air conditioning to ensure driver comfort when the windows are closed. This solution would not be possible where the PTO driven implement was fitted with mechanical controls accessed through the rear window of the cab, however, modern practice is to use remote electric or hydraulic controls, limiting this practice to relatively few items of older or less noisy equipment.
Results
The noise measurement taken with the cab rear window open and closed, as illustrated in Figure 19, are detailed in Table 6. As can be seen the act of closing the window was highly beneficial with a 16 dB(A) reduction in the operator noise level. This type of field operation is often undertaken over relatively long working shifts and so estimated daily exposures for 10 & 12 hour periods are also given.
Table 6 Operator noise levels
Measurement Window open Window closed Position / Condition (dB(A)) (dB(A))
Drivers ear 90 74
LEP, d (10 hour shift) 91 75
LEP, d (12 hour shift) 92 76
44

Figure 19 Tractor (with rear window open), trailed forage harvester and trailer
45

5.5 FARM-SCALE VEGETABLE HANDLING / PROCESSING LINE
5.5.1 Introduction
Following fact-finding visits to three enterprises, a farm business, which specialises in the production of onions and shallots, was approached and subsequently agreed to participating in the investigation. Noise levels in the vicinity of the main cleaning / grading line (see Figure 20), which runs throughout the year and requires 4-5 workers to operate it, were a concern to the owner. To this end, at the time of our initial visit, the current grading line was about to be renewed and its intended replacement was to incorporate a number of noise reduction measures.
In this instance the main source of noise was a vibratory pre-cleaning system, which feeds crop onto the grading line. The grading line operators could not be protected from this noise source by a personnel enclosure because forklift access is required to remove produce from the line. Consequently, enclosure of the noise source was preferable. This had been previously attempted to a degree, by use of lightweight curtains and plywood partitioning - illustrated in Figure 20, but it was acknowledged that this solution was inadequate. The proposed new system incorporated revision of the pre-cleaning system to permit much more complete enclosure using acoustically-effective materials (see Figure 21). In other parts of the plant, specific operator stations were provided with dedicated enclosures for protection against both ambient noise and temperature levels (see Figure 22).
Consequently, prior to system renewal, noise levels and frequency spectra were recorded during system operation at all operator stations, to enable both likely noise sources and daily noise exposure levels to be determined. Following installation of the new system we returned to the site, documented the system modifications and recorded appropriate noise levels and frequency spectra during grading line operation, thereby permitting assessment of the effectiveness of the noise reduction measures utilised.
Figure 20 Farm-scale vegetable handling / processing line
46

5.5.2 CASE STUDY: Onion grading line
Installation details Location: Grading line facility Business details: Large arable farm & vegetable pre-packing enterprise Target machine: Onion / shallot cleaner grader
Noise source / level
The main source of noise on the original grading line was a vibratory pre-cleaning system, which feeds crop onto the grading line. Noise measurements, with the existing noise enclosure (curtain) in place, showed that the operators were exposed to noise levels between 84 – 87 dB(A) depending on their position within the facility.
Possible Noise Reduction Solutions
The owner was already concerned about these noise levels and was in the process of specifying an upgraded onion grading line and an enclosure for the precleaning system. Advice on the materials and construction of the new enclosure was given to ensure the enclosure was separated from the noise generating machinery and panel reverberation was minimised. The investigation team then recorded the operator noise levels before and after the installation of the enclosure.
Results
The noise measurement taken before and after the new enclosures were fitted, as illustrated in Figures 21 & 22, are detailed in Table 7.
Figure 21 Old (left) and new (right) sound enclosures on onion grading line
47
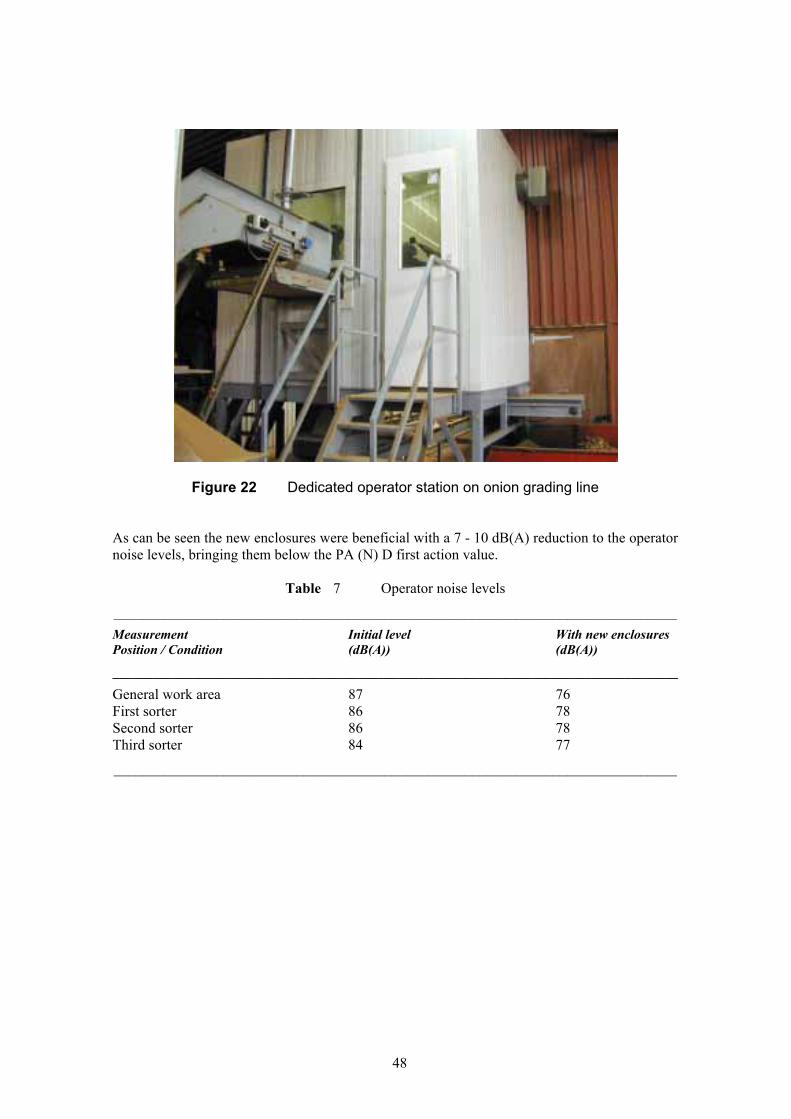
_____________________________________________________________________________
_____________________________________________________________________________________
_____________________________________________________________________________
Figure 22 Dedicated operator station on onion grading line
As can be seen the new enclosures were beneficial with a 7 - 10 dB(A) reduction to the operator noise levels, bringing them below the PA (N) D first action value.
Table 7 Operator noise levels
Measurement Initial level With new enclosures Position / Condition (dB(A)) (dB(A))
General work area 87 76 First sorter 86 78 Second sorter 86 78 Third sorter 84 77
48

5.6 ANIMAL VOCALISATION DURING FEEDING
5.6.1 Introduction
Worker noise exposure as a result of pig vocalisation immediately before and during feeding is a well-recognised problem. Fact-finding visits, made to two modern pig breeding and fattening enterprises, confirmed that high noise levels do indeed exist. However, the principal issue is the duration over which staff are subjected to these noise levels during the working day and the resultant daily noise exposure (LEP, d) they receive. This is frequently dependent upon the size of the enterprise (i.e. number of pigs to be fed / inspected), the relative proportion of manual and automatic feeding systems in use (i.e. the requirement for worker presence during feeding operations), and the proportion of other, quieter, non-feeding activities, which each worker performs during each day. To take account of this potential for significant variation, it was necessary to record the noise exposure received by individual workers, rather than the noise levels present at specific locations on a given farm.
A large farm-based pig rearing business in Suffolk was approached, primarily because certain of their sites utilise both automatic and manually-operated feeding systems. A suitable site was selected and ambient noise levels recorded during feeding operations in pig buildings incorporating either manual or automatic feeding systems. Additionally, the noise exposure received by the individual workers responsible for these specific buildings, during the course of a working shift, was determined by provision of personal noise dosemeters (see Figure 23). This enabled direct comparison between the feeding systems employed and resultant worker noise exposure.
Figure 23 Personal noise dosemeter worn during working period
49

5.6.2 CASE STUDY: Pig finishing unit
Installation details Location: Suffolk Business details: Intensive pig enterprise Target operation: Daily noise dose received by pig stockmen
Noise source / level
The noise source (pigs) cannot easily be modified or enclosed so this case study investigated the ambient noise levels recorded during feeding operations when the pigs were generally loudest. This was undertaken in pig buildings incorporating both manual and automatic feeding systems. Additionally, as the noise exposure received by the individual stockmen, responsible for these specific buildings, would vary depending on the proportion of time spent on each task, they were therefore provided with a personal noise dosemeters for the duration of a working shift.
The histories from these dosemeters showed that the stockman involved in manual feeding spent 6 hours in the houses, and that levels during the first feed of the day averaged about 100dB(A) (LEP, d 93 dB(A)). The stockman in charge of the automatically fed pigs was also in the houses during the first feed of the day, although his exposure then was about 5 dB lower. Later in the day, levels in both types of house varied between 80 dB(A) and 90 dB(A).
Possible noise reduction solutions
In this case the solution would be to change working practice or the feeding system to minimise the time spent by each worker inside the pig units, especially during noisy periods. It is clearly an important part of a stockman’s duties to observe and monitor each animal’s behaviour and condition. However, if more feeding could be automated, as illustrated in Figure 24, and the stockmen discouraged from entering the houses during the first feed of the day, then daily noise exposure could be reduced by 6 to 8 dB(A), to 85-87 dB(A). Although this level is significantly lower, where it exceeds the Second Action Level hearing protection would be required.
Figure 24 Manual (left) and automatic (right) feeding systems
50
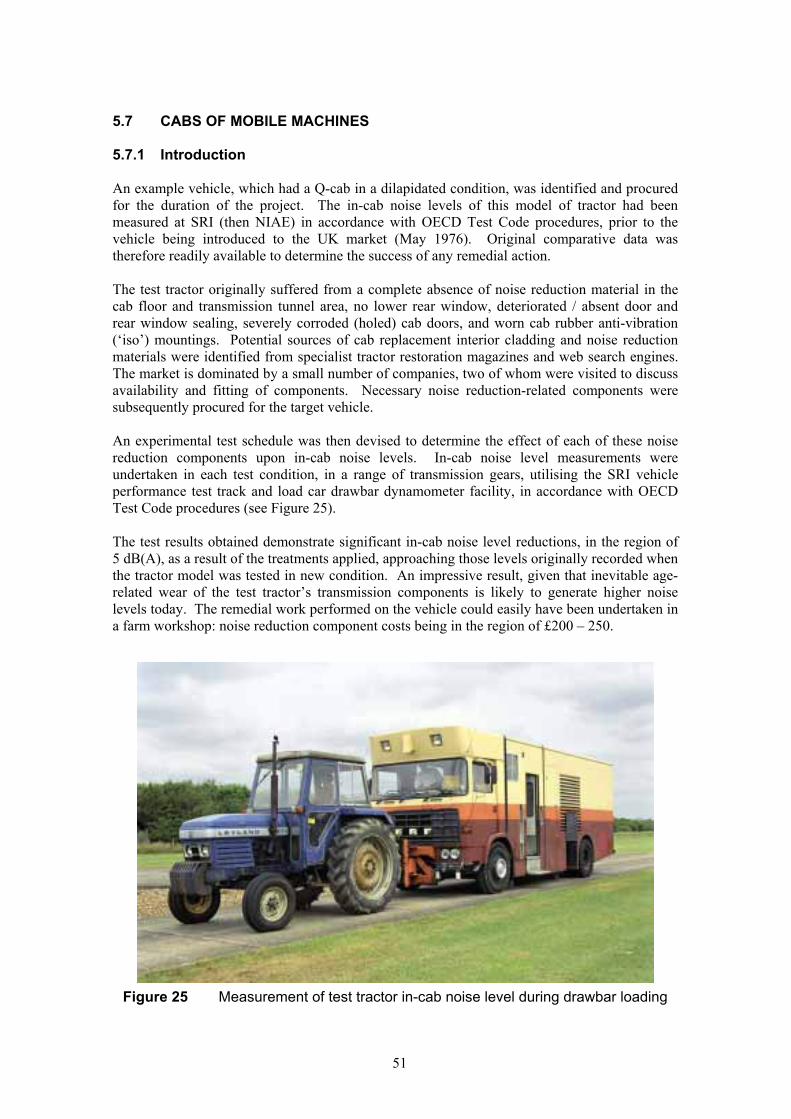
5.7 CABS OF MOBILE MACHINES
5.7.1 Introduction
An example vehicle, which had a Q-cab in a dilapidated condition, was identified and procured for the duration of the project. The in-cab noise levels of this model of tractor had been measured at SRI (then NIAE) in accordance with OECD Test Code procedures, prior to the vehicle being introduced to the UK market (May 1976). Original comparative data was therefore readily available to determine the success of any remedial action.
The test tractor originally suffered from a complete absence of noise reduction material in the cab floor and transmission tunnel area, no lower rear window, deteriorated / absent door and rear window sealing, severely corroded (holed) cab doors, and worn cab rubber anti-vibration (‘iso’) mountings. Potential sources of cab replacement interior cladding and noise reduction materials were identified from specialist tractor restoration magazines and web search engines. The market is dominated by a small number of companies, two of whom were visited to discuss availability and fitting of components. Necessary noise reduction-related components were subsequently procured for the target vehicle.
An experimental test schedule was then devised to determine the effect of each of these noise reduction components upon in-cab noise levels. In-cab noise level measurements were undertaken in each test condition, in a range of transmission gears, utilising the SRI vehicle performance test track and load car drawbar dynamometer facility, in accordance with OECD Test Code procedures (see Figure 25).
The test results obtained demonstrate significant in-cab noise level reductions, in the region of 5 dB(A), as a result of the treatments applied, approaching those levels originally recorded when the tractor model was tested in new condition. An impressive result, given that inevitable agerelated wear of the test tractor’s transmission components is likely to generate higher noise levels today. The remedial work performed on the vehicle could easily have been undertaken in a farm workshop: noise reduction component costs being in the region of £200 – 250.
Figure 25 Measurement of test tractor in-cab noise level during drawbar loading
51

_____________________________________________________________________________
_____________________________________________________________________________________
_____________________________________________________________________________
5.7.2 CASE STUDY: Tractor Q-cab refurbishment
Installation details Location: Bedfordshire Business details: Small arable farm Target machine: Leyland 272
Noise source / level
The main sources of noise on agricultural tractors are the engine / exhaust and the transmission. Any attached implement, especially PTO-driven, can also be a significant noise source but this is dealt with in a separate case study – see Section 5.4. The dilapidated Q-cab of the test tractor had no noise reduction material on the cab floor and transmission tunnel area, no lower rear window, deteriorated / absent door and rear window sealing, severely corroded (holed) cab doors, and worn cab rubber anti-vibration (‘iso’) mountings. This resulted in in-cab noise levels between 89 – 92 dB(A), which were up to 7 dB(A) higher than the original OECD test measurements when the vehicle was new.
Possible Noise Reduction Solutions
The overall aim of this case study was to return the cab to as close to “as new” condition as practical, in terms of noise emmissions, by replacing worn or missing acoustic absorption materials and repairing the window and doors. Noise measurements were repeated at each stage of the refurbishment, detailed in Table 8, to determine the effect of the individual vehicle cabrelated noise reduction components upon in-cab noise levels.
Table 8 Tractor in-cab noise test programme
Test condition Vehicle condition / treatment
1 Cab iso-mounts bypassed by insertion of steel wedges, to encourage noise/vibration transfer. No floor mats, transmission tunnel trim or lower rear window fitted
2 As Condition 1, but with steel wedges removed: i.e. vehicle as procured
3 As Condition 2, plus floor matting & transmission tunnel trim
4 As Condition 3, plus door lower sections repaired & door seals renewed
5 As Condition 4, plus lower rear window installed & upper rear window seal renewed
6 As Condition 5, plus plywood baffle plate between engine bay & cab
7 As Condition 6, plus cab rubber iso-mounts renewed
8 As Condition 7, but with floor mats and transmission tunnel trim removed
52
Construction / Installation
Potential sources of cab replacement interior cladding and noise reduction materials were identified and the selected items procured (a list of suppliers is given below). These included a proprietary transmission tunnel cover (constructed from 6mm moulded rubber mat and 19 mm reconstituted foam) at £85, 4 mm rubber floor mat, which was supplied as a roll and cut to fit, at £10/m2 and 12 mm self adhesive sound barrier foam, also cut to fit and glued to the underside of the floor mat, cost £23 per 1.5 m2 sheet.
As no proprietary seals were readily available for the doors and windows, acceptable replacement seals were formed by cutting 20 mm wide strips from the sound barrier foam, and then carving through it laterally, so reducing its thickness to 6 mm. The doors were repaired in the SRI workshop by cutting out the corroded sections and re-fabricating the lower doorframe and door skin. A second-hand lower rear window was purchased from a specialist tractor breaker at a cost of £20. The baffle plate was cut to suit from plywood sheeting and the cab isomounts were procured at a cost of £25 each
Suppliers
P. J. Dring &Co Raicon Estate, 15 Ashwell Road, Steeple Morden, Nr Royston, Herts, SG8 ONZ Tel: 01763 853132 Fax: 01763 852 454
Trelleborg Industrial AVS PO Box 98 Evington Valley Road Leicester LE5 5LY Tel: 0116 273 0281 Fax: 0116 273 5698 www.trelleborg.com
Uphill Sales & Services Uphill, Urchfont, Devizes, Wiltshire, SN10 4SA Tel: 01380 840285 Fax: 01380 848238 www.uphillsales.co.uk
The Vapormatic Co Ltd Kestrel Way, Sowton Ind. Estate, Exeter, UK, EX2 7NB Tel: +44 (0) 1392 435461 Fax: +44 (0) 1392 438445 www.vapormatic.com
Wyard Scott Ltd The Garage, Great Green, Cockfield, Bury St. Edmunds, Suffolk, IP30 0HJ Tel: 01284 828209 & 828421 www.agridesign.co.uk/wyardscott/contact.htm
53
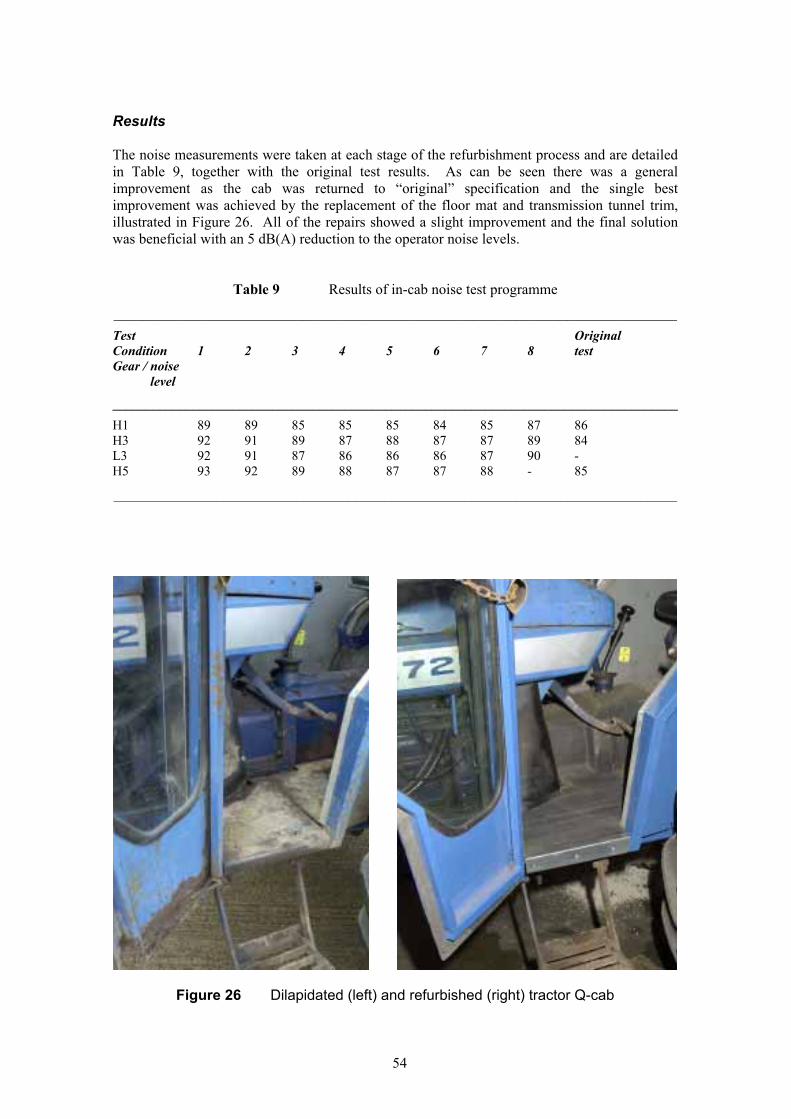
_____________________________________________________________________________
_____________________________________________________________________________________
_____________________________________________________________________________
Results
The noise measurements were taken at each stage of the refurbishment process and are detailed in Table 9, together with the original test results. As can be seen there was a general improvement as the cab was returned to “original” specification and the single best improvement was achieved by the replacement of the floor mat and transmission tunnel trim, illustrated in Figure 26. All of the repairs showed a slight improvement and the final solution was beneficial with an 5 dB(A) reduction to the operator noise levels.
Table 9 Results of in-cab noise test programme
Test Original Condition 1 2 3 4 5 6 7 8 test Gear / noise level
H1 89 89 85 H3 92 91 89 L3 92 91 87 H5 93 92 89
85 85 84 85 87 86 87 88 87 87 89 84 86 86 86 87 90 88 87 87 88 - 85
Figure 26 Dilapidated (left) and refurbished (right) tractor Q-cab
54

6 DISCUSSION / CONCLUSIONS
The review of trends in farm practices and machinery development suggests that noise problems are still prevalent in agricultural situations, even though there has been a steady increase in the availability of materials and equipment for noise control over recent years. The apparent reluctance of the agricultural sector to embrace the use of these noise reduction methods is probably due, at least in part, to the perceived cost. This investigation therefore set out to determine if cost effective solutions could be implemented on examples of high noise exposure utilising on-farm labour and low cost materials.
Although several of the 27 examples discussed (with daily operator exposures (LEP, d) between 89 – 104 dB(A)), such as portable powered equipment, are eliminated as being only suitable for use with Personal Protective Equipment (PPE - hearing defenders), 7 were selected for use as demonstration projects. These case studies were selected because of their wide applicability across the agricultural sector:
o Farm-scale potato pre-cleaning / grading line; o Grain drier; o Animal feed preparation machinery (hammer mill / cuber); o Tractor (PTO)-powered machine (forage harvester); o Vegetable packing shed; o Animal vocalisation during feeding; o Cabs of mobile machines (Q-cab refurbishment)
Farm scale potato grading lines were found not to be a significant noise emitter following onfarm measurement on a range of potato grading enterprises. However case studies were successfully conducted on the remaining examples, demonstrating an improvement between 3 16 dB(A) in the ambient / operator noise level.
The animal vocalisation case study compared two different feeding systems and, although the automatic system was beneficial in terms of the daily noise dose received by the operator, the extremely high noise levels that the operator is exposed to require that PPE is still worn.
In general, the remaining case studies illustrated that some form of effective enclosure, either for the machine or operator, to isolate the operator from the noise source, demonstrated a significant improvement, even when constructed / refurbished from relatively low cost materials. The agricultural enterprises concerned were very pleased with the results, indicating that cost effective noise reduction solutions are available to, and implementable by, the agricultural sector.
55

56
7 REFERENCES
BECKETT, W.S., CHAMBERLAIN, D., HALLMAN, E., MAY, J., HWANG, S-A., GOMEZ, M., EBERLY, S., COX, C., STARK, A. (2000) Hearing conservation for farmers: Source apportionment of occupational and environmental factors contributing to hearing loss. Journal of Occupational and Environmental Medicine 42(8): 806-813
BROSTE, S.K., HANSEN, D.A., STRAND, R.L., STUELAND, D.T. (1989) Hearing loss among high school farm students. American Journal of Public Health 79: 619-622
CRUTCHFIELD, C.D., SPARKS, S.T. (1991) Effects of noise and vibration on farm workers. Occupational Medicine: State of the Art Reviews 6(3): 355-369
DEFRA (Department for Environment, Food & Rural Affairs) (2001) Agriculture in the United Kingdom: 2000 (and previous years).
EUROPEAN PARLIAMENT (2002) Directive of the European Parliament and of the Council on the minimum health and safety requirements regarding the exposure of workers to the risks arising from physical agents (noise) (individual Directive within the meaning of Article 16(1) of Directive 89/391/EEC)
LINES, J.A., LEE, S.R. (1991) Mobile wood chipper noise. Divisional Note DN. 1611 Silsoe Research Institute, Wrest Park, Silsoe, Bedford, MK45 4HS, UK.
MATTHEWS, J. & TALAMO, J.D.C. (1970) A study of tractor noise control. Proc IMechE 1969-70 vol 184 part 3Q p149.
MATTHEWS, J. (1971) Noise problems in agriculture. Paper to IMechE discussion meeting “Noise control in the transport, agriculture and construction industries”.
MIYAKITA, T., UEDA, A. (1997) Estimates of workers with noise induced hearing loss and population at risk. Journal of Sound and Vibration 205(4): 441-449
PALMER, K. T., COGGON, D., SYDDALL, H. E., PANNETT, B. & GRIFFIN, M. J. (2001) Occupational exposure to noise and hearing difficulties in Great Britain. HSE Contract Research Report CRR 361/2001. HMSO, Norwich. ISBN 0 7176 2087 5
RENFERT-DEITERMANN, D. (2000) Cab repairs: keeping noise and dust at bay. PROFI International (8), pp38-41.
STILES, M.A., LINES, J.A., WHYTE, R.T. (1994) Some observations of noise received by tractor drivers. CR/624/95/8899 Silsoe Research Institute, Wrest Park, Silsoe, Bedford, MK45 4HS, UK
TALAMO, J. D. C. & STAYNER, R. M. (1972) Some aspects of environmental noise in farm buildings and plant. NIAE Dept Note DN/TE/199/1435 (unpubl)
TALAMO, J. D. C. & PEACHEY, R. O. (1985) Active noise control for tractor cabs? Proc. VIIIth CIGR/IAAMRH/IUFRO Ergonomics Symposium, Silsoe 9-12 Sept 1985.
57
TALAMO, J.D.C., STADIE, A.L., WHYTE, R.T., (1988) A survey of exposure to noise in agriculture. Health and Safety Executive Contract Research Report CRR 18/1989 TALAMO, J.D.C., RICHARDSON, C.D., STOCKTON, A.D., NIGRO, E. (1990) The effects of ageing on cabs. Health and Safety Executive Contract Research Report CRR 23/1990
TALLING, J.C., LINES, J.A., WATHES, C.M., WARAN, N.K. (1998) The acoustic environment of the domestic pig. Journal of Agricultural Engineering Research 71: 1-12
TOMLINSON, R. W. (1970) Tractor noise and the operator’s hearing. Paper to 4th Internatl. Ergonomics Conf. Strasbourg.
58

3
8 APPENDICES
APPENDIX 1 SUMMARY OF AGRICULTURAL ACTIVITIES AND ASSOCIATED NOISE LEVELS DERIVED FROM TALAMO ET AL. (1988)
1 - Class number as given in contract report CR/279/88/83212 - Where the length of exposure reduced the Leq to below 80 dB(A) the average length of time
operating the machinery is given - Ranked according to LA8 above 90 dB(A). 58 of the 76 classes of agricultural machine
exceed the proposed LA8 Second Action Level of 85 dB(A)
Operation Type (number surveyed)
Class no.1
Average working level (dB(A))
Corrected Leq for shift (dB(A)) 2
Equivalent 8 hour Lavg LEP.D (dB(A))
Ranking3
Grain Drier Cascade (6) 1.1.1 93.4 91.4 92.3 13
Tower (1) 1.1.2 84.6 84.5 86.4
Cross flow (20) 1.1.3 93.8 93.9 95.5 7
Batch (1) 1.1.5 85.5 84.8 87.9
Crop Drier Green Crop (13) 1.2.1 89.8 89.0 90.8 17=
Axial conditioning (1) 1.2.3 105.5 (11 min)
Feed preparation
Hammer mill (12) 1.3.1 85.5 89.3 87.2
Roller/crusher mill (5) 1.3.2 92.3 96.4 94.8 8
Vertical mixer (4) 1.3.3 80.9 (15 min)
Cuber and pelleter (1) 1.3.5 90.4 (6 min)
Grain transporter
Loading/Auger (3) 1.5.1 84.7 84.7 85.2
Conveyor (1) 1.5.3 84.3 84.0 84.2
Hop machinery
Field machinery (1) 1.7.1 84.0 82.8 83.3
Cleaner/picker (8) 1.7.2 93.9 93 93.6 11
Drier/packing (7) 1.7.3 88.0 87.4 88.7
Vegetable/ packing shed operations
Grader/sorter (23) 2.1.0 89.0 88.3 87.0
Washer/cleaner (4) 2.2.0 87.2 86.3 85.1
Packing/weigher (11) 2.3.0 90.3 89.6 89.0
General operating area (2) 2.4.0 91.6 91.0 92.1 14
Transportation (2) 2.5.0 87.1 85.8 86.4
59

Selfpropelled machinery
Combine <15' cab (7) 3.1.1 85.3 86.2 87.7
Combine <15' no cab (6) 3.1.2 91.3 89.6 89.7
Combine >15' cab (19) 3.1.3 88.4 87.1 88.7
Forage harvester (9) 3.2.0 87.3 84.4 86.1
Potato harvester (11) 3.3.0 89.1 88.6 88.5
Beet harvester (10) 3.4.0 91.7 90.5 91.2 16
Swather (11) 3.5.0 87.4 86.1 87.4
Pea viner (5) 3.6.0 87.7 85.9 87.3
Others (sprayer, digger dumper etc.) 3.7.0 90.0 89.3 90.8 17= (17)
Selfpropelled machinery
Tracklayer -slow (16) 3.8.1 97.5 95.5 95.8 6
Tracklayer -HS (9) 3.8.2 99.8 97.8 98.2 4 Tractor with field machine
Forage harvester cylinder chop (15) 4.1.1 89.3 87.6 88.8
Forage harvester flywheel chop (5) 4.1.2 88.9 87.6 88.2
Mower - drum (2) 4.2.2 90.6 80.7 78.6
Mower - disc (12) 4.2.3 91.1 90.9 91.5 15
Mower - cylinder (8) 4.2.4 86.8 86.2 86.5
Mower - flail (1) 4.2.5 88.0 1hour 46 min
Power harrow (12) 4.3.0 87.7 86.4 87.4
Rotary cultivator (3) 4.4.0 90.4 85.3 83.5
FYM spreader (10) 4.5.0 89.0 86.5 87.0
Baler - ram (4) 4.6.1 90.1 87.3 88.5
Baler - round (3) 4.6.2 86.5 85.5 87.3
Baler - high density (1) 4.6.3 96.8 90.6 92.4 12
Hedge cutter - flail (9) 4.7.1 91.4 87.8 88.3
Hedge cutter - saw (1) 4.7.2 89.6 89.1 90.5 21=
Orchard sprayer (5) 4.8.0 97.9 95.7 96.9 5 Misc. straw chopper (1) 4.9.1 90.4 89.4 90.8 17=
Misc. tedder/ turner (4) 4.9.2 88.5 1 hour 2
min
60

Tractor with field machine
Misc. veg. topper (2) 4.9.3 88.6 87.1 89.2
Misc.veg harvester (8) 4.9.4 88.7 87.4 88.2
Misc. Beet harvesting (3) 4.9.5 89.0 89.4 90.5 21=
Misc. sprayer (3) 4.9.6 87.2 83.7 84.6
Misc. drilling (5) 4.9.7 88.6 2 hours 8 min
Misc. trailer transport and ploughing (38) 4.9.8 89.2 89.8 90.1 23
Worker on machine (2) 4.10.1 106.6 102.6 104.1 1
Worker not on machine (3) 4.10.2 84.1 85.0 82.8
Horticultural machines
Cylinder mower -pedestrian (8) 5.1.1 88.2 85.1 85.3
Cylinder mower -sulky (1) 5.1.2 86.7 1 hour 1
min Cylinder mower rideon (12) 5.1.3 88.6 86.3 86.8
Rotary mower (9) 5.2.1 88.6 86.9 87.4
Rotary mower ride-on (5) 5.2.2 92.3 1 hour 8
min
Rotary cultivator (5) 5.3.1 89.9 81.8 82.5
Hoe cultivator (1) 5.4.1 92.5 28 min
Other- potato lifter(1) 5.5.0 87.9 40 min
Man carried Blower/duster (3) 6.1.0 89.4 93.8 93.8 10
Hedge cutter (7) 6.2.0 93.1 89.3 89.7
Chain saw (3) 6.3.0 103.9 99.9 100.6 2 Other - bystander to above (4) 6.4.0 84.4 3 hours 11
min Livestock Pig feeding (6) 7.1.0 93.3 87.7 88.9
Cattle feeding by wagon (5) 7.2.0 86.1 86.9 88.0
Milking parlour (6) 7.3.0 80.3 1 hour 7 min
Turkey plucker (1) 7.4.0a 99.8 99.4 99.4 3
Turkey house (1) 7.4.0b 94.4 93.9 93.9 9
Calf feeding (1) 7.4.0c 76.6 4 hours 41 min
Workshop Angle grinder (3) 8.1.0 88.1 90.0 90.7 20 General workshop activities (2) 8.2.0 84.5 84.2 85.1
61
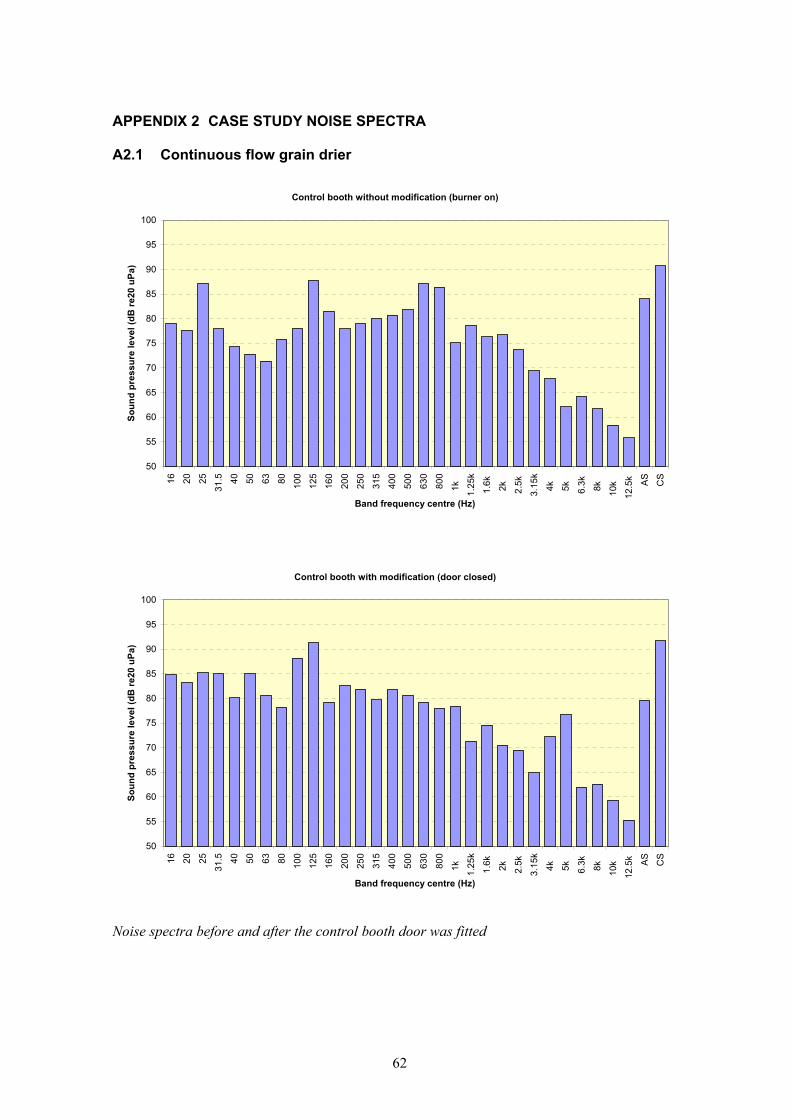
Soun
d pr
essu
re le
vel (
dB re
20 u
Pa)
Soun
d pr
essu
re le
vel (
dB re
20 u
Pa) 90
85
80
75
70
65
60
55
50
Band frequency centre (Hz)
Noise spectra before and after the control booth door was fitted
62
16 20 25
31.5 40 50 63 80 100
125
160
200
250
315
400
500
630
800
1k
1.2
5k
1.6k 2k 2.5k
3.1
5k
4k 5k 6.3k 8k 10k
12.5
k AS
CS
)
50
55
60
65
70
75
80
85
90
95
100
Band frequency centre (Hz
Control booth with modification (door closed)
16 20 25
31.5 40 50 63 80 100
125
160
200
250
315
400
500
630
800
1k
1.2
5k
1.6k 2k 2.5k
3.1
5k
4k 5k 6.3k 8k 10k
12.5
k AS
CS
APPENDIX 2 CASE STUDY NOISE SPECTRA
A2.1 Continuous flow grain drier
Control booth without modification (burner on)
100
95
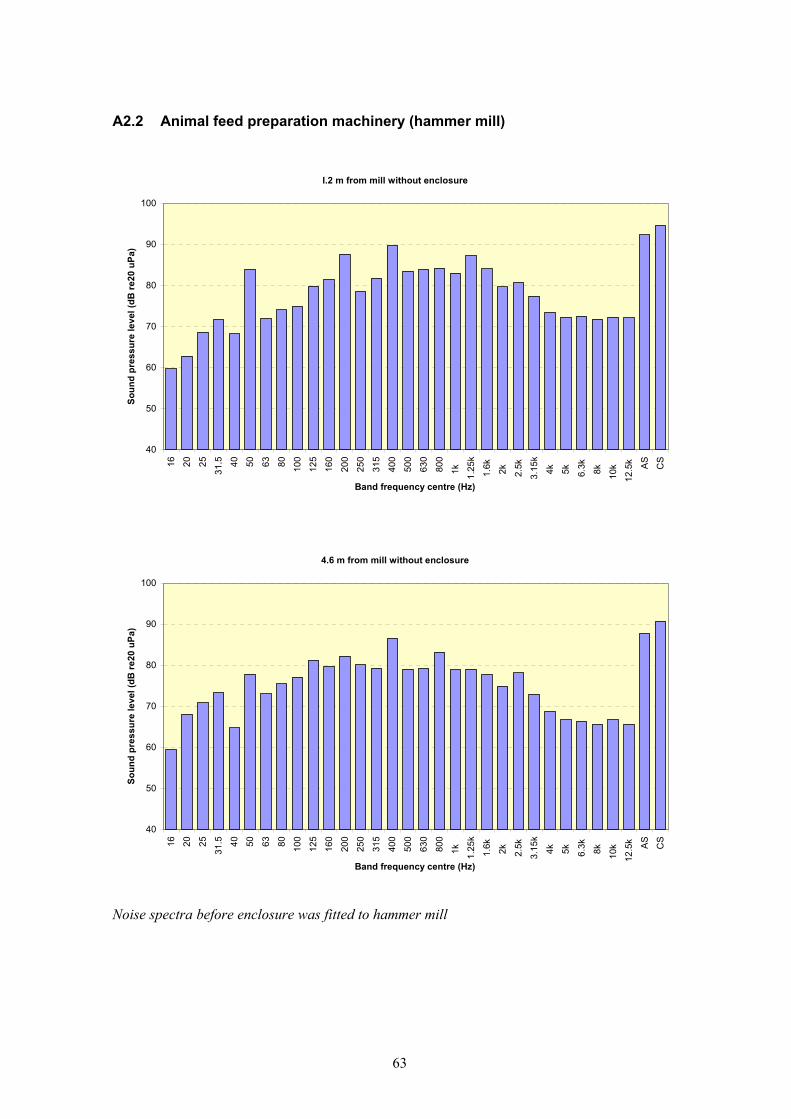
Soun
d pr
essu
re le
vel (
dB re
20 u
Pa)
Soun
d pr
essu
re le
vel (
dB re
20 u
Pa)
80
70
60
50
40
Band frequency centre (Hz)
Noise spectra before enclosure was fitted to hammer mill
63
16 20 25
31.5 40 50 63 80 100
125
160
200
250
315
400
500
630
800
1k
1.2
5k
1.6k 2k 2.5k
3.1
5k
4k 5k 6.3k 8k 10k
12.5
k AS
CS
)
40
50
60
70
80
90
100
Band frequency centre (Hz
4.6 m from mill without enclosure
16 20 25
31.5 40 50 63 80 100
125
160
200
250
315
400
500
630
800
1k
1.2
5k
1.6k 2k 2.5k
3.1
5k
4k 5k 6.3k 8k 10k
12.5
k AS
CS
A2.2
90
100
Animal feed preparation machinery (hammer mill)
I.2 m from mill without enclosure
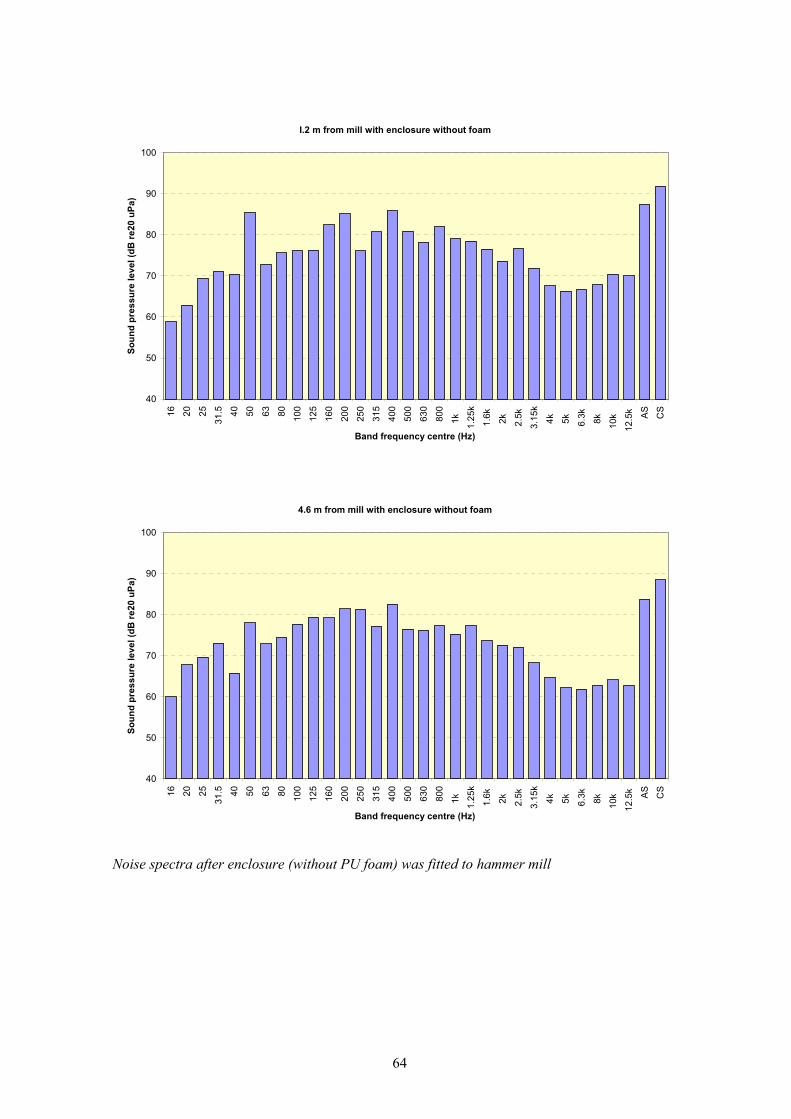
Soun
d pr
essu
re le
vel (
dB re
20 u
Pa)
Soun
d pr
essu
re le
vel (
dB re
20 u
Pa)
40
50
60
70
80
90
100
I.2 m from mill with enclosure without foam
Band frequency centre (Hz)
Noise spectra after enclosure (without PU foam) was fitted to hammer mill
64
16 20 25
31.5 40 50 63 80
16 20 25
31.5 40 50 63 80
100
100
125
125
160
160
200
200
250
)
40
50
60
70
80
90
100
Band frequency centre (Hz
4.6 m from mill with enclosure without foam
250
315
315
400
400
500
500
630
630
800
800
1k
1k
1.2
5k 1
.25k
1.6
k 1.
6k
2k 2.5k
3.1
5k
4k 5k 6.3k 8k 10k
12.5
k AS
CS
2k 2.5k
3.1
5k
4k 5k 6.3k 8k 10k
12.5
k AS
CS
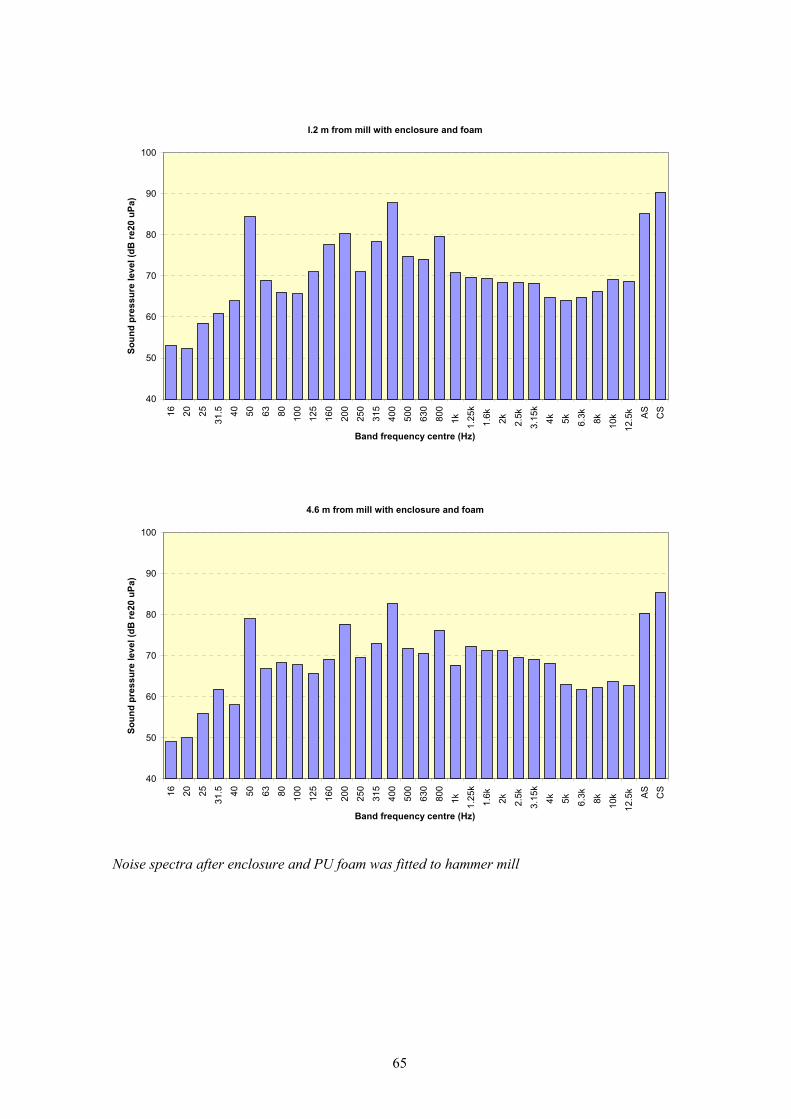
Soun
d pr
essu
re le
vel (
dB re
20 u
Pa)
Soun
d pr
essu
re le
vel (
dB re
20 u
Pa)
40
50
60
70
80
90
100
I.2 m from mill with enclosure and foam
Band frequency centre (Hz)
Noise spectra after enclosure and PU foam was fitted to hammer mill
65
16 20 25
31.5 40 50 63 80 100
16 20 25
31.5 40 50 63 80 100
125
125
160
160
200
200
250
250
315
)
40
50
60
70
80
90
100
Band frequency centre (Hz
4.6 m from mill with enclosure and foam
315
400
400
500
500
630
630
800
800
1k
1k
1.2
5k 1
.25k
1.6
k 1.
6k
2k 2.5k
3.1
5k
4k 5k 6.3k 8k 10k
12.5
k AS
CS
2k 2.5k
3.1
5k
4k 5k 6.3k 8k 10k
12.5
k AS
CS

Soun
d pr
essu
re le
vel (
dB re
20 u
Pa)
Soun
d pr
essu
re le
vel (
dB re
20 u
Pa)
Soun
d pr
essu
re le
vel (
dB re
20 u
Pa) 95
90
85
80
75
70
65
60
55
50
Band frequency centre (Hz)
Noise spectra before enclosure was fitted to cuber
66
16 20 25
31.5 40 50 63 80 100
125
160
200
250
315
400
500
630
800
1k
1.2
5k
1.6
k
2k 2.5
k
3.1
5k
4k 5k 6.3
k
8k 10k
12.5
k AS CS
)
50
55
60
65
70
75
80
85
90
95
100
Band frequency centre (Hz
At power controls on wall without enclosure fitted
A2.3
100
Animal feed preparation machinery (cuber) I.8 m from cuber without enclosure fitted
16 20 25
31.5 40 50 63 80
16 20 25
31.5 40 50 63 80
100
100
125
125
160
160
200
200
250
Band frequency centre (Hz)
In normal work area without enclosure fitted
100
95
90 2k
2k
85
80
75
70
65
60
55
50
250
315
315
400
400
500
500
630
630
800
800
1k
1k
1.2
5k 1
.25k
1.6
k 1
.6k
2.5
k
3.1
5k
4k 5k 6.3
k
8k 10k
12.5
k AS CS
2.5
k
3.1
5k
4k 5k 6.3
k
8k 10k
12.5
k AS CS
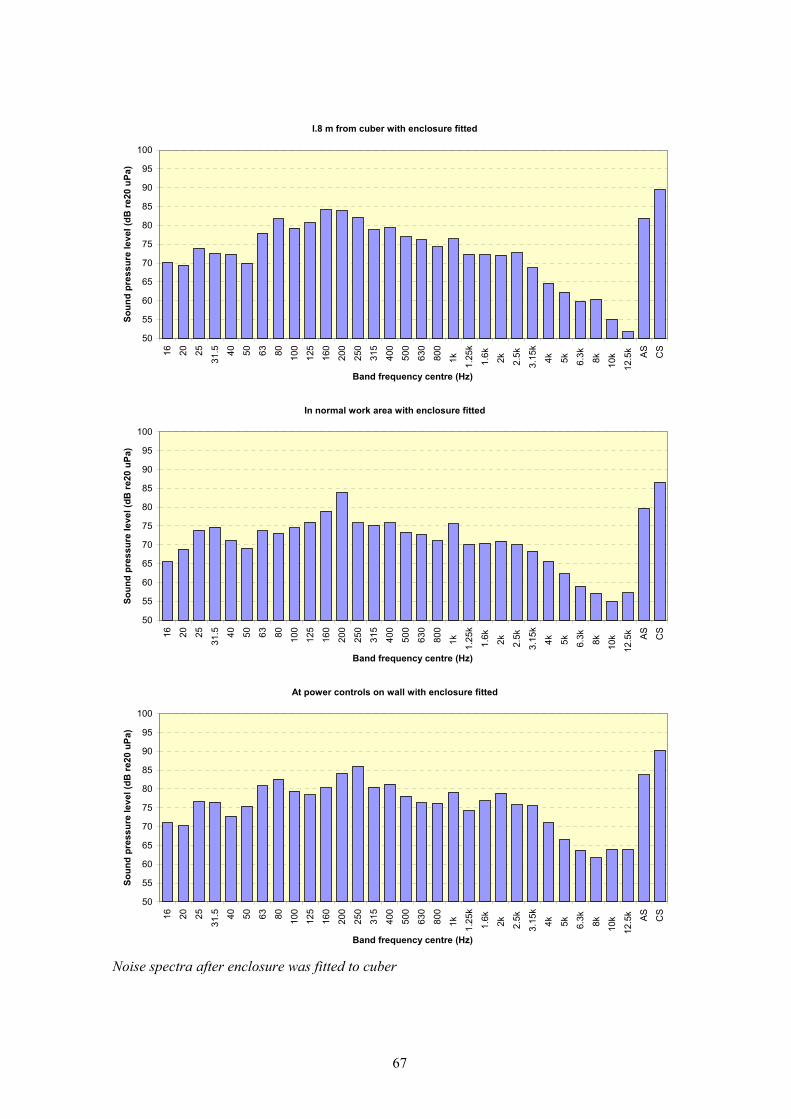
Soun
d pr
essu
re le
vel (
dB re
20 u
Pa)
Soun
d pr
essu
re le
vel (
dB re
20 u
Pa)
Soun
d pr
essu
re le
vel (
dB re
20 u
Pa)
Band frequency centre (Hz)
Noise spectra after enclosure was fitted to cuber
67
16 20 25
31.5 40 50 63 80 100
125
160
200
250
315
400
500
630
800
1k
1.2
5k
1.6
k
2k 2.5
k
3.1
5k
4k 5k 6.3
k
8k 10k
12.5
k AS CS
50
55
60
65
70
75
80
85
90
95
100
Band frequency centre (Hz)
At power controls on wall with enclosure fitted
16 20 25
31.5 40 50 63 80
16 20 25
31.5 40 50 63 80
125
125
160
160
200
200
250
250
100
100
Band frequency centre (Hz)
In normal work area with enclosure fitted
100
95
90
85
80
75
70
65
60
55
50
315
50
55
60
65
70
75
80
85
90
95
100
I.8 m from cuber with enclosure fitted
315
400
400
500
500
630
630
800
800
1k
1k
1.2
5k 1
.25k
1.6
k 1
.6k
2k
2k
2.5
k
3.1
5k
4k 5k 6.3
k
8k 10k
12.5
k AS CS
2.5
k
3.1
5k
4k 5k 6.3
k
8k 10k
12.5
k AS
CS
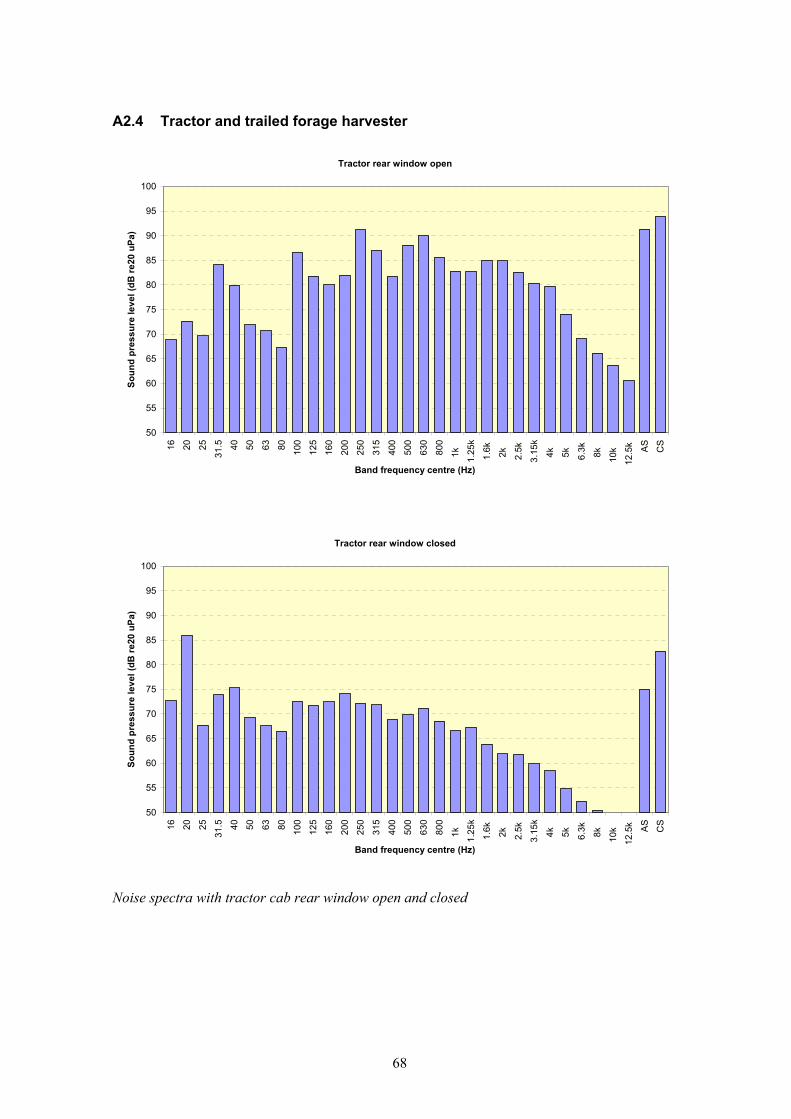
Soun
d pr
essu
re le
vel (
dB re
20 u
Pa)
Soun
d pr
essu
re le
vel (
dB re
20 u
Pa) 90
85
80
75
70
65
60
55
50
Band frequency centre (Hz)
Noise spectra with tractor cab rear window open and closed
68
16 20 25
31.5 40 50 63 80 100
125
160
200
250
315
400
500
630
800
1k
1.2
5k
1.6k 2k 2.5k
3.1
5k
4k 5k 6.3k 8k 10k
12.5
k AS
CS
)
50
55
60
65
70
75
80
85
90
95
100
Band frequency centre (Hz
Tractor rear window closed
16 20 25
31.5 40 50 63 80 100
125
160
200
250
315
400
500
630
800
1k
1.2
5k
1.6k 2k 2.5k
3.1
5k
4k 5k 6.3k 8k 10k
12.5
k AS
CS
A2.4
95
100
Tractor and trailed forage harvester
Tractor rear window open

69
Sound press ure le vel (dB re20 uPa) Sound press ure le vel (dB re20 uPa)
6065707580859060657075808590
Ban
d fr
eque
ncy
cent
re (H
z)
Ban
d fr
eque
ncy
cent
re (H
z)
Noi
se s
pect
ra b
efor
e gr
adin
g lin
e m
odifi
catio
ns
16
20
25
31.5
40
50
63
80
10 0
12 5
16 0
20 0
25 0
31 5
40 0
50 0
63 0
80 0
1k
1.25k
1.6k
2k
2.5k
3.15k
4k
5k
6.3k
8k
10k
12 .5k
AS
CS
16
20
25
31.5
40
50
63
80
10 0
12 5
16 0
20 0
25 0
31 5
40 0
50 0
63 0
80 0
1k
1.25k
1.6k
2k
2.5k
3.15k
4k
5k
6.3k
8k
10k
12 .5k
AS
CS
Ban
d fr
eque
ncy
cent
re (H
z)
Ban
d fr
eque
ncy
cent
re (H
z)
Seco
nd s
orte
r pos
ition
bef
ore
mod
ifica
tion
Third
sor
ter p
ositi
on b
efor
e m
odifi
catio
n
100
100
95
95
55
55
50
50
16
20
25
31.5
40
50
63
80
10 0
12 5
16 0
20 0
25 0
31 5
40 0
50 0
63 0
80 0
1k
1.25k
1.6k
2k
2.5k
3.15k
4k
5k
6.3k
8k
10k
12 .5k
AS
CS
505595
ii
505595
Gen
eral
wor
k ar
ea b
efor
e m
odifi
catio
n
100
Firs
t sor
ter p
osit
on b
efor
e m
odifi
cato
n
100
Sound press ure le vel (dB re20 uPa) Sound press ure le vel (dB re20 uPa)
6065707580859060657075808590
16
20
25
31.5
40
50
63
80
10 0
12 5
16 0
20 0
25 0
31 5
40 0
50 0
63 0
80 0
1k
1.25k
1.6k
2k
2.5k
3.15k
4k
5k
6.3k
8k
10k
12 .5k
AS
CS
A2.5 Onion Grading line

70
Sound press ure le vel (dB re20 uPa) Sound press ure le vel (dB re20 uPa)
6065707580859060657075808590
Ban
d fr
eque
ncy
cent
re (H
z)
Ban
d fr
eque
ncy
cent
re (H
z)
Noi
se s
pect
ra a
fter
grad
ing
line
mod
ifica
tions
16
20
25
31.5
40
50
63
80
10 0
12 5
16 0
20 0
25 0
31 5
40 0
50 0
63 0
80 0
1k
1.25k
1.6k
2k
2.5k
3.15k
4k
5k
6.3k
8k
10k
12 .5k
AS
CS
16
20
25
31.5
40
50
63
80
10 0
12 5
16 0
20 0
25 0
31 5
40 0
50 0
63 0
80 0
1k
1.25k
1.6k
2k
2.5k
3.15k
4k
5k
6.3k
8k
10k
12 .5k
AS
CS
Ban
d fr
eque
ncy
cent
re (H
z)
Ban
d fr
eque
ncy
cent
re (H
z)
Seco
nd s
orte
r pos
ition
afte
r mod
ifica
tion
Third
sor
ter p
ositi
on a
fter m
odifi
catio
n
100
100
95
95
55
55
50
50
505595
505595
Gen
eral
wor
k ar
ea a
fter m
odifi
catio
n
100
Firs
t sor
ter p
ositi
on a
fter m
odifi
catio
n
100
16
20
25
31.5
40
50
63
80
10 0
12 5
16 0
20 0
25 0
31 5
40 0
50 0
63 0
80 0
1k
1.25k
1.6k
2k
2.5k
3.15k
4k
5k
6.3k
8k
10k
12 .5k
AS
CS
Sound press ure le vel (dB re20 uPa) Sound press ure le vel (dB re20 uPa)
6065707580859060657075808590
16
20
25
31.5
40
50
63
80
10 0
12 5
16 0
20 0
25 0
31 5
40 0
50 0
63 0
80 0
1k
1.25k
1.6k
2k
2.5k
3.15k
4k
5k
6.3k
8k
10k
12 .5k
AS
CS
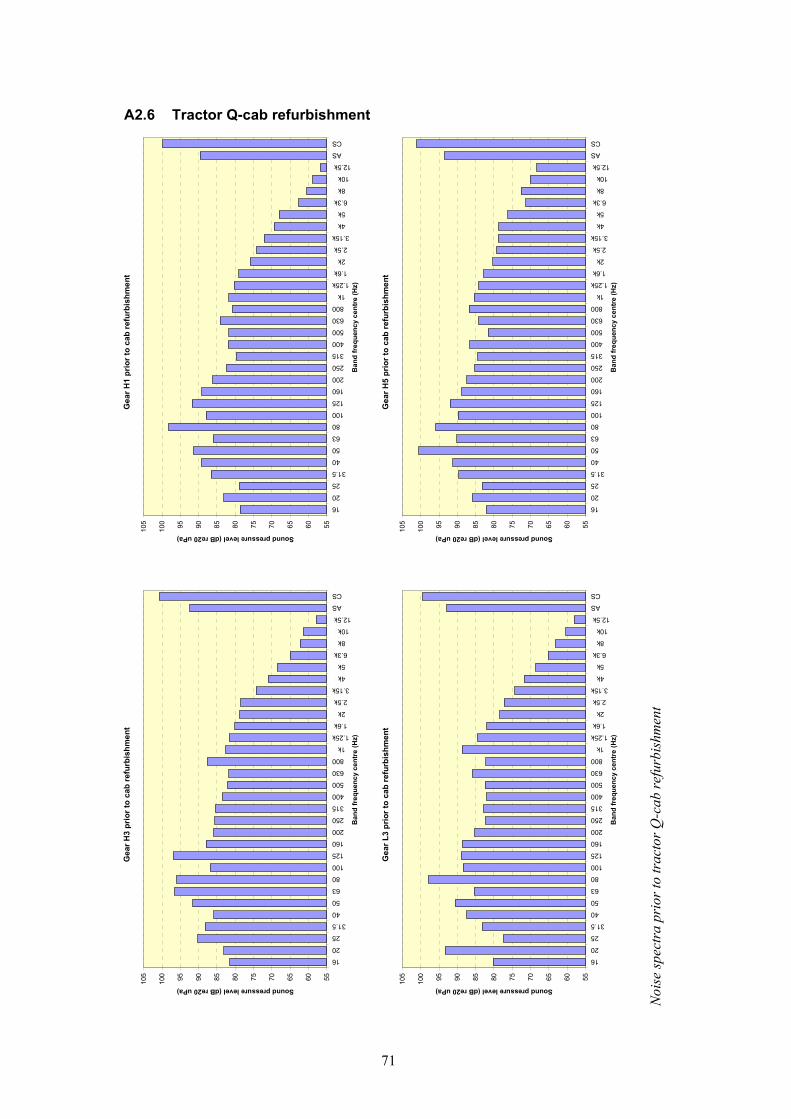
71
Sound press ure le vel (dB re20 uPa) Sound press ure le vel (dB re20 uPa)
6570758085909565707580859095
Ban
d fr
eque
ncy
cent
re (H
z)
Ban
d fr
eque
ncy
cent
re (H
z)
Noi
se s
pect
ra p
rior
to tr
acto
r Q
-cab
ref
urbi
shm
ent
16
20
25
31.5
40
50
63
80
10 0
12 5
16 0
20 0
25 0
31 5
40 0
50 0
63 0
80 0
1k
1.25k
1.6k
2k
2.5k
3.15k
4k
5k
6.3k
8k
10k
12 .5k
AS
CS
16
20
25
31.5
40
50
63
80
10 0
12 5
16 0
20 0
25 0
31 5
40 0
50 0
63 0
80 0
1k
1.25k
1.6k
2k
2.5k
3.15k
4k
5k
6.3k
8k
10k
12 .5k
AS
CS
Ban
d fr
eque
ncy
cent
re (H
z)
Ban
d fr
eque
ncy
cent
re (H
z)
Gea
r L3
prio
r to
cab
refu
rbis
hmen
t G
ear H
5 pr
ior t
o ca
b re
furb
ishm
ent
105
105
100
100
60
60
55
55
16
20
25
31.5
40
50
63
80
10 0
12 5
16 0
20 0
25 0
31 5
40 0
50 0
63 0
80 0
1k
1.25k
1.6k
2k
2.5k
3.15k
4k
5k
6.3k
8k
10k
12 .5k
AS
CS
5560
5560
Gea
r H3
prio
r to
cab
refu
rbis
hmen
t
100
105
Gea
r H1
prio
r to
cab
refu
rbis
hmen
t
100
105
Sound press ure le vel (dB re20 uPa) Sound press ure le vel (dB re20 uPa)
6570758085909565707580859095
16
20
25
31.5
40
50
63
80
10 0
12 5
16 0
20 0
25 0
31 5
40 0
50 0
63 0
80 0
1k
1.25k
1.6k
2k
2.5k
3.15k
4k
5k
6.3k
8k
10k
12 .5k
AS
CS
A2.6 Tractor Q-cab refurbishment
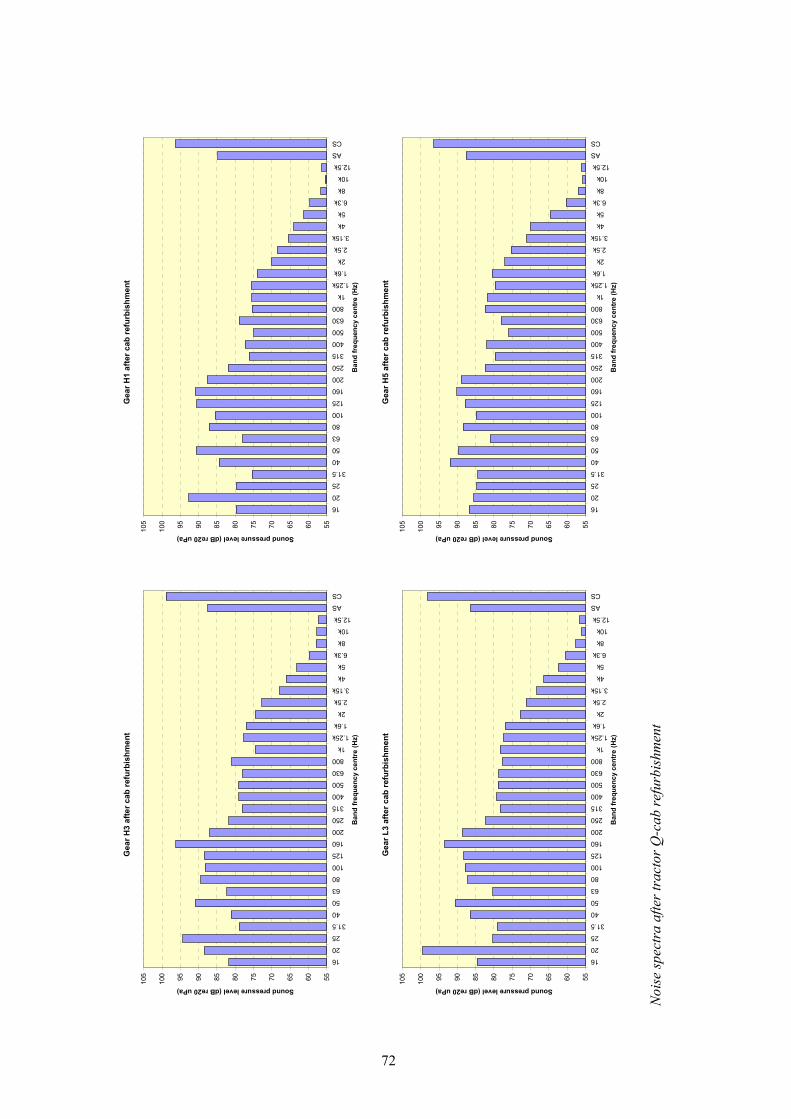
72
Sound press ure le vel (dB re20 uPa)Sound press ure le vel (dB re20 uPa)
6570758085909565707580859095
Ban
d fr
eque
ncy
cent
re (H
z)
Ban
d fr
eque
ncy
cent
re (H
z)
Noi
se s
pect
ra a
fter
trac
tor
Q-c
ab r
efur
bish
men
t
16
20
25
31.5
40
50
63
80
10 0
12 5
16 0
20 0
25 0
31 5
40 0
50 0
63 0
80 0
1k
1.25k
1.6k
2k
2.5k
3.15k
4k
5k
6.3k
8k
10k
12 .5k
AS
CS
16
20
25
31.5
40
50
63
80
10 0
12 5
16 0
20 0
25 0
31 5
40 0
50 0
63 0
80 0
1k
1.25k
1.6k
2k
2.5k
3.15k
4k
5k
6.3k
8k
10k
12 .5k
AS
CS
Ban
d fr
eque
ncy
cent
re (H
z)
Ban
d fr
eque
ncy
cent
re (H
z)
Gea
r L3
afte
r cab
refu
rbis
hmen
t G
ear H
5 af
ter c
ab re
furb
ishm
ent
105
105
100
100
60
60
55
555560
5560
Gea
r H1
afte
r cab
refu
rbis
hmen
t
100
105
Gea
r H3
afte
r cab
refu
rbis
hmen
t
100
105
16
20
25
31.5
40
50
63
80
10 0
12 5
16 0
20 0
25 0
31 5
40 0
50 0
63 0
80 0
1k
1.25k
1.6k
2k
2.5k
3.15k
4k
5k
6.3k
8k
10k
12 .5k
AS
CS
Sound press ure le vel (dB re20 uPa) Sound press ure le vel (dB re20 uPa)
6570758085909565707580859095
16
20
25
31.5
40
50
63
80
10 0
12 5
16 0
20 0
25 0
31 5
40 0
50 0
63 0
80 0
1k
1.25k
1.6k
2k
2.5k
3.15k
4k
5k
6.3k
8k
10k
12 .5k
AS
CS

Printed and published by the Health and Safety ExecutiveC30 1/98
Printed and published by the Health and Safety ExecutiveC1.10 03/04
ISBN 0-7176-2826-4
RR 212
£15.00 9 78071 7 628261