roza powerplant – forebay load rejection study · a field test of a partial load rejection was in...
TRANSCRIPT

U.S. Department of the Interior Bureau of Reclamation Technical Service Center Hydraulic Investigations and Laboratory Services Group Denver, Colorado August 2014
Hydraulic Laboratory Technical Memorandum PAP-1114
Roza Powerplant – Forebay Load Rejection Study Study provided for the Yakima Field Office


U.S. Department of the Interior Bureau of Reclamation Technical Service Center Hydraulic Investigations and Laboratory Services Group Denver, Colorado August 2014
BUREAU OF RECLAMATION Technical Service Center, Denver, Colorado Hydraulic Investigations and Laboratory Services, 86-68460 Technical Memorandum PAP-1114
Roza Powerplant – Forebay Load Rejection Study Study provided for the Yakima Field Office Prepared: Joshua D. Mortensen., P.E. Hydraulic Engineer, Hydraulic Investigations and Laboratory Services Group, 86-68460 Technical Approval: Robert F. Einhellig, P.E. Manager, Hydraulic Investigations and Laboratory Services Group, 86-68460 Peer Review: Tony L. Wahl, P.E. Hydraulic Engineer, Hydraulic Investigations and Laboratory Services Group, 86-68460


1
Introduction The Roza Powerplant is located near Yakima, WA on the Roza Main Canal immediately downstream from the bifurcation to the Roza Irrigation District. The plant, which has a single generator unit with a Francis turbine, primarily provides power to Yakima-Roza pumping plants during the irrigation season with surplus power going to Bonneville Power Administration. The forebay, which is an extension of the main canal, contains four siphon spillways and two radial gates for emergency operations.
Initial operation began in 1958 with a generator rating of 11.25 MW. In the 1980’s the generator was rewound and uprated to a new capacity of 13.0 MW. Increased generating capacity (which also means more water flow) has raised concerns about the ability of the powerplant forebay, canal, and siphon spillways to handle a load rejection at the new operating condition. Engineers from Reclamation’s Hydraulics Investigations and Laboratory Services Group (86-68460) were tasked with determining the implications of a load rejection under current operating conditions. Any necessary operational modifications or limitations to protect the infrastructure could then be determined. This was done using data from field measurements at the Roza Powerplant during a partial load rejection test as well as results from a numerical model of the forebay and canal system. Results will be used to update the Standard Operating Criteria for the Roza Powerplant.
Testing & Modeling Setup Impacts from a load rejection of the Roza Powerplant were investigated using data from field testing as well as a numerical model. A field test of a partial load rejection was performed in March 2014 where data were collected to verify the performance of the forebay, canal, and siphons, and compare to results from a full load rejection test performed in 1960. Physical data were also used to calibrate the numerical model to simulate a full load rejection under current operating conditions. In addition to the field test shown in Table 1, three current operating scenarios were evaluated in this study and were determined from information provided by Roza Powerplant operators.
Table 1 Roza Powerplant operating conditions that were evaluated in this study. Operating Scenario Power Rejected
Flow Comments
- MW ft3/s - Field Test 12.9 943 Data used to calibrate numerical model Normal - Rated 13.0 1,065 Normal operating condition Normal - High 13.2 1,080 Occasionally operate for short periods of time Worst Case 13.5 1,100 Matches 1960 test conditions

2
2014 Field Test
The test conducted on March 13, 2014 was a partial load rejection of the Roza Powerplant. The test simulated a load rejection equivalent to a discharge reduction of approximately 943 ft3/s. This was sufficient to activate the emergency siphons and cause a transient water surface surge up the canal so that test data could be obtained.
Data were collected in the canal and forebay and from the unit inside the powerplant. Water surface elevations were measured in the canal and forebay using eight Hobo water-level data loggers recording at 1 second intervals. Seven were installed on the main canal and forebay section downstream from the tunnel, and one upstream from the tunnel. Four video cameras were also used on the canal and forebay to capture the surge from the load rejection (Figure 1 and Figure 2). Data collected from inside the powerplant included generator power (recorded with Roza’s Monarch Data Chart Recorder), unit flow (Winter-Kennedy pressure taps), and wicket gate opening (percent open). These data (except for power) were collected at 100 Hz using an IOTech Personal DAQ data acquisition system connected to a laptop computer. Attempts to measure the penstock pressure were unsuccessful due to a faulty transducer.
Figure 1 Locations of water-level data loggers 1-4 on the canal upstream from the bifurcation to the Roza Irrigation District and camera locations that were used for video during the field test.

3
Figure 2 Water-level data logger and camera locations on the forebay near the penstock intake and siphon spillway. Red lines indicate cross-section locations that were used in the HEC-RAS model.

4
Numerical Modeling
HEC-RAS 4.1.0 was used to model the current operating scenarios listed in Table 1. HEC-RAS is a 1-dimensional hydraulic modeling tool developed by the Army Corps of Engineers that is widely used to model both steady and unsteady flows. Both steady and unsteady modeling packages were used in the current study.
HEC-RAS Model Description The Roza HEC-RAS model included a single reach that extended from the tunnel outlet to the siphon spillway. The bifurcation to the Roza Irrigation District (RID) was represented by cross-sections that include the same area and volume as the actual geometry at that location. The RID gates and canal were not included in the model. Load rejections with irrigation flows were not simulated because initial steady state results showed that water surface elevations upstream from the bifurcation were not increased by additional irrigation flow (total flow = 2,000 ft3/s). Also, historical photos and results from the 1960 load rejection, which did include irrigation flow, showed results that were not much different from numerical results with only powerplant flow.
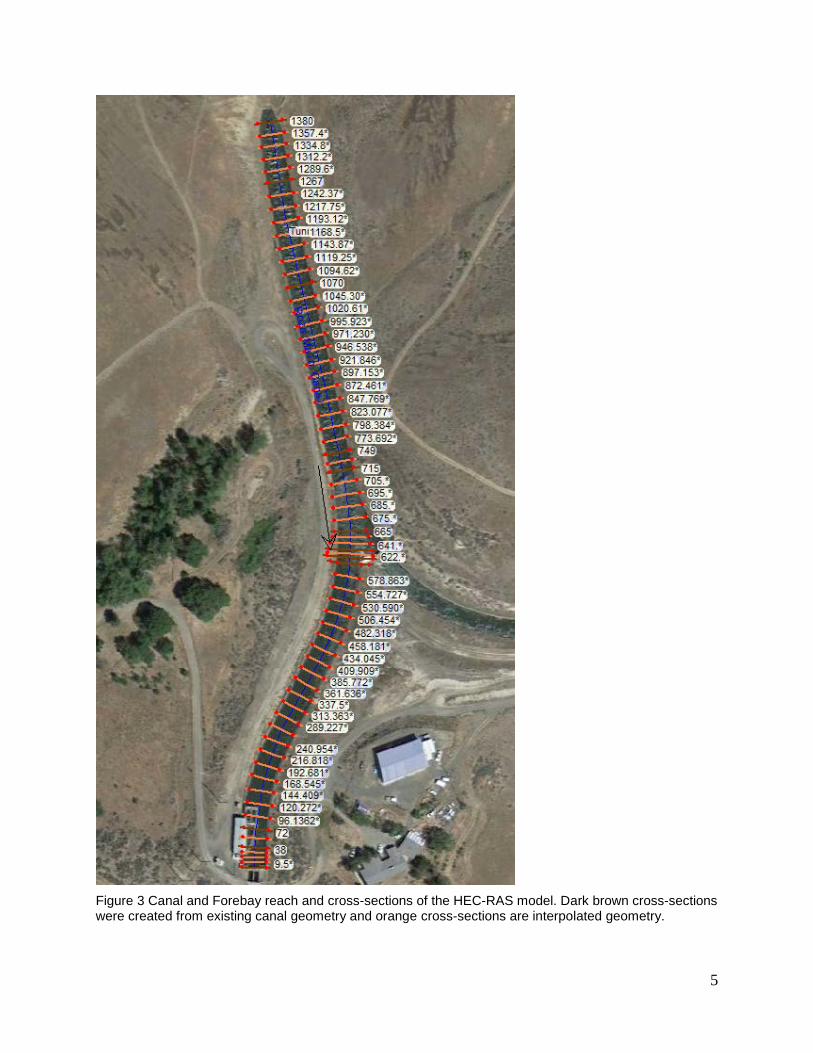
Cross-sections of the canal geometry were placed at the same stationing as the water-level loggers using survey data from the field and Roza Canal drawings (Table 2). Additional cross-sections were placed near the RID bifurcation to simulate the increased area and volume of the canal at that location. Interpolated cross-sections were then created by the model and were spaced about 25 ft apart through most of the model and about 12 ft apart at transitions near the RID bifurcation and penstock intake (Figure 3).
Table 2 Stationing of canal cross-sections created for the HEC-RAS model.
Description Stationing
Station (ft) About 30 ft d/s from tunnel outlet at trapezoidal geometry 1380 Location of logger #1, about 150' d/s of tunnel outlet 1267 Location of logger #2 1070 Location of logger #3, just u/s of safety rope at RID transition 749 Beginning of transition into bifurcation to RID 715 Cross-sections of forebay and RID entrance 665 Cross-sections of forebay and RID entrance 629 Cross-sections of forebay and RID entrance 615 Location of logger #4, across from RID transition and radial gates 605 Location of logger #6, near penstock intake 72 End of trapezoidal geometry, transition into rectangular section 38 Location of logger #7, Spillway Cross Section 0
5
Figure 3 Canal and Forebay reach and cross-sections of the HEC-RAS model. Dark brown cross-sections were created from existing canal geometry and orange cross-sections are interpolated geometry.
6
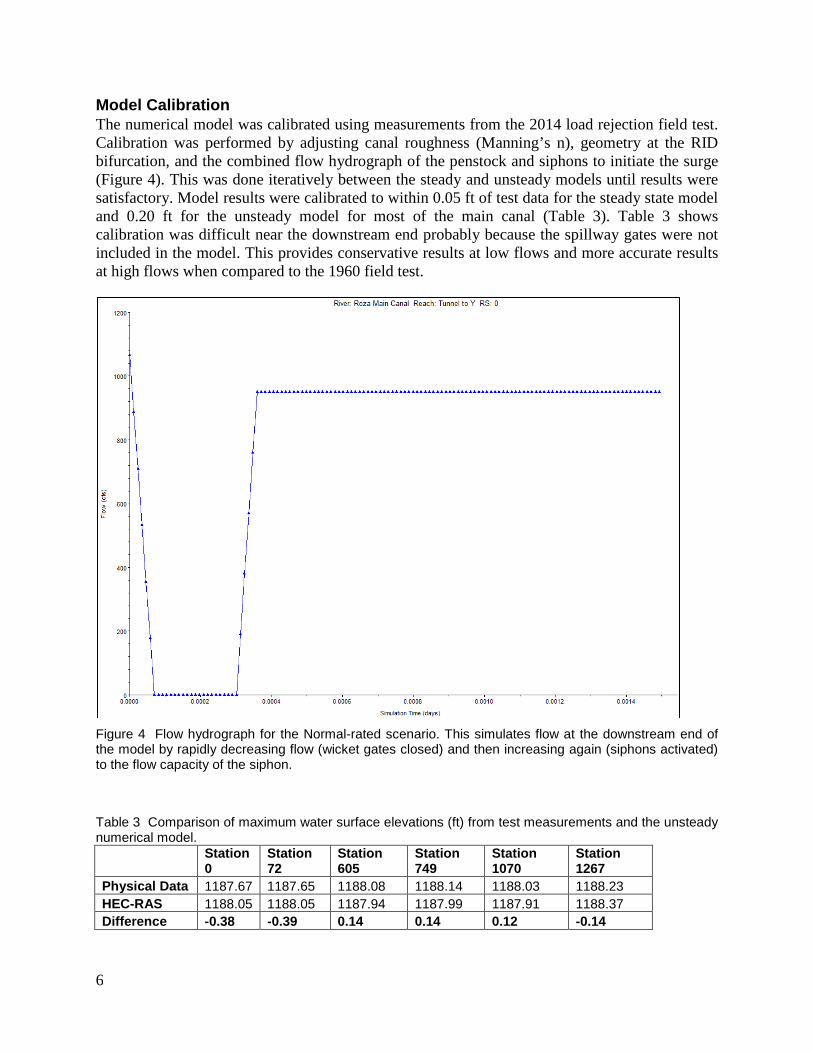
Model Calibration The numerical model was calibrated using measurements from the 2014 load rejection field test. Calibration was performed by adjusting canal roughness (Manning’s n), geometry at the RID bifurcation, and the combined flow hydrograph of the penstock and siphons to initiate the surge (Figure 4). This was done iteratively between the steady and unsteady models until results were satisfactory. Model results were calibrated to within 0.05 ft of test data for the steady state model and 0.20 ft for the unsteady model for most of the main canal (Table 3). Table 3 shows calibration was difficult near the downstream end probably because the spillway gates were not included in the model. This provides conservative results at low flows and more accurate results at high flows when compared to the 1960 field test.
Figure 4 Flow hydrograph for the Normal-rated scenario. This simulates flow at the downstream end of the model by rapidly decreasing flow (wicket gates closed) and then increasing again (siphons activated) to the flow capacity of the siphon.
Table 3 Comparison of maximum water surface elevations (ft) from test measurements and the unsteady numerical model.
Station 0
Station 72
Station 605
Station 749
Station 1070
Station 1267
Physical Data 1187.67 1187.65 1188.08 1188.14 1188.03 1188.23 HEC-RAS 1188.05 1188.05 1187.94 1187.99 1187.91 1188.37 Difference -0.38 -0.39 0.14 0.14 0.12 -0.14

7
The travel time of the surge up the canal was also of interest. Figure 5 compares both the timing and magnitude of the surge in the canal to ensure correct calibration of the numerical model. Only two minutes of the load rejection were simulated in every case because that is about the amount of time it took the surge to reach the tunnel outlet. Since the tunnel geometry was not included in the model any results after two minutes (when reflections from the tunnel outlet begin to influence water levels observed in the field) would not be representative of actual canal conditions.
Figure 5 Comparison of field test and numerical hydrograph of the water surface elevation at station 605 performed during the model calibration.
1,186.4
1,186.6
1,186.8
1,187.0
1,187.2
1,187.4
1,187.6
1,187.8
1,188.0
1,188.2
0 10 20 30 40 50 60 70 80 90 100 110 120
WS
Elev
atio
n (ft
)
Time (second)
Physical Data
HEC-RAS

8
Results and Discussion
2014 Field Test Results
The field test performed in March of 2014 was equivalent to a load rejection of about 943 ft3/s. Unit flow at the beginning of the test was about 1056 ft3/s which was also the total discharge through the canal, as there was no irrigation flow. The unit discharge was decreased to about 113 ft3/s by closing the wicket gates from 76% to 13% open in about 5.2 seconds. Generator power was also decreased from 12.9 MW to 1.1 MW in about 7 seconds. This caused a surge in the forebay that eventually activated all four siphons and overtopped both radial gates (Figure 6). The surge then traveled up the canal with an average velocity of 12.6 ft/s until it was dampened by the tunnel. Surge results are shown in Figure 7 and Table 4. Video of the canal near the RID bifurcation showed that both RID gates were also overtopped for a short period of time. Additional photos of the field test are shown in Appendix A.
Figure 6 Forebay near the siphons and radial gates after the initial surge and while the siphons were activated. The high water mark shows where the surge came near the top of the lining and overtopped the radial gates.
Top of Radial Gates
High water mark

9
Figure 7 Surge traveling up the canal during the 2014 field test.
Table 4 Surge height and remaining freeboard results for the 2014 field test. Station Avg. WSE before test Max WSE Surge Height Remaining Free-board
*10,343 *1026.08 *1026.60 *0.52 -
1267 1186.78 1188.23 1.45 0.19
1070 1186.73 1188.03 1.30 0.38
749 1186.71 1188.14 1.43 0.14
605 1186.73 1188.08 1.35 0.23
72 1186.34 1187.65 1.31 0.18
0 1186.60 1187.67 1.07 1.71 *Logger 8 was installed upstream from the tunnel and was not surveyed. It showed that the surge did travel through the tunnel and increase the main canal water surface upstream from the tunnel, even though it was significantly dampened.
The field test verified that all four emergency siphons performed as designed. All four were primed at approximately the same water surface elevation and appeared to have an equal discharge. Flow through the siphons was estimated by the change in penstock flow before and during the test (943 ft3/s) which is very near the design flow of 950 ft3/s. As the water surface was lowered at the conclusion of the test one siphon did not break on its own, indicating that the air vent pipe was probably blocked with debris.

10
Comparison to 1960 Field Test A field test report from May 1960 (Hornstein, 1960) and several historical photos of the test were provided by Roza Powerplant personnel. This field test was an extreme case of a full load rejection of 1,100 ft3/s. A comparison of data from both tests is provided in Table 5. While most results are similar, significant differences include maximum wave elevation in the forebay, and time required for maximum water surface elevation and siphon activation. These can be explained by the significant difference in rejected flow rates as well as the time to close the wicket gates.
This comparison was very useful in verifying numerical model results of the same rejection flow rate, as well as providing insight into the performance of the siphons. One key observation is that at 1,100 ft3/s the forebay elevation after the test is high enough to overtop the radial gates by almost 1 ft. This is assumed to be after the main surge has occurred when the siphons are operating and flow in the forebay is close to a steady state condition. Continually overtopping the radial gates is a concern that was also identified by the numerical results. However, the 1960 report did not specifically mention gate overtopping or how the forebay elevation was eventually lowered to end the test.
Table 5 Comparison from 1960 and 2014 field test results. Load Rejection Field Test 5/5/1960 3/13/2014 Comments Irrigation Flow ft3/s 764 0
Power Flow ft3/s 1,100 1,056 2014, measured with Winter-Kennedy taps
Total Flow ft3/s 1,864 1,056
Rejected Flow ft3/s 1,100 943 2014, estimated from difference in canal flow and remaining penstock flow
Generator Load kW 13,000 12,941
Wicket Gate Closing Time sec 3.75 5.20 2014, time to close to about 13% open Normal forebay Elev before test ft 1,186.6 1,186.6 2014, measured near siphon intake
Normal Forebay Elev after test ft 1,187.2 1,186.7 Means gates were overtopping for rejection of 1,100 ft3/s
WSE at siphon start ft 1,187.7 1,187.6 2014, measured near siphon intake
Max Wave Elev ft 1,188.2 1,187.7 2014, measured near siphon intake Time of max elev after shutdown sec 7 14 Assuming time from start of wicket gate
closure Time from shutdown to siphon operation sec 12 31 Assuming siphons fully primed
Time for wave to reach canal bifurcation sec 45 43 2014, time to logger #4
Time for wave to reach tunnel outlet sec 116 101 2014, time to logger #1 plus avg. wave
speed to tunnel outlet

11
The photos in Figure 8 show a slightly higher surge during the 1960 test that comes very close to the top of the lining of the canal. All photos and video from both field tests show the 1960 surge near the top of the lining for the entire canal length to the tunnel with the 2014 surge a few inches below the lining top as expected.
Figure 8 Photo comparison of the surge during the 1960 rejection test of 1,100 ft3/s (top) and the 2014 rejection test of 943 ft3/s (bottom).

12
Numerical Modeling Results
Forebay and Canal Maximum water surface elevations caused by the surge were predicted for full load rejections under the three current operating scenarios and compared to the 2014 field test data for the partial load rejection (Figure 9). Overall, numerical results followed the same trend found in the field test. Differences in water surface results of the three scenarios were not significant since the model flow rates were similar in magnitude. The traveling surge comes close to the top of the lining for most of the canal and did reach the top at Station 749. This is may be due to decreased flow velocities as the volume increased near the RID bifurcation entrance, or maybe just because of the local drop in canal lining elevation at that location. Water surfaces were highest at Station 1267 near the tunnel outlet which is probably caused by an increased surge as the transient wave hits the tunnel entrance. In any case, overtopping the canal lining is not a concern because of the short duration of the surge and the small flow depth above the lining which would always be contained in the main channel by the additional height of the canal embankments.
Figure 9 HEC-RAS estimations of maximum water surface elevations of the moving surge.

13
Using maximum water surface and survey data from Figure 9, remaining freeboard data are presented in Table 6. Again, the model predicts slight overtopping at stations 749 and 1267 with surges very close to the lining along most of the canal. These results seem to reflect historic photos of the 1960 test even though no water surface data along the canal are available for confirmation.
Table 6 Freeboard remaining with a surge at various locations along the forebay and canal. Negative values indicate a water surface above the concrete lining.
Station 0
Station 72
Station 605
Station 749
Station 1070
Station 1267
2014 Field Test 1.71 0.18 0.23 0.14 0.38 0.19 Normal - Rated 1.24 0.08 0.14 0.04 0.28 0.03 Normal - High 1.22 0.06 0.11 0.02 0.26 0.00 Worst-Case 1.19 0.03 0.09 -0.01 0.23 -0.03
Siphon Capacity According to a physical model study of the siphons (Owen, 1942), their combined capacity is 950 ft3/s which was the original capacity of the power plant prior to the generator upgrade. This was verified by estimating unit siphon flow using equation 1 (Bureau of Reclamation, 1987) and then computing the total combined flow for all four siphons.
𝑞 = 𝐶𝐷�2𝑔𝐻𝑇 (1)
Where: q = unit discharge (ft2/s) C = discharge coefficient (-) D = height of the siphon throat (ft) g = acceleration due to gravity (ft/s2) HT = elevation difference between the siphon crest and the tailwater (ft) Results varied with tailwater depths which were estimated from the 2014 video. Combined flow using equation 1 was estimated to be about 810 ft3/s for 4 ft of tailwater depth and 960 ft3/s for 1 ft of tailwater depth. This range of values is comparable to the original design flow rate but is still about 150 ft3/s short of a full rejection flow.

14
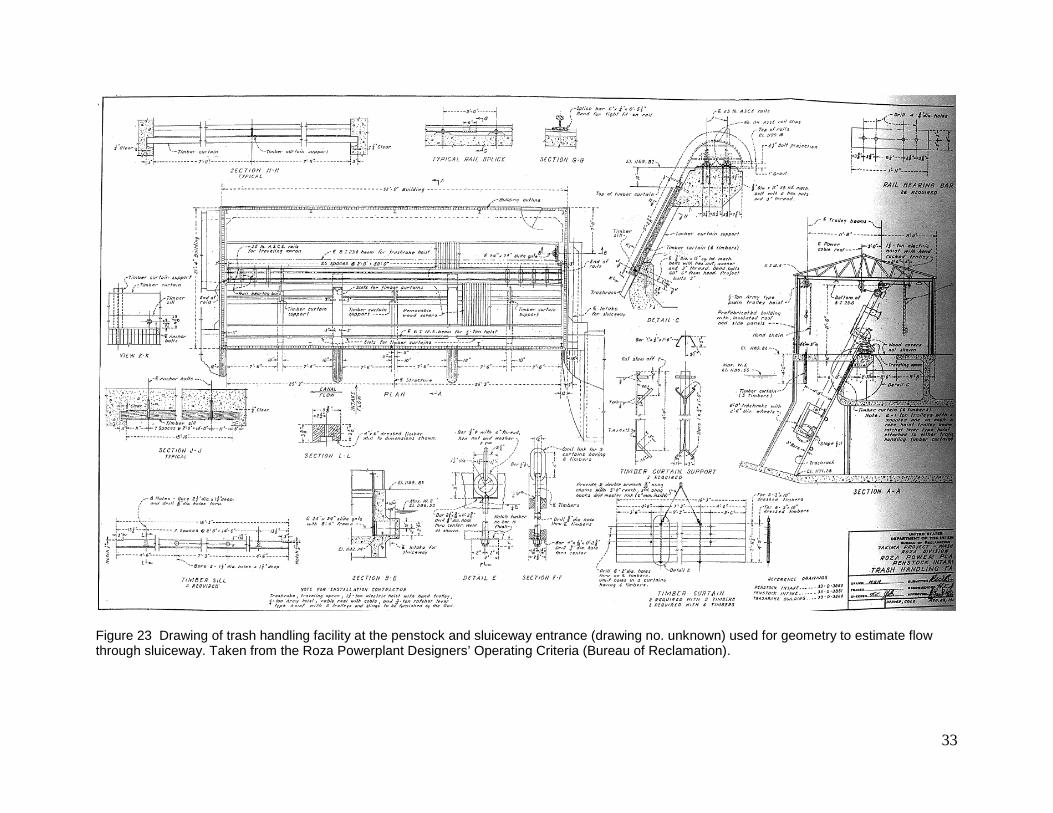
Spillway and Debris/Ice Sluiceway Even though the current load rejection flow has increased from the original design, the overall main canal flow has not changed and is within the capacity of the spillway and stilling basin. According to the original physical model study (Owen, 1942), the spillway was optimized for 950 ft3/s but can handle up to 2,100 ft3/s which is the full capacity of the main canal. The model study report states “The stilling pool designed for 950 second-foot is required to operate satisfactorily for 2,100 second-foot, a condition of operation that is expected rarely and for a duration of not more than 2 to 4 hours.” Independent spillway calculations for both normal and gradually varied flows show that 2,100 ft3/s produces flow depths well below the spillway walls as well as both Selah-Moxee and Moxee Co. flumes and the county road bridge that cross over the top of the spillway (Figure 20, Appendix C). However, the maximum spillway flow should be limited as splashing from the flow will impact these crossings. The flow capacity of the Debris/Ice Sluiceway was estimated to determine if it could be used as an emergency overflow to supplement siphon flow for a full load rejection. The flow was estimated by treating the 6 stop log bays as a modified suppressed rectangular weir with the flow rate depending on the forebay elevation and number of stop logs in the sluiceway inlet (Figure 23, Appendix C). For 3 stop log boards, which would be required to hold a normal operating forebay elevation, flows up to 100 ft3/s through the sluiceway are possible. Given the assumed geometry of the downstream sluiceway, the stop log weir at the entrance would be the flow control in every case. Appendix B provides detailed information about potential sluiceway operating conditions.
Radial Gates Overtopping the spillway radial gates for a prolonged period of time is a primary concern during a load rejection. This is due to high water surface elevations in the forebay caused initially by the transient surge and then by the need to pass the excess steady-state flow that cannot be conveyed through the siphon spillways (forebay inflow = 1100 ft3/s, while siphon capacity = 950 ft3/s). The plot in Figure 10 shows forebay water surface elevations relative to the top of the gates over time. The initial surge lasts only about 30 seconds before it drops down to a more steady condition after the siphons have been activated. The concern is that larger load rejections of current operations will cause a flow imbalance that will cause the gates to overtop for a prolonged period of time, maybe even indefinitely (Figure 10). This could prevent them from being opened and the flow would need to be relieved by some other method.
Ideally the flow imbalance in the forebay would be solved by using the radial gates to supplement the siphon flow and produce a forebay outflow equal to the inflow. For a load rejection of 1,100 ft3/s both radial gates would need to be opened only about 0.4 ft for a flow of 150 ft3/s to supplement the 950 ft3/s discharged by the siphons. However, this is complicated by the possibility of not being able to raise the gates due to continuous overtopping.

15
Figure 10 HEC-RAS predictions of the water surface elevation hydrograph at Station 0 relative to the top of the radial gates.
Structural and Mechanical Considerations Overtopping the Roza spillway gates in general is not a problem as long as it is not a permanent condition. The first concern is the gate’s ability to withstand a larger hydraulic load. Mechanical engineers from TSC’s Hydraulic Equipment Group performed a basic analysis on the Roza gate using assumptions from original design drawings (Appendix C). They estimated that the maximum allowable stress for the gate arms is about 13.97 ksi. With an additional load of 1.4 ft of head (estimated from HEC-RAS modeling) the actual gate arm stress would be approximately 3.8 ksi which is less than one third of the allowable stress. Therefore, additional load on the Roza gates is not a major issue.
Another potential concern is gate vibration caused by the overtopping flow which could cause a nappe on the back side of the gate that oscillates between an aerated and non-aerated condition. While this condition is unlikely, future observation using video of the back side of the gates during overtopping could be performed as a first step to confirm that this doesn’t occur. Also, vibration is unlikely to be an issue despite an oscillating nappe due to the rigid nature of a gate with a relatively short top width.
An important question that comes up because of the increased forebay elevations with current operating conditions is “can the radial gates be opened during overtopping flow?” In most cases this is not advisable because of the increased load on the hoist system and potential for bending stress in the gate arms. Additional bending stress is caused by increased friction at the trunnion pin which induces a moment on the gate arm, resulting in a bending component. However, these implications may not be significant for small overtopping depths (6-12 inches). Additional testing at Roza on an overtopping gate may answer this question.

16
Potential Solutions 1) Gate Automation: First, determine if it is safe to operate the gate while overtopping. If
this is a possibility, the gates could be opened within a certain defined criteria (e.g., when depth over the gate top is 0.5 ft or less). Automation would allow the gates to operate only within the safe range of overtopping depths, preventing a steady-state flow imbalance without personnel onsite. This will require a more thorough structural analysis of the gate assembly and hoist system to determine if this can be done safely. Bending stress and hoist motor torque measurements in the field would also be necessary.
2) Install flashboards to increase gate height and delay the onset of an overtopping condition. The gates could be raised to provide the required additional outflow before they are overtopped. Gate automation is recommended for this option as well, as the forebay will continue to rise over time if the inflow and outflow are not balanced which could lead to over topping the canal lining. This would also require a more thorough structural analysis of the gate assembly and hoist system to ensure that they could operate with the increased load.
3) Do Nothing: This solution may be a possibility if it can be determined that overtopping the gates until the canal flow is shutoff is acceptable (possibly several hours). In this case the debris/ice sluiceway and stop logs could act as an emergency overflow weir to supplement flow over the gates and reduce the forebay water surface elevation. The combined flow through the siphons, over the gates, and through the sluiceway would keep the water level below the forebay lining for a steady state condition. This would result in a forebay elevation that is 7.5 – 9.0 inches above the top of the gates (Table 8, Appendix B). The canal flow could be relieved quickly by either pulling more stop logs out of the sluiceway inlet or opening the radial gates if deemed safe to do so. Again, additional testing and analysis on the gate assembly would be required to determine if the gates can be opened while overtopping.
A more formal structural analysis of the gate assembly and hoist system could be performed by mechanical engineers from TSC’s Hydraulic Equipment Group (86-68420) and field testing could be performed by engineers from the Hydraulics Investigations Group (86-68460) if deemed necessary.

17
Radial Gates at the RID Bifurcation Field and numerical results show that the radial gates that control the flow to the RID canal are overtopped for up to 40 seconds when in the fully closed position (Figure 11). Assuming that the RID gates are overdesigned similar to the spillway gates, this is not a major concern due to the short period of overtopping. The water surface returns to below the top of the gates after the initial surge has passed. Actual RID gate dimensions are not known and elevations were estimated from DOC drawings and gate heights of the spillway gates were assumed to be the same as the spillway gates.
Figure 11 HEC-RAS predictions of the water surface elevation hydrograph at Station 605 relative to the top of the radial gates at the RID bifurcation.

18
Conclusions and Recommendations A study was completed of load rejections at the Roza Powerplant in which the hydraulic performance of the forebay, canal, and emergency siphon spillways was evaluated. Results will be used to update the Standard Operating Procedure of the powerplant. Physical measurements from a field test were used to verify the performance of the siphon spillways and to calibrate a HEC-RAS numerical model for simulation of a full load rejection at current operating conditions. These conditions include the normal rated operating point of 13.0 MW and an extreme worst-case condition of 13.5 MW. Significant findings from these analyses include:
• Forebay and Canal: Results from each load rejection scenario show that surge waves come very close to overtopping the concrete lining in various locations throughout the forebay and canal. However, extreme overtopping is not expected at any location and would still be contained in the main channel due to the higher elevation of the canal banks. Seepage and erosion beneath the lining is not expected, since any overtopping would be for a short period of time (up to 30 seconds).
• Siphon Spillways: Past studies and recent calculations show that the total capacity of the siphons is about 950 ft3/s, which is about 100-150 ft3/s less than the current capacity of the unit. Field tests verified that all four siphons operated properly and were capable of handling a load rejection equivalent to approximately 940 ft3/s. Also, numerical results indicated that the initial surge caused by a full load rejection would not overtop the forebay and canal lining. The concern, however, is that the steady-state flow imbalance (1,100 ft3/s coming into the forebay and 950 ft3/s leaving through the siphons) would cause the radial gates to overtop indefinitely after a load rejection until the main canal flow is reduced.
• Radial Gates: Physical and numerical results showed that the spillway gates will overtop by up to 1.4 ft of water for the worst-case condition. The actual compressive stress of the gate arms at this condition is still well below the allowable stress, and should not be a problem for an increased head caused by a temporary overtopping event. However, overtopping the gates for a prolonged period of time may be a concern and will likely occur for a full load rejection. Attempting to raise the gates while they are being overtopped could exceed torque limits for the hoist motor or cause excessive bending stress in the gate arms. Three potential solutions were provided: 1) Gate Automation 2) Install flashboards to increase gate height 3) Do Nothing. To make a more informed determination of which solution is best for Roza the following investigations are recommended:
- Determine if it would be safe to open gates during overtopping flow and establish maximum overtopping depth at which gates could be raised.
- Determine if prolonged gate overtopping (several hours) would be allowable for the gate assembly.
These recommendations may require additional structural/mechanical analysis of the gates, and field tests of gate operation.
19
References Bureau of Reclamation. (1974). Design of Small Dams, 2nd Edition. Washington, D.C.: U.S.
Government Printing Office.
Bureau of Reclamation. (1987). Design of Small Canal Structures. Washington, D.C.: U.S. Government Printing Office.
Bureau of Reclamation. (n.d.). Designers' Operating Criteria for Roza Powerplant and Appurtenant Features. Yakima: Roza Division, Yakima Project.
Hornstein, S. M. (1960). Load Rejection Test - Study of Forebay Wave Action. Yakima: Bureau of Reclamation.
Owen, T. (1942). Developments in the Design of Low-Head Siphons and Diverging Chutes from Model Tests of Wasteway No. 2. Retrieved June 2014, from Bureau of Reclamation Hydraulic Investigations & Laboratory Services - publication index: http://www.usbr.gov/pmts/hydraulics_lab/pubs/HYD/HYD-108.pdf
U.S. Department of the Interior. (1997). Water Measurement Manual. Denver, Co: U.S. Government Printing Office.

20
APPENDIX A
Photos of the 2014 Field Test

21
Figure 12 Water discharging out of the siphon outlets immediately downstream from the radial gates. Visually, discharge appeared equal from all four siphons which seemed to become fully primed about the same time.
Figure 13 Forebay near the penstock intake just upstream from the siphons and radial gates (looking downstream) Siphons are activated and the water surface has been drawn down to just below the top of the radial gates.

22
Figure 14 Surge in the canal just downstream from the RID bifurcation. Canal flow is moving to the left and the transient wave is moving to the right.
Figure 15 Surge moving through the entrance to the RID bifurcation. Flow also overtopped the radial gates at the RID entrance as shown in the photo.
23
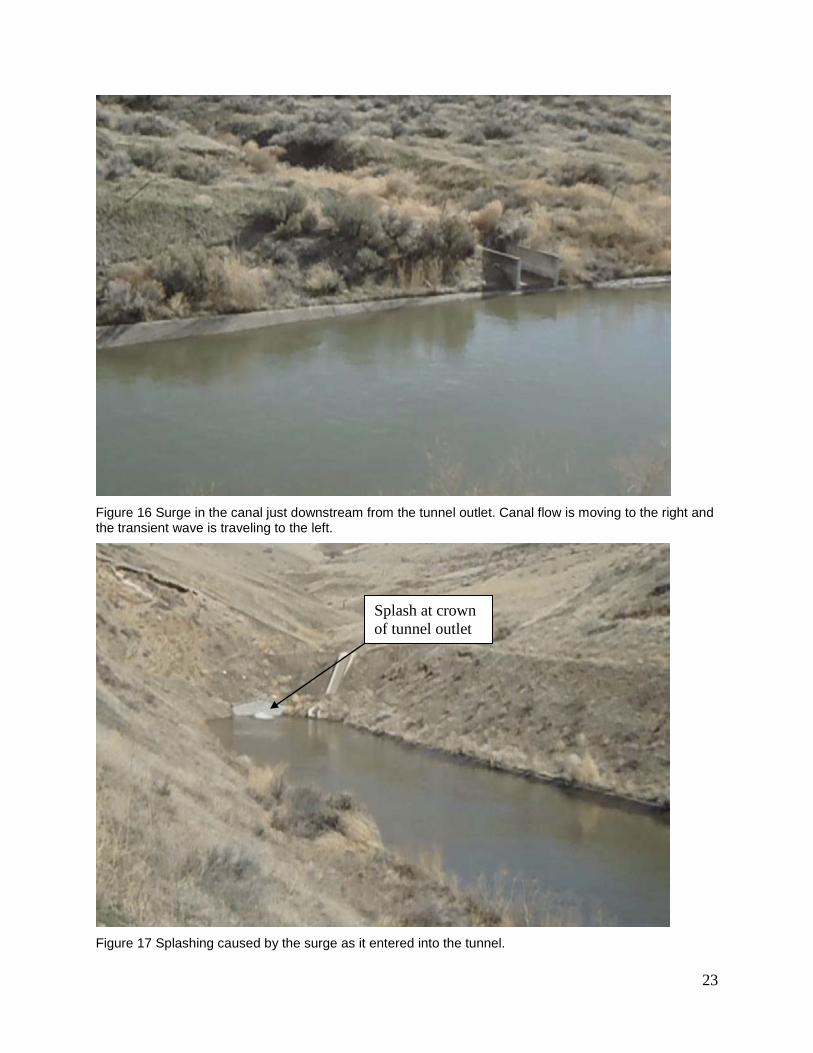
Figure 16 Surge in the canal just downstream from the tunnel outlet. Canal flow is moving to the right and the transient wave is traveling to the left.
Figure 17 Splashing caused by the surge as it entered into the tunnel.
Splash at crown of tunnel outlet

24
Figure 18 High water mark caused by the surge seen on the canal lining and tunnel outlet structure.
High water mark

25
APPENDIX B
Debris/Ice Sluiceway Flow Estimations

26
Table 7 Sluiceway flow estimations based on the number of stop log boards installed at the inlet and the forebay water surface elevation. Estimations were made using a standard suppressed rectangular weir equation.
# Stop Logs Weir El. WS El. H Q # Stop
Logs Weir El. WS El. H Q
- ft ft ft cfs - ft ft ft cfs
No Boards
1184.95 1186.50 1.55 270
1 Board
1185.31 1186.50 1.19 183 1184.95 1186.60 1.65 296 1185.31 1186.60 1.29 206 1184.95 1186.70 1.75 324 1185.31 1186.70 1.39 230 1184.95 1186.80 1.85 352 1185.31 1186.80 1.49 256 1184.95 1186.90 1.95 381 1185.31 1186.90 1.59 282 1184.95 1187.00 2.05 410 1185.31 1187.00 1.69 309 1184.95 1187.10 2.15 441 1185.31 1187.10 1.79 336 1184.95 1187.20 2.25 472 1185.31 1187.20 1.89 365 1184.95 1187.30 2.35 504 1185.31 1187.30 1.99 394 1184.95 1187.40 2.45 536 1185.31 1187.40 2.09 424 1184.95 1187.50 2.55 569 1185.31 1187.50 2.19 455 1184.95 1187.60 2.65 603 1185.31 1187.60 2.29 486 1184.95 1187.70 2.75 638 1185.31 1187.70 2.39 518
2 Boards
1186.02 1186.50 0.48 47
3 Boards
1186.73 1186.50 -0.23 1186.02 1186.60 0.58 63 1186.73 1186.60 -0.13 1186.02 1186.70 0.68 79 1186.73 1186.70 -0.03 1186.02 1186.80 0.78 97 1186.73 1186.80 0.07 3 1186.02 1186.90 0.88 116 1186.73 1186.90 0.17 10 1186.02 1187.00 0.98 137 1186.73 1187.00 0.27 20 1186.02 1187.10 1.08 158 1186.73 1187.10 0.37 32 1186.02 1187.20 1.18 180 1186.73 1187.20 0.47 46 1186.02 1187.30 1.28 204 1186.73 1187.30 0.57 61 1186.02 1187.40 1.38 228 1186.73 1187.40 0.67 78 1186.02 1187.50 1.48 253 1186.73 1187.50 0.77 95 1186.02 1187.60 1.58 279 1186.73 1187.60 0.87 114 1186.02 1187.70 1.68 306 1186.73 1187.70 0.97 135
4 Boards
1187.44 1186.50 -0.94
5 Boards
1188.15 1186.50 -1.65 1187.44 1186.60 -0.84 1188.15 1186.60 -1.55 1187.44 1186.70 -0.74 1188.15 1186.70 -1.45 1187.44 1186.80 -0.64 1188.15 1186.80 -1.35 1187.44 1186.90 -0.54 1188.15 1186.90 -1.25 1187.44 1187.00 -0.44 1188.15 1187.00 -1.15 1187.44 1187.10 -0.34 1188.15 1187.10 -1.05 1187.44 1187.20 -0.24 1188.15 1187.20 -0.95 1187.44 1187.30 -0.14 1188.15 1187.30 -0.85 1187.44 1187.40 -0.04 1188.15 1187.40 -0.75 1187.44 1187.50 0.06 2 1188.15 1187.50 -0.65 1187.44 1187.60 0.16 9 1188.15 1187.60 -0.55 1187.44 1187.70 0.26 19 1188.15 1187.70 -0.45

27
Figure 19 Plot of Forebay water surface elevation vs. sluiceway flow for different numbers of stoplog boards installed at the entrance. Data are tabulated in Table 7. Three boards would be required to hold the forebay elevation required for a normal operating condition.
Table 8 Steady-state estimations of forebay outflow with a combination of siphon, gate overtopping and sluiceway flows
Normal - Rated Normal - High Worst Case El. Top of Gates ft 1,186.80 1,186.80 1,186.80 El. Sluiceway Stoplogs ft 1,186.73 1,186.73 1,186.73 WS El. ft 1,187.42 1,187.48 1,187.56 Forebay Inflow cfs 1,065 1,080 1,100 Siphon Outflow cfs 950 950 950 Gate Overtopping Flow cfs 33 38 44 *Sluiceway Outflow cfs 82 92 106 Total Forebay Outflow cfs 1,065 1,080 1,100
Depth over Top of Gate ft 0.62 0.68 0.76 in 7.49 8.18 9.07
*Assuming 3 stoplog boards installed
1186.25
1186.50
1186.75
1187.00
1187.25
1187.50
1187.75
1188.00
0 100 200 300 400 500 600
Fore
bay
WS
El. (
ft)
Flow (cfs)
Rating Curve for Trash Sluiceway
No Boards
1 Board
2 Boards
3 Boards
4 Boards

28
Equation 2, a modified suppressed weir equation, used to estimate flow through the sluiceway. See Figure 23 and Reclamation’s Water Measurement Manual (U.S. Department of the Interior, 1997, pp. 7-33 - 7-34)
𝑄 = 𝐶𝑎𝐶𝑟𝐿𝑒ℎ𝑒1.5 (2)
Where: Q = discharge (ft3/s) Ca = correction factor for angle of the gate (-), 1.1 for stoplog angle of 62.7° Cr = correction factor for reduced flow due to poor approach flow conditions (-), 0.85
assuming a 15% reduction in flow. Le = effective crest length (ft) he = effective measurement head (ft)

29
APPENDIX C
Original Design Drawings

30
Figure 20 Drawing 33-D-1960 of Roza Powerplant forebay and spillway.

31
Figure 21 Drawing 33-D-1961 of emergency siphons.

32
Figure 22 Drawing of siphon and radial gates (drawing no. unknown) taken from the Roza Powerplant Designers’ Operating Criteria (Bureau of Reclamation).
33
Figure 23 Drawing of trash handling facility at the penstock and sluiceway entrance (drawing no. unknown) used for geometry to estimate flow through sluiceway. Taken from the Roza Powerplant Designers’ Operating Criteria (Bureau of Reclamation).