royal dsm - annual results 2013 › content › dam › dsm › corporate › en... · this...
TRANSCRIPT

Page
Royal DSM - Annual Results 2013
Feike Sijbesma - CEO / Chairman of the Managing Board Annual General Meeting of Shareholders, May 7 2014
Page
Safe harbor statement
This presentation may contain forward-looking statements with respect to DSM’s
future (financial) performance and position. Such statements are based on current
expectations, estimates and projections of DSM and information currently available to
the company. DSM cautions readers that such statements involve certain risks and
uncertainties that are difficult to predict and therefore it should be understood that
many factors can cause actual performance and position to differ materially from
these statements. DSM has no obligation to update the statements contained in this
presentation, unless required by law.
A more comprehensive discussion of the risk factors affecting DSM’s business can be
found in the company’s latest Annual Report, which can be found on the company's
corporate website, www.dsm.com
1

Page
Overview
2
• Financial Results 2013
• Building a higher value business
• Strategy
• Wrap-up
• 2014
Page
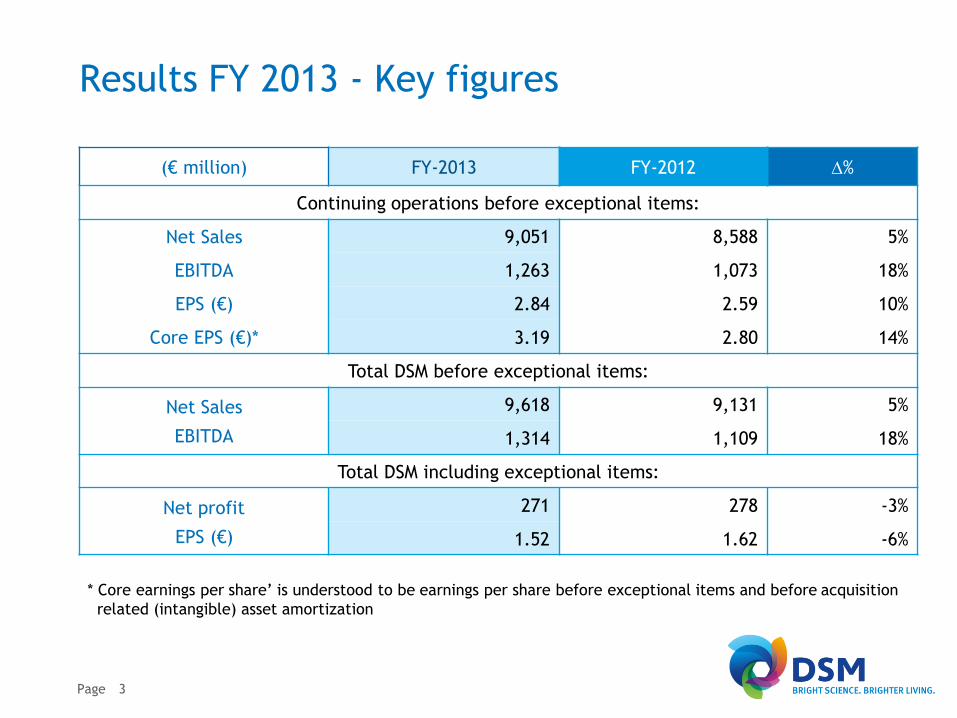
Results FY 2013 - Key figures
(€ million) FY-2013 FY-2012 D%
Continuing operations before exceptional items:
Net Sales
EBITDA
EPS (€)
Core EPS (€)*
9,051 8,588 5%
1,263 1,073 18%
2.84 2.59 10%
3.19 2.80 14%
Total DSM before exceptional items:
Net Sales
EBITDA
9,618 9,131 5%
1,314 1,109 18%
Total DSM including exceptional items:
Net profit
EPS (€)
271 278 -3%
1.52 1.62 -6%
3
* Core earnings per share’ is understood to be earnings per share before exceptional items and before acquisition
related (intangible) asset amortization
Page
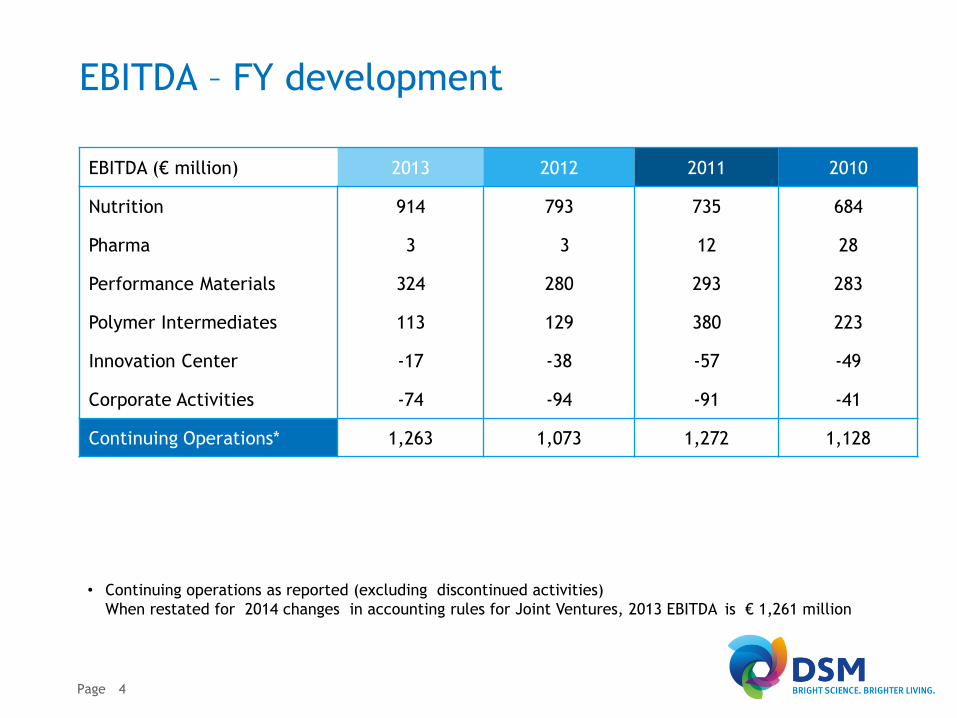
EBITDA – FY development
EBITDA (€ million) 2013 2012 2011 2010
Nutrition 914 793 735 684
Pharma 3 3 12 28
Performance Materials 324 280 293 283
Polymer Intermediates 113 129 380 223
Innovation Center -17 -38 -57 -49
Corporate Activities -74 -94 -91 -41
Continuing Operations* 1,263 1,073 1,272 1,128
4
• Continuing operations as reported (excluding discontinued activities)
When restated for 2014 changes in accounting rules for Joint Ventures, 2013 EBITDA is € 1,261 million

Page
Very good cash flow & healthy financial base
Cash Flow
(€ million) FY ’13 FY ’12
Cash from operating
activities 889 730
Cash from investing
activities* -1,188 -1,933
Free cash flow from
operations -299 -1,203
Balance sheet
(€ million) YE 2013 YE 2012
Net debt 1,862 1,668
Gearing 23% 22%
5
* Excl. changes in fixed-term deposits
Solid & flexible financial base: single A credit rating by Moody’s (A3), S&P (A)

Page
Dividend to increase for the 4th consecutive year
€ 0.50
€ 0.75
€ 1.00
€ 1.25
€ 1.50
€ 1.75
'04 '05 '06 '07 '08 '09 '10 '11 12 13
Dividend per ordinary share (€) • Dividend policy “stable and preferably rising”
• Proposal to AGM (May 2014) to increase dividend
by 10% from €1.50 to €1.65 per ordinary share
– € 0.50 interim dividend (paid in August 2013)
– € 1.15 final dividend (payable in June 2014)
• Payable in cash or ordinary shares at the option of
the shareholder
• Dividend in cash will be paid after deduction of
15% Dutch dividend withholding tax
• The ex-dividend date is 9 May 2014
6
Stable and preferably rising dividend; 4th consecutive increase

Page
Unrelated headwinds impacting Q4
• Unfavorable currency developments impacting margins and profit
• Lower prices in vitamin E, due to weak market conditions in H1 2013 and the threat
of a new entrant
• Weakness in US dietary supplements markets, with inventory adjustments in the
retail supply chain at end of 4th quarter, as reaction to negative publications
doubting certain positive effects of dietary supplements
• Declining US fish-oil based Omega-3 market, after years of strong growth.
Increased fish-oil costs in 2013 were passed through, leading to sharp increases in
retail prices. This, combined with the prevalence of multiple negative media
events, led to a volume decline of 10% in 2013
• Softness in Western food & beverages markets in recent years; consumers spent
less on food, impacting A-labels of our customers
7
Impact through end of year was more pronounced than anticipated

Page
Overview
8
• Financial Results 2013
• Building a higher value business
• Strategy
• Wrap-up
• 2014

Page
12%
4%
7%
2%
24%
3%7%
6%
9%
8%
7%
11%
Shift to higher quality earnings
Sales by end-market*
Food & Beverages
Pharma (Food)
Packaging
E&E
Textiles
Auto-
motive
Building &
Construction
Other
Infant nutrition
Dietary Supp.
Animal Feed
Personal
Care
0
500
1,000
1,500
2007 2009 2011 2013
PolymerIntermediates
PerformanceMaterials
Pharma
Nutrition
EBITDA (€ m)*
Majority of sales are now to end-markets with lower macro-dependency
• Excluding Innovation Center and Corporate Activities
Pharma: as from 2013, continuing operations only
9

Page
DSM has become truly global
High Growth
Economies
Rest
of World
North
America
Western
Europe
2013 Sales by destination*
41%
5%
34%
20%
2010
CSD
2013 2005
32%
41%
22%
Increase in % of sales to High Growth Economies*
41% of DSM’s sales* are now sold into High Growth Economies
* Sales from continuing operations
10
Page
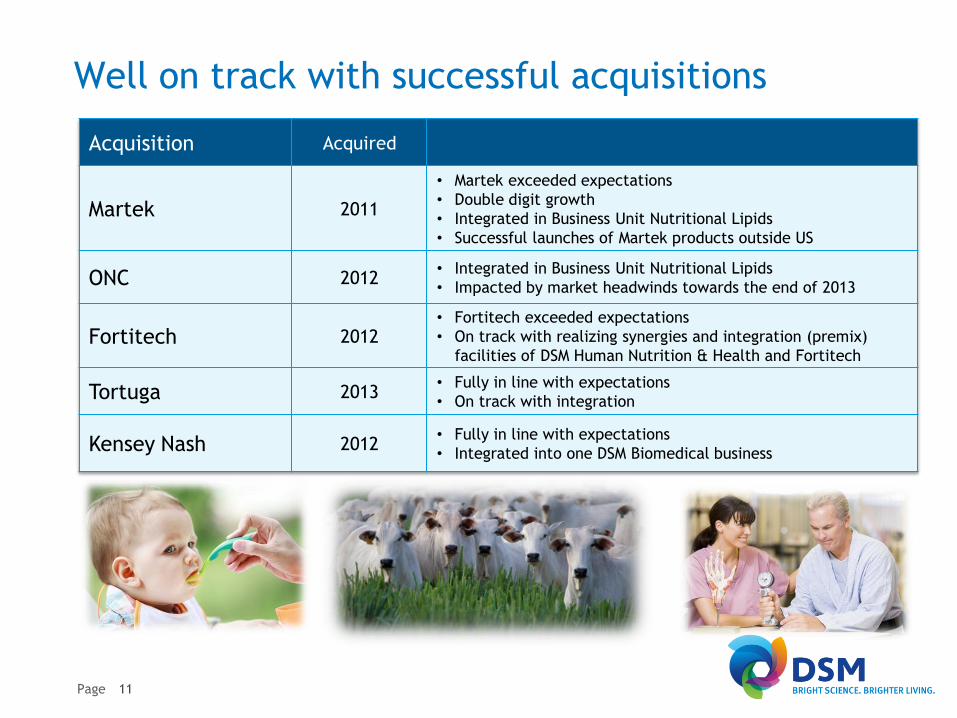
Well on track with successful acquisitions
Acquisition Acquired
Martek 2011
• Martek exceeded expectations
• Double digit growth
• Integrated in Business Unit Nutritional Lipids
• Successful launches of Martek products outside US
ONC 2012 • Integrated in Business Unit Nutritional Lipids
• Impacted by market headwinds towards the end of 2013
Fortitech 2012 • Fortitech exceeded expectations
• On track with realizing synergies and integration (premix)
facilities of DSM Human Nutrition & Health and Fortitech
Tortuga 2013 • Fully in line with expectations
• On track with integration
Kensey Nash 2012 • Fully in line with expectations
• Integrated into one DSM Biomedical business
11

Page
Innovation underpins further growth & profit
Innovation Sales (as % of total sales)
Innovation strongly contributes to DSM’s sales growth and EBITDA growth
with on average >5% higher gross margins
Maxarome® replacing salt,
reducing health risks, whilst
maintaining a good taste
Higher eco-efficiency and renewable content composite
resin Palapreg® a/o for bridges
12

Page
Three exciting growth platforms established
DSM Biomedical
Innovative materials that deliver more
advanced clinical procedures and
improved patient outcomes
DSM Bio-based Products & Services
Advanced Enzymes and Yeast
platforms: enabling Advanced Bio-
Energy and Bio-based chemicals
Smart coatings and surface technologies
to boost performance in the
solar industry
DSM Advanced Surfaces
DSM Bio-based Products & Services
Attractive end-markets growing by more than double GDP growth
13
Page
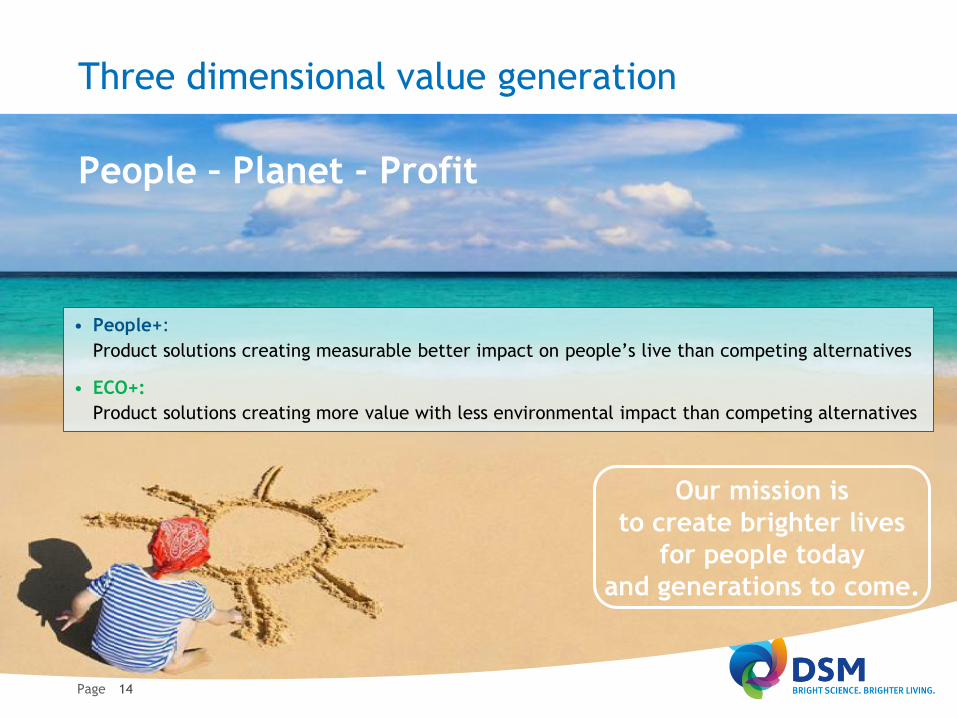
Our mission is
to create brighter lives
for people today
and generations to come.
• People+:
Product solutions creating measurable better impact on people’s live than competing alternatives
• ECO+:
Product solutions creating more value with less environmental impact than competing alternatives
People – Planet - Profit
Three dimensional value generation
14
Page
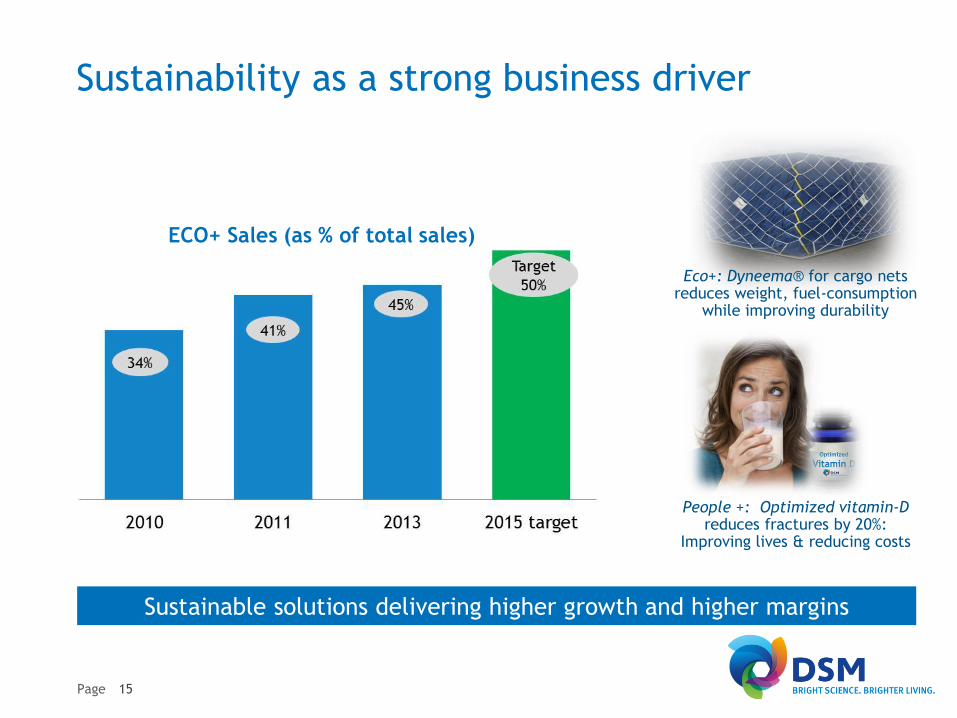
Sustainability as a strong business driver
Sustainable solutions delivering higher growth and higher margins
ECO+ Sales (as % of total sales)
People +: Optimized vitamin-D reduces fractures by 20%:
Improving lives & reducing costs
Eco+: Dyneema® for cargo nets reduces weight, fuel-consumption
while improving durability
15

Page
On track with sustainability aspirations
Sustainability aspirations 2011 – 2015 2013
Dow Jones
Sustainability Index Top ranking (“SAM Gold Class”) Gold class per 2014
Eco+ (innovation) at least 80% of pipeline is ECO+ >95%
Eco+ (running business) from ~34% towards 50% 45%
Energy efficiency 20% improvement in 2020,
compared to 2008 13% improvement
Greenhouse Gas
Emissions
-25% (absolute) by 2020,
compared to 2008 2013: 2% increase
Employee Engagement
Survey towards High Performance Norm 2013: 71% favorable
Diversity
People+
Women in executive positions 21%
DSM People LCA
2013: 11%
Draft framework in place
16

Page
Sustainable partnerships to combat malnutrition
Offering tailored nutritional solutions to fight hunger and
malnutrition around the world
• DSM - UN World Food Program partnership strengthened to
combat global malnutrition: double number of beneficiaries
to 30 million per year by 2015
• DSM is engaged in various nutrition partnerships, including:
Scaling Up Nutrition movement (SUN), US Agency for
International Development (USAID), Mercy Corps’ food cart
social enterprise KeBAL, World Vision International, Partner
for Food Solutions, etc
• DSM also supports healthier diets in the Western world by its
increasing awareness, innovations, etc.
People, Planet, Profit: We can’t be successful in a world that fails
17

Page
Overview
18
• Financial Results 2013
• Building a higher value business
• Strategy
• Wrap-up
• 2014

Driving growth by embracing global megatrends
Population growth
Wealth
Resources constraints
Sustainability
Urbanization Healthcare costs Energy security
Food security
Aging population
Materials Nutrition Health
Page 19
Global shiftsHealth & WellnessHealth & Wellness Climate & Energy

Page
DSM in motion: driving focused growth
20
Page
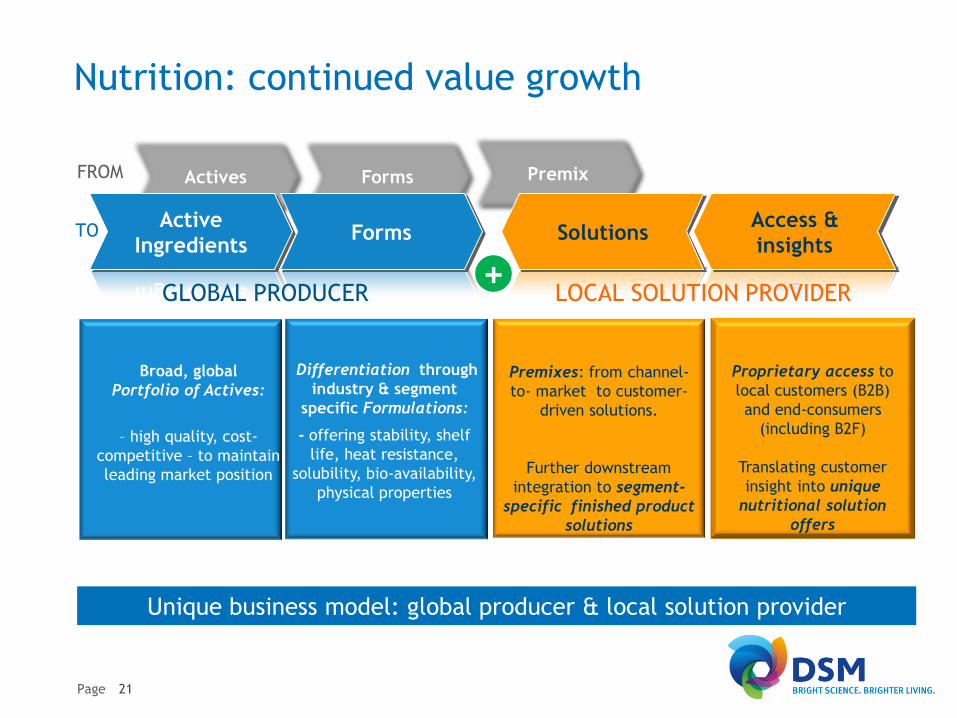
Forms Actives Premix
Nutrition: continued value growth
Forms Active
Ingredients Solutions
Access &
insights
GLOBAL PRODUCER LOCAL SOLUTION PROVIDER
Broad, global
Portfolio of Actives:
– high quality, cost-
competitive – to maintain
leading market position
Differentiation through
industry & segment
specific Formulations:
- offering stability, shelf
life, heat resistance,
solubility, bio-availability,
physical properties
Premixes: from channel-
to- market to customer-
driven solutions.
Further downstream
integration to segment-
specific finished product
solutions
Proprietary access to
local customers (B2B)
and end-consumers
(including B2F)
Translating customer
insight into unique
nutritional solution
offers
+
FROM
TO
Unique business model: global producer & local solution provider
21
Page
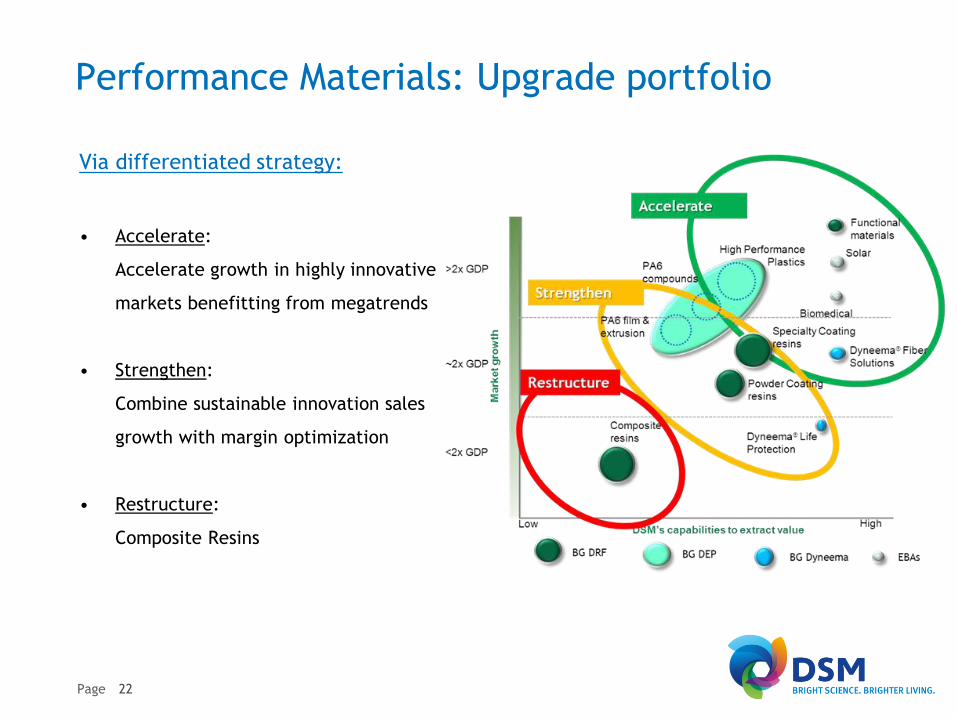
Performance Materials: Upgrade portfolio
Via differentiated strategy:
• Accelerate:
Accelerate growth in highly innovative
markets benefitting from megatrends
• Strengthen:
Combine sustainable innovation sales
growth with margin optimization
• Restructure:
Composite Resins
22
Page
Pharma and Polymer Intermediates
Partnership established in Pharmaceutical Products: DPx Holdings
• Combining DPP and Patheon is another successful step in DSM’s
strategy execution as well as an excellent value creation
opportunity:
independent stand alone company, of which DSM owns 49%
anticipated 2014 sales of about US$ 2bn (full year pro-forma)
unmatched combined offering compared to industry peers
• DSM and JLL will maximize the value of DPx
Partnership in anti-infectives: DSM Sinochem Pharmaceuticals
• Strategy of DSM Sinochem Pharmaceuticals is
strengthening the core, anti-infective API businesses
upgrading the portfolio attractiveness
stepping into formulations and finished dosages
Polymer Intermediates
• Continue to look for options to reduce the exposure
to the merchant Caprolactam markets
23

Page
2015 targets
Profit targets 2015
• EBITDA margin (%) 14% - 15%
• ROCE 11% - 12%
Sales target 2015
• Organic sales growth 5%-7% annually
• China sales towards US$ 3bn
• High Growth Economies sales about 45% of total sales
• Innovation sales 20% of total sales
• ECO+ sales towards 50% of total sales
Cluster targets 2015
• Nutrition EBITDA margin 20% - 23%
Sales growth GDP+2%
• Performance Materials EBITDA margin 13% - 15%
Sales growth at double GDP
24
Page
Overview
25
• Financial Results 2013
• Building a higher value business
• Strategy
• Wrap-up
• 2014

Page
Wrap-up 2013
• 2013 FY EBITDA substantially up to €1,314m (€1,261m continued activities)
• Strong cash generation operating activities in 2013 (€889m); solid financial base
• Dividend increase of 10% proposed to €1.65 per ordinary share
• Significant strategic progress & 2015 targets updated
• DPx partnership established
• Our strong progress is achieved against background of a challenging economic
environment and while facing a combination of unrelated headwinds
• Target 2014 to improve business performance to at least offset negative currency
impact
26

Page
Overview
27
• Financial Results 2013
• Building a higher value business
• Strategy
• Wrap-up
• 2014

Page
Highlights Q1 2014
28
DSM reports Q1 2014 results
• In Q1 2014 DSM delivered €272 million EBITDA from continuing operations, in line
with expectations
• Q1 2014 EBITDA from continuing operations was €29 million below Q1 2013, of which
about €23 million was due to adverse exchange rate developments
• The impact of the headwinds in Nutrition appear to have peaked in Q1
• In Performance Materials all business groups delivered good volume growth
• DSM maintains 2014 outlook, anticipating EBITDA improvements over the coming
quarters
