rotary club of charlotte
TRANSCRIPT

Economic opportunity: A Charlotte-Mecklenburg Perspective
Owen Furuseth, PhD, Associate Provost, Metropolitan Studies and Extended Academic Programs, UNC Charlotte
Presentation to the Rotary Club of Charlotte
October 27, 2015

Charlotte-Mecklenburg is a great place to live and work

But… ranked last in upward mobility

About the Chetty study
• What are the chances for a child succeeding, independently of family status and the environment where she grows up? (inter-generational mobility)
• Sample: children born 1980-1982
• Child and parent pairs coded by 741 commuting zones
• Compared adult children’s positions on the national income distribution with their parents’

0 10 20 30 40 50 60 70 80 90 100
Kansas City
Charlotte Raleigh Atlanta
Portland
Minneapolis
Salt Lake City
Income percentile
How do children from below-median income families fare by adulthood?
Data source: Equality of Opportunity Project, 2014

Upward mobility is especially low across the south and parts of the rust belt
Data source: Equality of Opportunity Project, 2014
Average income percentile of children whose parents were in the 25th percentile

Land of Opportunity: Community characteristics affect opportunity for all
•Segregation • Income inequality •Quality of school system •Social capital •Family structure

Segregation
People separated from other people and living far from where they work

Charlotte-Mecklenburg is racially segregated
Segregation

…and economically segregated
9th of large metros in segregation of the wealthy, college-educated, and working class
Segregation
Data source: U.S. Census Bureau, 2013 American Community Survey

Income Inequality
How equally is income distributed across the community

One fifth of households made more than half the income
3% 8%
13%
22%
53%
Bottom Second Middle Fourth Top
$ 30.5 billion of income was generated in Mecklenburg in 2013. How was it divided among the income quintiles?
Income Inequality
$24,000 $43,000 $67,000 $115,000
Data source: U.S. Census Bureau, 2013 American Community Survey

Many households would fall into poverty after 3 months without income
21%
51% 56%
28%
White African American Hispanic/Latino Asian
Asset poverty rate
Income Inequality
Data source: Estimates calculated by Compass Economics; published in CFED’s Assets & Opportunity Profile, 2012

Quality of School System
Differences in mobility emerge when children are relatively young

47% of CMS 3rd graders were proficient on end of grade reading tests.
For economically disadvantaged students, 29% were proficient.
Quality of School System
Less than half of CMS 3rd graders read on grade level
Data source: North Carolina Department of Instruction, 2012-13

Social Capital
People connected to each other and civic institutions
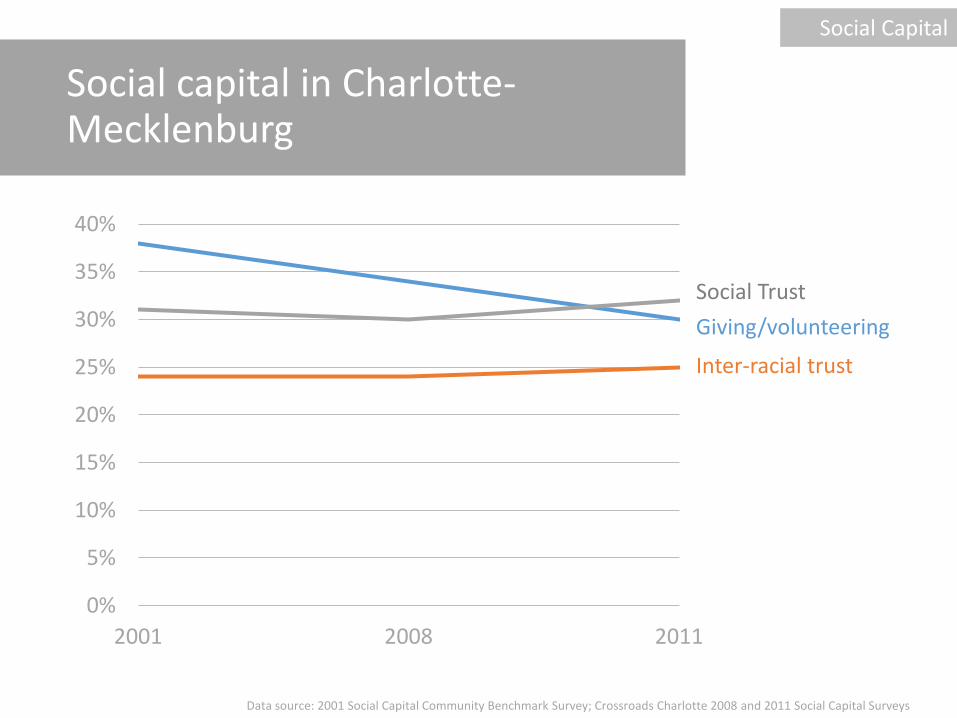
Social capital in Charlotte-Mecklenburg
0%
5%
10%
15%
20%
25%
30%
35%
40%
2001 2008 2011
Social Capital
Social Trust
Giving/volunteering
Inter-racial trust
Data source: 2001 Social Capital Community Benchmark Survey; Crossroads Charlotte 2008 and 2011 Social Capital Surveys

Family Structure
Single parent households experience greater mobility
challenges, which then extend into the community

It’s hard for single-parent families to make ends meet
Monthly expenses for a family of 3
Housing $793
Food $361
Childcare $1,339
Healthcare $343
Transportation $377
Other necessities $296
Taxes (payroll and income) $547
Total $4,057
Annual total $48,680
Hourly wage needed $23
Family Structure
Data source: NC Budget and Tax Center, Living Income Standard 2014

47,000 single-parent households in Mecklenburg.
38% of households with children are single-parent, up from 31% in 2000.
Family Structure
Data source: U.S. Census Bureau, 2013 American Community Survey
Single-parent households are growing

What is our future?

• Spring 2015-Community Task Force Appointed
• Mecklenburg County City of Charlotte Foundation for the Carolinas
• Beginning June 2015 • Deep and widespread conversations • Best practices and lessons learned • Systemic solutions • Sustainable-long term actions • Community-wide perspective
• www.oportunitycharmeck.org
• #opportunityCLT
Economic opportunity: A Charlotte-Mecklenburg Perspective
Presentation is available at:
www.mseap.uncc.edu/presentations